Large Language Models Meet Knowledge Graphs to
Answer Factoid Questions
Abstract
Recently, it has been shown that the incorporation of structured knowledge into Large Language Models significantly improves the results for a variety of NLP tasks. In this paper, we propose a method for exploring pre-trained Text-to-Text Language Models enriched with additional information from Knowledge Graphs for answering factoid questions. More specifically, we propose an algorithm for subgraphs extraction from a Knowledge Graph based on question entities and answer candidates. Then, we procure easily interpreted information with Transformer-based models through the linearization of the extracted subgraphs. Final re-ranking of the answer candidates with the extracted information boosts Hits@1 scores of the pre-trained text-to-text language models by .
1 Introduction
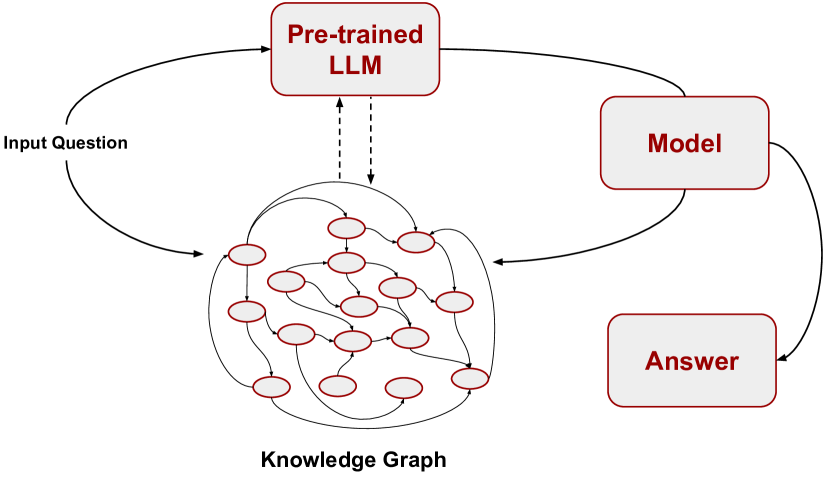
Answering factoid questions without access to a Knowledge Graph (KG) can be challenging. The corresponding answers to these factoid questions refer to an invented or assumed statement presented as a fact, or a true but brief or trivial item of news or information. While language models can provide answers Sen et al. (2022); Dubey et al. (2019), the quality may not be optimal. Therefore, the base approach for this task relies on a structured knowledge source, such as DBPedia Auer et al. (2007), Wikidata Vrandečić and Krötzsch (2014), or NELL Mitchell et al. (2018). Given a natural language question and a corresponding KG, the goal is to predict the answer based on the analysis of the question in the context of KG. An example of how KGs could be used for answering factoid questions is presented in Figure 1.
It has been shown that incorporation of the KG information into Large Language Models (LLM) significantly improves the results for various NLP tasks Zhang et al. (2020). At the same time, state-of-the-art Knowledge Graph Question Answering (KGQA) systems perform poorly on complex datasets Sen et al. (2022).
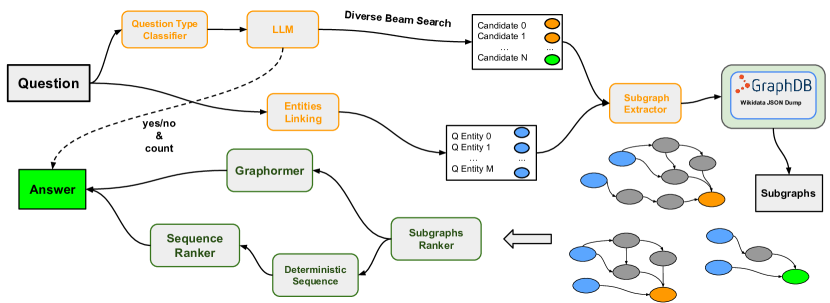
In this paper, we propose a new method for KGQA based on retrieving and ranking subgraphs containing candidate answers. First, we generate answer candidates with an LLM and extract entities from the initial question. Then, using a structured knowledge base, Wikidata, we construct the subgraphs containing those question entities and generated answer candidates. Finally, we rank these subgraphs using the linearization of the subgraphs and raw subgraphs themselves via Transformer Encoder models. The overall pipeline can be seen in Figure 2. This approach is similar to how we browse knowledge bases such as Wikipedia or Wikidata when searching for information. Using the relevant part of the massive knowledge base graph, we “walk" from the question entities to the potential answer and determine whether the potential answer is plausible by observing connections between them.
Our contributions are as follows:
-
1.
We propose a new method for KGQA by expanding and ranking answer candidates returned by a pre-trained sequence-to-sequence language model using question entities’ neighbourhood.
-
2.
We present an algorithm for extraction of subgraphs corresponding to candidate answers and their subsequent ranking using Transformer Encoders.
We also publish the code, the fine-tuned models, and the subgraphs dataset on GitHub111https://github.com/s-nlp/subgraph_kgqa.
2 Related Work
There exist two main approaches to KGQA: semantic parsing (translating the question to an executable logical form) and retrieval-based methods (infer answers from a Knowledge Graph). Chakraborty et al. (2021); Lan et al. (2021); Pereira et al. (2022); Zhang et al. (2021) provide a detailed overview of both research directions. Therefore, we focus our attention on recent works that are 1) related to our approach or 2) trained and validated on the Mintaka dataset – our chosen complex dataset.
To start with, many retrieval KGQA methods solve the task by extracting subgraphs or neighbors based on question analysis. Then, the correct answer is chosen by searching the candidates within these subgraphs or neighbors Sun et al. (2019). For example, Wang et al. (2023) present an inference chain-based model which calculates the importance of different inference chains for the question. Other models compare entity embeddings from KG with question embeddings Saxena et al. (2020) or entity embeddings extracted from the question Razzhigaev et al. (2023). Some papers present entity type prediction methods where questions are transformed into templates specifying the entity types in the input question Cui et al. (2019) or the answer type Perevalov and Both (2020).
Considering the KGQA approaches to compare with, we consider the models tested on Mintaka Sen et al. (2022). The first one, KVMemNet Miller et al. (2016), operates a symbolic memory structured as key-value pairs, which gives the model a greater flexibility for encoding knowledge sources. EmbedKGQA Saxena et al. (2020) has three modules: Question Embedding Module, Knowledge Embedding Module, and Answer Selection Module; the latter selects the final answer based on the first two modules. Rigel Saffari et al. (2021) is an end-to-end QA approach which makes use of RoBERTa for embedding questions and performs both entity resolution and multi-hop inference.
The approach by Wang et al. (2022) also captures semantic relatedness between the questions and the paths from the knowledge base. The authors extract all paths between topic entities in similar questions and answers from the train set, and rank those paths according to their lengths. They implement an Interactive Convolutional Neural Network and score answer candidates in relation to question and paths features. Another relevant model is GreaseLM Zhang et al. (2022), where authors fuse encoded representations from a pre-trained Transformer Encoder and a Graph Neural Network over multiple layers of modality interaction operations. The process involves obtaining a subgraph of entities that are related to the question and then reducing it to a maximum of 200 entities. This reduction is based on a relevance score that takes into account the similarity of the embeddings. In contrast to the aforementioned approaches, our model generates candidates with LLMs and incorporates graph information into Transformers by graph linearization, which is described in 3.3 in more detail.
2.1 Dataset
For our research, we focus on the Mintaka Sen et al. (2022) dataset, which is a large-scale, complex and natural dataset, that can be used for end-to-end question-answering models, composed of question-answer pairs. This dataset is annotated with Wikidata entities and comprises 8 types of complex questions. These types include:
-
•
Count (e.g., Q: How many astronauts have been elected to Congress? A: 4).
-
•
Comparative (e.g., Q: Is Mont Blanc taller than Mount Rainier? A: Yes)
-
•
Superlative (e.g., Q: Who was the youngest tribute in the Hunger Games? A: Rue)
-
•
Ordinal (e.g., Q: Who was the last Ptolemaic ruler of Egypt? A: Cleopatra)
-
•
Multi-hop (e.g., Q: Who was the quarterback of the team that won Super Bowl 50? A: Peyton Manning)
-
•
Intersection (e.g., Q: Which movie was directed by Denis Villeneuve and stars Timothee Chalamet? A: Dune)
-
•
Difference (e.g., Q: Which Mario Kart game did Yoshi not appear in? A: Mario Kart Live: Home Circuit)
-
•
Yes/No (e.g., Q: Has Lady Gaga ever made a song with Ariana Grande? A: Yes)
-
•
Generic (e.g., Q: Where was Michael Phelps born? A: Baltimore, Maryland)
Our research methodology centers around predicting entities as answers, with a particular emphasis on superlative, comparative, intersection, and multi-hop questions. However, we still compute and evaluate the results based on the complete Mintaka dataset, as our pipeline allows processing any type of questions and yes/no and count questions receive special treatment described in detail in Section 4.1.
We also compile and publish222https://github.com/s-nlp/subgraph_kgqa the dataset of subgraphs for the whole Mintaka dataset (for train, validation, and test splits separately). Subgraphs are collected using the pipeline presented above: we generate candidate answers, we take the true answer and the entities from the question entity neighbors as candidates, and construct subgraphs with Algorithm 1. As a result, we construct a “correct” subgraph containing the correct highlighted answer and several “incorrect” subgraphs from the incorrect candidate answers generated by the model. We present two versions of the dataset with subgraphs: with candidates generated by T5-Large-SSM and by T5-XL-SSM models.
3 Proposed Approach
We hypothesize that subgraphs containing paths from question entities to answer candidates provide valuable information for selecting the correct answer. Moreover, LLMs may predict an incorrect answer while still be able to generate an correct one among top candidates. Thus, we generate a pool of answer candidates using a pre-trained Text-to-Text Language Model. With each answer candidate, we extract the corresponding subgraph and re-rank them based on analysis of these extracted subgraphs. Language Model generates a string as an answer, and we use Wikidata API333API URI: https://www.wikidata.org/w/api.php, method: ’wbsearchentities’ to link it to the corresponding Wikidata entity.
Our first task (Subsections 3.1-3.2) is to construct subgraphs for each question-answer candidate pair by combining the path of the question entities to the current answer candidate. The paths from question entities to answer candidates are extracted from our chosen knowledge base, Wikidata. Our second objective is to rank the candidate answers using the extracted subgraphs. To do this, we compare two approaches: a Transformer-based Encoder which uses a linearized graph with a highlighted answer candidate 3.3-3.4 and a graph Transformer model (Graphormer) 3.4.
3.1 Expansion of Generated Candidates
Although most LLM approaches for QA, such as the one presented by Sen et al. (2022), typically use Greed Search and evaluate the top-1 answer, it is important to note that the correct answer may not always be the top candidate. For example, the fine-tuned T5-XL-SSM Roberts et al. (2020) model achieved higher Mean Reciprocal Rank (MRR) scores for our task, indicating that re-ranking could improve the top-1 results. However, even when using Classical Beam Search, the output is often minor variations of a single sequence, which may not generate enough unique answer candidates for the Question Answering task.
To solve the problem, we apply Diverse Beam Search Vijayakumar et al. (2018), which produces a larger number of candidates and generates them with higher variance. Diverse Beam Search is formulated as follows:
| (1) | ||||
The formula involves splitting the set of beams at time into disjointed subsets , and then selecting the candidate with the highest diversity penalty, which is calculated as the sum of a diversity penalty function over all candidates in the subset. Additionally, a dissimilarity term is included, which is calculated as the sum of a dissimilarity function over all previous subsets up to time . The dissimilarity term is weighted by a parameter . This formula is used to optimize the selection of answer candidates in a computationally efficient manner.
3.2 Subgraph Construction Algorithm
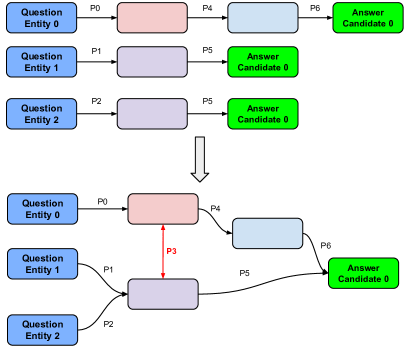
For each question-answer candidate pair, the desired subgraph is mathematically defined as an induced subgraph of the Wikidata KG. Thus, given our shortest paths from , where - entity extracted from question and - Answer. We can use the following Algorithm 1 to extract . Let us define as the set of all distinct nodes within our shortest paths . We want to preserve all edges between the nodes within . For all question-answer pairs, our objective is to retain the relationship between our question entities and answer candidate entity . The process is schematically depicted at Figure 3.
3.3 Graph Linearization for Sequence Ranking
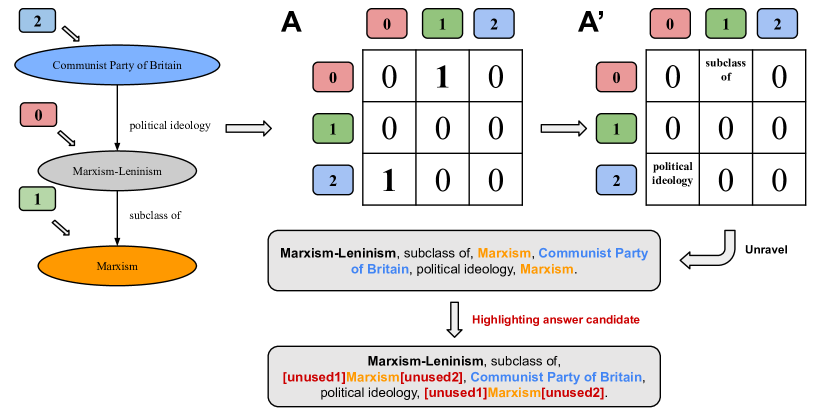
To rank the extracted subgraphs, we represent the subgraphs as linearized natural language sequences, as depicted in Figure 4. Firstly, to linearize, we convert the subgraph into its binary adjacency matrix representation, . Given nodes in the subgraph, the resulting matrix’s dimension will be . The element of the matrix represents the existence of an edge between node with index to node with index . Then, we replace the edges in the matrix with the edge label and call it . Lastly, to produce our final sequence, we unravel row by row and add the triple (node_from, edge, node_to) on to our final sequence. Algorithm 2 summarizes the aforementioned steps.
As a result of our analysis, we discover that 12.8% of subgraphs in the test split of the dataset contain the correct answer but are not identified as potential candidates. To address this issue, we emphasize the answer candidate entities. To achieve this, we include special tokens before and after the answer candidate’s label in the final linearized sequence, as shown in Figure 4.
3.4 Ranker Models
With our extracted subgraphs for each respective question-answer pair, we seek to classify and re-rank to boost the original Hits@1 scores. To achieve our objective, we test two graph-based approaches: the Transformer Encoder based approach using the linearized representation of the subgrahs and the Graphormer model using raw subgraphs. For both methods, we train a regression model with Mean Square Error (MSE) loss. We assume that such models will be able to rank the “correct” subgraphs (graphs including the correct answer candidate) higher than the “incorrect” subgraphs (graphs including the incorrect answer candidate).
Linearized Sequence Ranker
For the first and main approach of our linearized sequence representation, we utilize two BERT-like models: MPNet-base444https://huggingface.co/sentence-transformers/all-mpnet-base-v2 Song et al. (2020) and DistilBERT-base Sanh et al. (2019). As input data, we provide Question + [SEP] + Linearized subgraph with the highlighted candidate entity using [SEP] tokens, as it can be seen in Figure 4.
Graphormer Ranker
As an alternative to the linearized subgraphs, we utilize the raw subgraphs to rank our respective answer candidates. Thus, we perform graph ranking experiments using Graphormer Ying et al. (2021) – a transformer-based neural network specifically designed for graphs. We employ the graphormer-base-pcqm4mv2555https://huggingface.co/clefourrier/graphormer-base-pcqm4mv2 model. As input data, we encode the structural information of our subgraphs (natively in NetworkX666https://networkx.org/). These structural encoding include centrality (in/out degrees), spatial (shortest path between node matrices), and edge encoding in the attention. Unlike our linearized sequences approach, the original questions are not used.
4 Experimental Design
In this section, we discuss the experimental setup of our approach, which includes 1) the base Sequence-to-Sequence model used for answer candidates generation and 2) dataset used to verify the efficacy of our hypothesis and approach.
We introduced the additional components for pieline - Question Type Classifier and Extraction of Entities from Questions.
4.1 Question Type Classifier
Factoid questions can sometimes have answers that cannot be linked to an entity in knowledge bases (count and yes/no questions). In order to handle this edge case, we first train a classifier to categorize questions into three types: yes/no, count, and other. For this classification task, we use the MPNet (all-mpnet-base-v2) Song et al. (2020) model with CrossEntropy loss. We perform epochs on the Mintaka train split, with a batch size of , warm-up steps of , weight decay of , and learning rate of . To fit the train data to the model, we employ the HuggingFace basic Trainer and add a Weighted Random Sampler.
This pipeline demonstrates 98.29% balanced accuracy on Mintaka test split. With the predicted yes/no and count questions, we simply take the generated top-1 answer candidate by the pre-trained Text-to-Text Language Model. With the predicted Other questions, we process according to the pipeline in Figure 2.
4.2 Extraction of Entities from Questions
With the list of answer candidates, we shift our focus to extracting the list of question entities. At this step of the pipeline, any Entity Linker like mGENRE Cao et al. (2021) could be applied. However, in order to evaluate the approach of subgraph generation and re-ranking which are the main contribution to the task, during training and evaluation we use gold entities provided by Mintaka.
Model Hits@1 LANGUAGE MODELS T5-Large-SSM Sen et al. (2022) 0.28 T5-Large-SSM (Re-implemented) 0.25 T5-XL-SSM Sen et al. (2022) 0.38 T5-XL-SSM (Re-implemented) 0.32 ChatGPT (GPT 3.5-turbo-0301) 0.33 KGQA MODELS KVMemNet Miller et al. (2016) 0.12 EmbedKGQA Saxena et al. (2020) 0.18 Rigel Saffari et al. (2021) 0.20 OUR APPROACH WITH SUBGRAPHS AND RE-RANKING T5-Large-SSM (Re-implemented) + Linearization + MPNet 0.29 T5-Large-SSM (Re-implemented) + Linearization + DistilBERT 0.27 T5-Large-SSM (Re-implemented) + Graphormer 0.25 T5-XL-SSM (Re-implemented) + Linearization + MPNet 0.38 T5-XL-SSM (Re-implemented) + Linearization + DistilBERT 0.37 T5-XL-SSM (Re-implemented) + Graphormer 0.32
4.3 Base Model
As the first step of our approach, we fine-tune the T5-SSM models Roberts et al. (2020) (Large and XL) on English questions for 10,000 steps, following Sen et al. (2022). This model was reported as the state-of-the-art for the Mintaka dataset. Although we attempted to adhere to the Sen et al. (2022) model’s fine-tuning protocol, there were certain aspects that were overlooked, which makes it unfeasible to replicate the outcome. Despite our efforts, we were unable to replicate the results as claimed in Sen et al. (2022). Thus, in the final Table 1, we provide their results and ours as re-implemented. We used Hits@1 metric for comparing our approach with others because it is a famous metric for KGQA task and many other authors Sen et al. (2022); Diefenbach et al. (2017) used only this one metric, making it easier to compare results. Additionally, we developed a KGQA system and were interested in getting the final answer, not a list of candidates that include the answer on some position. Therefore, the primary contribution of our work is the enhancement in quality compared to our re-implemented model.
With the best fine-tuned T5-SSM-XL Roberts et al. (2020) model, we generate our answer candidates pool for subgraph extraction and ranking. However, it can be replaced with any other model for candidates generation.
5 Results and Discussion
In the following section, we present the results for the proposed approach in comparison with several baselines. Table 1 shows that the results for the re-implemented T5-models are significantly improved with our suggested approach: 4% for the large model and 6% for the XL model. We also note the increase in quality can be achieved with any Encoder, however, MPNet performs slightly better than DistilBERT-base. As our re-implemented T5-models results are significantly lower than presented in the paper (Hits@1 is equal to and for large and XL models), we do not outperform the reported state-of-the-art, but perform on par with it. Application of our approach to the version trained by Sen et al. (2022) should boost the scores even more.
Our second approach using Graphormer ranking with solely the raw subgraphs does not improve the results of an LLM. We hypothesize that re-ranking only operates on structural encodings of our subgraphs, which results in a subpar performance. Without information from the question and a potential answer, the subgraphs cannot provide a complete and coherent representation of the question-answer pair.
Additionally, we evaluate another popular large language model — ChatGPT with the following prompt before each question: ‘‘Answer as briefly as possible. The answer should be ’Yes’, ’No’ or a number if I am asking for a quantity of something, if possible, otherwise just a few words.’’ The result of ChatGPT can be comparable to our fine-tuned T5-XL-SSM, with Hits@1 scores of and respectively. However, they significantly lag behind our proposed approach, as shown in the final Table 1.
5.1 Question Type Analysis
In order to understand the efficacy of the proposed approach, we calculate scores for each question type in the dataset, which were described in Section 2.1. The results in Table 2 are based on the best-performing base model and re-ranker (T5-XL-SMM + T5-Large-SSM (Re-implemented) + Linearization + MPNet). We exclude questions that do not have answers with the corresponding Wikidata entity (yes/no and count), as the precision scores remain the same for these question types. For all other ComplexityType types of this dataset, our re-ranker successfully bolsters the Hits@1 scores.
ComplexityType Original Re-ranked Hits@All Intersection 0.36 0.53 0.68 Count 0.25 0.25 0.94 Comparative 0.50 0.55 0.96 Yesno 0.62 0.62 1.00 Generic 0.34 0.35 0.65 Ordinal 0.21 0.22 0.59 Multihop 0.14 0.18 0.45 Difference 0.14 0.36 0.45 Superlative 0.28 0.41 0.55 All 0.32 0.38 0.69
Upon further inspection, the largest increase in accuracy (from Hit@1 0.32 to 0.38) is for the Intersection type of questions (i.e. “What game was released by Impressions Games and is an expansion to Pharaoh?”). We hypothesize that the answer of these Intersection question is connected to all question entities. Thus, the extracted subgraphs contain more meaningful information, representative of the relationship between our question answer pair. Additionally, Multi-hop and Difference questions also display a significant increase in scores. Despite having a minute boost in other question types, the proposed approach still aids in performance in all categories. Overall, one may argue that the re-ranker performs better with complex questions.
5.2 Extracted Subgraphs Analysis
As shown previously, our proposed approach generally improves Hits@1 scores for all question types. We hypothesize that geometry of the extracted subgraphs aided in the improved Hits@1 scores. Thus, to further understand the reasoning behind this performance boost, we examine the difference between the extracted subgraphs of the correct and incorrect question-answer pairs. We assume that “incorrect” subgraphs tend to be denser (more nodes and edges); while the “correct” subgraphs tend to be sparser (fewer nodes and edges). We also assume that this information could be useful for our Graphomer ranking approach. Despite having no information regarding the question, we hypothesize that our pipeline picked up these differences between the “correct” vs. “incorrect” subgraphs via the structural encodings. To verify this hypothesis, we collect different graph metrics for further analysis.
Complexity Metrics “Correct” Subgraphs “Incorrect” Subgraphs Number of Nodes 2.98 3.14 Number of Edges 3.31 3.64 Density 0.61 0.63 Number of Simple Cycles 1.04 1.18 Number of Bridges 2.96 3.10
Table 3 displays the average of the number of nodes, edges, density, simple cycles (elementary circuits), and bridges (isthmus) for the “incorrect” and “correct” subgraphs. We analyze these metrics on our subgraph dataset of 13,491 “correct” subgraphs and 94,615 “incorrect” subgraphs; which excludes yes/no and count question types.
The above table confirms our hypothesis that “incorrect” subgraphs have higher density, larger number of nodes, edges, simple cycles and bridges. This might partially explain why the ranker can differentiate the “correct” subgraphs from the “incorrect” subgraphs. Overall, we hypothesize that the geometry of the subgraphs themselves contributes to the boost of our final Hits@1 score.
5.3 Ablation study
In this section, our objective is to determine the most crucial component of the proposed ranking model. To achieve this, we employ the best performing model and train and evaluate it, removing certain parts of the pipeline.
First, we disable the highlighting feature and observe that the Hits@1 score on the Mintaka test part drops from to . Second, we examine the significance of the proposed subgraph extraction approach. We train another ranking model that ranks candidates without subgraphs. As input, we provide only a question and a candidate label to the MPNet ranker model in the following format: . The results show a Hits@1 score of , which clearly indicates that the large contribution of the subgraph information to the final score.
All in all, eliminating both parts of the input for the ranking model drastically decreases the results. Candidate highlighting as well as subgraphs are necessary for choosing the correct candidate answer.
5.4 Limitations
The main limitation of the proposed system is that it is tested on the English language only. Mintaka possesses suites in other languages and our approach should definitely be evaluated on them. Moreover, while Mintaka has proved to be a new challenging dataset with various types of questions, it would be interesting to test our approach on other datasets, such as LC-QuAD 2.0 Dubey et al. (2019) and RuBQ 2.0 Rybin et al. (2021). Furthermore, we have not proofed the full pipeline performance as we do not embed an Entity Linker and test our model on gold question entities and have not tested other Generative Transformers.
In terms of computational efficiency, communication with a Knowledge Graph can be a bottleneck, as it might be time-consuming for generating subgraphs from a KB for all 200 answer candidates.
6 Conclusion
To sum up, in this paper we have proposed an approach for improving the output of LLMs for Question Answering using additional information from Knowledge Graphs. We have improved Hits@1 by to % by extracting subgraphs relevant to the input question entities and the predicted answer candidates; and further ranking the answer candidates by the extracted subgraphs. Our result analysis shows that the suggested solution improves scores for the Intersection questions and has almost no effect on Comparative questions. The ablation study proves the efficiency of each pipeline step. As future work, we plan to extend our approach to other languages and test the full pipeline with entity linker and other generative Transformer models.
Acknowledgements
The work of Irina Nikishina was supported by the DFG through the project “ACQuA: Answering Comparative Questions with Arguments” (grants BI 1544/7- 1 and HA 5851/2- 1) as part of the priority program “RATIO: Robust Argumentation Machines” (SPP 1999). The work of Valentin Malykh was supported by a grant for research centers in the field of artificial intelligence, provided by the Analytical Center for the Government of the Russian Federation in accordance with the subsidy agreement (agreement identifier 000000D730321P5Q0002) and the agreement with the Ivannikov Institute for System Programming of the Russian Academy of Sciences dated November 2, 2021 No. 70-2021-00142.
References
- Auer et al. (2007) Sören Auer, Christian Bizer, Georgi Kobilarov, Jens Lehmann, Richard Cyganiak, and Zachary Ives. 2007. Dbpedia: A nucleus for a web of open data. The Semantic Web, page 722–735.
- Cao et al. (2021) Nicola De Cao, Ledell Wu, Kashyap Popat, Mikel Artetxe, Naman Goyal, Mikhail Plekhanov, Luke Zettlemoyer, Nicola Cancedda, Sebastian Riedel, and Fabio Petroni. 2021. Multilingual autoregressive entity linking.
- Chakraborty et al. (2021) Nilesh Chakraborty, Denis Lukovnikov, Gaurav Maheshwari, Priyansh Trivedi, Jens Lehmann, and Asja Fischer. 2021. Introduction to neural network-based question answering over knowledge graphs. WIREs Data Mining Knowl. Discov., 11(3).
- Cui et al. (2019) Wanyun Cui, Yanghua Xiao, Haixun Wang, Yangqiu Song, Seung-won Hwang, and Wei Wang. 2019. KBQA: learning question answering over QA corpora and knowledge bases. CoRR, abs/1903.02419.
- Diefenbach et al. (2017) Dennis Diefenbach, Thomas Pellissier Tanon, Kamal Deep Singh, and Pierre Maret. 2017. Question answering benchmarks for wikidata. In Proceedings of the ISWC 2017 Posters & Demonstrations and Industry Tracks co-located with 16th International Semantic Web Conference (ISWC 2017), Vienna, Austria, October 23rd - to - 25th, 2017.
- Dubey et al. (2019) Mohnish Dubey, Debayan Banerjee, Abdelrahman Abdelkawi, and Jens Lehmann. 2019. Lc-quad 2.0: A large dataset for complex question answering over wikidata and dbpedia. In The Semantic Web - ISWC 2019 - 18th International Semantic Web Conference, Auckland, New Zealand, October 26-30, 2019, Proceedings, Part II, volume 11779 of Lecture Notes in Computer Science, pages 69–78. Springer.
- Lan et al. (2021) Yunshi Lan, Gaole He, Jinhao Jiang, Jing Jiang, Wayne Xin Zhao, and Ji-Rong Wen. 2021. A survey on complex knowledge base question answering: Methods, challenges and solutions. In Proceedings of the Thirtieth International Joint Conference on Artificial Intelligence, IJCAI-21, pages 4483–4491. International Joint Conferences on Artificial Intelligence Organization. Survey Track.
- Miller et al. (2016) Alexander Miller, Adam Fisch, Jesse Dodge, Amir-Hossein Karimi, Antoine Bordes, and Jason Weston. 2016. Key-value memory networks for directly reading documents. In Proceedings of the 2016 Conference on Empirical Methods in Natural Language Processing, pages 1400–1409, Austin, Texas. Association for Computational Linguistics.
- Mitchell et al. (2018) T. Mitchell, W. Cohen, E. Hruschka, P. Talukdar, B. Yang, J. Betteridge, A. Carlson, B. Dalvi, M. Gardner, B. Kisiel, J. Krishnamurthy, N. Lao, K. Mazaitis, T. Mohamed, N. Nakashole, E. Platanios, A. Ritter, M. Samadi, B. Settles, R. Wang, D. Wijaya, A. Gupta, X. Chen, A. Saparov, M. Greaves, and J. Welling. 2018. Never-ending learning. Commun. ACM, 61(5):103–115.
- Pereira et al. (2022) Arnaldo Pereira, Alina Trifan, Rui Pedro Lopes, and José Luís Oliveira. 2022. Systematic review of question answering over knowledge bases. IET Softw., 16(1):1–13.
- Perevalov and Both (2020) Aleksandr Perevalov and Andreas Both. 2020. Augmentation-based answer type classification of the SMART dataset. In Proceedings of the SeMantic AnsweR Type prediction task (SMART) at ISWC 2020 Semantic Web Challenge co-located with the 19th International Semantic Web Conference (ISWC 2020), Virtual Conference, November 5th, 2020, volume 2774 of CEUR Workshop Proceedings, pages 1–9. CEUR-WS.org.
- Razzhigaev et al. (2023) Anton Razzhigaev, Mikhail Salnikov, Valentin Malykh, Pavel Braslavski, and Alexander Panchenko. 2023. A system for answering simple questions in multiple languages. In Proceedings of the 61st Annual Meeting of the Association for Computational Linguistics (Volume 3: System Demonstrations), pages 524–537, Toronto, Canada. Association for Computational Linguistics.
- Roberts et al. (2020) Adam Roberts, Colin Raffel, and Noam Shazeer. 2020. How much knowledge can you pack into the parameters of a language model? In Proceedings of the 2020 Conference on Empirical Methods in Natural Language Processing, EMNLP 2020, Online, November 16-20, 2020, pages 5418–5426. Association for Computational Linguistics.
- Rybin et al. (2021) Ivan Rybin, Vladislav Korablinov, Pavel Efimov, and Pavel Braslavski. 2021. Rubq 2.0: An innovated russian question answering dataset. In The Semantic Web - 18th International Conference, ESWC 2021, Virtual Event, June 6-10, 2021, Proceedings, volume 12731 of Lecture Notes in Computer Science, pages 532–547. Springer.
- Saffari et al. (2021) Amir Saffari, Armin Oliya, Priyanka Sen, and Tom Ayoola. 2021. End-to-end entity resolution and question answering using differentiable knowledge graphs. In Proceedings of the 2021 Conference on Empirical Methods in Natural Language Processing, pages 4193–4200, Online and Punta Cana, Dominican Republic. Association for Computational Linguistics.
- Sanh et al. (2019) Victor Sanh, Lysandre Debut, Julien Chaumond, and Thomas Wolf. 2019. Distilbert, a distilled version of BERT: smaller, faster, cheaper and lighter. CoRR, abs/1910.01108.
- Saxena et al. (2020) Apoorv Saxena, Aditay Tripathi, and Partha Talukdar. 2020. Improving multi-hop question answering over knowledge graphs using knowledge base embeddings. In Proceedings of the 58th Annual Meeting of the Association for Computational Linguistics, pages 4498–4507, Online. Association for Computational Linguistics.
- Sen et al. (2022) Priyanka Sen, Alham Fikri Aji, and Amir Saffari. 2022. Mintaka: A complex, natural, and multilingual dataset for end-to-end question answering. In Proceedings of the 29th International Conference on Computational Linguistics, pages 1604–1619, Gyeongju, Republic of Korea. International Committee on Computational Linguistics.
- Song et al. (2020) Kaitao Song, Xu Tan, Tao Qin, Jianfeng Lu, and Tie-Yan Liu. 2020. Mpnet: Masked and permuted pre-training for language understanding. In Advances in Neural Information Processing Systems 33: Annual Conference on Neural Information Processing Systems 2020, NeurIPS 2020, December 6-12, 2020, virtual.
- Sun et al. (2019) Haitian Sun, Tania Bedrax-Weiss, and William Cohen. 2019. PullNet: Open domain question answering with iterative retrieval on knowledge bases and text. In Proceedings of the 2019 Conference on Empirical Methods in Natural Language Processing and the 9th International Joint Conference on Natural Language Processing (EMNLP-IJCNLP), pages 2380–2390, Hong Kong, China. Association for Computational Linguistics.
- Vijayakumar et al. (2018) Ashwin K Vijayakumar, Michael Cogswell, Ramprasath R. Selvaraju, Qing Sun, Stefan Lee, David Crandall, and Dhruv Batra. 2018. Diverse beam search: Decoding diverse solutions from neural sequence models.
- Vrandečić and Krötzsch (2014) Denny Vrandečić and Markus Krötzsch. 2014. Wikidata: A free collaborative knowledgebase. Commun. ACM, 57(10):78–85.
- Wang et al. (2022) Jingchao Wang, Weimin Li, Yixing Guo, and Xiaokang Zhou. 2022. Path-aware multi-hop question answering over knowledge graph embedding. In 2022 IEEE 34th International Conference on Tools with Artificial Intelligence (ICTAI), pages 459–466.
- Wang et al. (2023) Jingchao Wang, Weimin Li, Fangfang Liu, Bin Sheng, Wei Liu, and Qun Jin. 2023. Hic-kgqa: Improving multi-hop question answering over knowledge graph via hypergraph and inference chain. Knowledge-Based Systems, page 110810.
- Ying et al. (2021) Chengxuan Ying, Tianle Cai, Shengjie Luo, Shuxin Zheng, Guolin Ke, Di He, Yanming Shen, and Tie-Yan Liu. 2021. Do transformers really perform badly for graph representation? In Advances in Neural Information Processing Systems 34: Annual Conference on Neural Information Processing Systems 2021, NeurIPS 2021, December 6-14, 2021, virtual, pages 28877–28888.
- Zhang et al. (2021) Chen Zhang, Yuxuan Lai, Yansong Feng, and Dongyan Zhao. 2021. A review of deep learning in question answering over knowledge bases. AI Open, 2:205–215.
- Zhang et al. (2022) Xikun Zhang, Antoine Bosselut, Michihiro Yasunaga, Hongyu Ren, Percy Liang, Christopher D. Manning, and Jure Leskovec. 2022. Greaselm: Graph reasoning enhanced language models for question answering. CoRR, abs/2201.08860.
- Zhang et al. (2020) Zhiyuan Zhang, Xiaoqian Liu, Yi Zhang, Qi Su, Xu Sun, and Bin He. 2020. Pretrain-kge: Learning knowledge representation from pretrained language models. In Findings of the Association for Computational Linguistics: EMNLP 2020, Online Event, 16-20 November 2020, volume EMNLP 2020 of Findings of ACL, pages 259–266. Association for Computational Linguistics.