OOD Aware Supervised Contrastive Learning
Supplementary Materials
1 Introduction
These supplementary materials serve as additional empirical evaluation supporting the main results in the paper. First we report the OOD performance of our method using a different architecture as a backbone, Section 2. We then experiment with combining both real and fake OOD data, Section 3. We continue our analysis of ID/OOD features visualization, Section 4. Section 5 explores the OOD detection performance when other datasets are deployed for the auxiliary OOD training.
| Dataset/\LongunderstackMethod | |
|---|---|
| Metrics | \LongunderstackCE |
| FPR AUROC AUPR |
& \LongunderstackPSupCon FPR AUROC AUPR \LongunderstackCE + Energy FPR AUROC AUPR \LongunderstackPSupCon + Energy FPR AUROC AUPR \LongunderstackOPSupCon-R FPR AUROC AUPR \LongunderstackOPSupCon-P FPR AUROC AUPR DTD 18.17 95.83 98.79 14.70 97.06 99.30 5.33 98.74 99.73 7.22 98.57 99.70 10.81 98.13 99.60 16.52 96.85 99.28
SVHN 2.27 99.44 99.89 3.41 99.35 99.87 1.83 99.46 99.89 0.66 99.81 99.96 2.66 99.42 99.88 3.48 99.33 99.87
Places365 24.80 94.45 98.59 23.46 95.61 98.97 17.84 95.54 98.78 18.96 96.01 98.99 19.17 96.17 99.09 20.14 96.06 99.06
LSUN-C 2.09 99.37 99.88 0.24 99.89 99.98 1.47 99.44 99.89 1.95 99.30 99.86 0.21 99.87 99.97 0.23 99.89 99.98
LSUN-R 3.58 99.05 99.81 1.69 99.59 99.92 4.60 99.03 99.80 4.96 98.90 99.78 2.68 99.40 99.88 1.80 99.55 99.91
iSUN 4.19 99.00 99.80 1.62 99.59 99.92 3.90 99.13 99.82 5.12 98.94 99.79 2.42 99.41 99.88 1.89 99.51 99.91
iNaturalist 16.24 96.83 99.33 7.98 98.47 99.69 9.66 97.73 99.49 7.40 98.56 99.70 7.94 98.50 99.70 8.94 98.36 99.67
CIFAR-100 37.77 92.03 98.03 40.61 93.14 98.52 31.30 92.87 98.12 34.92 93.54 98.56 36.57 93.71 98.65 39.69 93.24 98.55
Mnist 26.13 96.41 99.31 7.16 98.54 99.72 19.62 96.87 99.38 12.93 97.68 99.55 5.78 98.82 99.77 5.97 98.77 99.76
TIN 28.25 93.56 98.30 28.19 94.25 98.60 22.80 94.64 98.58 22.15 94.85 98.70 25.20 94.96 98.77 26.20 94.82 98.74
Average 16.35 96.60 99.17 12.90 97.55 99.45 11.83 97.34 99.35 11.63 97.62 99.46 11.35 97.84 99.52 12.49 97.64 99.47
| Dataset/\LongunderstackMethod | |
|---|---|
| Metrics | \LongunderstackCE |
| FPR AUROC AUPR |
& \LongunderstackPSupCon FPR AUROC AUPR \LongunderstackCE + Energy FPR AUROC AUPR \LongunderstackPSupCon + Energy FPR AUROC AUPR \LongunderstackOPSupCon-R FPR AUROC AUPR \LongunderstackOPSupCon-P FPR AUROC AUPR DTD 80.46 78.22 94.77 74.07 67.48 88.46 59.08 87.97 97.30 68.14 85.36 96.77 64.1 79.33 94.43 65.32 72.88 90.77
SVHN 52.41 90.56 97.99 85.39 75.30 94.30 27.71 95.27 99.01 11.65 97.70 99.48 63.7 87.12 97.24 92.15 72.65 93.76
Places365 81.49 77.14 94.26 86.33 71.97 92.78 77.81 79.87 95.08 81.15 77.89 94.58 75.96 77.41 94.30 81.04 75.39 93.74
LSUN-C 53.08 90.69 98.04 21.22 96.03 99.14 41.72 93.15 98.57 85.58 76.54 94.66 8.21 98.34 99.65 4.67 99.01 99.79
LSUN-R 64.18 87.64 97.33 70.37 82.85 96.12 43.11 92.16 98.27 37.73 93.38 98.59 19.43 96.35 99.21 21.14 95.83 99.07
iSUN 68.13 86.33 97.03 67.91 82.61 95.93 49.27 90.47 97.90 38.40 93.06 98.51 22.72 95.09 98.88 22.00 94.95 98.80
iNaturalist 85.66 76.57 94.44 42.80 90.18 97.68 78.25 82.48 96.06 68.61 85.25 96.73 34.62 92.30 98.21 34.72 91.83 98.00
CIFAR-10 72.06 82.53 95.87 86.64 72.06 92.30 76.78 79.90 95.12 89.16 69.95 91.83 87.34 69.53 91.22 88.46 70.19 91.94
Mnist 94.79 68.66 92.88 99.81 44.98 85.08 93.76 73.31 94.12 95.28 63.57 91.15 8.58 98.50 99.70 50.05 90.75 98.06
TIN 74.05 80.81 95.08 77.25 78.64 94.61 70.95 82.96 95.61 75.48 80.26 95.04 67.50 82.05 95.41 74.2 79.73 94.78
Average 72.63 81.91 95.77 71.18 76.21 93.64 61.84 85.75 96.71 65.12 82.29 95.73 45.21 87.60 96.82 53.37 84.32 95.87
| Dataset/\LongunderstackMethod | |
|---|---|
| Metrics | \LongunderstackOPSupCon-R |
| MSP | |
| FPR AUROC AUPR |
& \LongunderstackOPSupCon-R Energy FPR AUROC AUPR \LongunderstackOPSupCon-R Maximum logit FPR AUROC AUPR \LongunderstackOPSupCon-P MSP FPR AUROC AUPR \LongunderstackOPSupCon-P Energy FPR AUROC AUPR \LongunderstackOPSupCon-P Maximum logit FPR AUROC AUPR DTD 7.74 98.58 99.72 6.33 98.84 99.75 4.95 99.04 99.80 17.60 97.01 99.39 17.33 96.42 99.16 16.57 96.69 99.22
SVHN 2.40 99.38 99.88 0.43 99.87 99.97 0.85 99.75 99.95 2.71 99.21 99.84 2.38 99.56 99.91 5.41 98.46 99.70
Places365 21.19 95.82 98.99 24.40 95.09 98.78 21.17 95.63 98.91 22.75 95.51 98.94 27.24 94.96 98.81 14.48 96.76 99.21
LSUN-C 2.87 99.18 99.84 1.65 99.58 99.92 1.33 99.60 99.92 4.19 98.89 99.79 2.27 99.47 99.89 2.39 99.34 99.87
LSUN-R 8.85 98.35 99.68 9.92 98.13 99.63 9.52 98.16 99.64 9.34 98.19 99.64 7.93 98.48 99.70 6.62 98.57 99.72
iSUN 8.49 98.40 99.68 6.91 98.58 99.72 7.71 98.40 99.69 10.81 98.01 99.61 7.03 98.65 99.73 7.24 98.52 99.70
iNaturalist 15.45 97.36 99.48 9.06 98.38 99.68 9.87 98.11 99.63 20.34 96.58 99.32 10.91 98.13 99.62 12.48 97.70 99.53
CIFAR-100 33.88 93.77 98.60 40.79 92.06 98.12 36.04 93.15 98.41 36.08 93.39 98.56 47.67 91.06 97.97 36.42 93.25 98.51
Mnist 13.20 97.87 99.58 0.75 99.78 99.96 2.79 99.42 99.89 13.73 97.74 99.56 0.55 99.70 99.94 8.10 98.55 99.72
TIN 26.91 94.17 98.56 30.29 93.23 98.25 25.83 94.39 98.61 28.38 94.03 98.56 33.22 93.17 98.29 25.55 94.61 98.64
Average 14.09 97.29 99.40 13.05 97.35 99.38 12.01 97.56 99.44 16.59 96.86 99.32 15.65 96.96 99.30 13.52 97.24 99.38
2 Another Backbone
In order to have a fair comparison with previous work, in the main paper we show results with a ResNet18 backbone. Here we investigate the effect of changing the backbone to a larger network, namely ResNet50.
Similar to the main experiments in the main paper, models are trained for 500 epochs. We notice that with ResNet50 our method requires less number of epochs for finetuning. For OPSupCon-R and OPSupCon-P, we finetune PSupCon for 25 and 10 epochs on DTD [cimpoi2014describing] and pseudo OOD features respectively. We observe that the performance improves over PSupCon from the very first epochs of finetuning.
Tables 1 and 1 follow the same trend as the results reported in the main paper for different models. This suggests that our proposed method is robust to changes in the feature extractor. Especially, on the more challenging CIFAR-100 [krizhevsky2009learning] dataset, our method improves over Energy finetuning [liu2020energy] with a large margin, for both auxiliary (OPSupCon-R) and pseudo (OPSupCon-P) OOD training: 7% reduction in FPR and 16% reduction in FPR respectively.
3 Mixed OPSupCon
| Method | Metric | DTD |
SVHN |
Places365 |
CIFAR-100 |
MNIST |
TIN |
Average |
|---|---|---|---|---|---|---|---|---|
| \LongunderstackOPSupCon R | FPR | 8.27 | 3.27 | 21.98 | 43.70 | 6.46 | 33.12 | 19.46 |
| AUROC | 98.48 | 99.26 | 95.37 | 91.20 | 98.58 | 93.40 | 96.04 | |
| AUPR | 99.68 | 99.85 | 98.83 | 97.87 | 99.72 | 98.36 | 99.05 | |
| \LongunderstackOPSupCon P | FPR | 18.65 | 4.88 | 25.02 | 46.43 | 4.48 | 34.23 | 22.28 |
| AUROC | 96.11 | 99.0 | 95.00 | 90.48 | 98.97 | 93.16 | 95.45 | |
| AUPR | 99.07 | 99.80 | 98.79 | 97.78 | 99.80 | 98.30 | 98.92 | |
| \LongunderstackOPSupCon M | FPR | 8.22 | 2.51 | 20.34 | 43.21 | 4.95 | 31.48 | 18.45 |
| AUROC | 98.49 | 99.40 | 95.65 | 91.30 | 98.92 | 93.58 | 96.22 | |
| AUPR | 99.68 | 99.88 | 98.88 | 97.89 | 99.78 | 98.38 | 99.08 |
In the main paper, we show that in case OOD data cannot be gathered or synthetically generated, pseudo OOD data can be generated using a simple mixup of the ID features of different classes. Here, we further evaluate the performance of our method when generating OOD training data by combining real OOD features (Textures dataset, DTD) with pseudo OOD features. We use our complete loss to finetune PSupCon with such data and name this model as OPSupCon-M (as for Mixed-OOD). Table 3 reports the performance of our method when leveraging different types of OOD data. Combining real auxiliary OOD with pseudo OOD adds a further boost and robustness to the OOD detection performance.
4 Encoder Features Analysis
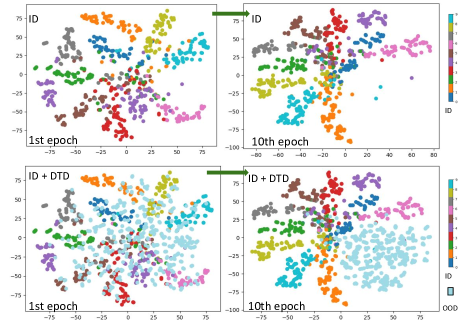
In the main paper, we analyze the features of ID, auxiliary and pseudo OOD samples with a t-SNE 2D projection. However, we only compared ID and OOD features before starting the finetuning process with our method. Here, we analyze those features after finetuning with our method. We consider a ResNet18 model trained for 100 epochs on Cifar-10 dataset. We train our OPSupCon-R and OPSupCon-P for 10 epochs.
Figure 1 visualizes the 2D projections of ID features and auxiliary OOD features from DTD datasets at the beginning and at the end of the finetuning process for OPSupCon-R. We see that features from the OOD dataset are initially projected quite close to the ID features of Cifar-10 dataset which makes the OOD detection difficult. After the model is finetuned, the OOD features from DTD dataset are projected into a cluster clearly separate from the ID features. This results in a significant improvements on the OOD detection performance.
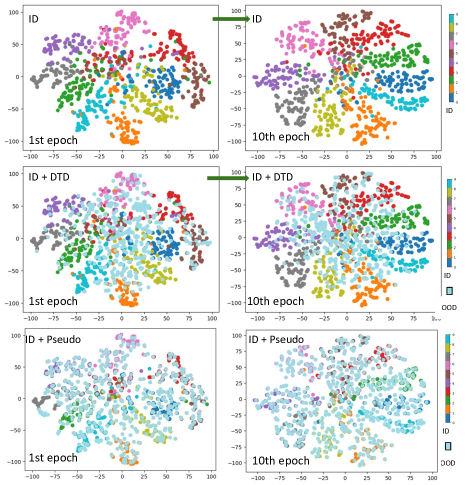
Figure 2 visualizes the t-SNE 2D projection of ID features, real OOD features from DTD and the generated pseudo OOD features both at the beginning and at the last epoch of the training for OPSupCon-P. We can draw the following observations on the results of fientuning with OPSupCon-P:
-
•
The ID features clusters are more compact with a lesser of an overlap (middle of the plot).
-
•
The OOD features of DTD are pushed further away from the dense areas of ID clusters in spite of not being trained explicitly on those features.
-
•
The pseudo generated features get more difficult to distinguish from ID data as we proceed with the training.
Indeed the pseudo generated features act as a regularization to the ID features pushing samples of the same class to be closer together and further from other classes samples. As pseudo OOD samples are generated on the fly, while ID clusters get more compact, it gets more difficult for the model to distinguish them from the actual ID data. This is due to the fact that pseudo OOD features become more and more similar to those of ID dataset as the training goes on. Consequently, we observed that training OPSupCon-P for a few epochs is enough to achieve a good OOD performance while training for a large number of epochs might have a negative effect instead.
5 Effect of the choice of Auxiliary OOD Data
| Method | Metric | DTD |
SVHN |
Places365 |
CIFAR-100 |
MNIST |
TIN |
Average |
|---|---|---|---|---|---|---|---|---|
| \LongunderstackPSupCon | FPR | 20.44 | 5.32 | 26.38 | 47.62 | 5.34 | 35.60 | 23.45 |
| AUROC | 96.04 | 98.99 | 94.85 | 90.47 | 98.81 | 92.92 | 95.34 | |
| AUPR | 99.09 | 99.80 | 98.75 | 97.27 | 94.81 | 98.00 | 97.95 | |
| \LongunderstackDTD | FPR | 8.27 | 3.27 | 21.98 | 43.70 | 6.46 | 33.12 | 19.46 |
| AUROC | 98.48 | 99.26 | 95.37 | 91.20 | 98.58 | 93.40 | 96.04 | |
| AUPR | 99.68 | 99.85 | 98.83 | 97.87 | 99.72 | 98.36 | 99.21 | |
| \LongunderstackTIN | FPR | 19.81 | 2.53 | 25.82 | 47.19 | 1.93 | 33.53 | 21.80 |
| AUROC | 96.66 | 99.43 | 95.11 | 91.14 | 99.55 | 94.03 | 95.98 | |
| AUPR | 99.30 | 99.89 | 98.86 | 97.99 | 99.91 | 98.67 | 99.10 |
In the main paper, we consider DTD (textures) dataset for training OPSupCon-R. This section investigates the effect of selecting another OOD dataset on the performance.
Here we test OPSupCon-R with TinyImagenet (TIN) [le2015tiny] dataset which combines 200 different object categories and is similar in nature to CIFAR datasets. Table 5 summarises the OOD detection performance of our model trained on different OOD datasets for CIFAR-10 as the ID task.
We observe that training with TIN dataset improves the OOD detection performance over plain PSupCon on all datasets. However, training with DTD results in a better OOD detection performance as this is a generic dataset and does not represent specific objects. It is worth noting that this is a beneficial property as a similar dataset to DTD can be easily generated synthetically .
6 Choice of the scoring function
In the main paper, we consider Maximum Logit [hendrycks2019scaling] as our scoring function. This section investigates the effect of selecting two other commonly used scoring functions namely Maximum Softmax Probability [hendrycks2016baseline] and (Sum) Energy [liu2020energy] score for detecting OOD examples.
We observe that on average Maximum Logit score achieves the best OOD detection performance for both OPSupCon-R and OPSupCon-P models. This is due to the fact that the maximum logit measures the distance to the class prototypes which is the metric being optimized during OOD training in our method.
7 Comparison with SSD [sehwag2021ssd]
We compare our method against various state-of-the-art works in tables 3 and 4 of the main paper and show OPSupCon-R performs the best compared to methods from different lines of literature.
We notice that OPSupCon-R achieves an overall lower performance on FPR and AUROC metrics for the CIFAR-100 dataset comapred to the self-supervised method proposed in [sehwag2021ssd]. This is mainly due to the performance gap on the SVHN dataset. Our method achieves better results on the majority of the other datasets.
In this section, we extensively compare our method to SSD with the settings defined in section 4.1 of the main paper. This is the optimal default setting for both OPSupCon-P and SSD [sehwag2021ssd]. Besides, we evaluate the performance on a larger number of datasets here.
As shown in tables 7 and 7, OPSupCon-P outperforms SSD on the large majority of the datasets achieving a much better average on all metrics. Therefore, we confirm that the slightly better overall performance of SSD on table 4 of the main paper is justified by the smaller number of evaluated datasets and SSD’s superior performance on the SVHN dataset.
| Dataset/\LongunderstackMethod | |
|---|---|
| Metrics | \LongunderstackOPSupCon-R |
| FPR AUROC AUPR |
& \LongunderstackOPSupCon-p FPR AUROC AUPR \LongunderstackSSD SupCon FPR AUROC AUPR DTD 4.95 99.04 99.80 16.57 96.69 99.22 10.01 98.29 97.00
SVHN 0.85 99.75 99.95 5.41 98.46 99.70 0.41 99.89 99.96
Places365 21.17 95.63 98.91 14.48 96.76 99.21 28.62 94.46 99.77
LSUN-C 1.33 99.60 99.92 2.39 99.34 99.87 6.76 98.57 98.21
LSUN-R 9.52 98.16 99.64 6.62 98.57 99.72 68.61 90.44 84.28
iSUN 7.71 98.40 99.69 7.24 98.52 99.70 69.98 89.51 82.24
iNaturalist 9.87 98.11 99.63 12.48 97.70 99.53 37.18 94.63 92.86
CIFAR-100 36.04 93.15 98.41 36.42 93.25 98.51 43.03 91.60 90.70
Mnist 2.79 99.42 99.89 8.10 98.55 99.72 13.11 98.04 97.72
TIN 25.83 94.39 98.61 25.55 94.61 98.64 34.62 92.62 92.20
Average 12.01 97.56 99.44 13.52 97.24 99.38 31.23 94.80 93.49
| Dataset/\LongunderstackMethod | |
|---|---|
| Metrics | \LongunderstackOPSupCon-R |
| FPR AUROC AUPR |
& \LongunderstackOPSupCon-p FPR AUROC AUPR \LongunderstackSSD SupCon FPR AUROC AUPR DTD 51.22 88.44 97.28 54.23 84.77 95.89 50.19 90.79 83.24
SVHN 44.26 92.39 98.39 49.49 90.89 98.04 11.77 97.87 99.17
Places365 74.52 79.30 94.79 74.45 79.71 94.95 79.30 76.64 98.86
LSUN-C 20.38 96.48 99.27 18.10 96.71 99.30 42.34 93.53 91.62
LSUN-R 38.54 93.01 98.49 37.85 92.78 98.43 84.85 81.57 74.13
iSUN 46.45 91.33 98.13 46.38 90.82 97.97 86.46 80.52 70.54
iNaturalist 47.71 89.87 97.63 45.38 89.97 97.64 73.87 82.44 78.91
CIFAR-10 84.74 71.01 91.50 84.08 73.11 92.73 87.24 69.82 66.21
Mnist 33.89 94.38 98.83 33.78 94.37 98.83 55.20 89.09 87.09
TIN 68.0 82.67 95.52 69.23 82.12 95.44 74.91 80.19 77.33
Average 50.97 87.89 96.98 51.29 87.53 96.92 63.71 84.24 82.71