The AstroSat UV Deep Field North: Direct determination of the UV Luminosity Function and its evolution from z 0.8 – 0.4
Abstract
We characterise the evolution of the rest-frame 1500 Å UV luminosity Function (UVLF) from AstroSat/UVIT F154W and N242W imaging in the Great Observatories Origins Survey North (GOODS-N) field. With deep FUV observations, we construct the UVLF for galaxies at z and subsequently characterise it with a Schechter function fit. The fitted parameters are consistent with previous determinations. With deep NUV observations, we are able to construct the UVLF in seven redshift bins in the range z0.4–0.8, with galaxies identified till 2 mag fainter than previous surveys, owing to the high angular-resolution of UVIT. The fitted Schechter function parameters are obtained for these UVLFs. At z0.7–0.8, we also utilise Hubble Space Telescope (HST) F275W observations in the GOODS-N field to construct the UVLF in 2 redshift bins, whose fitted Schechter function parameters are then found to be consistent with that determined from UVIT at z0.75. We thus probe the variation of the fitted UVLF parameters over z0.8–0.4, a span of 2.7 Gyr in age. We find that the slope of the Schechter function, , is at its steepest at z0.65, implying highest star-formation at this instant with galaxies being relatively more passive before and after this time (also confirmed with FUV star-formation rate determinations). We infer that this is a short-lived instance of increased cosmic star-formation even though cosmic star-formation may be winding-down over longer timespan at this redshift range.
keywords:
galaxies: star formation – ultraviolet: galaxies – galaxies: luminosity function – galaxies: evolution1 Introduction
Galaxy luminosity functions are powerful tools for understanding the properties and evolution of galaxy populations (see review by Johnston 2011). These functions quantify the distribution of luminosities within a given population, providing insights into the underlying physical processes involved in galaxy formation and evolution. The rest-frame 1500 Å UV luminosity function (UVLF) is of particular interest as it is sensitive to the ongoing star formation activity in galaxies (Wyder et al., 2005). The UV emission predominantly arises from the young, massive stars in galaxies, making it an excellent tracer of recent star formation rates (e.g. Flores Velázquez et al. 2021). By studying the UVLF, we can probe the formation and evolution of star-forming galaxies across cosmic history.
Previous studies have extensively characterized the UVLF over a range of redshifts– z predominantly from Galaxy evolution Explorer (GALEX) observations (Arnouts et al., 2005; Wyder et al., 2005); z1–3 from Hubble Space Telescope (HST) surveys in deep-fields111Deep fields, the first of which was surveyed by HST (Williams et al., 1996), are sensitive observations over a small region of the sky that provide unique opportunities to detect and analyze faint, low-luminosity galaxies that may contribute significantly to the overall population and constrain the faint-end of the UVLF. (e.g. Oesch et al., 2010; Alavi et al., 2016) and wide-field ground-based optical surveys (e.g. Cucciati et al., 2012; Moutard et al., 2020); z2–9 also from HST surveys in deep-fields (e.g. Bouwens et al., 2015, 2021); and z8 from recent James Webb Space Telescope (JWST) observations of deep-fields (Bouwens et al., 2023). These investigations have unveiled the rapid rise of star formation activity from early times till z2, a period termed as cosmic noon, and the subsequent reduction in star-formation thereafter till present times (e.g. Oesch et al., 2010; Moutard et al., 2020).
Direct determination of the UVLF characteristics is generally carried out by constructing the UVLF in bins of different redshifts (e.g. Oesch et al., 2010). While at high-redshifts, these UVLFs in redshift bins represent a small range of galaxy ages ( 1.1 Gyr at z=2–3), the same range in redshift at lower z represent a wider range of galaxy ages ( 2.5 Gyr at z=1–2; 6.5 Gyr at z=0.1–1). The near-UV (NUV) and optical observations of galaxies, predominantly from HST studies (e.g. Oesch et al., 2010) have characterised the UVLF at z1 with relatively higher resolution in age. To establish a comprehensive understanding of galaxy evolution, it is crucial to extend the investigation of the UVLF to lower redshifts () with similar resolution in age. This redshift range offers insights into the transition from the vigorous star-forming galaxies observed at higher redshifts to the quiescent, more evolved population found in the local universe (e.g. Leitner, 2012). Understanding the evolution of the UVLF across this transition is essential for constructing a coherent picture of galaxy evolution.
GALEX FUV observations directly probe the rest-frame 1500 Å UVLF for very nearby galaxies (z) from wide-field surveys (Arnouts et al., 2005; Wyder et al., 2005) while GALEX NUV observations have been utilised for constructing the UVLF at z 0.2–1 (Arnouts et al., 2005). Given the low angular resolution of GALEX (FWHM), the UVLF was not well-fitted in the faint-end and redshift bins were kept relatively larger (bin size in z) to compensate. Few other studies have also directly determined the UVLF at the relatively higher-end of this redshift range (e.g. Oesch et al., 2010; Page et al., 2021), but none have constrained the UVLF at faint magnitude limits. While the most star-forming galaxies at any given redshift occupy the brighter end of the UVLF, the relatively more numerous passive galaxies occupy its fainter end. To well characterize the star-formation at any given redshift and in-particular the UVLF slope (discussed later in Section 3), observations of the galaxies at the faint-end of the UVLF are needed.
The UV Imaging Telescope (UVIT; Kumar et al. 2012) on board AstroSat (Singh et al., 2014) has carried out high angular-resolution (FWHM, FWHM; Mondal et al. 2023a) UV observations of the Great Observatories Origins Deep Survey - North and South fields (GOODS-N and GOODS-S respectively; Giavalisco et al. 2004). The observations of the GOODS-N field are described in Mondal et al. (2023a) while that of the GOODS-S field will be presented in Saha et al. (2023, in preparation). These observations have already resulted in identifications of Lyman-continuum leakers at z1.5 (Saha et al., 2020) as well as the discovery of extended-UV discs around blue-compact-dwarf galaxies at z0.2 (Borgohain et al., 2022) in the GOODS-S field, and characterization of the UV continuum slope () in the GOODS-N field (Mondal et al., 2023b).
Given the sensitivity to the 1500 Å region of galaxies at z and z0.8–0.4 from UVIT FUV and NUV imaging respectively, and the availability of well-determined photometric and spectroscopic redshifts in the aforementioned deep fields, we are finely poised to utilize these observations to construct deep UVLFs with high resolution in look-back time (with narrow redshift bins). We can obtain the UVLF parameters and construct a coherent picture of galaxy evolution over these redshift ranges. Additionally, the FUV 1500 Å flux measurement also allows for computation of the recent (<100 Myr) star-formation rate (SFR; Kennicutt & Evans 2012) in the observed galaxies in the aforementioned redshift window.
We describe the data utilised in this work in Section 2, the constructed UVLFs in Section 3 and the derived FUV SFR in Section 4. We discuss the UVLF evolution in Section 5 and present our conclusions in Section 6.
Throughout this paper, we use the standard cosmology ( = 0.3, = 0.7 with = 70 km s-1 Mpc-1). Magnitudes are given in the AB system (Oke, 1974).
2 Data
Deep UV imaging observations of the GOODS-N field was carried out with AstroSat/UVIT (AstroSat UV Deep Field North, hereafter AUDFn), using one far-UV (FUV; F154W, 34.0 ks) and two near-UV (NUV) filters (N242W, 19.2 ks; N245M, 15.5 ks), as detailed in Mondal et al. (2023a). The AUDFn imaging data covers 616 sq. arcmin, including the 158 sq. arcmin covered by the HST CANDELS survey with multiple HST filters (Grogin et al., 2011) and the 56.5 sq. arcmin spanned by the Hubble Deep UV Legacy Survey in the GOODS-N field with HST F275W and F336W filters (Oesch et al., 2018). In this work, we utilize only those F154W and N242W sources catalogued by Mondal et al. (2023a) that have a single unique HST counterpart within 222The radius of is slightly larger than the FWHM of the UVIT NUV and FUV PSFs and sources having a separation beyond this radius will not appear blended even if there is a large magnitude difference between the sources (Mondal et al., 2023a).. We additionally restrict ourselves to only those sources that are brighter than the 50% completeness limits of 26.40 and 27.05 mag for the F154W and N242W images respectively
The redshifts for our galaxies were adopted from the zbest value of the CANDELS Photometric Redshift Catalog (Kodra et al., 2023). zbest is their best estimate of a galaxy’s redshift determined from the combined data set of spectroscopic redshifts, 3D-HST grism redshifts, and best photometric redshift estimate (see Kodra et al. 2023 for details). As per the filter transmission functions for the F154W and N242W filters (Tandon et al., 2020), they are most sensitive to the redshifted 1500 Å for galaxies at z and z respectively. We thus select 95 and 1258 galaxies with only a single HST counterpart in the F154W and N242W images respectively within these redshift ranges. These are then utilised to construct the rest-frame 1500 Å UVLFs (see Section 3). These selected galaxies survey an area of 142 sq. arcmin on the sky.
Furthermore, the HST F275W (given its filter transmission) reliably traces the redshifted 1500 Å for galaxies at z . There are 326 galaxies in this redshift range observed in F275W filter down to the 5 detection limit of 27.4 mag. As this overlaps with the higher redshift range probed by N242W, we utilise the HST F275W photometric catalogue (Oesch et al., 2018) to construct UVLFs as a consistency check to the N242W based UVLFs (see Section 3).
3 The UV (1500 Å) Luminosity Functions
No. of M* sources mag-1 Mpc-3 mag AUDFn FUV 0.1 0.01 – 0.13 95 AUDFn NUV 0.41 0.378 – 0.434 120 0.46 0.434 – 0.489 243 0.52 0.489 – 0.545 226 0.57 0.545 – 0.601 193 0.63 0.601 – 0.657 172 0.68 0.657 – 0.712 153 0.74 0.712 – 0.768 151 HDUV-N 0.71 0.679 – 0.734 143 0.76 0.734 – 0.79 183
3.1 The AstroSat/UVIT F154W Luminosity Function
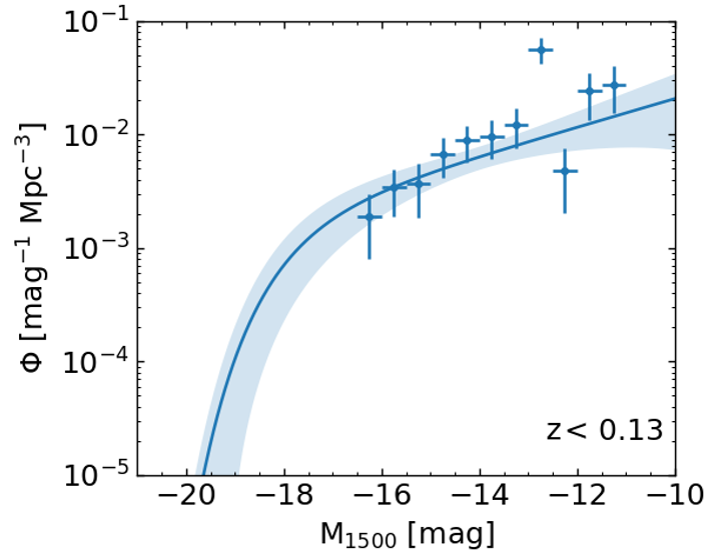
The measured F154W magnitudes of the 95 galaxies are utilised to construct the UVLF at z. Completeness correction is based on the recovery fraction of sources as a function of F154W magnitude (see Figure 14 in Mondal et al. 2023a) that was carried out using artificial source injection (Bhattacharya et al., 2019) for the F154W image. A further correction is applied to account for the fraction of total identified sources that have a unique HST counterpart. The small K-corrections are derived from appropriate best-fit templates.
Accounting for the aforementioned corrections and the luminosity distance of each galaxy, we construct the UVLF shown in Figure 1. The binned representation of the UVLF follows the method of Page & Carrera (2000) and clearly shows in Figure 1 that galaxies are observed down to M1500=-11 mag. The UVLF is then fitted with the classic Schechter function (Schechter, 1976) using a maximum likelihood estimator fit, similar to that carried out by Page et al. (2021). The Schechter function can be parameterised as a function of magnitude M with parameters , and M∗ as follows:
| (1) |
where . Here, is a normalization factor which defines the overall density of galaxies (number per cubic Mpc). is the characteristic galaxy magnitude. An galaxy is a bright galaxy, roughly comparable in luminosity to the Milky Way. defines the faint-end slope of the UVLF, which is typically negative implying large numbers of relatively passive galaxies with low luminosities.
3.2 The AstroSat/UVIT N242W Luminosity Functions
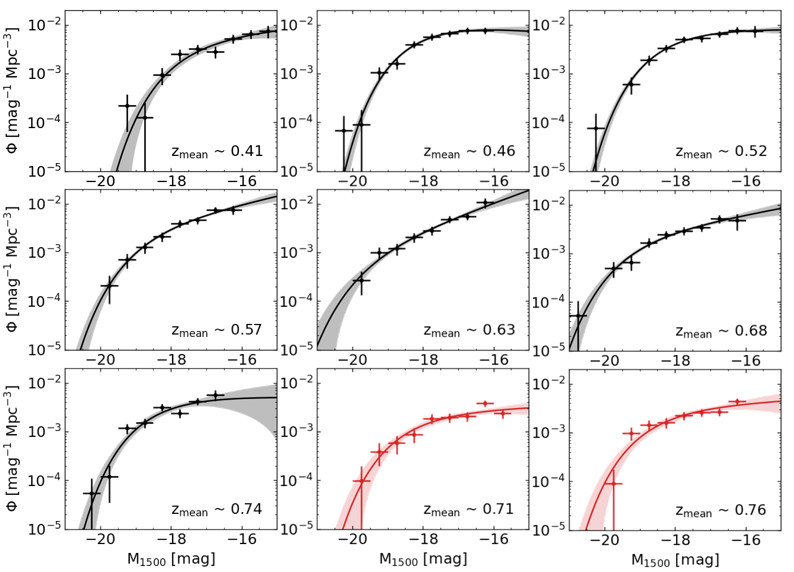
The measured N242W magnitudes of the 1258 galaxies are utilised to construct the UVLFs at z . These galaxies are divided into 7 equal bins in redshift () such that at least 100 galaxies are present in each bin, with at least 1 galaxy populating the bright end of the UVLF for each bin. The mean redshift of each bin, zmean, the range of redshifts as well as the number of galaxies in each bin are noted in Table 1.
For the galaxies in each redshift bin, corrections are applied similar to that described in Section 3.1. The binned representation of the UVLF for each redshift bin clearly shows in Figure 2 that galaxies are observed down to M1500=-15 mag at zmean=0.41, but this limit decreases with increased zmean values and galaxies in the UVLF are observed only down to M1500=-17.5 mag at zmean=0.74. The Schechter function is fitted to the UVLF (as described in Section 3.1) in each redshift bin keeping , and M∗ as free parameters. The best-fit Schechter function parameters are noted in Table 1. The 1 shaded uncertainty to the best-fit Schechter function is plotted in Figure 2, showing that the UVLFs are well-constrained to mag below M∗.
3.3 The HST/HDUV F275W Luminosity Functions
The measured F275W magnitudes of the 326 galaxies catalogued by Oesch et al. (2018) are utilised to construct the UVLFs at z . The galaxies are divided into two redshift bins () following the criteria described in Section 3.2. The binned representation of the UVLF is then constructed, as shown in red in Figure 2, without any completeness correction333Oesch et al. (2018) had constructed the catalogue of HDUV galaxies based on detection in NIR HST filters. The completeness in their F275W catalogue is thus based on the detection completeness in these NIR filters. As these galaxies show a spread in F275W - F160W colour over mag, the detection completeness in NIR filters are not an accurate representation of the completeness in F275W. However, given the purpose of comparing the UVLF fit parameters to that obtained from the AstroSat/N242W observations in the same redshift range, we construct the F275W UVLFs without any completeness correction, understanding that the effect of the completeness correction will be mild as we restrict ourselves to the 5 detection limit, that is generally expected to be brighter than the 50% completeness limit.. Galaxies are observed down to M1500=-16.5 mag and -16 mag at zmean=0.71 and 0.76 respectively, deeper than in the N242W data at the same redshift. The Schechter function is then fitted to the UVLF (as described in Section 3.1) in both redshift bins keeping , and M∗ as free parameters. The best-fit Schechter function parameters are noted in Table 1 and show that the fitted M∗ values are similar (with similar uncertainty) for the HDUV UVLFs and the N242W UVLF at zmean=0.71. The fitted and values also agree within errors but the uncertainty is lower (by almost 50%) for the deeper HDUV UVLFs. Thus the directly determined HDUV UVLFs and the N242W UVLF for the GOODS-N field are consistent for the overlapping redshift range covered by the two filters.
4 Galaxy stellar mass and FUV star formation from z0.8–0.4
While a number of different observational methods exist to determine the SFR of a galaxy (e.g. Popesso et al., 2023), the measured FUV 1500 Å flux may be utilised to compute the FUV 1500 Å luminosity and thereafter derive the dust-unobscured FUV SFR444We are not correcting for internal extinction in this work. As FUV flux is generally heavily obscured by dust, so our estimated SFR is a lower limit of the total SFR. We obtain this dust-unobscured FUV SFR following Equation 3 in Murphy et al. (2011): (2) (pertaining to the star-formation over the past 10–100 Myr; Kennicutt & Evans 2012). We thus calculate the SFR for the 1258 galaxies with N242W observations at z and also for the 326 galaxies (as in Section 3.2) at z with F275W observations (as in Section 3.3). The stellar masses (M) of these galaxies had already been computed by Barro et al. (2019) from stellar population model fits to their spectral energy distributions from multi-wavelength photometric observations.
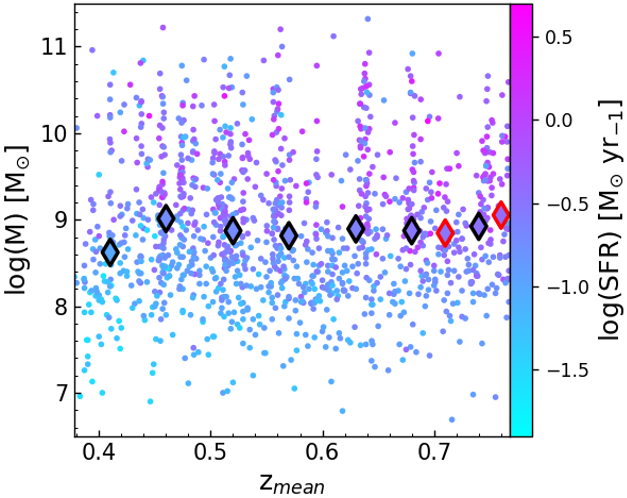
Figure 3 shows the variation of stellar masses of each galaxy with N242W observations as a function of redshift, coloured by their log(SFR). As we are comparing only amongst star-forming galaxies, i.e., only those having any rest-frame FUV emission, we find that the more massive galaxies naturally have higher SFR than lower mass ones (following the main sequence of star-forming galaxies; Noeske et al. 2007). The mean stellar mass of galaxies in each redshift bin, where the UVLF was computed, is also plotted. We find a mean stellar mass of galaxies in each bin M⊙, except the lowest redshift bin which seems to have a lower mean stellar mass.
To better visualize the stellar mass distribution of galaxies in each redshift bin, we show box-whisker plots of log(M) as a function of zmean in Figure 4. The median values of log(M) does not systematically vary with redshift and neither does the inter-quartile range (the box; which accounts for 50% of the galaxy stellar masses in each redhift bin), which seems to overlap for the different redshift bins though some variation is notable. The minimum to maximum stellar mass range (the whiskers) also sees some variation with redshift but they also overlap over the whole range and show no trend with redshift.
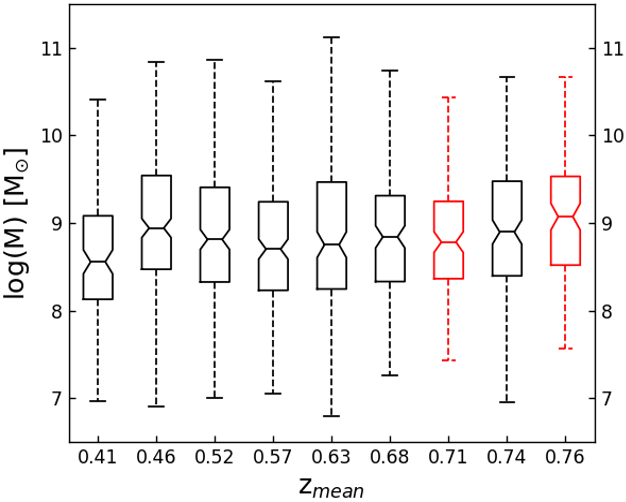
To further determine any change in the stellar mass distribution of the galaxy sample as a function of redshift, we carry out a statistical comparison of the log(M) distributions in pairs of redshift bins with an Anderson-Darling test (AD-test555The AD-test usage has been discussed in detail in Bhattacharya et al. (2021, see Section 3.4) along with applications in Bhattacharya et al. (2022a); Bhattacharya et al. (2022b); Bhattacharya et al. (2023). It is adopted here to allow the comparison of numerically different data-sets.; Scholz & Stephens 1987). Comparing the log(M) distribution at z with that at z, we obtain a test significance (equivalent to a p-value) of 0.001. Since the significance is below 0.05, the two log(M) distributions identified as being drawn from different parent distributions. Comparing the log(M) distribution at z with that at z, that at z with that at z, and so on, we find no other pair with significance below 0.05, i.e, all other pairs of log(M) distributions with increasing redshift may or may not be drawn from different parent distributions.
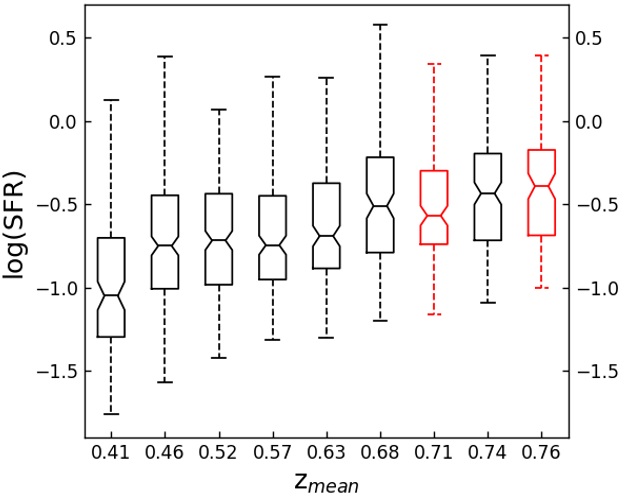
To better visualize the SFR distribution of galaxies in each redshift bin, we show box-whisker plots of log(SFR) as a function of zmean in Figure 5. The median value of log(SFR) seems to be much lower at z than at other higher redshift bins, though those for bins with z seem the highest. The inter-quartile range (the box) is also lowest for z, then that at zmean=0.46–0.63 overlap with a higher value while those at z overlap with an even higher value. The maximum SFR (the top whisker) seems to be similar for most bins though the minimum shows a systemic increase with increasing zmean.
To further determine any change in the SFR distribution of the galaxy sample as a function of redshift, we again carry out a statistical comparison of the log(SFR) distributions in pairs of redshift bins with the AD-test. Comparing the log(SFR) distribution at z with that at z, we obtain a test significance of 0.001, implying that the two log(SFR) distributions are drawn from different parent distributions. Pairwise comparison of the log(SFR) distributions of different redshift bins with increasing zmean is then carried out. For the log(SFR) distributions at zmean=0.46–0.63, these may or may not be drawn from different parent distributions as the test significance is larger than 0.05 for all these pairs. We do however find that the log(SFR) distribution at z is different from that at z, with a significance of 0.004. We find that the log(SFR) distributions at z again may or may not be drawn from different parent distributions.
To summarize, we statistically find that the galaxies in the redshift bin with z have lower log(M) and log(SFR) than the galaxies in the higher redshift bins. Galaxies in other redshift bins do not have any statistically different stellar masses, though log(SFR) sees a transition from z to z.
5 Discussion
5.1 Consistency with past determinations of the UVLF
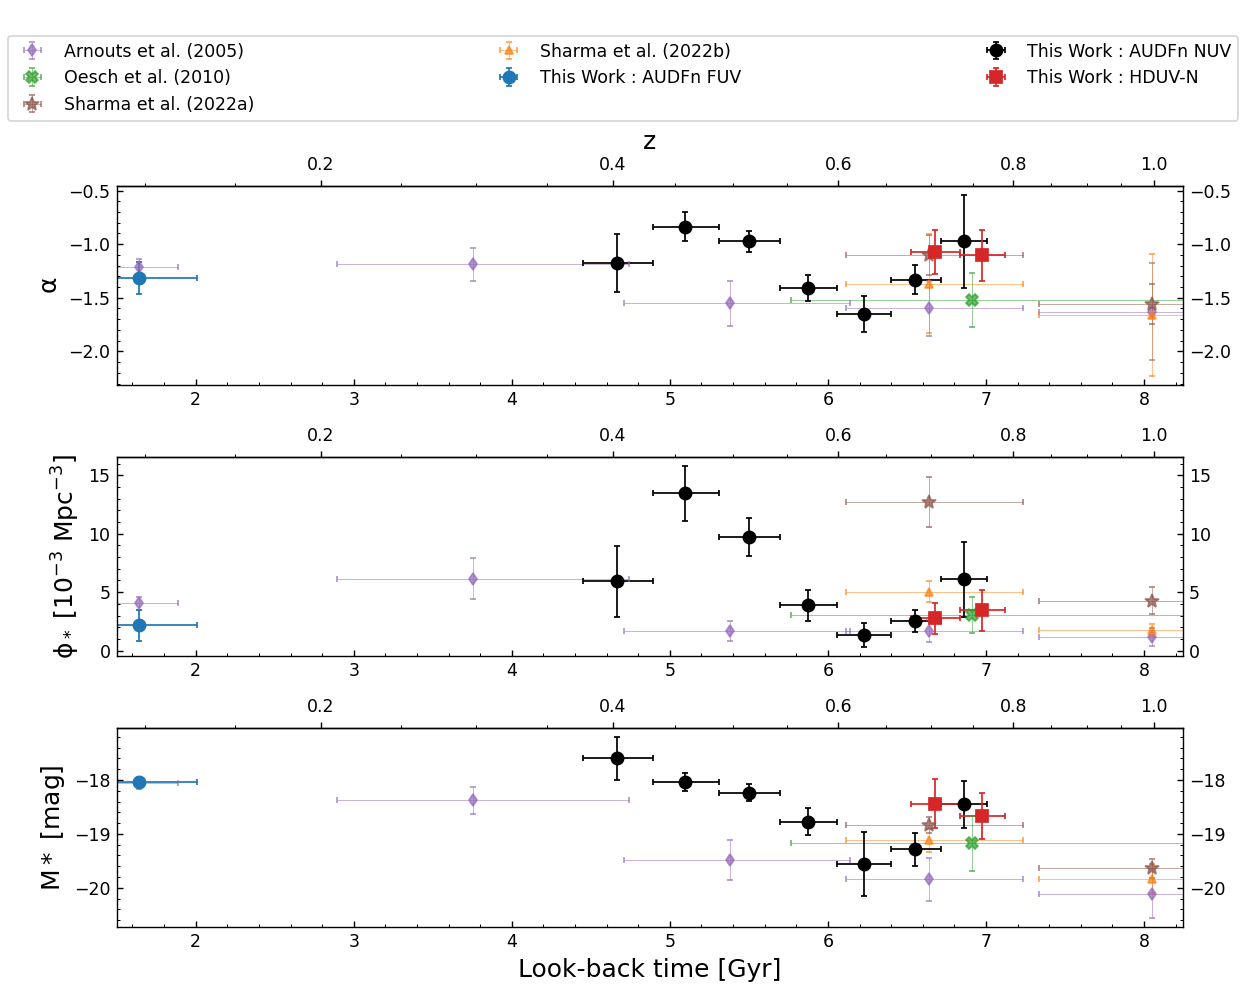
Figure 6 shows the variation of the three Schechter function parameters, , and M∗, with redshift in this work, as well as other direct determinations of these parameters up to z in the literature. At the lowest redshift (z) for the UVLF from AstroSat/F154W, M∗ was kept constant to the value determined by Arnouts et al. (2005) from GALEX FUV imaging. The and values for the best fit F154W UVLF are also consistent with the values determined by Arnouts et al. (2005).
From GALEX NUV imaging, Arnouts et al. (2005) also determined the UVLF fit parameters for z=0.2–0.4, 0.4–0.6, 0.6–0.8 and 0.8–1.2, which are plotted as magenta diamonds in Figure 6. Their determinations were restricted to fitting the UVLF down to M-15.5, -17, -18 and -19 mag for the aforementioned respective redshift bins. Oesch et al. (2010) determined the UVLF fit parameters in various redshift bins from HST F225W, F275W and F336W imaging in the GOODS-S field covering z0.5–2.5. Their fitted parameters for the UVLF (restricted down to M-17) at z=0.5–1 are plotted as green crosses in Figure 6. XMM-Newton Optical Monitor (XMM-OM) telescope images have also been utilised to obtain the UVLF fit parameters for z= 0.6–0.8 and 0.8–1.2 (Page et al., 2021; Sharma et al., 2022b; Sharma et al., 2022a). We show the determined parameters in Figure 6 for the XMM-OM UVLF determinations in the GOODS-S (Sharma et al., 2022b, in brown) and COSMOS (Sharma et al., 2022a, in orange) fields. In the z= 0.6–0.8 bin, their determinations were restricted to fitting the UVLF down to M-17.5 and -19 mag for the two fields respectively.
Indirect determinations of the UVLF at this redshift range has been carried out by Cucciati et al. (2012) using spectral energy distribution (SED) fits to higher wavelength images of galaxies using stellar population models and by Moutard et al. (2020) using UVLFs determined from U-band images of galaxies normalized to shallower GALEX FUV image based UVLFs. The UVLF fit parameters determined in these studies also span the same parameter space as those marked in Figure 6 but show nearly constant values of the parameters over the determined entire redshift range, a likely consequence of the assumptions of these indirect determination techniques (see Moutard et al. 2020 for details).
As clearly seen from Figure 6, the determination of the UVLF parameters has been carried out in this work (from AstroSat/N242W and HDUV surveys) with a significantly higher resolution in redshift than previous studies with a similar level of uncertainty, allowing for UVLF fits in smaller redshift bins. Additionally, we fit the UVLF down to fainter M1500 values. For z=0.2–0.4, the fitted UVLF parameters from Arnouts et al. (2005) are consistent within error for that determined at zmean=0.41 in this work. For z=0.4–0.6, where they fit UVLFs to shallower data, we determine higher values for , and M∗. At z=0.6–0.8, determinations from fitting the UVLF to relatively shallower data from different works (Arnouts et al., 2005; Oesch et al., 2010; Sharma et al., 2022b; Sharma et al., 2022a), still results in fitted UVLF parameters that agree within error, though Sharma et al. (2022b) seem to find a relatively high . The fitted UVLF parameters from this work are also consistent with these literature determinations within error.
5.2 Evolution of the UVLF from z0.8–0.4
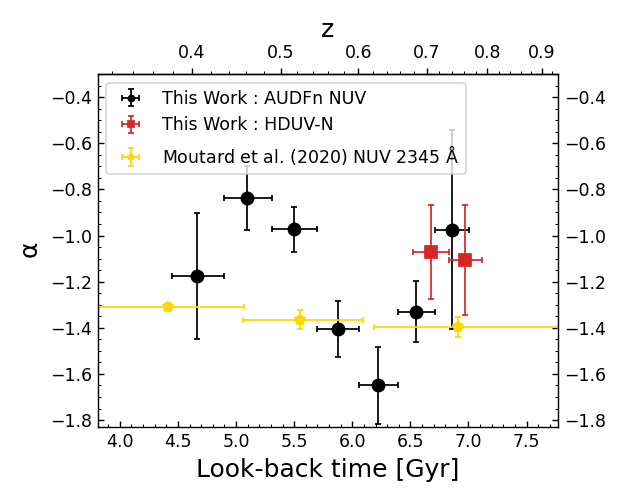
Figure 6 shows the evolution of the fitted UVLF parameters from z0.8–0.4. At z, is nearly constant but then declines to its lowest value at zmean=0.63 and then increases with increasing redshift. Similar trends are seen for and M∗, though at zmean=0.41 is relatively low. As found in Section 4, the log(M) and log(SFR) of galaxies at zmean=0.41 is lower than other redshift windows. This probably affects the determined Schecter function parameters at this redshift.
The and M∗ values determined in this work may also be affected by cosmic variance of 22%, using the web tool by Trenti & Stiavelli (2008). However, would remain unaffected. As seen in Section 4, the stellar mass distribution of galaxies is similar in each redshift bin probed in this work. Thus the identification of a steeper values of the rest-frame 1500 Å LF at z0.65 is not merely an observational sample selection effect. A reletively steeper value implies larger numbers of faint galaxies have high rest-frame UV emission, implying a larger number of faint star-forming galaxies. Thus, the trend in seen in Figure 6 would stem from a physical standpoint of star-formation increasing from zmean=0.76 to zmean=0.63 and then decreasing again till zmean=0.52 and remaining nearly constant thereafter. Indeed in Section 4, we find that log(SFR) sees a noticeable transition from zmean=0.68 to zmean=0.63.
Cosmic star-formation is understood, to have peaked at z2 (see Förster Schreiber & Wuyts 2020 and references therein) where-after star-formation has decreased till its present quiescent phase (e.g. Saito et al., 2020). It remains yet unclear if the cosmic star-formation winded down monotonically or there were short periods of relatively higher and lower star formation as cosmic star formation experienced its overall decline. Our identification of steeper values of the rest-frame 1500 Å LF at z0.65 is indicative of the latter scenario where an increase in star-formation took place over a shorter period around this redshift.
The 1500 Å LF is most sensitive to recent star-formation in these galaxies at short timescales between 10–100 Myr depending on the burstiness of star-formation (Flores Velázquez et al., 2021). As we have smaller redshift bins (corresponding to 300 Myr), we are sensitive to small changes in star-formation with redshift. Moutard et al. (2020) directly determine the rest-frame NUV (2345 Å) UVLF from CFHT u-band and HSC g-band observations over z=0.3–0.9. As this rest-frame NUV probes the light from a relatively older stellar population, it is expected that short recent bursts would not affect their determined UVLF parameters as much as that of the rest-frame 1500 Å LF.
Figure 7 shows the fitted from the 1500 Å LF in this work juxtaposed with the fitted from the rest-frame NUV (2345 Å) UVLF by Moutard et al. (2020). Despite the wider redshift bins, the slightly declining NUV from Moutard et al. (2020) shows that star-formation has been declining over longer timescales in the probed redshift range. Over shorter timescales of star-formation, as probed by the rest-frame 1500 Å LF based values determined in this work, galaxies have been more passive than average at z=0.7–0.8, showing locally peaked star-formation at z0.65 and then becoming more passive again at lower redshifts. The shallower value for the rest-frame NUV compared to the FUV at all redshifts, other than z0.65, also signifies that a number of fainter galaxies exist at these redshifts which have less star-formation over the past 10–100 Myr, in-line with the expectations of an overall declining cosmic star-formation history since cosmic noon.
Probing the entire redshift range till cosmic noon with similarly high resolution in redshift, as achieved in this work, may reveal numerous short-lived instances of increasing and decreasing cosmic star-formation till its maximum at cosmic noon.
6 Conclusion
In this work, we present the rest-frame 1500 Å LF in the GOODS-N field from AstroSat/F154W (z0.13), AstroSat/N242W (z0.4–0.8) and HST/F275W (z0.7–0.8) observations. The UVLFs thus determined are fitted with the Schechter function and the fitted parameters are examined. We find that the AstroSat/F154W based UVLF is consistent with that from GALEX at z0.1 from their fitted Schechter parameters (Figure 6). The AstroSat/N242W based UVLFs show a significant improvement in the redshift resolution compared to literature measurements, probing z0.4–0.8 in 7 redshift bins with similar levels of uncertainty as in previous works with wider redshift bins. The UVLFs are also fitted down to significantly fainter magnitudes. At z0.7–0.8, the AstroSat/N242W based UVLFs are consistent with those obtained from HST/F275W observations.
The higher redshift resolution has allowed us to probe the variation of the fitted UVLF parameters over z0.4–0.8, a span of 2.7 Gyr in age. We find that is at its steepest at z0.65, implying highest star-formation at this time with galaxies being relatively more passive before and after this time. We infer that this is a short-lived instance of increased star-formation in the universe and numerous such instances may be found, by future studies with similarly high resolution in redshift, as star-formation goes through peaks and troughs before reaching its maximum at cosmic noon.
Acknowledgements
SB is funded by the INSPIRE Faculty award (DST/INSPIRE/04/2020/002224), Department of Science and Technology (DST), Government of India. This work is primarily based on observations taken by AstroSat/UVIT. The UVIT project is a result of collaboration between IIA, Bengaluru, IUCAA, Pune, TIFR, Mumbai, several centres of ISRO, and CSA. Several groups from ISAC (ISRO), Bengaluru, and IISU (ISRO), and Trivandrum have contributed to the design, fabrication, and testing of the payload. The Mission Group (ISAC) and ISTRAC (ISAC) continue to provide support by making observations with, and reception and initial processing of the data. This research made use of Astropy– a community-developed core Python package for Astronomy (Astropy Collaboration et al., 2013), SciPy (Virtanen et al., 2020), NumPy (Oliphant, 2015) and Matplotlib (Hunter, 2007). This research also made use of NASA’s Astrophysics Data System (ADS666https://ui.adsabs.harvard.edu)
Data Availability
References
- Alavi et al. (2016) Alavi A., et al., 2016, ApJ, 832, 56
- Arnouts et al. (2005) Arnouts S., et al., 2005, ApJ, 619, L43
- Astropy Collaboration et al. (2013) Astropy Collaboration et al., 2013, A&A, 558, A33
- Barro et al. (2019) Barro G., et al., 2019, ApJS, 243, 22
- Bhattacharya et al. (2019) Bhattacharya S., Arnaboldi M., Hartke J., Gerhard O., Comte V., McConnachie A., Caldwell N., 2019, A&A, 624, A132
- Bhattacharya et al. (2021) Bhattacharya S., Arnaboldi M., Gerhard O., McConnachie A., Caldwell N., Hartke J., Freeman K. C., 2021, A&A, 647, A130
- Bhattacharya et al. (2022a) Bhattacharya S., et al., 2022a, MNRAS, 517, 2343
- Bhattacharya et al. (2022b) Bhattacharya S., Rao K. K., Agarwal M., Balan S., Vaidya K., 2022b, MNRAS, 517, 3525
- Bhattacharya et al. (2023) Bhattacharya S., Arnaboldi M., Hammer F., Yang Y., Gerhard O., Caldwell N., Freeman K. C., 2023, MNRAS, 522, 6010
- Borgohain et al. (2022) Borgohain A., Saha K., Elmegreen B., Gogoi R., Combes F., Tandon S. N., 2022, Nature, 607, 459
- Bouwens et al. (2015) Bouwens R. J., et al., 2015, ApJ, 803, 34
- Bouwens et al. (2021) Bouwens R. J., et al., 2021, AJ, 162, 47
- Bouwens et al. (2023) Bouwens R. J., et al., 2023, MNRAS,
- Cucciati et al. (2012) Cucciati O., et al., 2012, A&A, 539, A31
- Flores Velázquez et al. (2021) Flores Velázquez J. A., et al., 2021, MNRAS, 501, 4812
- Förster Schreiber & Wuyts (2020) Förster Schreiber N. M., Wuyts S., 2020, ARA&A, 58, 661
- Giavalisco et al. (2004) Giavalisco M., et al., 2004, ApJ, 600, L93
- Grogin et al. (2011) Grogin N. A., et al., 2011, ApJS, 197, 35
- Hunter (2007) Hunter J. D., 2007, Computing In Science & Engineering, 9, 90
- Johnston (2011) Johnston R., 2011, A&ARv, 19, 41
- Kennicutt & Evans (2012) Kennicutt R. C., Evans N. J., 2012, ARA&A, 50, 531
- Kodra et al. (2023) Kodra D., et al., 2023, ApJ, 942, 36
- Kumar et al. (2012) Kumar A., et al., 2012, in Takahashi T., Murray S. S., den Herder J.-W. A., eds, Society of Photo-Optical Instrumentation Engineers (SPIE) Conference Series Vol. 8443, Space Telescopes and Instrumentation 2012: Ultraviolet to Gamma Ray. p. 84431N (arXiv:1208.4670), doi:10.1117/12.924507
- Leitner (2012) Leitner S. N., 2012, ApJ, 745, 149
- Mondal et al. (2023a) Mondal C., et al., 2023a, ApJS, 264, 40
- Mondal et al. (2023b) Mondal C., Saha K., Windhorst R. A., Jansen R. A., 2023b, ApJ, 946, 90
- Moutard et al. (2020) Moutard T., Sawicki M., Arnouts S., Golob A., Coupon J., Ilbert O., Yang X., Gwyn S., 2020, MNRAS, 494, 1894
- Murphy et al. (2011) Murphy E. J., et al., 2011, ApJ, 737, 67
- Noeske et al. (2007) Noeske K. G., et al., 2007, ApJ, 660, L43
- Oesch et al. (2010) Oesch P. A., et al., 2010, ApJ, 725, L150
- Oesch et al. (2018) Oesch P. A., et al., 2018, ApJS, 237, 12
- Oke (1974) Oke J. B., 1974, ApJS, 27, 21
- Oliphant (2015) Oliphant T. E., 2015, Guide to NumPy, 2nd edn. CreateSpace Independent Publishing Platform, USA
- Page & Carrera (2000) Page M. J., Carrera F. J., 2000, MNRAS, 311, 433
- Page et al. (2021) Page M. J., et al., 2021, MNRAS, 506, 473
- Popesso et al. (2023) Popesso P., et al., 2023, MNRAS, 519, 1526
- Saha et al. (2020) Saha K., et al., 2020, Nature Astronomy, 4, 1185
- Saito et al. (2020) Saito S., de la Torre S., Ilbert O., Dubois C., Yabe K., Coupon J., 2020, MNRAS, 494, 199
- Schechter (1976) Schechter P., 1976, ApJ, 203, 297
- Scholz & Stephens (1987) Scholz F. W., Stephens M. A., 1987, Journal of the American Statistical Association, 82, 918
- Sharma et al. (2022a) Sharma M., Page M. J., Ferreras I., Breeveld A. A., 2022a, arXiv e-prints, p. arXiv:2212.00215
- Sharma et al. (2022b) Sharma M., Page M. J., Breeveld A. A., 2022b, MNRAS, 511, 4882
- Singh et al. (2014) Singh K. P., et al., 2014, in Takahashi T., den Herder J.-W. A., Bautz M., eds, Society of Photo-Optical Instrumentation Engineers (SPIE) Conference Series Vol. 9144, Space Telescopes and Instrumentation 2014: Ultraviolet to Gamma Ray. p. 91441S, doi:10.1117/12.2062667
- Tandon et al. (2020) Tandon S. N., et al., 2020, AJ, 159, 158
- Trenti & Stiavelli (2008) Trenti M., Stiavelli M., 2008, ApJ, 676, 767
- Virtanen et al. (2020) Virtanen P., et al., 2020, Nature Methods, 17, 261
- Williams et al. (1996) Williams R. E., et al., 1996, AJ, 112, 1335
- Wyder et al. (2005) Wyder T. K., et al., 2005, ApJ, 619, L15