Experimental techniques for evaluating the performance of high-blockage cross-flow turbine arrays
Abstract
In confined flows, such as river or tidal channels, arrays of turbines can convert both the kinetic and potential energy of the flow into renewable power. The power conversion and loading characteristics of an array in a confined flow is a function of the blockage ratio, defined as the ratio of the array’s projected area to the channel cross-sectional area. In this work, we explore experimental methods for studying the effects of the blockage ratio on turbine performance while holding other variables constant. Two distinct methods are considered: one in which the array area is held constant and the channel area is varied, and another in which the array area is varied and the channel area is held constant. Using both approaches, the performance of a laboratory cross-flow turbine array in a water tunnel is evaluated at blockage ratios ranging from 30% to 60%. As the blockage ratio is increased, the coefficient of performance increases, eventually exceeding the Betz limit and unity. While similar trends are observed with both experimental approaches, at high blockage and high tip-speed ratios, the values of the performance and force coefficients are found to depend on the experimental approach. The advantages and disadvantages of each approach are discussed. Ultimately, we recommend investigating blockage effects using a fixed array area and variable channel area, as this approach does not convolve blockage effects with interactions between the turbine blades and support structures.
Cross-flow turbine, blockage, array, experiment
1 Introduction
The efficiency of a turbine operating in a confined flow, such as a river or tidal channel, is influenced by how much of the channel the turbine occupies. The size of the turbine relative to the size of the channel is typically represented by the blockage ratio, defined as the ratio between the turbine’s projected area and the channel cross-sectional area:
| (1) |
As the blockage ratio increases, the turbine presents greater resistance to the oncoming flow, and thus experiences greater thrust. For a constant volumetric flow rate, this thrust, combined with confinement from the channel boundaries, yields accelerated flow through the turbine rotor. As a consequence, a turbine operating in a confined flow produces more power relative to the same turbine in an unconfined flow [1, 2, 3].
Lateral arrays or “fences” of turbines deployed in river or tidal channels can harness these blockage effects to enhance power production [4, 5, 3]. However, since blockage-driven increases in power generation are accompanied by increases in the forces on the turbine, understanding how both power and loads scale with the blockage ratio is critical for rotor design [6] and control [7] Additionally, the blockage ratio in natural channels may vary daily (e.g., with the tides), seasonally (e.g., runoff from snowmelt or storms), or as needed when individual turbines are deactivated for maintenance or to allow the passage of vessels and marine animals. Therefore, understanding how changes in blockage will alter turbine hydrodynamics, and thus power production, is necessary for the management of these systems.
The study of blockage effects is also applicable to turbines that are intended for use in unconfined environments. Many laboratory settings in which model turbines are tested, such as wind tunnels or flumes, are inherently confined flows, and the associated blockage effects will yield augmented performance [8, 9], even at blockages of 10% and below [10, 11]. Further, in experimental design, increasing model scale to achieve Reynolds numbers that are more representative of a full scale turbine generally increases blockage. While analytical corrections have been developed to predict unconfined turbine performance using measurements of confined turbine performance [12, 13, 14, 15], most are simplified models based on linear momentum theory, and their accuracy can vary [16]. Given this, dedicated study of blockage effects, particularly at the upper end of achievable blockage in practical situations, is relevant.
| Author | Year | Turbine Type | Facility Type | tested [%] | varied by changing |
|---|---|---|---|---|---|
| [15] | 2009 | AFT | Wind tunnel, water flume | 5, 64 | Test facility |
| [17] | 2010 | CFT | Water flume | 50, 62.5 | Water depth |
| [10] | 2011 | CFT | Wind tunnel with removable walls | 2.8†, 10 | Wind tunnel size |
| [18] | 2011 | AFT | Wind tunnel | 10.2, 20.2, 28.3 | Turbine diameter |
| [19] | 2011 | CFT | Wind tunnel | 2, 3.5, 8 | Turbine scale |
| [20] | 2012 | AFT | Wind tunnel | 19, 33.8, 52.8 | Turbine diameter |
| [21] | 2013 | CFT | Water flume | 24.5 - 49.2† | Water depth |
| [22] | 2014 | AFT | Water flume | 6.3, 9.9, 14.3, 19.4, 25.4 | Turbine diameter |
| [23] | 2015 | AFT | Multiple flumes and tow tanks | 1.2, 3.3, 4.8 | Test facility |
| [24] | 2015 | AFT | Multiple wind tunnels | 8.1, 18.0, 48.1 | Test facility |
| [11] | 2015 | CFT | Wind tunnel with removable walls | 2.8†, 10 | Wind tunnel size |
| [25] | 2018 | CFT | Multiple wind tunnels | 3.5, 13.4, 24.7 | Test facility |
| [16] | 2020 | CFT, AFT | Multiple flumes | AFT: 2, 35. CFT: 3, 36 | Test facility |
| [26] | 2020 | CFT | Multiple flumes | 14, 36 | Test facility |
| [9] | 2022 | CFT | Water tunnel | 9.9, 12.4 | Blade span |
-
†
Value estimated from provided turbine and channel dimensions.
Table 1 summarizes prior experimental work that has explored how changing the blockage ratio affects the performance of both axial-flow turbines and cross-flow turbines. While we focus this review on experimental studies, we acknowledge that there is a complementary body of numerical work (e.g., [27, 2, 28, 29]). In alignment with theory, an increase in blockage is found to increase the thrust loading on the turbine [11, 16, 26, 9] and the maximum efficiency of the turbine [15, 17, 19, 21, 24, 11, 25, 16, 26, 9], as well as the tip-speed ratio at which this maximum occurs. From a fluid dynamic standpoint, an increase in blockage is observed to accelerate the flow through and around the rotor, as well as narrow the turbine wake [10, 22, 26]. Although these key trends are common across these studies, multiple approaches for varying blockage have been used across these experiments. Some studies vary by changing the size of the channel; for example, testing the same turbine in different facilities [15, 24, 25, 16, 26], or altering the water depth in a flume [17, 21]. Others vary by changing the dimensions of the turbine itself [18, 19, 20, 22, 9].
All of these experimental approaches yield similar trends, yet differences in approach limit a deeper understanding of blockage effects. While differences in rotor geometry [6, 16] and type of test facility [23] can influence observed trends, even blockage effects measured in a single test facility with a single turbine design can be inadvertently convolved with the effects of other variables. For example, [17] and [21] both change the blockage ratio by changing water depth in a flume, but in doing so convolve the effects of blockage with those of the Froude number and proximity to the free surface. Overall, the variety of approaches employed by prior work motivate a thorough consideration of experimental methods for studying blockage effects on turbines and the robustness of these techniques.
In this work, we discuss two approaches by which the blockage ratio of a turbine array can be varied in a single test facility while holding constant or minimizing the effects of other dimensionless parameters. Using both approaches, we evaluate the performance of a cross-flow turbine array at blockage ratios between 30% and 60%, and compare the results. These blockages are of importance for associated research employing control co-design to understand the potential for high-blockage arrays of cross-flow turbines to significantly reduce cost of energy.
2 Background
Consider a row of identical, straight-bladed, vertical-axis cross-flow turbines operating in a rectangular water channel. Neglecting the area of any support structures or fixturing, the array blockage ratio for such a system is given by
| (2) |
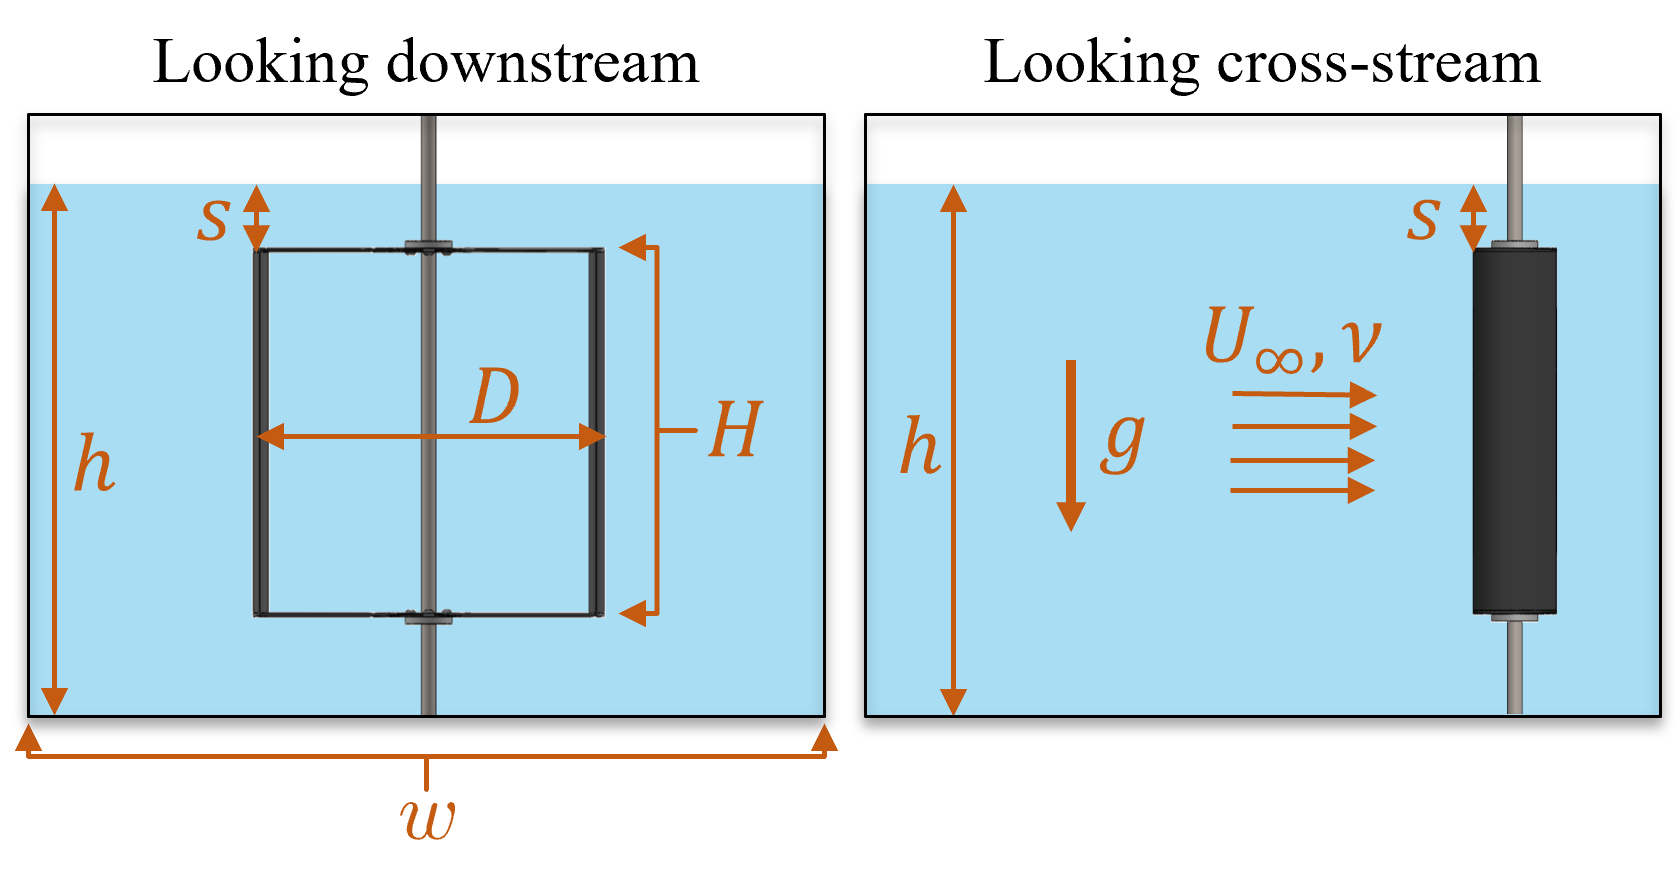
where is the number of turbines, is the rotor diameter, is the blade span, is the time-varying channel depth measured at the turbine’s axis of rotation, and is the channel width (Fig. 1). To characterize the array’s performance as a function of , there are two distinct approaches by which can be varied.
Approach 1: Fixed , variable
For a fixed array geometry, can be varied by changing the cross-sectional area of the channel. For both flumes and wind tunnels, it is possible, though logistically challenging, to reduce by changing channel width through the installation of intermediate partitions [17, 10, 11]. For flumes, is more easily altered by varying the water depth (). However, to experimentally isolate the effects of blockage on array performance while doing so, other non-dimensional flow parameters must be carefully controlled.
For example, consider an increase in achieved via a decrease in the water depth. This decrease in will simultaneously increase the depth-based Froude number,
| (3) |
where is the freestream velocity and is the acceleration due to gravity. The depth-based Froude number represents the balance between inertial forces in the flow and gravitational forces in the flow. The array’s proximity to the free surface will also change as is decreased, which can be represented by the normalized submergence, , where is the distance between the free surface and the top of the turbine rotors (Fig. 1). Both and have been shown to impact turbine performance [9, 21, 30, 31]. Therefore, if decreases, must be decreased to hold constant. Similarly, must be decreased (i.e., the rotors positioned dimensionally nearer to the free surface) to hold constant at this new water depth.
However, a decrease in will also decrease the Reynolds number, which here is defined with respect to the turbine diameter as
| (4) |
where is the kinematic viscosity. The Reynolds number represents the balance between inertial forces and viscous forces in the flow. The dependence of turbine performance on the Reynolds number is well documented [32, 33, 34, 9]. Although turbine performance becomes independent of the Reynolds number above a certain threshold, for cross-flow turbines this is difficult to achieve at laboratory scale without the use of compressed-air wind tunnels [32], so in most facilities, the Reynolds number must be held constant to isolate blockage effects. To compensate for the decrease in necessitated by holding constant, the kinematic viscosity can be increased by changing water temperature (). In this way, may be varied in water channels, while holding , , and constant, without the complications of intermediate partitions to adjust width.
Approach 2: Variable , fixed
Alternatively, can be varied by changing . For an array of straight-bladed cross-flow turbines, this can be achieved by changing , , and/or . However, as for the previous approach, experimental isolation of blockage effects can be complicated by unintended effects introduced by changing the turbine geometry or the number of turbines.
For example, if is increased by increasing the rotor diameter, several geometric and flow parameters are simultaneously varied. First, increasing decreases the chord-to-radius ratio, , which influences the flow curvature effects (e.g., virtual camber and virtual incidence) experienced by the blades [35]. Second, increasing also increases the diameter-based Reynolds number (4), and necessitates corresponding increases to and/or to hold constant across blockage cases. Finally, for a fixed-width channel, changing changes both the spacing between adjacent turbines as well as the proximity of the turbines at the ends of the array to the channel side walls. For proximity on the order of the blade chord length, this alters the hydrodynamic interactions between adjacent rotors [36] as well as the lateral boundary effects on array performance [28].
One could also increase by increasing the number of turbines on a cross-sectional transect. However, as for a change in , for a fixed-width channel the proximity between turbines and the channel side-walls decreases, producing the same changes to boundary effects as increasing diameter. Further, this introduces the potential for new turbine-turbine interactions, which are similar to turbine-wall interactions, but have an additional degree of freedom in the rotational phase of adjacent turbines [36, 29]. As a result, if the number of turbines in the array is changed, it can be difficult to separate the effects of blockage from those of intra-array interactions and boundary effects.
Conversely, if is increased by increasing only (and each rotors’ position in the water column is adjusted to hold the submergence depth constant), then only the rotor aspect ratio, , is simultaneously varied with . Given that this method varies fewer secondary parameters than either or , changing via alone is a conceptually attractive means of varying array blockage for fixed . However, this approach would only be effective at experimentally isolating blockage effects if the effects of changing aspect ratio on turbine performance are minor by comparison. Prior work by [37] has shown that the efficiency of a single turbine with blade-end struts at is invariant for , although the range of invariance likely depends on the type of support structure used (e.g., endplates, midspan struts) [38, 39] and may be different for high-blockage arrays. As is further decreased via a decrease in , it is hypothesized that hydrodynamic interactions between the blades and the support structures could become more prominent and alter performance.
In summary, for fixed , is best varied by changing the water depth in the channel, and for fixed , is best varied by changing the height of the rotors via the blade span. In this work, both methods are evaluated experimentally and compared.
3 Experimental Methods
| Target Blockage Condition | Nominal Flume Parameters | Nominal Non-Dimensional Flow Parameters | ||||||||
| (%) | (m) | (m) | (m/s) | (m) | [] | |||||
| 30.0 | 0.135 | 0.451 | 0.215 | 0.593 | 0.528 | 0.317 | 21.0 | 0.53 | 0.219 | |
| 33.4 | 0.406 | 0.534 | 0.501 | 0.257 | 23.3 | 0.48 | ||||
| 36.7 | 0.369 | 0.485 | 0.477 | 0.209 | 25.4 | 0.43 | ||||
| 40.1 | 0.338 | 0.445 | 0.457 | 0.169 | 27.3 | 0.38 | ||||
| 45.0 | 0.301 | 0.396 | 0.431 | 0.120 | 30.1 | 0.30 | ||||
| 50.0 | 0.271 | 0.356 | 0.409 | 0.080 | 32.6 | 0.22 | ||||
| 55.0 | 0.246 | 0.324 | 0.390 | 0.048 | 35.0 | 0.15 | ||||
| 45.0 | 0.203 | 0.451 | 0.322 | 0.593 | 0.528 | 0.210 | 21.0 | 0.35 | 0.219 | |
| 50.0 | 0.406 | 0.534 | 0.501 | 0.150 | 23.3 | 0.28 | ||||
| 55.0 | 0.369 | 0.485 | 0.477 | 0.102 | 25.4 | 0.21 | ||||
| 60.0 | 0.338 | 0.445 | 0.457 | 0.062 | 27.3 | 0.14 | ||||
3.1 Test Setup
Experiments were conducted in the Alice C. Tyler recirculating water flume at the University of Washington. The flume has a test section that is 0.76 m wide and 4.88 m long, and can accommodate water depths up to 0.60 m and flow speeds up to m/s. The flume is equipped with both a heater and chiller for temperature control, and can maintain water temperatures between and during operation.
The laboratory-scale array consists of two identical straight-bladed cross-flow turbines. The rotors are each two-bladed and have a diameter of 0.315 m, defined as the outermost circle swept by the turbine blades. Each blade has a NACA 0018 profile, a 0.0742 m chord length, and is mounted at a preset pitch angle as referenced from the quarter chord. The blades are attached to the central driveshaft of each rotor using thin, hydrodynamic blade-end struts (NACA 0008 profile, 0.0742 m chord length). The chord-to-radius ratio is 0.47 and the solidity is 0.15.
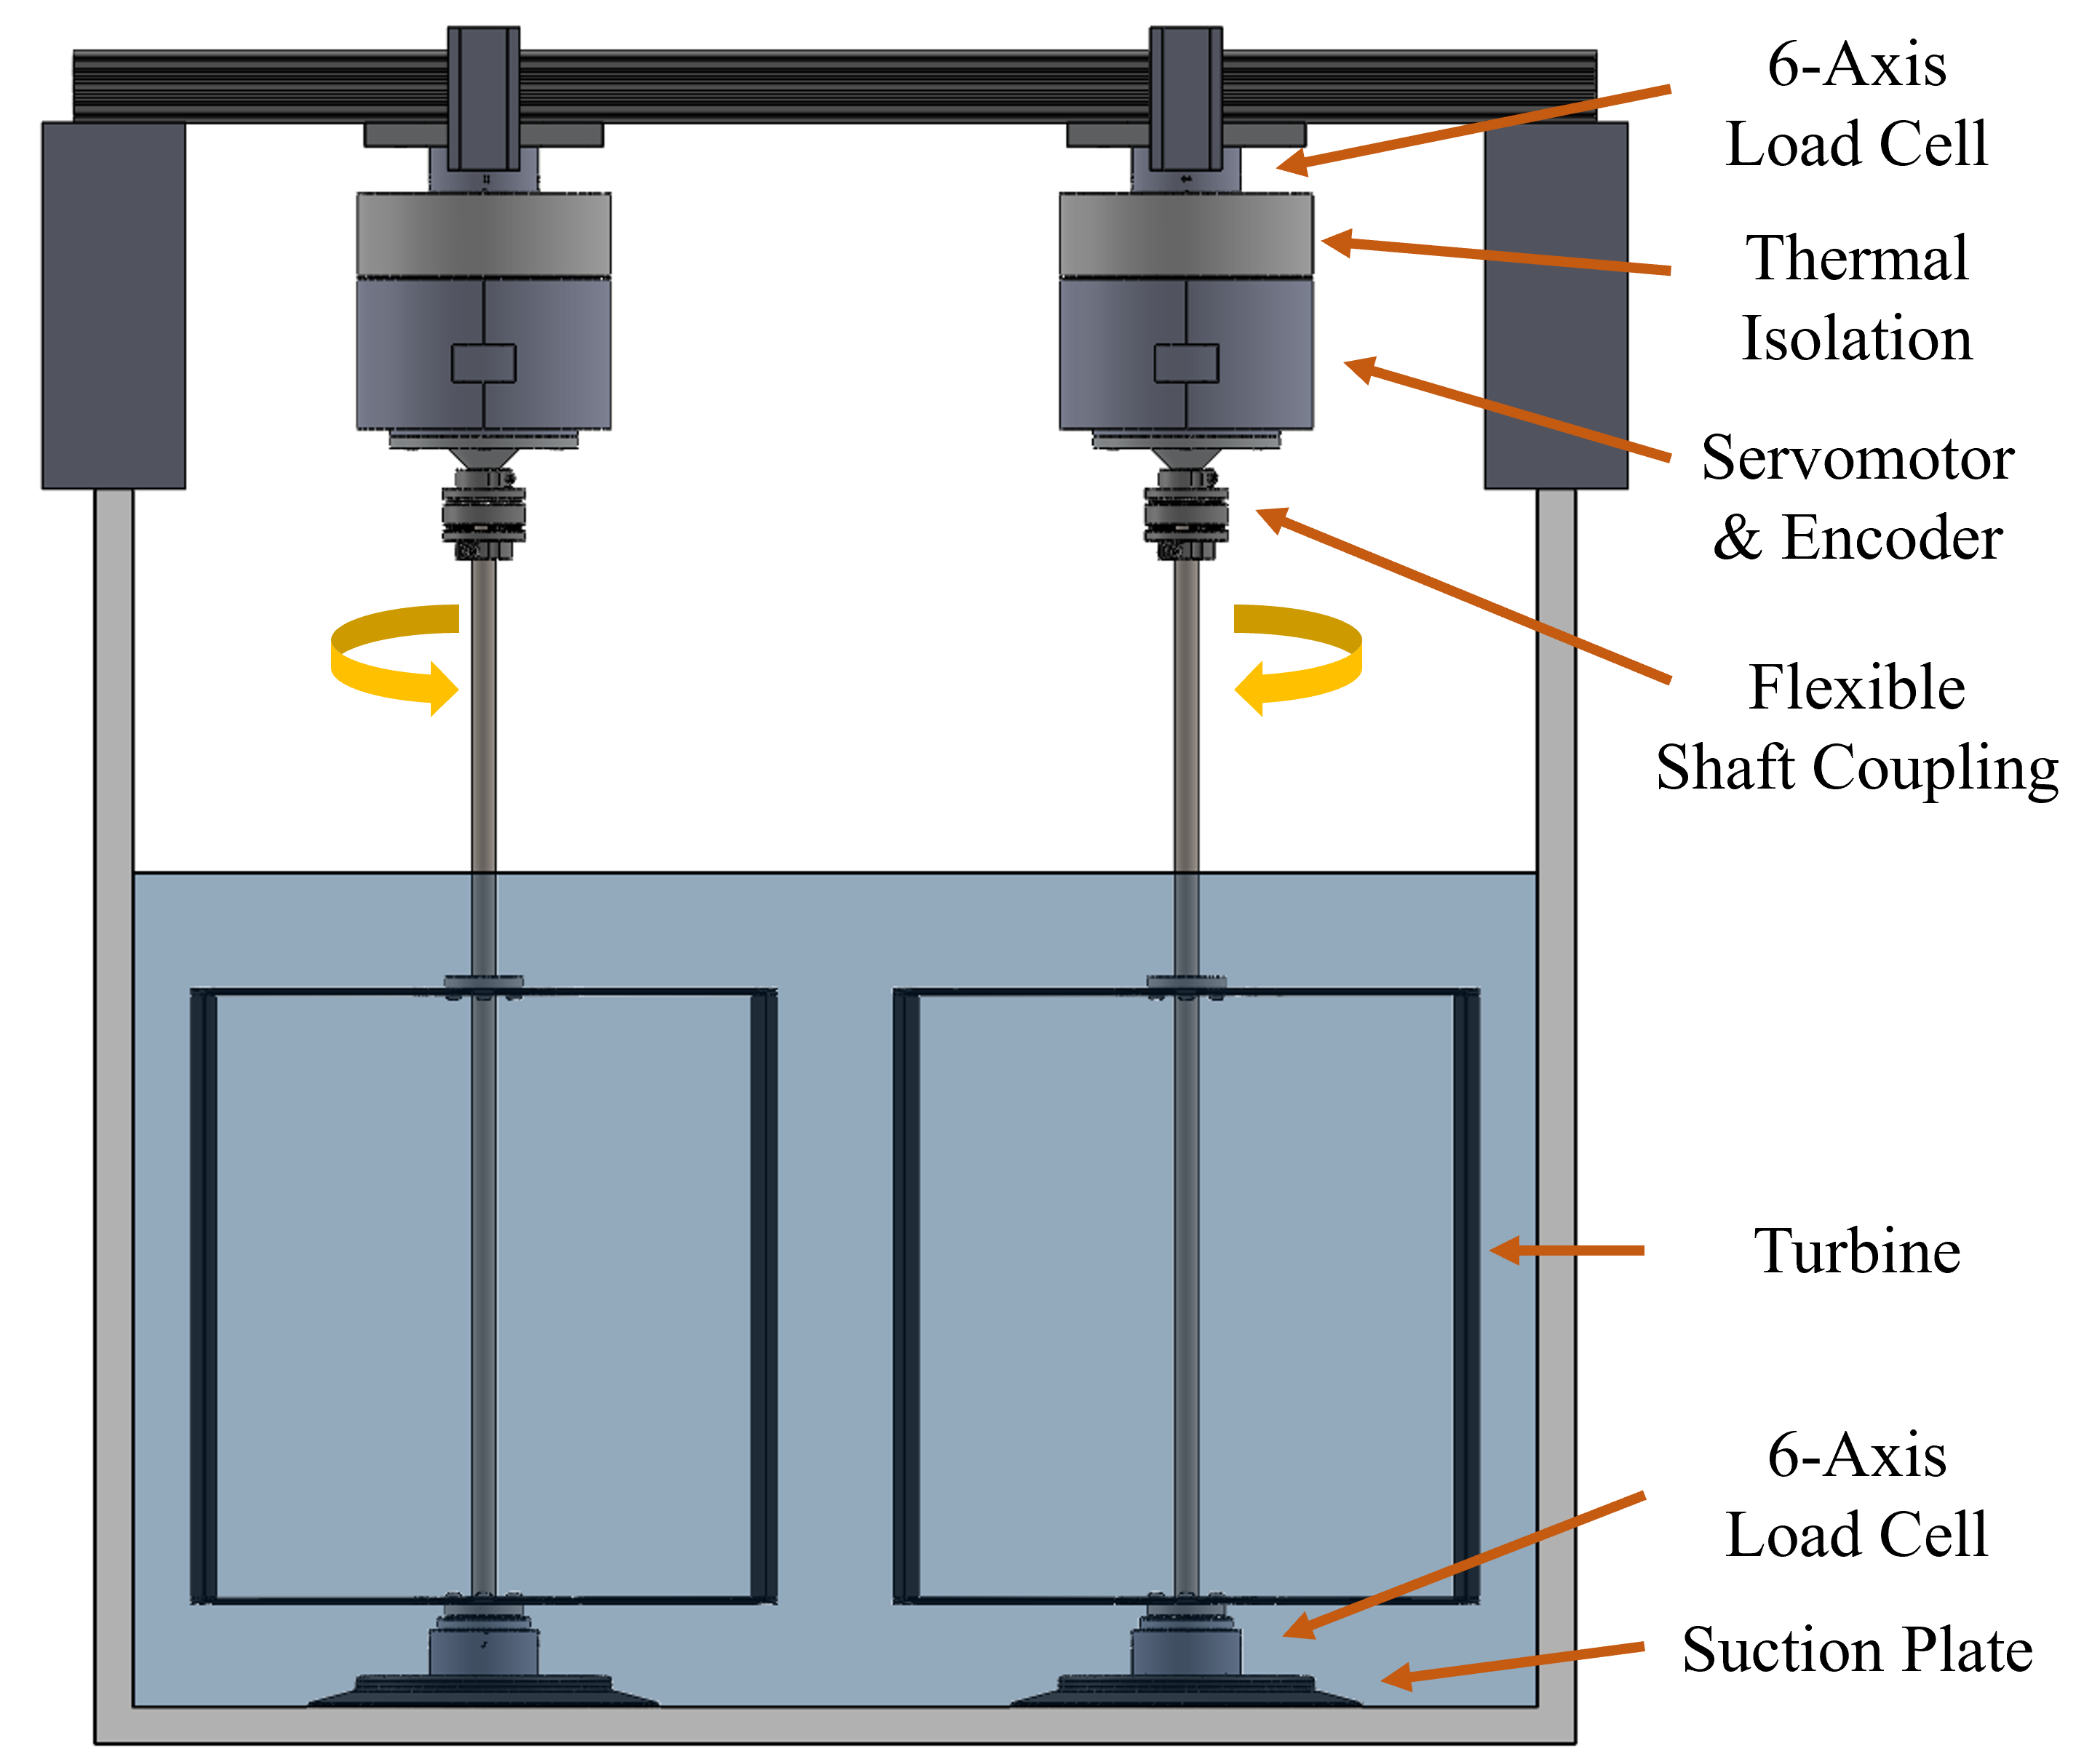
The two rotors are integrated into the experimental set-up shown in Fig. 2, which consists of two identical test-rigs. The top of each turbine’s central shaft is connected by a flexible shaft coupling (Zero-Max SC040R) to a servomotor (Yaskawa SGMCS-05BC341) which regulates the rotation rate of the turbine. The angular position of each turbine is measured via the servomotor encoder, from which the angular velocity is estimated. The bottom of each turbine’s central shaft sits in a bearing. The net forces and torques on each turbine are measured by a pair of 6-axis load cells: an upper load cell (ATI Mini45-IP65) mounted to the servomotor and fixed to a crossbeam, and a lower load cell (ATI Mini45-IP68) mounted to the bottom bearing and fixed to the bottom of the flume via a suction plate. Measurements from the load cells and servomotor encoders for both turbines are acquired synchronously at 1000 Hz in MATLAB using a pair of National Instruments PCIe-6353 DAQs.
The freestream velocity is measured using an acoustic Doppler velocimeter (Nortek Vectrino Profiler) sampling at 16 Hz. The velocimeter sampled a single cell positioned laterally in the center of the flume, vertically at the array midplane, and 5 turbine diameters upstream of the array centerline. Velocity measurements are despiked using the method of [40]. The water depth upstream of the array is measured at the center of the flume turbine diameters upstream of the array centerline by an ultrasonic free-surface transducer (Omega LVU 32) sampling at 1 Hz. The water temperature is measured using a temperature probe (Omega Ultra-Precise RTD) and maintained within of the target value during each experiment.
3.2 Test Matrix
Array performance is characterized at blockage ratios ranging from to using combinations of and . Table 2 summarizes the turbine geometries and flume conditions used to achieve each . Using two different blade spans, two values of are tested. For each value of , is varied by changing the water depth, with corresponding variations in and to maintain constant and across all experiments. To test whether the same characteristic performance is measured for arrays with identical , but different and , both the rotors and the rotors are tested at , , and blockage.
The values of and , which are held constant across all experiments, are constrained by the maximum at which the highest blockage arrays can be tested. This velocity, in turn, is constrained by rotor ventilation (i.e., air entrainment), the onset of which becomes more likely with decreasing and results in significant performance degradation due to an increase in form drag on the blades [21, 41]. As turbines at the highest blockages () necessarily operate close to the free surface, the maximum allowable for these cases is set such that any ventilation occurs well beyond the optimal performance point. While could be held constant across all experiments by adjusting the array submergence depth, preliminary experiments showed that varying has minimal effect on array performance until ventilation begins to occur. Therefore, we instead choose to maximize at each blockage so as to limit the risk of ventilation as much as possible.
3.3 Array Layout and Control
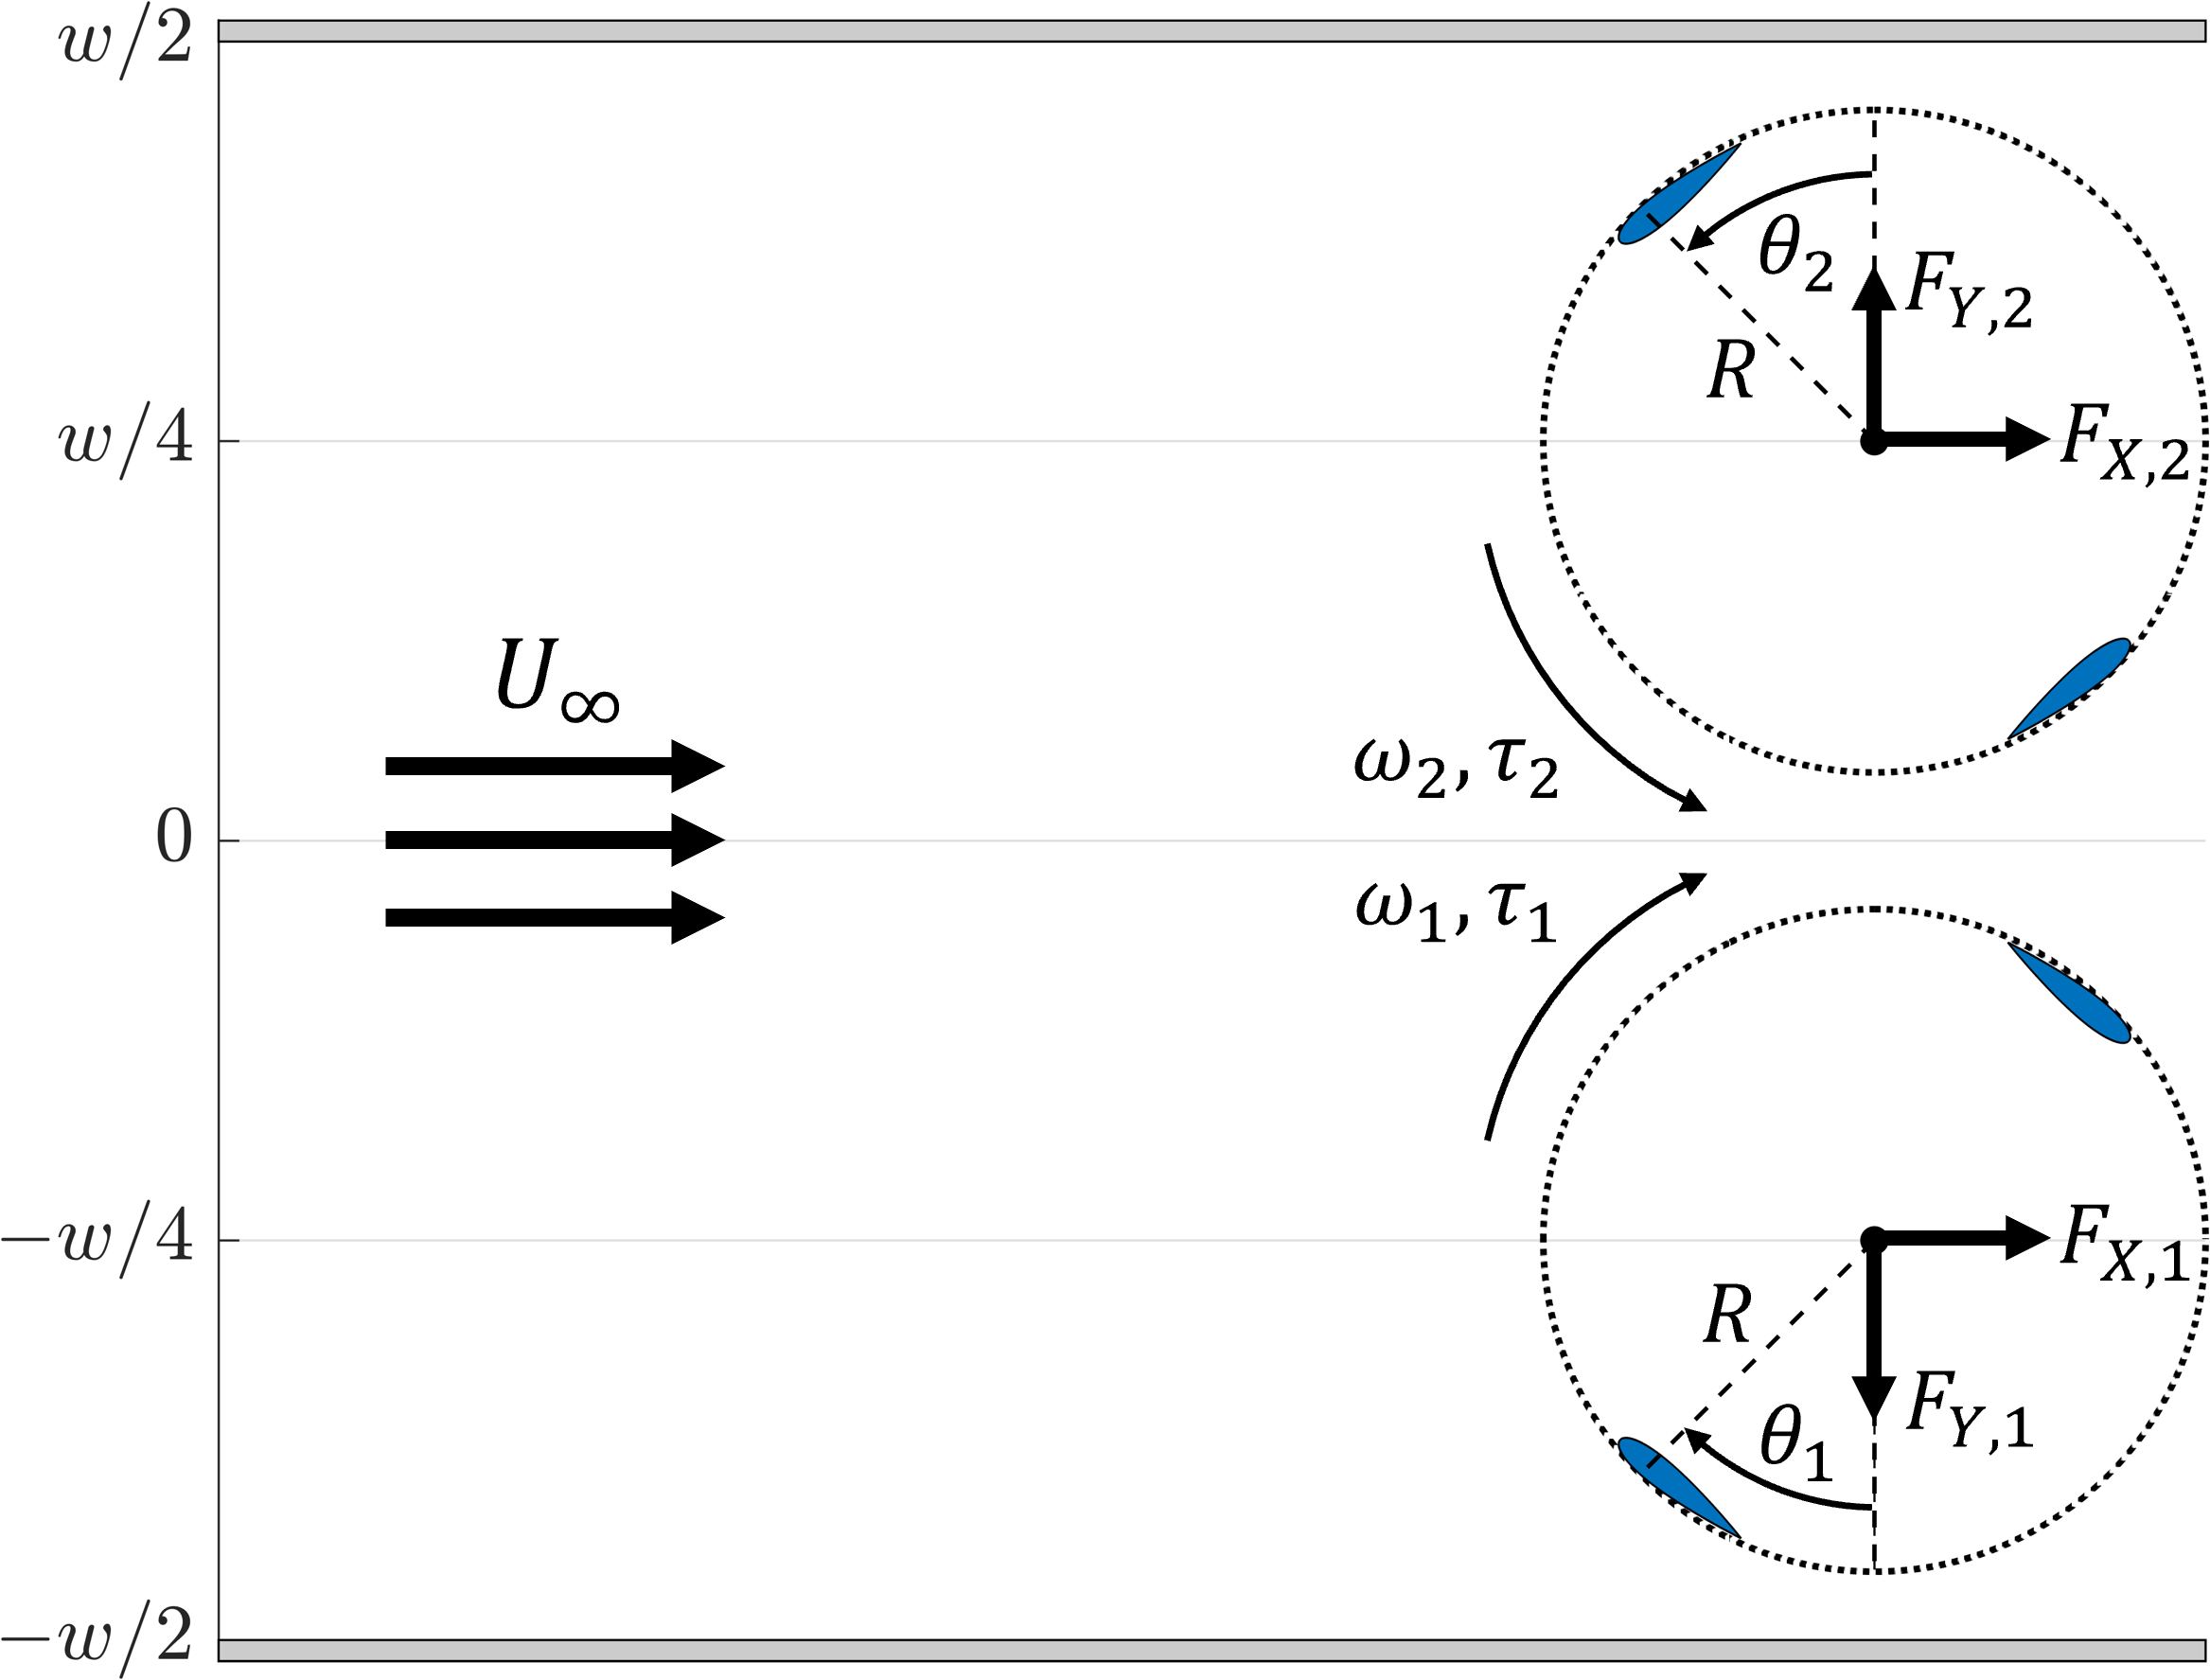
An overhead view of the array layout is shown in Fig. 3. The center-to-center spacing between the turbines is , and the array is positioned laterally such that the blade-to-blade spacing between adjacent turbines is twice the wall-to-blade spacing (i.e., the walls notionally correspond to symmetry planes in a larger array). The turbines in the array were operated under a counter-rotating, phase-locked scheme, wherein both turbines rotate at the same, constant speed, but in opposite directions, with a constant angular phase offset, , between them. This control strategy was achieved by specifying the angular velocities of the rotors, which yields similar time-average performance to an array with a constant control torque [42]. The turbines were counter-rotated such that the blades of adjacent rotors pass nearest each other while moving downstream, which has been shown to augment performance relative to other rotation schemes [43, 29]. We limit the present experiments to , an operating case in which the lateral forces and reaction torques for a pair of counter-rotating turbines are equal and opposite. A closed-loop controller maintained to within of the target value at all rotation rates across all experiments.
3.4 Performance Metrics
Performance metrics are calculated for individual turbines from the measured quantities shown in Fig. 3. The rotation rate, which is the same for both turbines, is non-dimensionalized as the ratio of the blade tangential velocity to the freestream velocity, or the tip-speed ratio
| (5) |
where is the angular velocity of the turbine and is the turbine radius. Data are collected at each tip-speed ratio for 60 seconds, and the time series is cropped to an integer number of turbine rotations before performance metrics are calculated.
The efficiency (formally, the coefficient of performance) of each turbine is the mechanical power produced normalized by the kinetic power in the freestream flow that passes through the turbine’s projected area
| (6) |
where and are the angular velocity and hydrodynamic torque on turbine , and is the density of the working fluid. The efficiency of each turbine is a function of the power produced by its blades and power losses due to parasitic torque on its blade support structures; in this case, blade-end struts. Because a constant set of blade-end struts is used for all experiments (i.e., the thickness of the struts is not scaled as the blade span is changed), the relative impact of these parasitic torques on turbine efficiency is larger for turbines with shorter blades (i.e., smaller as in Table 2). To account for this, we utilize the approach of [44, 38] to estimate a blade-level for each turbine (i.e., the efficiency of the turbine blades in the absence of the support structures) via superposition as
| (7) |
where is the measured efficiency of the full turbine , and is the measured efficiency of turbine with no blades attached.
Structural loads on each turbine are characterized via the thrust and lateral force coefficients, respectively given as
| (8) |
| (9) |
where and are the streamwise force and lateral force, respectively, on turbine . To estimate blade-level loading for each turbine in the array, we apply superposition equations for and analogous to that given for in (7). However, we note that, unlike for , the validity of this approach for estimating blade-level and has not been examined in the existing literature.
Since the turbines in this array are identical, the array-average performance metrics are obtained simply as the average of the individual turbine performance metrics. For example, is simply the average of and for the full turbine, and the average of and at the blade-level. As noted in Section 3.3, the net lateral force on this array of two identical counter-rotating turbines is zero since when , the array is symmetric about its centerline. However, by defining the directions of and with this counter-rotation in mind as in Fig. 3, the array-average of is nonzero and represents the average lateral force coefficient experienced by an individual rotor.
4 Results and Discussion
4.1 Non-dimensional Parameters
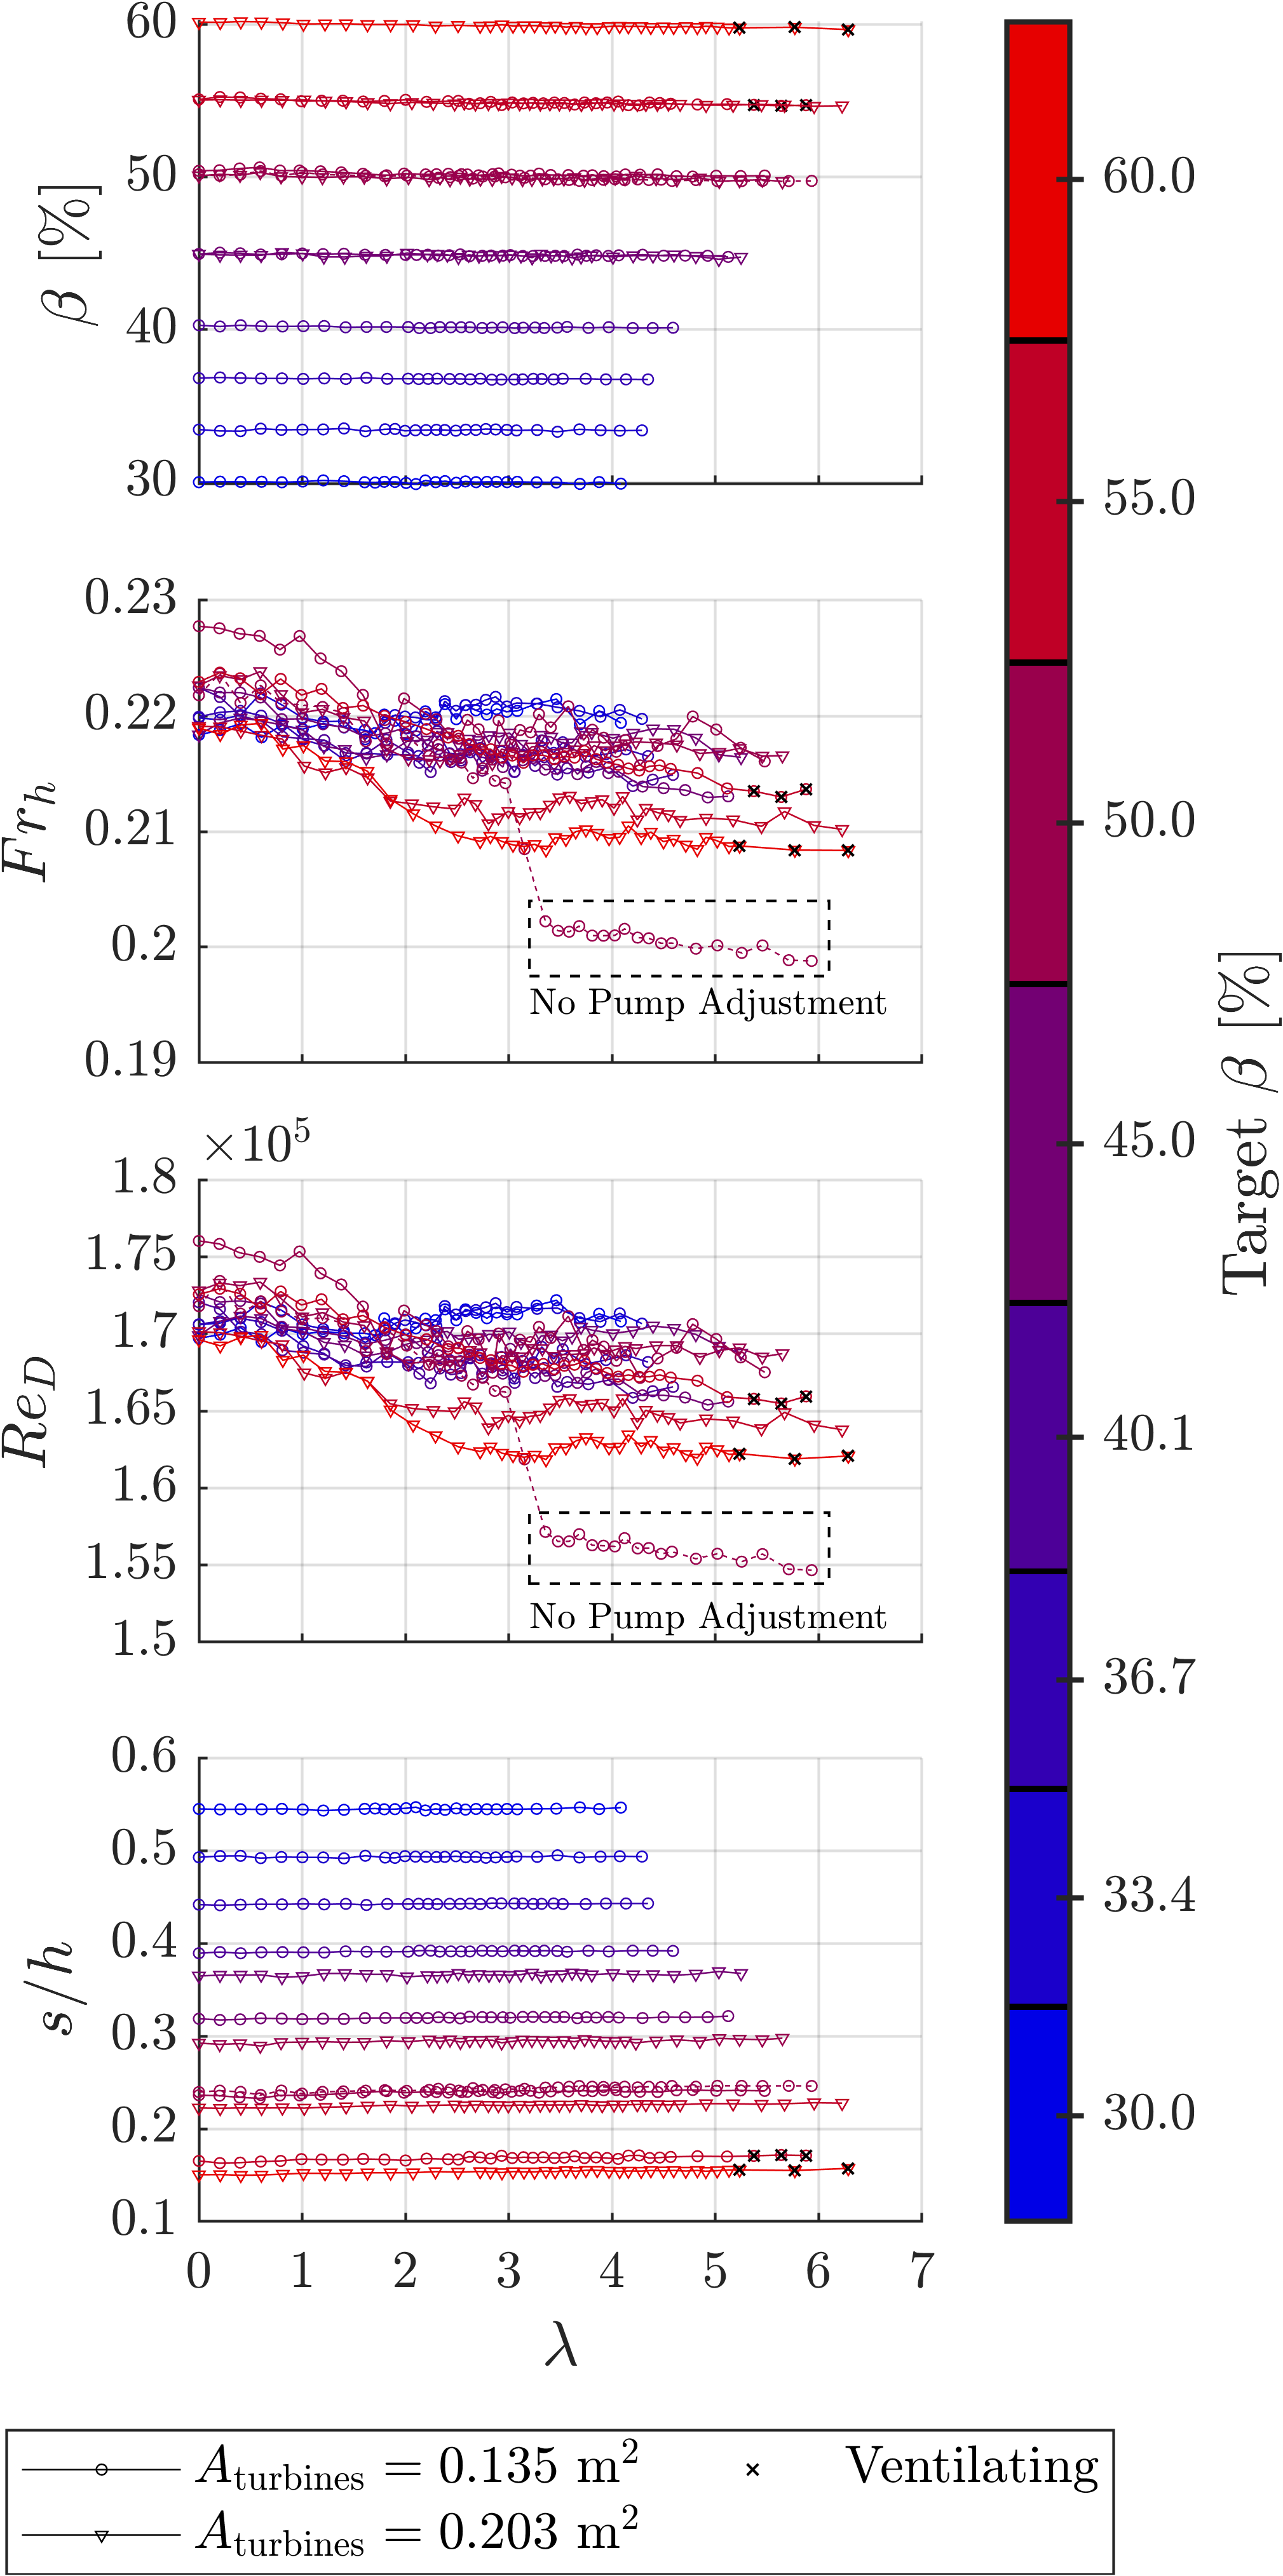
The time-averaged measured values of , , , and at each tip-speed ratio are shown in Fig. 4. Across all experiments, the measured are within of the target values in Table 2, and the measured and do not deviate more than from the nominal values in Table 2. However, all of these parameters vary slightly with due to turbine-channel interactions. As increases, the array presents greater resistance to the flow, causing a reduction of the upstream freestream velocity and a rise in the upstream free surface, followed by a drop in the free surface across the turbines as the flow accelerates through the rotors. This causes , and as measured upstream of the turbine to decrease slightly with , and as measured upstream of the turbine to increase slightly with . Most of the variation in these parameters associated with turbine-channel interaction occurs for (Fig. 4). Rotor ventilation occurred only for the highest tip-speed ratios at the highest for each , during which the turbine blades pierced the free surface during their downstream sweep. The turbine-channel interaction did not affect the turbulence intensity, which was for all test conditions.
During operation, the actual and in the flume are a function of the volume of water in the flume, the pump drive frequency, and the resistance to flow imposed by the turbines (primarily a function of their rotation rate). It is theoretically possible to hold and truly constant across all cases by adjusting the static water depth or pump drive frequency at each set-point to compensate for the array’s effect on the flow. However, the trial-and-error iteration required to achieve this would be experimentally intractable. Therefore, for each target blockage, we choose to set the flume fill and pump frequency to that which achieves the nominal and when no turbines are present, and report the variation in these non-dimensional parameters during experiments as in Fig. 4. However, for the case of and a step-change in was observed near , resulting in corresponding sharp decreases in and (indicated by the dashed black boxes in Fig. 4). As this step-change was repeatable and only observed for this configuration, we attribute this to a unique interaction between the flume and the turbines under these conditions. Consequently, for this case only, the pump drive frequency was increased halfway through the test to counteract the velocity reduction and maintain similar and to that measured in the rest of the experiments (Fig. 4).
4.2 Array Performance
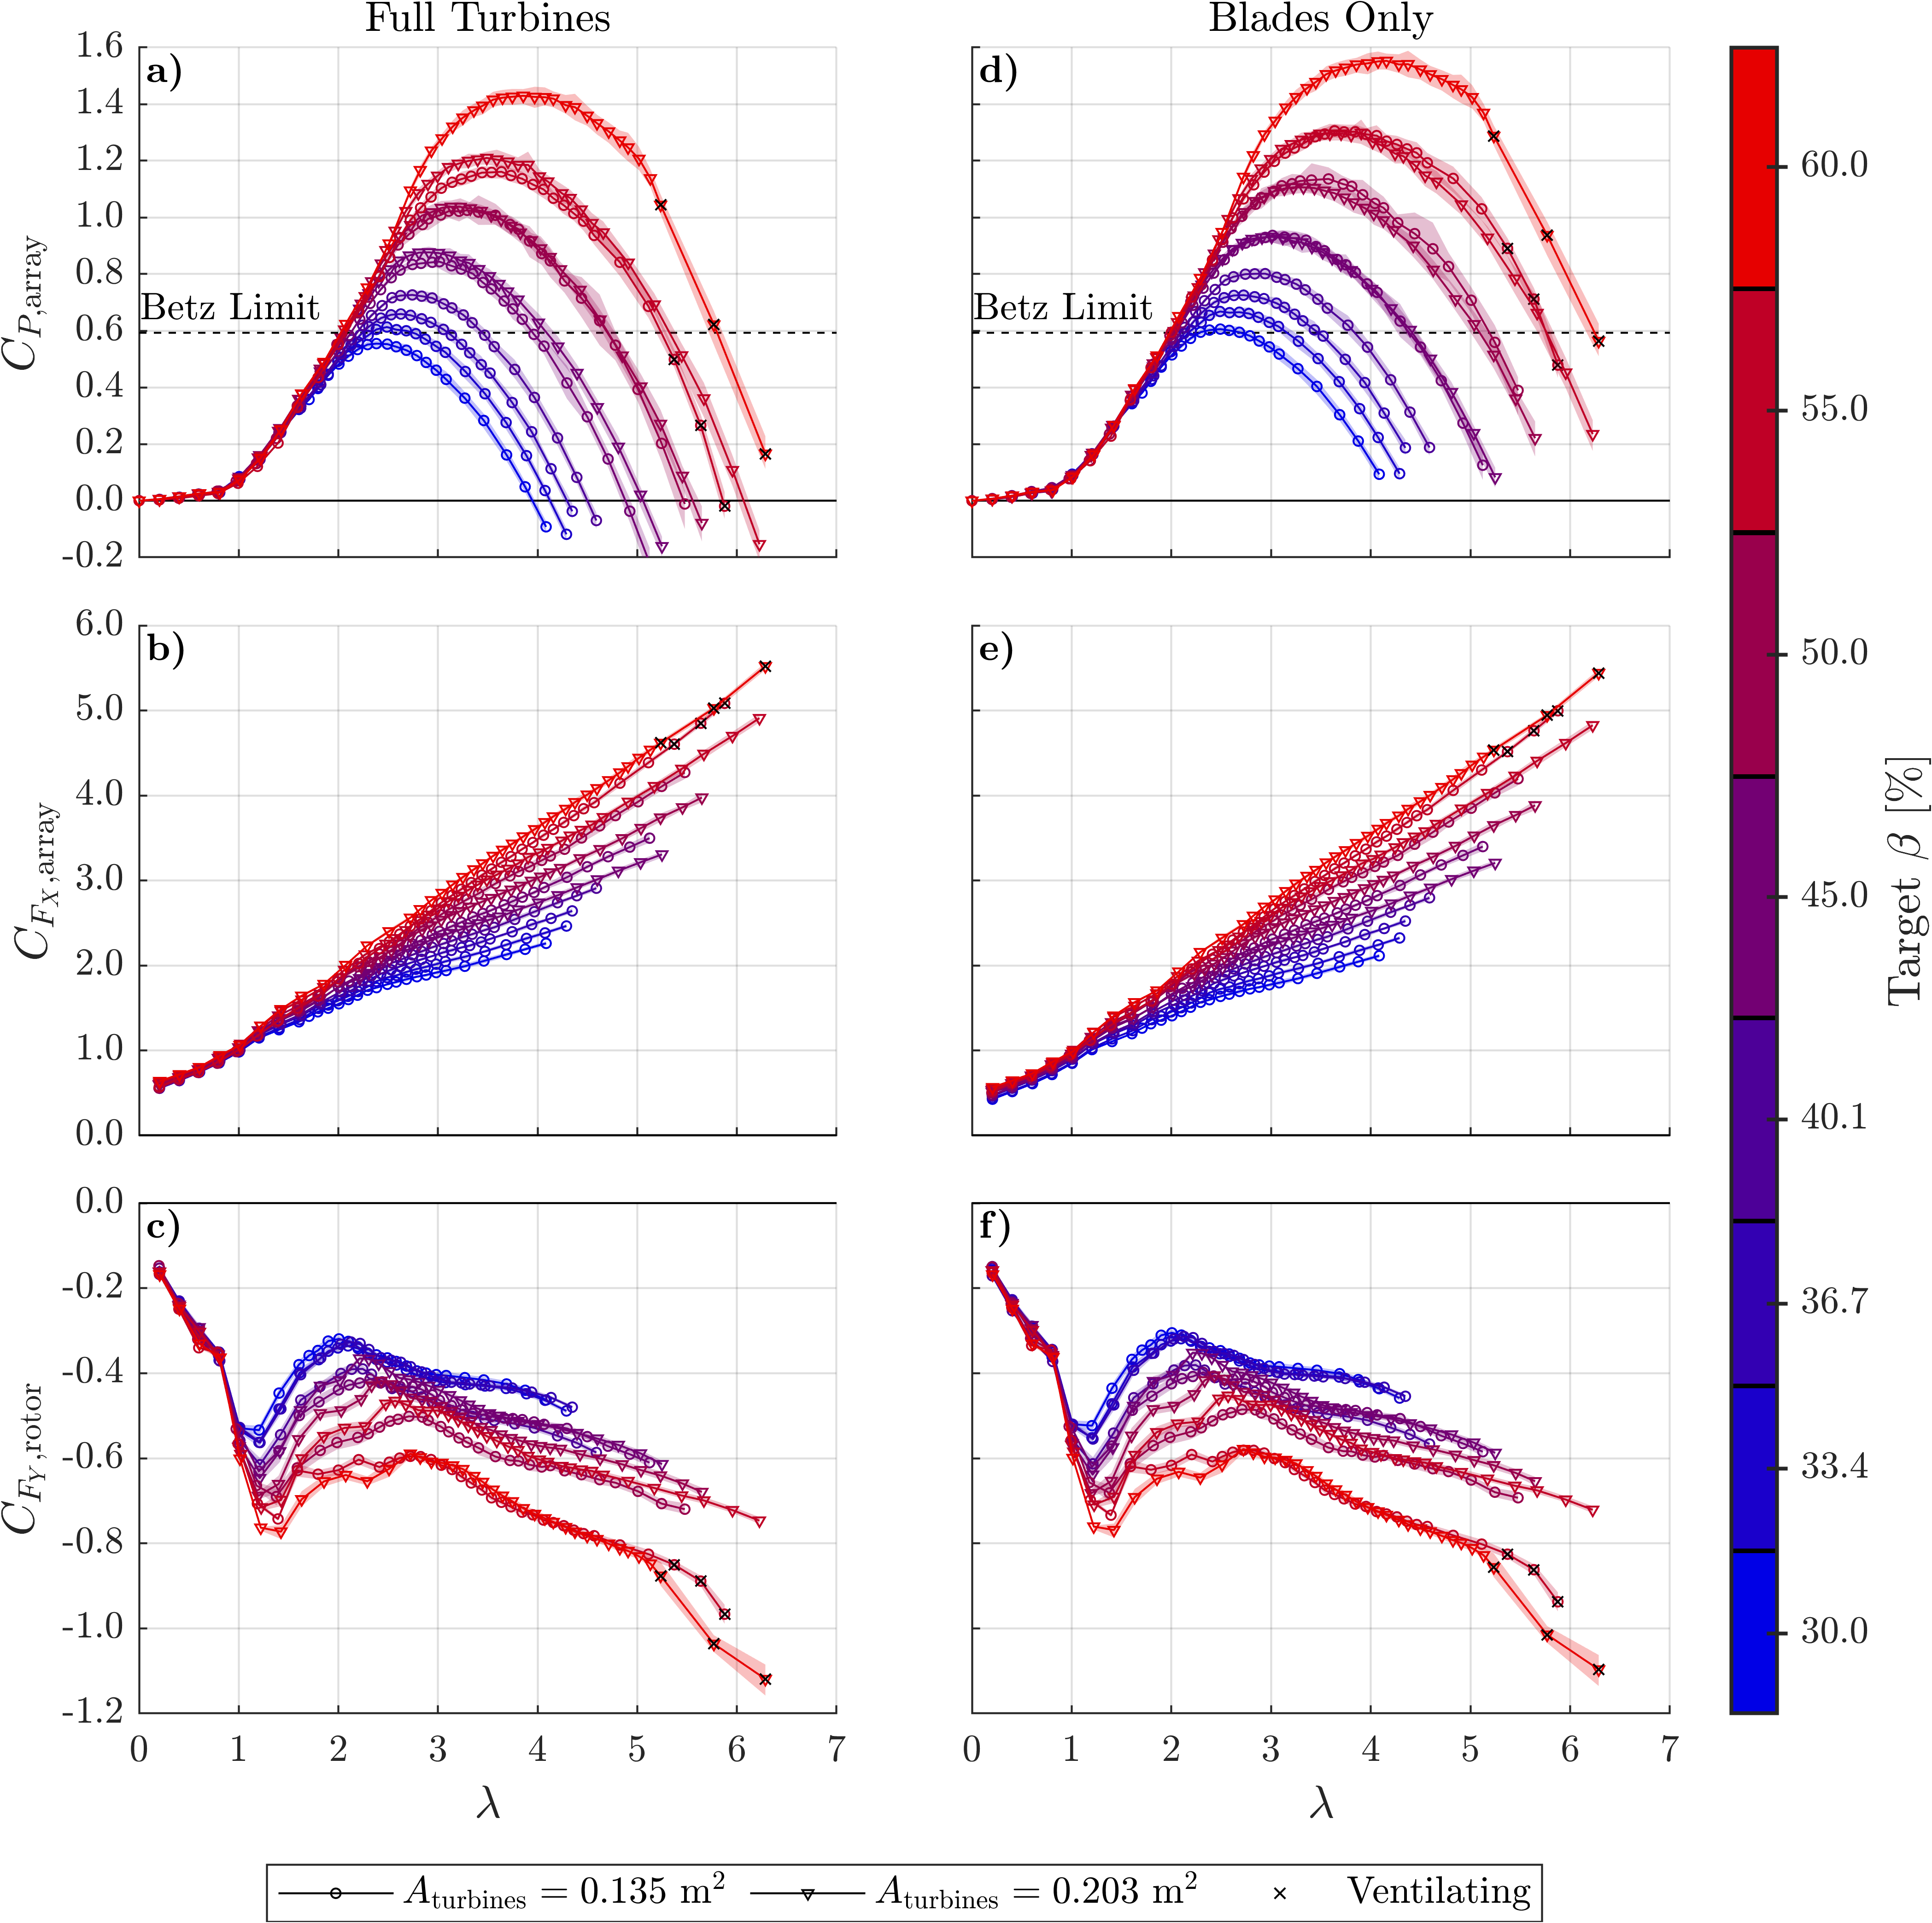
Fig. 5a shows the time-averaged array-average efficiencies as a function of and . In agreement with prior work, tends to increase as the array blockage ratio is increased. This trend is primarily observed for ; at lower , does not vary significantly with blockage. Additionally, as increases the array produces power over a broader range of tip-speed ratios, and the at which maximum occurs increases. Beginning at , exceeds the Betz limit [7] and, at , values of begin to exceed unity. Such efficiencies are not violations of energy conservation since the definition of given in (6) considers only the kinetic power that passes through the rotor plane. This definition neglects the available power associated with the fluid’s potential energy, which is appreciably drawn down as and thrust increase. Given the relevance of both the freestream kinetic and potential energy for high-confinement arrays, a more representative efficiency metric may resemble the hydraulic efficiency of a hydropower turbine, in which the available power is a function of volumetric flow rate and net head. However, for comparison with prior studies, the conventional definition of is used here.
Time-averaged and are shown in Fig. 5b and Fig. 5c, respectively. As expected from theory and supported by prior work, the array-average thrust coefficient increases as the blockage ratio is increased. Similarly, the magnitude of the lateral force coefficient (which is seldom reported for cross-flow turbines in the literature) also tends to increase with . As for efficiency, and do not vary significantly with blockage at low tip-speed ratios ().
As mentioned in Section 4.1, ventilation of the turbine rotors occurred only at high for the highest tested for each . At these test points, which are well beyond the maximum efficiency point, foil drag due to ventilation amplifies the decreases in and increases in and .
4.3 Blade-level performance
For , , and , the results in Fig. 5a-c show that even when and are held constant, achieving the same via different values of and yields similar, but not identical, performance. We attribute this to the relative difference in support structure losses and forces between the two cases. The configuration uses shorter blades than the configuration, but identically sized blade support structures and fixturing. Therefore, any parasitic torque or drag forces associated with these supports are normalized by a smaller projected area when power and force coefficients are calculated. This results in lower power coefficients and higher force coefficients for the configuration than for the configuration.
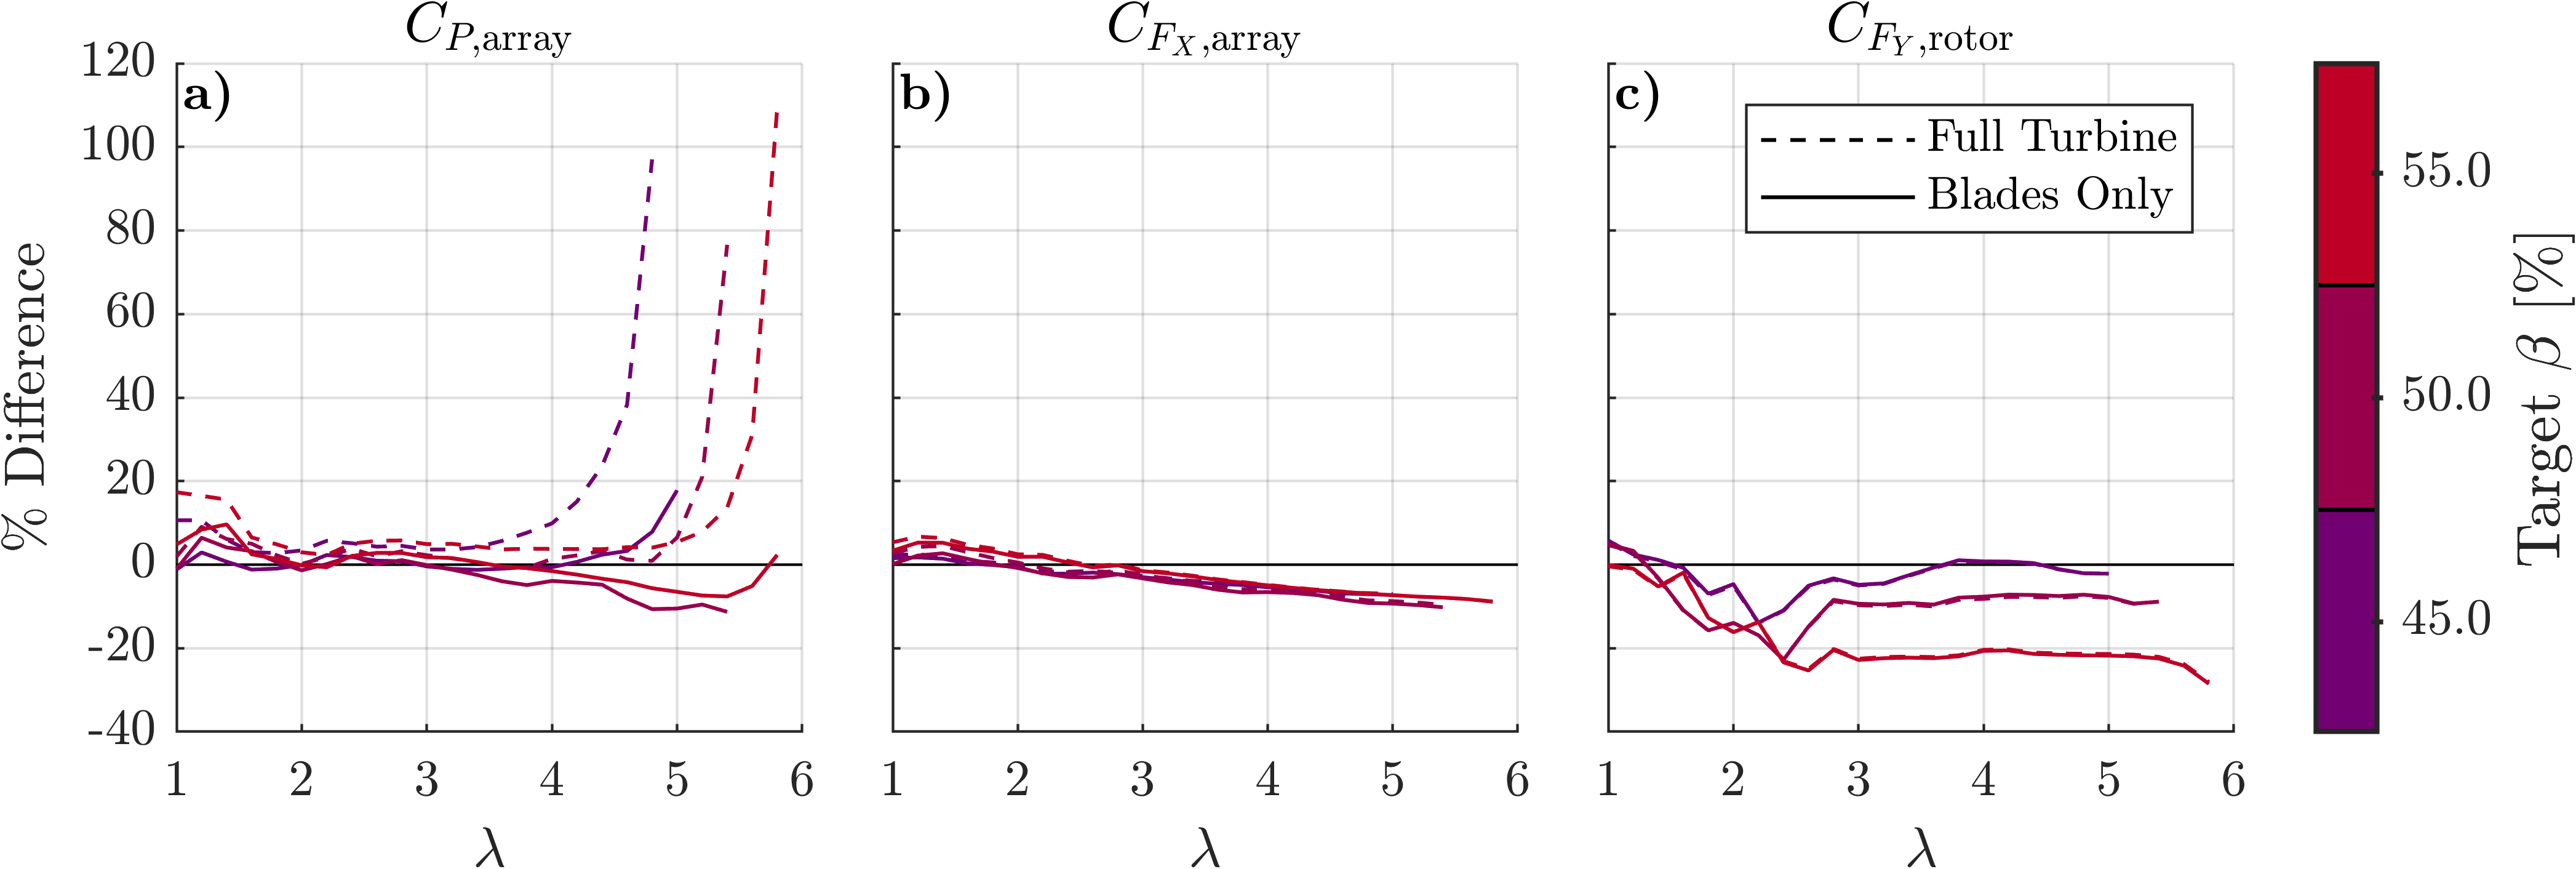
To account for disparities in between the different configurations tested at , , and , we subtract support structure losses () via (7) to estimate the associated with the blades only, the results of which are given in Fig. 5d. The agreement in full turbine and blade-only between the two configurations at each blockage is shown in Fig. 6a. For , subtracting improves agreement between the two configurations at all . For , subtracting improves agreement in between the two configurations up to , but agreement worsens for . Similarly, for , subtracting improves agreement in up to , but agreement worsens for .
We attribute the poorer agreement in blade-only at high and to the difficulty of estimating representative in the absence of the turbine blades. As described in Section 3.4, is estimated by testing an array of bladeless turbines at the same nominal , , and as the array of full turbines. However, the array of bladeless turbines does not influence the flow field in the same way that the array of full turbines does. Specifically, as and are increased, the thrust on the array increases, resulting in a free surface drop across the rotors and acceleration of the flow bypassing the array. These changes to the flow field are absent for an array of bladeless turbines. Consequently, we hypothesize that the superposition technique in (7) breaks down at higher and , where turbine-channel interactions are most significant. Despite these limitations, it is remarkable that (7) improves agreement at any for , , and given that appreciable turbine-channel interactions are observed at these blockage ratios for lower values of .
Blade-only and are similarly estimated via analogous equations to (7), the results of which are shown in Fig. 5e and Fig. 5f. Unlike for , subtracting and does not meaningfully change the agreement in or between the two configurations at , , or for any , implying that the forces on the blades dominate the forces on the support structures. Additionally, as highlighted in Fig. 6b and Fig. 6c, the difference in the force coefficients between the two configurations does not change significantly at high (unlike ). As before, we hypothesize that the lack of force coefficient agreement between turbines with different aspect ratios is due to differences between the flow fields experienced by the support structures when blades are present versus when blades are absent. Further investigation into techniques for estimating blade-only force coefficients is warranted, but is outside the scope of the present study.
4.4 Evaluation of approaches for varying blockage
As both of the blockage-varying approaches from Section 2 were utilized in the present experiments, we now consider the advantages and disadvantages of implementing each approach.
Variation of via changing the water depth was used to achieve with and with . The blockages testable with each were constrained by the relative sizes of the flume and the turbines, as well as the physical limitations of the test facility. In the Tyler flume, the minimum testable blockage for each was set by the maximum dynamic channel depth of 0.60 m, above which overtopping of the flume walls occurs. The maximum testable blockage was constrained by the ventilation risk associated with low : the lower the water depth, the higher the that can be achieved, but the closer the turbines are to the surface the greater the risk of ventilating. However, as described in Section 2, the range of testable blockages was further constrained to the water depths at which and could be matched across all tests via corresponding adjustments to the freestream velocity and water temperature. Critically, temperature control is required to avoid convolving blockage effects with variations in the Reynolds number; as many flumes do not have this capability, this is a general limitation of the variable- approach unless Reynolds-independent performance can be achieved. In the present study, the relatively wide range of temperatures achievable in the Tyler flume enabled careful control of non-dimensional flow parameters and an effective isolation of blockage effects. Even so, the duration of each experiment was extended by the need to adjust the flume fill and water temperature for each test.
Given the facility requirements of the variable- approach, the present experiments also explored how could be varied at fixed through variation in . For example, as shown in Table 2, array blockage ratios of 40.1% and 60.0% were achieved simply by testing arrays with and at the same nominal water depth (and thus same nominal ). Since the water depth was unchanged, testing different blockages was convenient and fast since no adjustments to the freestream velocity or temperature were necessary. In a general case, if no secondary effects are introduced by changing , then the range of testable blockages at a given facility using this approach would be constrained only by 1) the minimum and maximum blade spans available, and 2) ventilation risk at the highest blockages.
However, as shown in Fig. 5, turbines tested at similar , , and , but different and , exhibit small, but appreciable differences in power and force coefficients. The superposition-based support structure subtraction techniques for reconciling these differences begin to break down for at high and , and do not have any effect on disagreements in or across . While, for these experiments, the disparities in , and between the different are small relative to the overall blockage effects, the scale of these disparities likely depends on the specific blade spans and support structures used [38, 37, 39]. Consequently, interpreting trends in blockage effects obtained via a variable- approach requires better models for support structure effects than simple experimental superposition. The uncertainty associated with the variable- approach can only be quantified by changing at constant , as was performed in this study at , , and . To do so while holding and constant requires either a facility with temperature control or a facility capable of velocities of m/s to achieve Reynolds independence. Consequently, the facility requirements for fully interpreting results obtained via the variable- method negate the principal advantage of this method. Therefore, the variable- fixed- approach is most robust.
5 Conclusion
In this work, we explored two experimental methods for characterizing the effects of blockage ratio on the performance of an array of two, straight-bladed cross-flow turbines operating in a water channel. For fixed and variable , the blockage ratio is most easily varied by changing the water depth, with corresponding changes in the freestream velocity and temperature to hold the Reynolds number and Froude numbers constant. For fixed and variable , the blockage ratio is most appropriately varied by changing the blade span, as several secondary effects are introduced if the turbine diameter or number of turbines are changed. A laboratory-scale array operating at blockages between 30% and 60% is tested using both approaches. While similar trends in efficiency and force are observed regardless of approach, the values of the array-average performance and force coefficients vary with the method used to achieve a particular . For future experimental studies focusing on blockage effects, we recommend that the blockage ratio is varied by changing with fixed while holding the Reynolds and Froude numbers constant. Although this method requires the use of a flume with temperature control or the ability to achieve Reynolds-invariant turbine performance, we find that it was the most robust approach since changes in blade-support structure interactions associated with changes in can be difficult to quantify.
We recommend that future studies investigate more robust methods for estimating the parasitic losses and drag forces of turbine blade support structures such that blade-only efficiency and force coefficients can be better estimated at high blockage and tip-speed ratio, allowing more accurate comparisons of blockage effects to be drawn across turbines. The development of such a method would improve the reliability of the fixed- variable- experimental approach, and facilitate studies of blockage effects at a wider range of test facilities. Additionally, as ventilation was a constraint on experimental design for both experimental methods, future work should evaluate how the onset and effects of ventilation are influenced by the blockage ratio, the Froude number, and the normalized submergence depth.
Acknowledgement
The authors would like to thank Gregory Talpey and Gemma Calandra for their assistance in commissioning the high-blockage test-rig, as well as help with data collection. The authors would also like to thank Abigale Snortland for several insightful discussions regarding support structure torque and force subtraction techniques.
References
- [1] Chris Garrett and Patrick Cummins “The efficiency of a turbine in a tidal channel” In Journal of Fluid Mechanics 588, 2007, pp. 243–251 DOI: 10.1017/S0022112007007781
- [2] Claudio A. Consul, Richard H.J. Willden and Simon C. McIntosh “Blockage effects on the hydrodynamic performance of a marine cross-flow turbine” Publisher: Royal Society In Philosophical Transactions of the Royal Society A: Mathematical, Physical and Engineering Sciences 371.1985, 2013, pp. 20120299–20120299 DOI: 10.1098/rsta.2012.0299
- [3] Guy Tinmouth Houlsby and Christopher Reiner Vogel “The power available to tidal turbines in an open channel flow” In Proceedings of Institution of Civil Engineers: Energy 170.1, 2017, pp. 12–21 DOI: 10.1680/jener.15.00035
- [4] Ross Vennell “Tuning turbines in a tidal channel” Publisher: Cambridge University Press In Journal of Fluid Mechanics 663, 2010, pp. 253–267 DOI: 10.1017/S0022112010003502
- [5] Takafumi Nishino and Richard H.. Willden “The efficiency of an array of tidal turbines partially blocking a wide channel” In Journal of Fluid Mechanics 708, 2012, pp. 596–606 DOI: 10.1017/jfm.2012.349
- [6] J. Schluntz and R… Willden “The effect of blockage on tidal turbine rotor design and performance” In Renewable Energy 81, 2015, pp. 432–441 DOI: 10.1016/j.renene.2015.02.050
- [7] Tony Burton, Nick Jenkins, David Sharpe and Ervin Bossanyi “Wind Energy Handbook, Second Edition” Publication Title: Wind Energy Handbook, Second Edition Wiley, 2011 DOI: 10.1002/9781119992714
- [8] A.. Bahaj, A.. Molland, J.. Chaplin and W… Batten “Power and thrust measurements of marine current turbines under various hydrodynamic flow conditions in a cavitation tunnel and a towing tank” In Renewable Energy 32.3, 2007, pp. 407–426 DOI: 10.1016/j.renene.2006.01.012
- [9] Hannah Ross and Brian Polagye “Effects of dimensionless parameters on the performance of a cross-flow current turbine” In Journal of Fluids and Structures 114, 2022, pp. 103726 DOI: 10.1016/j.jfluidstructs.2022.103726
- [10] L. Battisti et al. “Aerodynamic Measurements on a Vertical Axis Wind Turbine in a Large Scale Wind Tunnel” In Journal of Energy Resources Technology 133.3, 2011 DOI: 10.1115/1.4004360
- [11] Vincenzo Dossena et al. “An Experimental Study of the Aerodynamics and Performance of a Vertical Axis Wind Turbine in a Confined and Unconfined Environment” In Journal of Energy Resources Technology 137.5, 2015 DOI: 10.1115/1.4030448
- [12] H. Glauert “Airplane Propellers” In Aerodynamic Theory: A General Review of Progress Under a Grant of the Guggenheim Fund for the Promotion of Aeronautics Berlin, Heidelberg: Springer, 1935, pp. 169–360 DOI: 10.1007/978-3-642-91487-4˙3
- [13] E.C. Maskell “A Theory of the Blockage Effects on Bluff Bodies and Stalled Wings in a Closed Wind Tunnel”, 1963 URL: https://apps.dtic.mil/sti/pdfs/ADA955243.pdf
- [14] G. Houlsby, S. Draper and M. Oldfield “Application of linear momentum actuator disc theory to open channel flow” Edition: Accepted Manuscript Version Number: Accepted Manuscript, 2008 URL: https://ora.ox.ac.uk/objects/uuid:5576d575-7bac-44b6-ac79-f698edcda40e
- [15] J.. Whelan, J… Graham and J. Peiró “A free-surface and blockage correction for tidal turbines” Publisher: Cambridge University Press In Journal of Fluid Mechanics 624, 2009, pp. 281–291 DOI: 10.1017/S0022112009005916
- [16] Hannah Ross and Brian Polagye “An experimental assessment of analytical blockage corrections for turbines” In Renewable Energy 152, 2020, pp. 1328–1341 DOI: 10.1016/j.renene.2020.01.135
- [17] R.A. McAdam, G.T. Houlsby, M.L.G. Oldfield and M.D. McCulloch “Experimental testing of the transverse horizontal axis water turbine” In IET Renewable Power Generation 4.6, 2010, pp. 510 DOI: 10.1049/iet-rpg.2009.0194
- [18] T.. Chen and L.. Liou “Blockage corrections in wind tunnel tests of small horizontal-axis wind turbines” In Experimental Thermal and Fluid Science 35.3, 2011, pp. 565–569 DOI: 10.1016/j.expthermflusci.2010.12.005
- [19] Ian Ross and Aaron Altman “Wind tunnel blockage corrections: Review and application to Savonius vertical-axis wind turbines” In Journal of Wind Engineering and Industrial Aerodynamics 99.5, 2011, pp. 523–538 DOI: 10.1016/j.jweia.2011.02.002
- [20] Timothy A. Burdett and Kenneth W. Van Treuren “Scaling Small-Scale Wind Turbines for Wind Tunnel Testing” American Society of Mechanical Engineers Digital Collection, 2012, pp. 811–820 DOI: 10.1115/GT2012-68359
- [21] Amir Hossein Birjandi, Eric Louis Bibeau, Vijay Chatoorgoon and Anurag Kumar “Power measurement of hydrokinetic turbines with free-surface and blockage effect” Publisher: Elsevier In Ocean Engineering 69, 2013, pp. 9–17 DOI: 10.1016/j.oceaneng.2013.05.023
- [22] S. McTavish, D. Feszty and F. Nitzsche “An experimental and computational assessment of blockage effects on wind turbine wake development” _eprint: https://onlinelibrary.wiley.com/doi/pdf/10.1002/we.1648 In Wind Energy 17.10, 2014, pp. 1515–1529 DOI: 10.1002/we.1648
- [23] B. Gaurier et al. “Tidal energy “Round Robin” tests comparisons between towing tank and circulating tank results” In International Journal of Marine Energy 12, Special Issue on Marine Renewables Infrastructure Network, 2015, pp. 87–109 DOI: 10.1016/j.ijome.2015.05.005
- [24] Jaeha Ryi, Wook Rhee, Ui Chang Hwang and Jong-Soo Choi “Blockage effect correction for a scaled wind turbine rotor by using wind tunnel test data” In Renewable Energy 79, Selected Papers on Renewable Energy: AFORE 2013, 2015, pp. 227–235 DOI: 10.1016/j.renene.2014.11.057
- [25] Houigab Jeong, Seungho Lee and Soon-Duck Kwon “Blockage corrections for wind tunnel tests conducted on a Darrieus wind turbine” In Journal of Wind Engineering and Industrial Aerodynamics 179, 2018, pp. 229–239 DOI: 10.1016/j.jweia.2018.06.002
- [26] Hannah Ross and Brian Polagye “An experimental evaluation of blockage effects on the wake of a cross-flow current turbine” In Journal of Ocean Engineering and Marine Energy 6.3, 2020, pp. 263–275 DOI: 10.1007/s40722-020-00172-w
- [27] Takafumi Nishino and Richard H.. Willden “Effects of 3-D channel blockage and turbulent wake mixing on the limit of power extraction by tidal turbines” In International Journal of Heat and Fluid Flow 37, 2012, pp. 123–135 DOI: 10.1016/j.ijheatfluidflow.2012.05.002
- [28] Olivier Gauvin-Tremblay and Guy Dumas “Two-way interaction between river and deployed cross-flow hydrokinetic turbines” Publisher: AIP Publishing LLC In Journal of Renewable and Sustainable Energy 12.3, 2020, pp. 034501–034501 DOI: 10.1063/5.0004492
- [29] Olivier Gauvin-Tremblay and Guy Dumas “Hydrokinetic turbine array analysis and optimization integrating blockage effects and turbine-wake interactions” In Renewable Energy 181, 2022, pp. 851–869 DOI: 10.1016/j.renene.2021.09.003
- [30] Nitin Kolekar and Arindam Banerjee “Performance characterization and placement of a marine hydrokinetic turbine in a tidal channel under boundary proximity and blockage effects” In Applied Energy 148, 2015, pp. 121–133 DOI: 10.1016/j.apenergy.2015.03.052
- [31] Nitin Kolekar, Ashwin Vinod and Arindam Banerjee “On Blockage Effects for a Tidal Turbine in Free Surface Proximity” Number: 17 Publisher: Multidisciplinary Digital Publishing Institute In Energies 12.17, 2019, pp. 3325 DOI: 10.3390/en12173325
- [32] Mark A. Miller et al. “Vertical-Axis Wind Turbine Experiments at Full Dynamic Similarity” In Journal of Fluid Mechanics 844, 2018, pp. 707–720 DOI: 10.1017/jfm.2018.197
- [33] Mark A. Miller, Subrahmanyam Duvvuri and Marcus Hultmark “Solidity effects on the performance of vertical-axis wind turbines” Publisher: Cambridge University Press In Flow 1, 2021 DOI: 10.1017/flo.2021.9
- [34] Peter Bachant and Martin Wosnik “Effects of Reynolds Number on the Energy Conversion and Near-Wake Dynamics of a High Solidity Vertical-Axis Cross-Flow Turbine” Publisher: MDPI AG In Energies 9.2, 2016, pp. 73–73 DOI: 10.3390/en9020073
- [35] P G Migliore, W P Wolfe and J B Fanucci “Flow Curvature Effects on Darrieus Turbine Blade Aerodynamics” In Journal of Energy 4.2, 1980, pp. 49–55 DOI: 10.2514/3.62459
- [36] Isabel Scherl, Benjamin Strom, Steven L. Brunton and Brian L. Polagye “Geometric and control optimization of a two cross-flow turbine array” Publisher: American Institute of Physics In Journal of Renewable and Sustainable Energy 12.6, 2020, pp. 064501 DOI: 10.1063/5.0022428
- [37] Aidan Hunt, Carl Stringer and Brian Polagye “Effect of aspect ratio on cross-flow turbine performance” Publisher: AIP Publishing LLC In Journal of Renewable and Sustainable Energy 12.54501, 2020 DOI: 10.1063/5.0016753
- [38] Benjamin Strom, Noah Johnson and Brian Polagye “Impact of blade mounting structures on cross-flow turbine performance” In Journal of Renewable and Sustainable Energy 10.3, 2018, pp. 034504–034504 DOI: 10.1063/1.5025322
- [39] Thierry Villeneuve, Grégoire Winckelmans and Guy Dumas “Increasing the efficiency of vertical-axis turbines through improved blade support structures” In Renewable Energy 169, 2021, pp. 1386–1401 DOI: 10.1016/j.renene.2021.01.092
- [40] Derek G. Goring and Vladimir I. Nikora “Despiking Acoustic Doppler Velocimeter Data” In Journal of Hydraulic Engineering 128.1, 2002, pp. 117–126 DOI: 10.1061/(ASCE)0733-9429(2002)128:1(117)
- [41] Y.. Young et al. “Ventilation of Lifting Bodies: Review of the Physics and Discussion of Scaling Effects” In Applied Mechanics Reviews 69.1, 2017, pp. 010801–010801 DOI: 10.1115/1.4035360
- [42] Brian Polagye et al. “Comparison of cross-flow turbine performance under torque-regulated and speed-regulated control” Publisher: American Institute of Physics Inc. In Journal of Renewable and Sustainable Energy 11.4, 2019, pp. 044501–044501 DOI: 10.1063/1.5087476
- [43] Isabel Scherl “Optimization, Modeling, and Control of Cross-Flow Turbine Arrays” ISBN: 9798351436395, 2022 URL: https://www.proquest.com/docview/2719424792/abstract/5EFB8570C8DE44CAPQ/1
- [44] Peter Bachant, Martin Wosnik, Budi Gunawan and Vincent S. Neary “Experimental Study of a Reference Model Vertical-Axis Cross-Flow Turbine” In PLoS ONE 11.9, 2016, pp. e.0163799–e.0163799 DOI: 10.1371/journal.pone.0163799