Indication of Sharp and Strong Phase-Transitions from NICER Observations
Abstract
In this letter, we present a new method that quantitatively identifies the occurrence probability of equations of state (EoS) beyond “standard” EoS models that disfavor sharp and strong phase-transitions, based on neutron star mass and radius observations. The radii of two neutron stars with different masses are naturally correlated, in part because both of them are sensitive to the symmetry energy of the EoS. We show the radii of two neutron stars observed by NICER (PSR J0740+6620 and PSR 0030+0451) are correlated if these two neutron stars are built upon EoSs with no sharp and strong first-order phase transitions. We further show that the linear correlation of the neutron star radii can be significantly weakened, when strong and sharp first-order phase transitions occur. We propose a new quantity, , which measures the extent to which the linear correlation of the radii of two neutron stars is weakened. Our method gives a 48% identification probability (with a 5% false alarm rate) that the NICER observations indicate the necessity for a sharp and strong phase transition. Future observations can confirm or rule out this identification. Our method is generalizable to any pair of neutron star masses and can be employed with other sets of observations in the future.
Introduction – The composition, as well as the equation of state (EoS) beneath the crust of Neutron Stars (NSs), have long been an open question in nuclear astrophysics. The difficulty of uncovering unknown properties (for example, the possible hadron-quark phase transitions) of neutron star cores exists in both theoretical and experimental endeavors. From the theoretical side, the understanding of quantum chromodynamics (QCD) phase diagrams is far from being complete and thus results in large theoretical uncertainties of properties of nuclear matter above the saturation density, [1, 2, 3, 4]. Experimentally, a strong constraint on of cold nuclear matter can be found by measuring central densities of heavy nuclei. However, the direct observation of dense matter at around is still challenging because of the difficulties of probing central neutron densities of nuclei [5]. Although the densities of nuclear matter in neutron star cores go well above the saturation density, producing them at laboratories is inaccessible. Heavy ion collision (HIC) experiments are capable of probing nuclear equation of states at several saturation densities, but the temperatures observed at HIC are much higher than those in neutron star environments [6]. Astronomical observations provide another way (and probably the most direct way) to study extremely dense matter in neutron stars. In the last six years, three historic observations (GW170817 by LIGO [7], PSR J0030+0451 by NICER [8] and PSR J0740+6620 by NICER [9, 10]) have significantly strengthened the constraints on neutron star mass-radius (M-R) relationship and thus on EoSs. The impact of NICER and LIGO observations on EoSs has been investigated extensively using both parametric and non-parametric EoS models [11, 12, 13, 14, 15, 16, 17], using Beyesian inference. However, because of the small number of observed neutron star events and relatively large uncertainties of measured neutron star radii, the MR relationship may have not been constrained at desired accuracy to confirm or rule out the existence of quark matter in the core of neutron stars. Indeed, it is extremely difficult to quantify the possibility of the occurrence of hadron-quark phase transitions in neutron stars using currently available data from astronomical observations. It is not only because of lack of experimental constraints but also the additional degrees of freedoms introduced by phase transitions span a wide plausible range in the EoS parameter space, making EoSs with phase transitions masquerade as those without any phase transitions [18].
Recently, the measurements of parity-violating asymmetry in the elastic scattering of polarized electrons lead to model-independent determination of neutron skin thickness of [19] and [20]. These measurements of neutron skin thickness interestingly correlate with the radii of neutron stars, as both neutron skin thickness and neutron star radii are sensitive to the slope of symmetry energy at around saturation density. One also expects a strong correlation between the neutron skin thickness of and the neutron skin thickness of for a similar reason.
Note that similar to the correlation between the neutron skin thickness of two nuclei that is observed in both non-relativistic and relativistic theoretical models [20, 21], the radius of a neutron star may also be strongly correlated with the radius of a neutron star. How strong would the correlation of the radii of neutron stars be? Would the radii of PSR J0030+0451 and PSR J0740+6620 measured by NICER agree with the theoretically predicted correlation of NS radii? We systematically study and further quantify the correlation between the radii of two neutron stars. It has been realized that strong phase transitions may be reflected by the difference of radii of two neutron stars [13, 22]. We further demonstrate that if observations of the radii of two neutron stars significantly deviate from the theoretically predicted correlation, this is a strong indication of the occurrence of phase transitions in neutron stars. Indeed, in the absence of other observational evidence, we argue that a strong deviation of two radii from the expected correlation is one of the most sensitive probes of a phase transition.
Characterizing the neutron star radii correlation – The radii of neutron stars are mainly determined by the stiffness of EoSs. Thus, given the NS maximum mass, , it is possible to find a softened EoS with a phase transition which minimizes the NS radius, and a stiff EoS which maximizes the NS radius [23]. As the slope of symmetry energy of the EoS increases, the size of neutron stars grows [24]. If there is a correlation between the radii of two neutron stars with mass and , its linear regression line should be approximately characterized by the minimum and maximum radius of these two neutron stars:
| (1) |
where is the minimum and maximum radius of a neutron star with mass . Note Eq. 1 infers that when , the weakening of NS radii correlation may not be best indicated by , which was used to characterize M-R distributions in some recent studies [13, 22]. The lower and upper bound of NS radii have been investigated in Ref. [23] with minimum model dependence by combining the Chiral Effective Field Theory (CEFT) constraints at low densities with a causal EOS at higher densities. Using their results, we construct our calibration line using Eq. 1. This line can be used as a standard to quantify the extent to which an ensemble of points of deviates from the expected radius correlation, as will be discussed below. In the following, we choose and , since those values are close to the mean of the mass of PSR J0030+0451 and PSR J0740+6620 measured by NICER. We obtain from Ref. [23], where , , , and , assuming the maximum neutron star mass . The uncertainty of mainly comes from: (1) the uncertainty of chiral effective field theory at and (2) the undetermined . However, these assumptions have only a mild effect on characterizing neutron star radii correlations, and we discuss this effect in more details in the supplemental material.
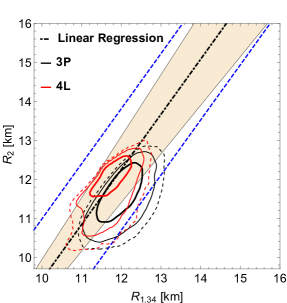
NS radii coming from theoretical models and NICER observations – We first investigate the NS radii correlation in three different theoretical EoS models. The first EoS model “3P” from Ref. [17], uses three piecewise continuous polytropes to represent the high-density EoS. Even though the EoS is not differentiable between the three polytropes, this parameterization (together with its prior distribution) mimics the behavior of EoSs without phase transitions or those with only weak phase transitions. The second, EoS model “4L” from Ref. [17], uses four line segments (also piecewise continuous), and this model (together with its prior distribution) mimics the behavior of EoSs without phase transitions, or those with either weak or moderate first order phase transitions. The 3P and 4L model, or related parameterizations, have been widely used in Bayesian inference of dense matter EoSs [25, 26, 27, 28, 29]. Finally, the third EoS model, the Constant Speed of Sound (CSS) parameterization from Ref. [30, 31], represents either one or two sharp first-order phase transitions. The points of from these models are sampled from the posterior distribution as will be discussed in the supplemental material.
In the left panel of Fig. 1, we present the line from Eq. 1 as well as the density of points of based on 3P and 4L EoS parameterizations. The linear correlations exhibited by points of of 3P and 4L models are obvious, since in 3P and 4L parameterizations the occurrence of moderate phase transitions are allowed but strong and sharp phase transitions are unlikely. On the other hand, the introduction of sharp phase transitions, greatly weakens the correlation between the density-dependent symmetry energies before and after it, and thus likely reduce the correlation between the radii of two neutron stars with unequal mass. This trend has also been observed in recent studies of phase transitions of EoSs using non-parametric EoSs [22].
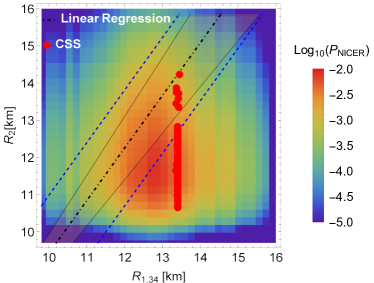
In the right panel, we present the probabilistic distribution of the point of based on NICER observations. We also show values of from the CSS parameterization, selected to have very similar but very different . Interestingly, the points of of CSS model can significantly deviate from the line inferred by our above maximum and minimum NS radii investigations. This can be easily understood since a strong and sharp phase transition with can easily change the radius of a NS while have no influence on the radius of a NS, where is the pressure at the sharp phase-transition and stands for central pressure of a NS. Last but not least, the probability density distribution of based on NICER (denoted as below) is evaluated by , where and stand for the probability that a neutron star with 1.34 (2.0 ) have radius of () based on observation of PSR J0030+0451 (PSR J0740+6620).
The important observation is that the probability distribution of the point inferred by NICER has a significant statistical weight far from the expected linear correlation. This region cannot be easily reached by the 3P and 4L models, but can be easily reached by CSS models.
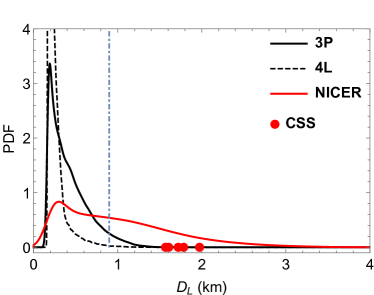
Quantifying the identification probability of models beyond standard scenario – Since the line characterizing the correlation of radii of two neutron stars as described in Eq. 1 is weakly model-dependent, we define as the distance between this line and a point of . We use to measure the extent to which the radii do not match the expected correlation. In Fig. 2, based on the posterior distribution of points of , we have , and which give the probability distributions of based on 3P and 4L models. The , obtained from probabilistic interpretation of two NICER measurements, are generated and compared with the former. The distribution of has an obviously larger spread comparing to and .
To quantitatively estimate the probability that scenarios beyond “standard” EoS parameterizations (where strong and sharp phase transitions are strongly disfavored) occur in NICER observations, we calculate:
| (2) |
and
| (3) |
where stands for the identification probability of EoSs beyond standard scenario and is the false alarm rate. The concept of and has been widely used in statistical signal processing and detection theory [32]. We define to be a threshold of , above which one can claim that an EoS beyond a “standard scenario” exists. The is the the probability distribution of based on NICER observations and the is the probability distribution based on “standard” EoS models (such as 3P and 4L and their associated prior probabilities). Note the choice of depends on as well as the desired accuracy (the value of ) of a measurement. In this work the “standard” models include a large variety of parameterized models that have no phase-transitions at all or do not have phase transitions with large regions of density which have a very small or zero sound speed. One may further decrease the model dependence by investigating using pure Skyrme or relativistic mean field EoSs. However, we do not expect including more standard model parameterizations will qualitatively change the range of . Indeed, the distribution of of both 3P and 4L models vanish when km.
In Fig. 2, we then get using Eq. 2 and 3, when the km is chosen. The choice of (represented by a vertical dot-dashed line of this figure) corresponds to when the “standard scenario” is represented by 3P (4L) model. Note that is unrelated to the uncertainty of the line from Eq. 1 shown in Fig. 1. There could be multiple realizations of NS EoSs that result in weak correlations between the radii of PSR J0030+0451 and PSR J0740+6620, and EoSs constructed using the CSS model are one of those possibilities. Consequently, instead of studying the full probabilistic distribution of CSS EoSs, we presented a representative group of points of that greatly deviate from Eq. 1 using the CSS model in Fig. 1 and 2. The CSS points in Fig. 2 demonstrate that a large value of can be realized in a model with sharp and strong phase transitions. Considering the extremely large number of degrees of freedom in high-density EoSs, and our lack of direct constraints on them, we choose to conservatively interpret of NICER observations as the occurrence probability of beyond “standard” EoS parameterizations, rather than an indication of CSS EoSs.
Conclusions and future directions – The presence of a phase transition is an important diagnostic of QCD and has important implications for binary NS mergers and core-collapse supernovae. Usually, the identification of phase transitions is performed via reconstructions of full NS M-R curves and reconstructions of full EoSs. However, phase transitions are local and the identification of high-density EoS features may rely on the very detailed structure of a NS M-R curve. Given very few measurements of NS radii, a quantitative identification of phase transitions via traditional methods may be difficult.
This letter introduces a new way of identifying phase transitions by investigating the two-point correlation of neutron star radii. We found the point based on NICER data may significantly deviate from our calibrated correlation line for NS radii. If this is the case, then the NICER data is difficult to be explained using EoSs with weak or non-existent phase transitions. We quantitatively estimate the false identification probability to be . The model-dependence of this method comes from an imperfect understanding of low-density EoSs that influences the constraints for maximum and minimum radii of NSs. It also results from the sampled points of coming from theoretical EoS mdoels as representative of the “standard scenario”. Given a large ensemble of EoSs (534,856 4L EoSs and 436,875 3P EoSs) we have tested, we believe this model dependence is likely weak. In the supplemental material, we also demonstrate that the model dependence coming from the uncertainty of low-density EoSs is also weak.
Note that as the gap between two NS masses decreases, the correlation between the NS radii becomes stronger, and an identification of phase transitions using this newly proposed method becomes more accurate. Indeed, when two neutron stars have equal mass, even a slight deviation from the linear correlation clearly indicates a strong and sharp phase transition since it means two neutron stars with equal mass but unequal radii (the “twin-star” scenario proposed by Refs. [33, 34, 35]) are observed. The deviation of the correlation between NS radii is actually a generalized “twin star scenario” that have not been systematically studied and this work makes the first step and a roadmap for the next ones. Also note that, with number of N neutron stars observed, we can construct N(N-1)/2 number of two-point correlations. So, the Nth newly observed NS brings (N-1) more new chances of identifying the phase transitions by investigating the correlations. In the future, the observations from next-generation gravitational wave detectors [36, 37, 38, 39] may provide a next-to-leading-order measurement of the tidal deformability from binary neutron star mergers [40], which enables one to study the mass and the radii of two neutron stars involved in a merger system separately. Those future observations could be pivotal for phase-transition identifications, as this letter demonstrates.
To conclude, we find the combined NICER observations (PSR J0740+6620 and PSR 0030+045) can deviate from the theoretically predicted correalations of NS radii with non-vanishing statistical significance. Our linear correlation method (1) quantitatively estimates the occurrence probability of models beyond the standard scenario with weak model dependence and (2) is significantly more effective when additional neutron stars are observed because the new two-point neutron star radii correlations can be used to detect a phase transition. Finally, we note that recently there is an updated mass-radius analysis of the 2017-2018 NICER data set of PSR J0030+0451 [41], and we plan to include updated NICER data using this method in future investigations.
We thank fruitful discussions with Sophia Han and Shuzhe Shi. ZL and AWS were supported by NSF PHY 21-16686. AWS was also supported by the Department of Energy Office of Nuclear Physics.
References
- Aoki et al. [2006] Y. Aoki, G. Endrodi, Z. Fodor, S. D. Katz, and K. K. Szabo, The Order of the quantum chromodynamics transition predicted by the standard model of particle physics, Nature 443, 675 (2006), arXiv:hep-lat/0611014 .
- Stephanov [2006] M. A. Stephanov, QCD phase diagram: An Overview, PoS LAT2006, 024 (2006), arXiv:hep-lat/0701002 .
- Alford et al. [1999] M. G. Alford, A. Kapustin, and F. Wilczek, Imaginary chemical potential and finite fermion density on the lattice, Phys. Rev. D 59, 054502 (1999), arXiv:hep-lat/9807039 .
- Brambilla et al. [2014] N. Brambilla et al., QCD and Strongly Coupled Gauge Theories: Challenges and Perspectives, Eur. Phys. J. C 74, 2981 (2014), arXiv:1404.3723 [hep-ph] .
- Lin and Horowitz [2015] Z. Lin and C. J. Horowitz, Full weak-charge density distribution of 48Ca from parity-violating electron scattering, Phys. Rev. C 92, 014313 (2015), arXiv:1505.06358 [nucl-th] .
- Sorensen et al. [2023] A. Sorensen et al., Dense Nuclear Matter Equation of State from Heavy-Ion Collisions, (2023), arXiv:2301.13253 [nucl-th] .
- Abbott et al. [2017] B. P. Abbott et al. (LIGO Scientific, Virgo), GW170817: Observation of Gravitational Waves from a Binary Neutron Star Inspiral, Phys. Rev. Lett. 119, 161101 (2017), arXiv:1710.05832 [gr-qc] .
- Riley et al. [2019] T. E. Riley et al., A View of PSR J0030+0451: Millisecond Pulsar Parameter Estimation, Astrophys. J. Lett. 887, L21 (2019), arXiv:1912.05702 [astro-ph.HE] .
- Riley et al. [2021] T. E. Riley et al., A NICER View of the Massive Pulsar PSR J0740+6620 Informed by Radio Timing and XMM-Newton Spectroscopy, Astrophys. J. Lett. 918, L27 (2021), arXiv:2105.06980 [astro-ph.HE] .
- Miller et al. [2021] M. C. Miller et al., The Radius of PSR J0740+6620 from NICER and XMM-Newton Data, Astrophys. J. Lett. 918, L28 (2021), arXiv:2105.06979 [astro-ph.HE] .
- Raaijmakers et al. [2021] G. Raaijmakers, S. K. Greif, K. Hebeler, T. Hinderer, S. Nissanke, A. Schwenk, T. E. Riley, A. L. Watts, J. M. Lattimer, and W. C. G. Ho, Constraints on the Dense Matter Equation of State and Neutron Star Properties from NICER’s Mass–Radius Estimate of PSR J0740+6620 and Multimessenger Observations, Astrophys. J. Lett. 918, L29 (2021), arXiv:2105.06981 [astro-ph.HE] .
- Li et al. [2021] B.-A. Li, B.-J. Cai, W.-J. Xie, and N.-B. Zhang, Progress in Constraining Nuclear Symmetry Energy Using Neutron Star Observables Since GW170817, Universe 7, 182 (2021), arXiv:2105.04629 [nucl-th] .
- Legred et al. [2021] I. Legred, K. Chatziioannou, R. Essick, S. Han, and P. Landry, Impact of the PSR J0740+6620 radius constraint on the properties of high-density matter, Phys. Rev. D 104, 063003 (2021), arXiv:2106.05313 [astro-ph.HE] .
- Pang et al. [2021] P. T. H. Pang, I. Tews, M. W. Coughlin, M. Bulla, C. Van Den Broeck, and T. Dietrich, Nuclear Physics Multimessenger Astrophysics Constraints on the Neutron Star Equation of State: Adding NICER’s PSR J0740+6620 Measurement, Astrophys. J. 922, 14 (2021), arXiv:2105.08688 [astro-ph.HE] .
- Annala et al. [2022] E. Annala, T. Gorda, E. Katerini, A. Kurkela, J. Nättilä, V. Paschalidis, and A. Vuorinen, Multimessenger Constraints for Ultradense Matter, Phys. Rev. X 12, 011058 (2022), arXiv:2105.05132 [astro-ph.HE] .
- Lattimer [2021] J. M. Lattimer, Neutron Stars and the Nuclear Matter Equation of State, Ann. Rev. Nucl. Part. Sci. 71, 433 (2021).
- Al-Mamun et al. [2021] M. Al-Mamun, A. W. Steiner, J. Nättilä, J. Lange, R. O’Shaughnessy, I. Tews, S. Gandolfi, C. Heinke, and S. Han, Combining Electromagnetic and Gravitational-Wave Constraints on Neutron-Star Masses and Radii, Phys. Rev. Lett. 126, 061101 (2021), arXiv:2008.12817 [astro-ph.HE] .
- Alford et al. [2005] M. Alford, M. Braby, M. W. Paris, and S. Reddy, Hybrid stars that masquerade as neutron stars, Astrophys. J. 629, 969 (2005), arXiv:nucl-th/0411016 .
- Adhikari et al. [2021] D. Adhikari et al. (PREX), Accurate Determination of the Neutron Skin Thickness of 208Pb through Parity-Violation in Electron Scattering, Phys. Rev. Lett. 126, 172502 (2021), arXiv:2102.10767 [nucl-ex] .
- Adhikari et al. [2022] D. Adhikari et al. (CREX), Precision Determination of the Neutral Weak Form Factor of Ca48, Phys. Rev. Lett. 129, 042501 (2022), arXiv:2205.11593 [nucl-ex] .
- Reinhard et al. [2022] P.-G. Reinhard, X. Roca-Maza, and W. Nazarewicz, Combined Theoretical Analysis of the Parity-Violating Asymmetry for Ca48 and Pb208, Phys. Rev. Lett. 129, 232501 (2022), arXiv:2206.03134 [nucl-th] .
- Essick et al. [2023] R. Essick, I. Legred, K. Chatziioannou, S. Han, and P. Landry, Phase transition phenomenology with nonparametric representations of the neutron star equation of state, Phys. Rev. D 108, 043013 (2023), arXiv:2305.07411 [astro-ph.HE] .
- Drischler et al. [2021] C. Drischler, S. Han, J. M. Lattimer, M. Prakash, S. Reddy, and T. Zhao, Limiting masses and radii of neutron stars and their implications, Phys. Rev. C 103, 045808 (2021), arXiv:2009.06441 [nucl-th] .
- Lattimer and Prakash [2001] J. M. Lattimer and M. Prakash, Neutron star structure and the equation of state, Astrophys. J. 550, 426 (2001), arXiv:astro-ph/0002232 .
- Annala et al. [2020] E. Annala, T. Gorda, A. Kurkela, J. Nättilä, and A. Vuorinen, Evidence for quark-matter cores in massive neutron stars, Nature Phys. 16, 907 (2020), arXiv:1903.09121 [astro-ph.HE] .
- Steiner et al. [2010] A. W. Steiner, J. M. Lattimer, and E. F. Brown, The Equation of State from Observed Masses and Radii of Neutron Stars, Astrophys. J. 722, 33 (2010), arXiv:1005.0811 [astro-ph.HE] .
- Steiner and Gandolfi [2012] A. W. Steiner and S. Gandolfi, Connecting Neutron Star Observations to Three-Body Forces in Neutron Matter and to the Nuclear Symmetry Energy, Phys. Rev. Lett. 108, 081102 (2012), arXiv:1110.4142 [nucl-th] .
- Read et al. [2009] J. S. Read, B. D. Lackey, B. J. Owen, and J. L. Friedman, Constraints on a phenomenologically parameterized neutron-star equation of state, Phys. Rev. D 79, 124032 (2009), arXiv:0812.2163 [astro-ph] .
- Lattimer and Steiner [2014] J. M. Lattimer and A. W. Steiner, Constraints on the symmetry energy using the mass-radius relation of neutron stars, Eur. Phys. J. A 50, 40 (2014), arXiv:1403.1186 [nucl-th] .
- Alford et al. [2013] M. G. Alford, S. Han, and M. Prakash, Generic conditions for stable hybrid stars, Phys. Rev. D 88, 083013 (2013), arXiv:1302.4732 [astro-ph.SR] .
- Han and Steiner [2019] S. Han and A. W. Steiner, Tidal deformability with sharp phase transitions in (binary) neutron stars, Phys. Rev. D 99, 083014 (2019), arXiv:1810.10967 [nucl-th] .
- Kay [2009] S. M. Kay, Fundamentals Of Statistical Processing, Volume 2: Detection Theory, Prentice-Hall signal processing series (Pearson Education, 2009).
- Benic et al. [2015] S. Benic, D. Blaschke, D. E. Alvarez-Castillo, T. Fischer, and S. Typel, A new quark-hadron hybrid equation of state for astrophysics - I. High-mass twin compact stars, Astron. Astrophys. 577, A40 (2015), arXiv:1411.2856 [astro-ph.HE] .
- Mishustin et al. [2003] I. N. Mishustin, M. Hanauske, A. Bhattacharyya, L. M. Satarov, H. Stoecker, and W. Greiner, Catastrophic rearrangement of a compact star due to the quark core formation, Phys. Lett. B 552, 1 (2003), arXiv:hep-ph/0210422 .
- Alford and Sedrakian [2017] M. G. Alford and A. Sedrakian, Compact stars with sequential QCD phase transitions, Phys. Rev. Lett. 119, 161104 (2017), arXiv:1706.01592 [astro-ph.HE] .
- Maggiore et al. [2020] M. Maggiore et al., Science Case for the Einstein Telescope, JCAP 03, 050, arXiv:1912.02622 [astro-ph.CO] .
- Evans et al. [2021] M. Evans et al., A Horizon Study for Cosmic Explorer: Science, Observatories, and Community, (2021), arXiv:2109.09882 [astro-ph.IM] .
- Aasi et al. [2015] J. Aasi et al. (LIGO Scientific), Advanced LIGO, Class. Quant. Grav. 32, 074001 (2015), arXiv:1411.4547 [gr-qc] .
- Acernese et al. [2015] F. Acernese et al. (VIRGO), Advanced Virgo: a second-generation interferometric gravitational wave detector, Class. Quant. Grav. 32, 024001 (2015), arXiv:1408.3978 [gr-qc] .
- Chatziioannou [2022] K. Chatziioannou, Uncertainty limits on neutron star radius measurements with gravitational waves, Phys. Rev. D 105, 084021 (2022), arXiv:2108.12368 [gr-qc] .
- Vinciguerra et al. [2023] S. Vinciguerra et al., An updated mass-radius analysis of the 2017-2018 NICER data set of PSR J0030+0451, (2023), arXiv:2308.09469 [astro-ph.HE] .