A comprehensive comparison of tools for fitting mutational signatures
Abstract
Mutational signatures connect characteristic mutational patterns in the genome with biological processes that take place in the tumor tissues. Analysis of mutational signatures can help elucidate tumor evolution, prognosis, and therapeutic strategies. Although tools for extracting mutational signatures de novo have been extensively benchmarked, a similar effort is lacking for tools that fit known mutational signatures to a given catalog of mutations. We fill this gap by comprehensively evaluating eleven signature fitting tools (well-established as well as recent) on synthetic input data. To create realistic input data, we use empirical signature weights in tumor tissue samples from the COSMIC database. The study design allows us to assess the effects of the number of mutations, type of cancer, and the catalog of reference signatures on the results obtained with various fitting tools. We find substantial performance differences between the evaluated tools. Averaged over 120,000 simulated mutational catalogs corresponding to eight different cancer types, SigProfilerSingleSample and SigProfilerAssignment perform best for small and large numbers of mutations per sample, respectively. We further show that ad hoc constraining the list of reference signatures is likely to produce inferior results and that noisy estimates of signature weights in samples with as few as 100 mutations can still be useful in downstream analysis.
keywords:
Cancer genomics , statistical methods , mutational signatures , computational models1 Introduction
Since their introduction a decade ago by Nik-Zainal et al. (2012), Alexandrov et al. (2013), mutational signatures have become a widely used tool in genomics (Maura et al., 2019, Koh et al., 2021). They allow researchers to move from individual mutations in the genome to biological processes that take place in living tissues (Kim et al., 2021). In (Cannataro et al., 2022), for example, signature activities have been used to attribute mutations to endogenous, exogenous, and preventable mutational processes. The activity of various mutational signatures can also serve as prognostic or therapeutic biomarkers (Van Hoeck et al., 2019, Brady et al., 2022). Homologous recombination defficiency leads to the accumulation of DNA damage and manifests itself in a specific mutational signature (signature SBS3 from the COSMIC catalog) (Nik-Zainal et al., 2016, Gulhan et al., 2019).
Mutational signatures can be introduced for single base substitutions (SBS), doublet base substitutions (DBS), small insertions and deletions (ID), as well as for copy number variations (CN). We focus here on SBS-based mutational signatures which are most commonly used in the literature. Current SBS signatures are defined using 6 possible classes of substitutions (CA, CG, CT, TA, TC, and TG) together with their two immediate neighboring bases, thus giving rise to different nucleotide contexts into which all SBS mutations in a given sample are classified. De novo extraction of signatures from somatic mutations in sequenced samples has been used to gradually map the landscape of mutational signatures in cancer tissues. Over time, the initial catalogue of 22 SBS-based mutational signatures in the first version of the Catalogue Of Somatic Mutations In Cancer (COSMIC) released in August 2013 has expanded to 80 signatures in the COSMICv3.3 version released in June 2022. This expansion was possible owing to the increased availability of WES and WGS sequencing data as well as improved tools for signature extraction. Extensive benchmarking of extraction tools on synthetic data has recently shown that SigProfilerExtractor outperforms other methods in terms of sensitivity, precision, and false discovery rate, particularly in cohorts with more than 20 active signatures (Islam et al., 2022). A two-step process consisting of first extracting common signatures and then rare signatures has been recently recommended in (Degasperi et al., 2022).
Nevertheless, with the existing signatures extracted from cohorts including thousands of sequenced samples (Alexandrov et al., 2020, Islam et al., 2022, Degasperi et al., 2022), the authors of smaller studies are unlikely to discover new signatures. For example, the analysis of more than 23,000 WGS and WES cancers in (Islam et al., 2022) has only discovered four new signatures. The much more relevant task is thus that of fitting existing signatures to given sequenced samples. In this process, the catalogs of somatic mutations are used to determine the signature contributions to each individual sample. Many different tools have been developed for this task (Koh et al., 2021) (see Methods for their description and classification). However, while tools for extracting mutational signatures have been recently extensively benchmarked on synthetic data by various studies (Omichessan et al., 2019, Alexandrov et al., 2020, Islam et al., 2022, Wu et al., 2022), a similar quantitative comparison is lacking for tools for fitting mutational signatures. This need is further exacerbated by substantial variations between results obtained by different methods (Pandey et al., 2022). Furthermore, newly introduced tools for fitting mutational signatures are commonly compared with only a few existing tools, rarely the most recent ones, and a standardized comparison methodology is lacking. In this study, our aim is to fill this gap and provide a comprehensive evaluation of a broad range of fitting tools on synthetic data motivated by various types of cancer.
We constrain on fitting SBS signatures as they are the most widely used signature type. Many of the included tools can be nevertheless used for other types of signatures as their fitting is mathematically not different from the fitting of SBS signatures. We generate two classes of synthetic mutational catalogs. In the first one, only one mutational signature is responsible for all mutations (single-signature cohorts). In the second one, signature activities in each sample are modeled after the activities found in real tumor samples from various cancers (heterogeneous cohorts). We have collected eleven tools for fitting mutational signatures, from earlier tools such as deconstructSigs to very recent ones such as SigProfilerAssignment. We assess their performance by comparing the known true signature activities in the created catalogs with results obtained by various fitting tools. We find that there is no single fitting tool that performs best regardless of how many mutations are in the samples and which cancer type is chosen to model signature activities. Averaged across all cancer types, two related tools (SigProfilerSingleSample and SigProfilerAssignment) perform best when the number of mutations per sample is small (below 1000, roughly) and large (above 1000), respectively. We also compare the tools by how prone they are to overfitting caused by increasing the size of the reference signature catalog and evaluate whether it is beneficial to constrain the reference catalog based on which signatures seem to be absent or little active in the analyzed samples. We close with a discussion of open problems in fitting mutational signatures.
2 Results
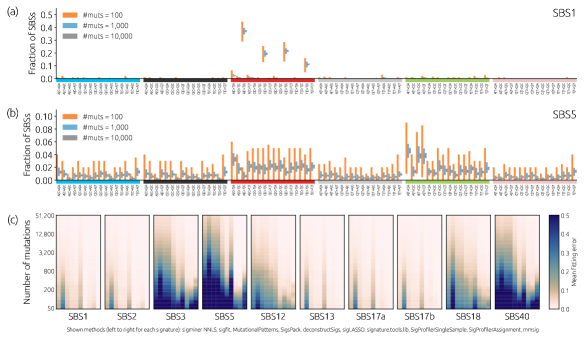
Mutational signatures based on single base substitutions are defined using the mutated base and its two neighboring bases. The total number of different “neighborhoods” (nucleotide contexts) to which each individual SBS can be attributed is 96 (6 different possible substitutions times four possible neighbors times four possible neighbors). This high number of contexts allows for a fine-grained classification of mutations and a detailed differentiation of many different mutational processes. On the other hand, it is a source of considerable sampling noise when the total number of mutations is small. This is illustrated in Figure 1a,b which shows the fraction of mutations in different contexts for two well-known signatures: Signature SBS1 with four distinct peaks among the CT mutational contexts and signature SBS5 that lacks such peaks. While the peaks of SBS1 are clearly distinguished with as few as 100 mutations, the relative variations are much greater for SBS5 where the same number of mutations is effectively distributed among a larger number of contexts. As we will see, these variations then cause problems for signature fitting tools.
We first evaluate the performance of signature fitting methods in a scenario where all samples have 100% contributions of one given signature (single-signature cohorts). This scenario is clearly unrealistic: Depending on the type of cancer, the number of contributing signatures is 1–11 in individual samples and 5–22 in the cohorts available on the COSMIC website https://cancer.sanger.ac.uk/signatures/sbs/. Nevertheless, single-signature cohorts allow us to quantify substantial differences between the signatures as well as between signature-fitting tools. Figure 1c confirms our previous hypothesis by showing that signature SBS5 is one of the most difficult signatures to fit for all fitting tools and the numbers of mutations, followed by SBS40. Beyond substantial differences between the signatures, Figure 1c reveals numerous differences between the fitting tools. For 50 and 100 mutations, for example, the lowest error is not always obtained by the same tool. While sigLASSO, SigProfilerSingleSample and SigProfilerAssignment are among the best tools for “difficult” signatures SBS3 and SBS5, they are lacking for “easy” signatures SBS1 and SBS2, for example.
To understand which signature properties determine how difficult are the signatures to fit, we compute their exponentiated Shannon index and find that it correlates highly (Spearman’s rho 0.77–0.83, depending on the number of mutations) with the average fitting error achived by the evaluated fitting tools (Fig. S1 in Supporting Information, SI). The correlation further improves (Spearman’s rho 0.86–0.90) when the exponentiated Shannon index is multiplied with a measure of signature similarity with other signatures. We can conclude that while the fitting difficulty of a signature is mainly determined by the flatness of its profile (as measured by the Shannon index), the level of difference from the other signatures contributes as well.
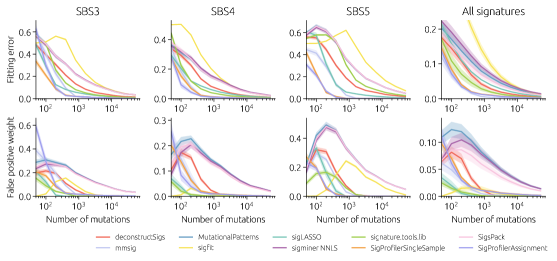
Figure 2 provides a more quantitative view of the fitting error (top row) as well as the total weight assigned to the signatures that are absent in the samples (False positive weight in the bottom row). We show here the results for three difficult signatures that are all important for various reasons—SBS3 is related to DNA damage repair, SBS4 is associated with tobacco smoking, and SBS5 is present in virtually all samples—and the average over all non-artifact signatures (see also Fig. S2 in SI). The error bars in the last column are much wider than in the first three columns; this shows that the result variation between signatures is large compared to the variation between samples characterized by the same signature. Although all methods improve their fitting error with the number of mutations, (as shown in Fig. S3 in SI, MAE decreases approximately as with close to for all fitting tools), there are large differences. For 400 mutations, for example, three tools (mmsig, SigProfilerSingleSample, and SigProfilerAssignment) outperform the other tools by the factor of two or more, on average. For signature SBS5 in particular, SigProfilerSingleSample and SigProfilerAssignment are the best methods by a sizeable margin for the number of mutations between 100 and 1000. Averaged over all signatures, mmsig is the best method for all numbers of mutations except for 100 and 200 where SigProfilerAssignment is best by a small margin (see Fig. S4 in SI for the best method for each signature and the number of mutations).
Interestingly, the ranking of methods by the total weight assigned to false positives is substantially different, with SigLASSO, signature.tools.lib, and sigfit as the best performers when the number of mutations is small. All three methods have one characteristic in common: When the number of mutations is small, they cautiously assign low relative weights to all signatures, which directly leads to a low false positive weight despite a substantial fitting error. Other methods produce relative signature weights that sum to one, and their false-positive rates are then often higher. Finally, it should be noted that the running time of the evaluated tools spans over nearly four orders of magnitude (Fig. S5 in SI) between SigsPack (the fastest method) and mmsig (the slowest method). For some tools (SigProfilerSingleSample, deconstructSigs, mmsig), the running time increases with the signature fitting difficulty represented by the fitting error (Fig. S6 in SI) and with the number of signatures in the used catalog (Fig. S7 in SI). Nevertheless, even the longest running times of several minutes per sample are acceptable for common cohorts comprising tens or hundreds of samples; fitting mutational signatures is not a bottleneck in genomic data analysis (Berger and Yu, 2022).
We now move to synthetic datasets with empirical heterogeneous signature weights. Here, we use absolute signature contributions (i.e., the number of mutations attributed to a signature) in WGS-sequenced tissues from various cancers as provided by the COSMIC website (see Methods and Fig. S8 in SI). For further evaluation, we choose eight types of cancer with mutually distinct signature profiles (Fig. S9 in SI): Hepatocellular Carcinoma (Liver-HCC), Stomach Adenocarcinoma (Stomach-AdenoCA), Head and Neck Squamous Cell Carcinoma (Head-SCC), Colorectal Carcinoma (ColoRect-AdenoCA), Lung Adenocarcinoma (Lung-AdenoCA), Cutaneous Melanoma (Skin-Melanoma), Non-Hodgkin Lymphoma (Lymph-BNHL), and Glioblastoma (CNS-GBM). The first four cancer types all have SBS5 as the main contributing signature but substantially differ in the subsequent signatures. The following four cancer types have different strongly contributing signatures: SBS4, SBS7a, SBS40, and SBS1. The relative signature weights in individual samples were then used to construct synthetic datasets with a given number of mutations, allowing us to assess the performance of the fitting tools in realistic settings. Compared with the previous scenario with single-signature samples, there are now two main differences. First, nearly all samples have more than one active signature (the highest number of active signatures in one sample is eleven). Second, signature contributions differ from one sample to another; the average cosine distance between signature contributions in different samples ranges from for Liver-HCC to for ColoRect-AdenoCA. This scenario is thus referred to as heterogeneous cohorts.
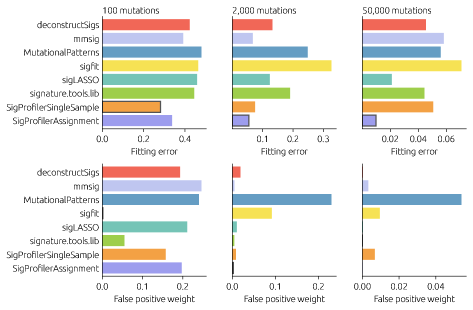
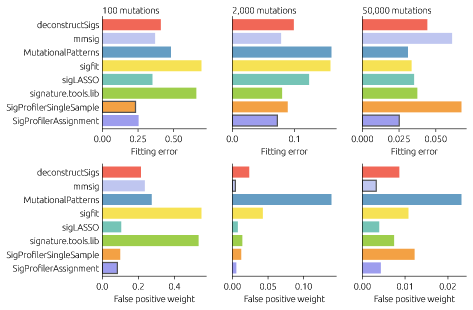
Figure 3 shows that heterogeneous cohorts are more difficult to fit than the previously-studied single-signature cohorts. For 2,000 mutations, for example, the lowest fitting error is above (achieved by SigProfilerAssignment) whereas the fitting error of mmsig for the same number of mutations is below for all signatures. This is a direct consequence of heterogeneous signature weights: Even when the total number of mutations is as high as 10,000, a signature with a relative weight of 2% contributes only 200 mutations and, as we have seen, the fitting errors are high for such a small number of mutations. We see that for 100 mutations per sample, SigProfilerSingleSample has the lowest fitting error. For 2,000 mutations, SigProfilerAssignment becomes the best method, with mmsig close second. Finally, for 50,000 mutations, SigProfilerAssignment is the best method by a large margin. False positive weights are substantial for all methods except for sigfit and signature.tools.lib (both methods have nevertheless high fitting errors) for 100 mutations per sample and remain so for the methods based on non-negative least squares (represented by MutationalPatterns in Figure 3) even at 2,000 and, partially, 50,000 mutations. Interestingly, the performance differs greatly by cancer type (Fig. S10 in SI). For 2,000 mutations, three different methods (SigProfilerAssignment, SigProfilerSingleSample, and mmsig) perform best for specific cancer types. For 50,000 mutations, the mean fitting error achieved by mmsig differs between Skin-Melanoma and CNS-GBM by a factor of . One of the best-performing tools, SigProfilerSingleSample, reports a sample reconstruction similarity score that is often used to remove the samples whose reconstruction score is low. Our results show that this score is strongly influenced by the number of mutations and its absolute value is not a good indicator of the fitting accuracy (Fig. S11 in SI). The same is the case of SigProfilerAssignment (Fig. S12 in SI).
The chosen reference catalog of signatures can significantly impact the performance of fitting algorithms (Koh et al., 2021, Rustad et al., 2021). When the newer COSMICv3.2 catalog of mutational signatures is used as a reference instead of COSMICv3, the fitting error increases for most methods (Fig. S13 in SI) due to an increased number of signatures (from 67 to 78) which makes the methods more prone to overfitting. The more sophisticated methods (e.g., mmsig and signature.tools.lib) nevertheless manage to maintain their performance when the number of mutations per sample is high. On the other hand, when the reference signatures are constrained to the signatures that have been previously observed for a given cancer type and to artifact signatures (Koh et al., 2021), the fitting error decreases substantially for most methods (Fig. S14 in SI). Differences between methods then become smaller (Fig. S15 in SI) because well-performing sophisticated methods profit less from reducing the reference catalog, and this is particularly true when the number of mutations per sample is large.
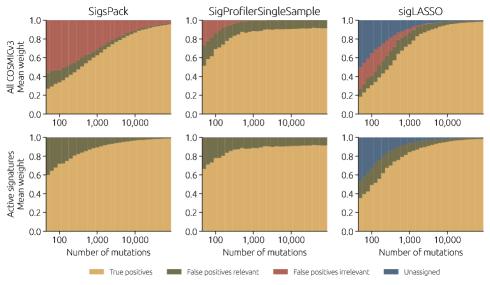
To better illustrate the effect of reducing the number of reference signatures, we use three selected methods (SigsPack which together with MutationalPatterns and sigminer is the most sensitive to the reference catalog, SigProfilerSingleSample, and sigLASSO) and classify their output to true positive signatures, false positive signatures that are relevant to a given cancer type and false positive signatures that are irrelevant to a given cancer type (Figure 4). Using the whole COSMICv3 as a reference (top row), a simple method (SigsPack) starts with 17% of relevant false positives and 56% of irrelevant false positives. For comparison, these numbers are only 21% and 27% for SigProfilerSingleSample and 8% and 23% for SigLASSO (which, furthermore, leaves 50% of the mutations unassigned). When only relevant signatures are used as reference (bottom row), SigsPack improves much more than the two other methods. This further demonstrates how simple methods are particularly sensitive to the reference catalog and overfitting. Another interesting observation is that while, regardless of the reference catalog, SigsPack and sigLASSO tend to zero false positives as the number of mutations increases, this is not the case for SigProfilerSingleSample (as shown in Fig. S9 in SI, SigProfilerSingleSample performs poorly for Stomach-AdenoCA used in Figure 4). SigProfilerSingleSample evidently has a powerful algorithm to infer the active signatures from few mutations, but it does not converge to true signature weights when the mutations are many.
Nevertheless, relying on a pre-determined list of relevant signatures is problematic for a number of reasons. First, the lists of relevant signatures are likely to change over time. Four of the eight considered cancer types have cohorts with less than 100 patients, so adding more WGS-sequenced tissues to the catalog is likely to significantly expand the list of signatures that are active in them. Second, most tools have difficulty recognizing that the provided signature catalog is insufficient even when the number of mutations in a sample is very large (Fig. S16 in SI). Third, when the list of relevant signatures is obtained from the COSMIC website, we rely on results obtained with one specific tool and this tool can be biased. We thus employ a different approach, which is based on fitting signatures using the whole COSMICv3 catalog (step 1) and then constraining the reference catalog to the signatures that sufficiently occur in the obtained results (step 2, see Methods for details).
When the two-step fitting process is applied (Figure 5), the performance of some methods changes considerably, but the best methods when averaged over all cancer types are the same as in Figure 3 where all COSMICv3 signatures were used as a reference. SigProfilerSingleSample and SigProfilerAssignment are the best methods when the number of mutations per sample is small; Fig. S17 in SI shows that the two-step process is beneficial in this case. For a higher number of mutations per sample, SigProfilerAssignment is the best method, but there are some close competitors. When the number of mutations per sample is high, constraining the set of reference signatures allows simple methods, such as MutationalPatterns, to compete with sophisticated methods. However, a closer inspection (Fig. S17 in SI) reveals that this is because the sophisticated methods (e.g., SigProfilerAssignment and sigLASSO) are hampered by the two-step selection process. In other words, our ad hoc procedure of choosing which subset of signatures to use as a fitting reference is inferior to the statistical selection mechanisms built in the methods themselves, in particular when the number of mutations per sample is high. Using a less strict two-step selection process can avoid its adverse effects on performance when the number of mutations is high at the cost of a much smaller improvement when the number of mutations is small (Fig. S18 in SI). A different multi-step process was proposed in (Maura et al., 2019) to deal with under- and over-fitting. Signatures are first extracted de novo, each extracted signature is then assigned to one or two known reference signatures (see Methods for details), and thus-identified reference signatures are then used for fitting. However, this approach is either less effective than the two-step process introduced before or does not yield any improvement compared to using all COSMICv3 signatures (Fig. SF19 in SI).
To summarize the results presented in Figures 3 and 5, the proposed two-step process for narrowing down the list of reference signatures is only helpful for samples with 100 mutations. SigProfilerSingleSample is then the best method for all eight studied cancer types. For 2,000 and 50,000 mutations, it is best to use the complete COSMIC catalog as a reference. For 2,000 mutations, three different methods are then best for various cancer types (SigProfilerAssignment for four of them, mmsig for three, and SigProfilerSingleSample for one). For 50,000 mutations, SigProfilerAssignment is best for all eight cancer types. SigProfilerAssignment starts to outperform SigProfilerSingleSample between 450 and 10,000 mutations per sample, depending on the cancer type (Fig. S20 in SI).
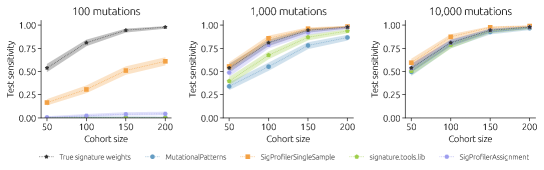
We have focused so far on estimates of signature weights and their errors with respect to a well-defined ground truth. In many cases, however, the estimates are only important as a part of further downstream analyses assessing the correlations of signature weights with various clinicopathological parameters. We present here a simplified example of such an analysis by creating synthetic cohorts with CNS-GBM signature weights where systematic differences in the weights of signature SBS40 are introduced (see Methods for details). Estimation errors, in interaction with the actual magnitude of the effect and the cohort size, are crucial to the ability to detect a significant difference in the signature weights. We contrast three fitting tools: simple MutationalPatterns, SigProfilerSingleSample which performs particularly well when the number of mutations is small, and recent signature.tools.lib. When the number of mutations is large (10,000 in Figure 6), all tools are sufficiently precise to allow to establish a statistically significant difference between the two groups of samples equally well as using the true signature weights. By contrast, when the number of mutations is smaller, the choice of the fitting tool matters. At 1000 mutations per sample, SigProfilerSingleSample estimates are still indistinguishable from true signature weights, while the two other tools perform worse, in particular when the cohort size is small. At 100 mutations per sample, SigProfilerSingleSample still has some statistical power to detect a difference in SBS40 activities between the two groups of samples whereas MutationalPatterns and signature.tools.lib fail regardless of the cohort size. When the signature of interest is easier to fit than SBS40 used in Figure 6, the differences between fitting tools become smaller (Fig. S21 in SI).
3 Discussion
The broad range of tools for fitting mutational signatures makes it difficult to understand which tool to choose for a given project. In this work, we provide a comprehensive assessment of eleven different tools on synthetic mutational catalogs. Using mutational catalogs where only one signature is active allows us to quantify the differences in the fitting difficulty of individual signatures. We find that flat signatures whose average similarity with other signatures is high are the most difficult to fit. To assess fitting tools, we use synthetic mutational catalogs whose signature activities are modeled based on eight distinct cancer types. We find that when the number of mutations is small (100 mutations per sample), SigProfilerSingleSample is the best tool to use for all cancer types. As the number of mutations increases, SigProfilerAssignment becomes the best tool for all cancer types with mmsig best for some cancer types for an intermediate number of mutations (2,000 mutations per sample). The results change little when Pearson correlation is used instead of fitting error for the evaluation (Figs. S22 and S23 in SI).
The risk of overfitting the data by including too many signatures in the reference catalog is often discussed in the literature (Maura et al., 2019, Koh et al., 2021, Degasperi et al., 2022). We show that three methods (SigProfilerSingleSample, SigProfilerExtractor, and mmsig) are robust to such overfitting when the number of mutations per sample is not too small (Figs. S12 and S13 in SI). Crucially, we find that the common practice of excluding signatures from the reference catalog because they do not seem to be active (or are little active) in the analyzed data is little effective or even harmful, unless the number of mutations per sample is small (Fig. S16 in SI). In most cases it is preferable to let the built-in statistical methods of these tools to decide using the complete COSMIC catalog as a reference.
While our work gives clear recommendations on which tools to consider and which to avoid, many issues can be addressed in the future to further improve the fitting of mutational signatures. First, a similar assessment of fitting tools can be done for other types of signatures: doublet base substitutions, small insertions and deletions, and copy number variations. Then, some tools (e.g., sigfit and mmsig) can compute confidence intervals for their estimates. For sigfit, we used these estimates in the way recommended by the authors: When the lower bound of the confidence interval for the relative signature weight is below , the signature is marked as absent in the sample (its relative weight is set to zero). Our results show that this recommended practice indeed improves the results achieved by sigfit. By bootstrapping (resampling the original mutational catalogs with replacement), confidence intervals could be computed also for the tools that do not compute them by themselves. It would be worth investigating whether thus-determined confidence intervals could also improve the performance of other fitting tools.
To fit mutational signatures, it is commonly required that each sample has at least 50 (Riva et al., 2020) or 200 (Blokzijl et al., 2018) single base substitutions. However, different signatures are differently difficult to fit (Figure 1), so it is unlikely that such a universal threshold is meaningful. Based on the simulation framework established here, it would be possible to study the minimum necessary number of mutations for different signatures of interest and different cancer types. To best match the needs of practitioners, it would be possible to extend the simulation framework so that it finds the best-performing fitting tool for a given cancer type, a list of signatures of interest, and a given distribution of sample mutation counts.
When an active signature is missing from the reference catalog because it is new or is falsely deemed inactive in a given set of samples, most fitting tools cannot cope with this situation and distribute all (or nearly all) mutations among signatures from the reference set (Fig. S15 in SI). Three tools do not suffer from this drawback—deconstructSigs, signature.tools.lib, and sigfit—but their performance is generally weak. One could aim to enhance one of the best-performing tools, such as SigProfilerAssignment, with an additional step that would quantify whether given signatures are indeed likely to produce given mutational catalogs. Another approach to this problem is offered in (Maura et al., 2019) where the authors suggest a multistep process to simultaneously avoid under- and over-fitting. Mutational signatures are first extracted de novo, then they are assigned to existing signatures from a reference catalog, and thus-determined active signatures are finally used to fit the original input data. While there are well-defined statistical principles for the first and third steps of this process, the second assignment step is largely ad hoc. A more principled approach could improve the outcome.
More generally, COSMIC signatures are the result of analyzing tumor tissues from many different organs, so they can be viewed as an average across them (Degasperi et al., 2022). It might be more appropriate to construct organ-specific reference catalogs that would better reflect mutational processes that occur in these biologically diverse systems. The fast-growing number of sequenced samples would make such an effort possible.
4 Materials and methods
4.1 Reference signatures
We used all signatures from version 3.0 of the COSMIC catalog (COSMICv3, https://cancer.sanger.ac.uk/signatures/sbs/), in particular the SBS signatures for human genome assembly GRCh38. COSMICv3 contains 67 mutational signatures (18 are artifact signatures) defined in 96 mutational contexts. While newer COSMIC versions (the latest version is 3.3.1 from June 2022) added more signatures, profiles of the COSMICv3 signatures have not been altered (all absolute weight differences are below ).
To measure the diversity of signature profiles, we compute their exponentiated Shannon index which is a common measure of diversity (Missa et al., 2016) that can be understood as the effective number of active mutational contexts. For a signature whose all weight is concentrated in one context, the exponentiated Shannon index is one. For a signature with the same weight of all contexts, the exponentiated Shannon index is 96. For COSMICv3 signatures, the exponentiated Shannon index ranges from 2.7 (SBS48) to 80.3 (SBS3).
4.2 Synthetic mutational catalogs
Absolute contributions of signatures to sequenced tissues from various cancer types were downloaded from the Catalogue Of Somatic Mutations In Cancer (COSMIC, https://cancer.sanger.ac.uk/signatures/sbs/, catalog version 3.2) on November 14, 2021 for all 46 non-artifact SBS signatures that have tissue contribution data available. These data included only samples with reconstruction accuracy above 0.90 and at least 10 mutations attributed to the specific SBS signature. Using the provided unique sample identifiers, we used these files to compute the relative signature contributions in individual WGS-sequenced samples that are stratified by the cancer type. We chose eight different cancer types for further analysis: Hepatocellular carcinoma (Liver-HCC, ), stomach adenocarcinoma (Stomach-AdenoCA, ), head and neck squamous cell carcinoma (Head-SCC, ), colorectal carcinoma (ColoRect-AdenoCA, ), lung adenocarcinoma (Lung-AdenoCA, ), cutaneous melanoma (Skin-Melanoma, ), non-Hodgkin Lymphoma (Lymph-BNHL, ), and glioblastoma (CNS-GBM, ).
We created a cohort of 100 samples with mutations for each cancer type as follows. We first chose 100 samples (with repetition) from all samples for which empirical signature weights were available. Denoting the relative weights of signature for sample (sample composition) as and the relative weight of context for signature (signature profile) as , the relative weight of context for sample is obtained as a weighted sum over all signatures,
| (1) |
We then generated a synthetic mutational catalog with these weights by distributing mutations among the 96 contexts, while the probability that a mutation is assigned to context in sample is . This is mathematically equivalent to first choosing signature for sample with probability and then choosing context with probability . As a result, the number of mutations in context is Poisson-distributed with the mean . The mean number of mutations contributed to sample by signature is . When this number is smaller than , the signature cannot be correctly identified by the evaluated tools as we use the standard procedure of setting all estimated weights below 10 to zero. To not bias the evaluation, we: (1) For sample and mutations per sample, remove all signatures that have and (2) normalize the weights of the remaining signatures to one.
The approach described above allows us to reproduce empirical signature weights in previously analyzed samples without resorting to assumptions such as a log-normal distribution of the number of mutations due to a given signature (Alexandrov et al., 2020, Islam et al., 2022) or adding additional zeros to the Poisson distribution to reproduce signatures that are not active in a sample (Omichessan et al., 2019). The code for generating synthetic mutational catalogs and evaluating the signature fitting tools is available at https://github.com/8medom/SigFitTest.
For Figure 6, we created synthetic mutational catalogs with a systematic difference in the activity of signature SBS40. After generating sample weights as described in the previous paragraph (assuming the CNS-GBM cancer type), the relative weights of SBS40 were multiplied by in the first half of the samples and divided by in the second half of the samples. The relative weights of all signatures in each sample were then normalized to one. Note that signature SBS40 is active in nearly all CNS-GBM samples (Fig. SF9 in SI) and its median relative weight is close to 50%. By the described process, the median weights in the two groups of samples become 42% and 55%, respectively.
| Package | Language | URL |
|---|---|---|
| MutationalPatterns | R | https://bioconductor.org/packages/release/bioc/html/MutationalPatterns.html |
| YAPSA | R | http://bioconductor.org/packages/3.12/bioc/html/YAPSA.html |
| SigsPack | R | https://bioconductor.org/packages/release/bioc/html/SigsPack.html |
| sigminer | R | https://shixiangwang.github.io/sigminer |
| deconstructSigs | R | https://github.com/raerose01/deconstructSigs |
| sigLASSO | R | https://github.com/gersteinlab/siglasso |
| SigProfilerSingleSample | Python | https://github.com/AlexandrovLab/SigProfilerSingleSample |
| SigProfilerAssignment | Python | https://github.com/AlexandrovLab/SigProfilerAssignment |
| mmsig | R | https://github.com/evenrus/mmsig |
| signature.tools.lib | R | https://github.com/Nik-Zainal-Group/signature.tools.lib |
| sigfit | R | https://github.com/kgori/sigfit |
4.3 Tools for signature fitting
The task of fitting known mutational signatures to a mutational catalog consists of finding the combination of signatures from a reference set that “best” matches the given catalog. Denoting the matrix with reference signatures as , where is the relative weight of context for signature , and the given normalized mutational catalog as , where is the fraction of mutations in context in sample , this amounts to solving
| (2) |
where is the relative weight of signature in sample . Mathematically, this is an over-determined system as the number of reference signatures is smaller than the number of mutational contexts (96 contexts for the common SBS signatures). Several fitting tools are therefore based on minimizing the difference between and through non-negative least squares (as the signature weights cannot be negative) or quadratic programming. We evaluated several tools that belong to this class: MutationalPatterns v3.4.1 (Blokzijl et al., 2018), YAPSA v1.20.1 (Hübschmann et al., 2021), SigsPack v1.8.0 (Schumann et al., 2019), and sigminer v2.2.0 (Wang et al., 2021) which has three separate methods based on quadratic programming, non-linear least squares, and simulated annealing. We find that all these tools produce similar results.
Other tools use various iterative processes by which the provided set of reference signatures is gradually reduced by removing the signatures, for example, whose inclusion does not considerably improve the match between the observed and reconstructed mutational catalogs (or, opposite, signatures are gradually added as long as the reconstruction accuracy sufficiently improves). We evaluated deconstructSigs v1.8.0 (Rosenthal et al., 2016), SigProfilerSingleSample v0.0.0.27 (Alexandrov et al., 2020), SigProfilerAssignment v0.0.30 (Diaz-Gay et al., 2023), mmsig v0.0.0.9000 (Rustad et al., 2021), and signature.tools.lib v2.2.0 (Degasperi et al., 2022), that all belong to this category. The newest tool, SigProfilerAssignment, combines backward and forward iterative adjustment of the reference catalog and these steps are repeated until convergence.
Finally, SigLASSO v1.1 combines the data likelihood in a generative model with L1 regularization and prior knowledge (Li, 2020, Li et al., 2020). To allow for a fair comparison with other tools, we did not use prior knowledge when evaluating sigLASSO. In our experience, this tool sometimes fails to halt but starting it again with the same input data resolves the issue. A similar Bayesian framework is used by sigfit v2.2 (Gori and Baez-Ortega, 2020).
The authors of sigfit recommend setting all signatures whose lower bounds of the estimated 95% confidence intervals are below 0.01 to zero. The authors of deconstructSigs recommend setting all signatures whose relative weights are below 0.06 to zero. All results shown for sigfit and deconstructSigs follow these recommendations.
4.4 Trimming reference signatures
It has been argued that the removal of irrelevant reference signatures can improve the fitting results (Kim et al., 2021). To assess this hypothesis, we use a two-step process where: (1) We fit signatures using all COSMICv3 signatures as a reference and (2) keep only the signatures whose relative weight exceeds threshold for at least samples in our cohorts with 100 samples. We use thresholds (), () and () which correspond to absolute signature contributions , , and , respectively. This pruning of reference signatures is beneficial when the number of mutations per sample is small (see in Fig. S17 in SI). However, the converse is true when the number of mutations per sample is high, in particular for tools that perform well with COSMICv3 as a reference ( in Fig. S17 in SI). To overcome this problem, we have also tested a less strict pruning where we keep all signatures whose relative weight exceeds for at least one sample (see Fig. S18 in SI for the results).
We have also tested the approach based on de novo extraction of signatures as suggested in (Maura et al., 2019). For signature extraction, we used SignatureAnalyzed v0.0.7 (https://github.com/getzlab/SignatureAnalyzer) with L1 prior on both W and H and a Poisson objective function for optimization. As recommended in (Maura et al., 2019), each extracted signature was then compared with individual signatures from COSMICv3 as well as linear combinations of two signatures from COSMICv3. The signature (or a pair of signatures) that yielded the smallest cosine distance was then added to the list of trimmed reference signatures for the given input data. When the number of mutations is small (), less than five signatures are selected, on average. When the number of mutations is large (), 89% of the active signatures are selected, on average. A comparison of the results obtained by the two reference-trimming schemes is shown in Fig. S19 in SI.
4.5 Evaluation metrics
Recent literature often classifies fitting results as true positives, false positives, true negatives, and false negatives, which allows computing evaluation metrics such as precision and specificity Omichessan et al. (2019), Islam et al. (2022), Diaz-Gay et al. (2023). We use instead quantitative metrics that measure the differences between the true relative signature weights (which are used to generate the input mutational catalogs) and the estimated relative signature weights. For tools that estimate absolute signature weights, those are first normalized by the number of mutations in each sample.
Our main evaluation metric is fitting error. Denoting the estimated relative weight of signature in sample as , we compute the total absolute error for each sample,
| (3) |
and average it over all samples in the cohort to obtain fitting error. The lowest fitting error, , is achieved when the estimated signature weights are exact for all signatures and all samples. The highest fitting error, , is achieved when the estimated signature weights sum to one for each sample but they are all false positives. For example, when a sample has 40% contribution of SBS1 and 60% of SBS4 but a tool estimates 20% contribution of SBS2 and 80% contribution of SBS3, the fitting error is . There are some tools whose signature weight estimates do not sum up to one for each sample, typically as a result of the uncertainty implied by a small number of mutations in samples. The fitting error of those tools can be inflated due to these tools’ conservativeness. However, we probed whether additionally normalizing the estimated weights to one improves the fitting error achieved by those tools and found that this is not the case. We can thus conclude that these tools are not disfavored by measuring their fitting error.
Another way to quantify the agreement between the true and estimated signature weights is by computing their Pearson correlation. For each sample where at least three signatures had positive either true or estimated weights, we computed the Pearson correlation coefficient between these two weight vectors whilst excluding all signatures that are zero for both of them. The obtained values were then averaged over all samples in the cohort.
We finally computed false positive weight which quantifies how much weight is assigned to the signatures that are not active in a given sample,
| (4) |
and then this quantity is averaged over all samples. This quantity too ranges from (when no weight is assigned to inactive signatures) to (when all weight is assigned to inactive signatures).
Acknowledgement
We thank Charlotte Ng and Peter Degen for their useful feedback.
References
- Alexandrov et al. (2020) Alexandrov, L.B., Kim, J., Haradhvala, N.J., Huang, M.N., Tian Ng, A.W., Wu, Y., Boot, A., Covington, K.R., Gordenin, D.A., Bergstrom, E.N., et al., 2020. The repertoire of mutational signatures in human cancer. Nature 578, 94–101.
- Alexandrov et al. (2013) Alexandrov, L.B., Nik-Zainal, S., Wedge, D.C., Aparicio, S.A., Behjati, S., Biankin, A.V., Bignell, G.R., Bolli, N., Borg, A., Børresen-Dale, A.L., et al., 2013. Signatures of mutational processes in human cancer. Nature 500, 415–421.
- Berger and Yu (2022) Berger, B., Yu, Y.W., 2022. Navigating bottlenecks and trade-offs in genomic data analysis. Nature Reviews Genetics , 1–16.
- Blokzijl et al. (2018) Blokzijl, F., Janssen, R., van Boxtel, R., Cuppen, E., 2018. MutationalPatterns: Comprehensive genome-wide analysis of mutational processes. Genome Medicine 10, 1–11.
- Brady et al. (2022) Brady, S.W., Gout, A.M., Zhang, J., 2022. Therapeutic and prognostic insights from the analysis of cancer mutational signatures. Trends in Genetics 38, 194–208.
- Cannataro et al. (2022) Cannataro, V.L., Mandell, J.D., Townsend, J.P., 2022. Attribution of cancer origins to endogenous, exogenous, and preventable mutational processes. Molecular Biology and Evolution 39, msac084.
- Degasperi et al. (2022) Degasperi, A., Zou, X., Dias Amarante, T., Martinez-Martinez, A., Koh, G.C.C., Dias, J.M., Heskin, L., Chmelova, L., Rinaldi, G., Wang, V.Y.W., et al., 2022. Substitution mutational signatures in whole-genome–sequenced cancers in the UK population. Science 376, abl9283.
- Diaz-Gay et al. (2023) Diaz-Gay, M., Vangara, R., Barnes, M., Wang, X., Islam, S.A., Vermes, I., Narasimman, N.B., Yang, T., Jiang, Z., Moody, S., et al., 2023. Assigning mutational signatures to individual samples and individual somatic mutations with SigProfilerAssignment. bioRxiv , 548264doi:10.1101/2023.07.10.548264. bioRxiv 2023.07.10.548264.
- Gori and Baez-Ortega (2020) Gori, K., Baez-Ortega, A., 2020. sigfit: Flexible Bayesian inference of mutational signatures. bioRxiv , 372896doi:10.1101/372896. bioRxiv, 372896.
- Gulhan et al. (2019) Gulhan, D.C., Lee, J.J.K., Melloni, G.E., Cortes-Ciriano, I., Park, P.J., 2019. Detecting the mutational signature of homologous recombination deficiency in clinical samples. Nature Genetics 51, 912–919.
- Hübschmann et al. (2021) Hübschmann, D., Jopp-Saile, L., Andresen, C., Krämer, S., Gu, Z., Heilig, C.E., Kreutzfeldt, S., Teleanu, V., Fröhling, S., Eils, R., et al., 2021. Analysis of mutational signatures with yet another package for signature analysis. Genes, Chromosomes and Cancer 60, 314–331.
- Islam et al. (2022) Islam, S.A., Díaz-Gay, M., Wu, Y., Barnes, M., Vangara, R., Bergstrom, E.N., He, Y., Vella, M., Wang, J., Teague, J.W., et al., 2022. Uncovering novel mutational signatures by de novo extraction with SigProfilerExtractor. Cell Genomics 2, 100179.
- Kim et al. (2021) Kim, Y.A., Leiserson, M.D., Moorjani, P., Sharan, R., Wojtowicz, D., Przytycka, T.M., 2021. Mutational signatures: From methods to mechanisms. Annual Review of Biomedical Data Science 4, 189–206.
- Koh et al. (2021) Koh, G., Degasperi, A., Zou, X., Momen, S., Nik-Zainal, S., 2021. Mutational signatures: Emerging concepts, caveats and clinical applications. Nature Reviews Cancer 21, 619–637.
- Li (2020) Li, S., 2020. sigLASSO: Optimizing cancer mutation signatures jointly with sampling likelihood. URL: https://github.com/gersteinlab/siglasso. R package version 1.1.
- Li et al. (2020) Li, S., Crawford, F.W., Gerstein, M.B., 2020. Using sigLASSO to optimize cancer mutation signatures jointly with sampling likelihood. Nature Communications 11, 3575.
- Maura et al. (2019) Maura, F., Degasperi, A., Nadeu, F., Leongamornlert, D., Davies, H., Moore, L., Royo, R., Ziccheddu, B., Puente, X.S., Avet-Loiseau, H., Campbell, P.J., Nik-Zainal, S., Campo, E., Munshi, N., Bolli, N., 2019. A practical guide for mutational signature analysis in hematological malignancies. Nature Communications 10, 1–12.
- Missa et al. (2016) Missa, O., Dytham, C., Morlon, H., 2016. Understanding how biodiversity unfolds through time under neutral theory. Philosophical Transactions of the Royal Society B: Biological Sciences 371, 20150226.
- Nik-Zainal et al. (2012) Nik-Zainal, S., Alexandrov, L.B., Wedge, D.C., Van Loo, P., Greenman, C.D., Raine, K., Jones, D., Hinton, J., Marshall, J., Stebbings, L.A., et al., 2012. Mutational processes molding the genomes of 21 breast cancers. Cell 149, 979–993.
- Nik-Zainal et al. (2016) Nik-Zainal, S., Davies, H., Staaf, J., Ramakrishna, M., Glodzik, D., Zou, X., Martincorena, I., Alexandrov, L.B., Martin, S., Wedge, D.C., et al., 2016. Landscape of somatic mutations in 560 breast cancer whole-genome sequences. Nature 534, 47–54.
- Omichessan et al. (2019) Omichessan, H., Severi, G., Perduca, V., 2019. Computational tools to detect signatures of mutational processes in DNA from tumours: A review and empirical comparison of performance. PLoS ONE 14, e0221235.
- Pandey et al. (2022) Pandey, P., Arora, S., Rosen, G.L., 2022. MetaMutationalSigs: Comparison of mutational signature refitting results made easy. Bioinformatics 38, 2344–2347.
- Riva et al. (2020) Riva, L., Pandiri, A.R., Li, Y.R., Droop, A., Hewinson, J., Quail, M.A., Iyer, V., Shepherd, R., Herbert, R.A., Campbell, P.J., et al., 2020. The mutational signature profile of known and suspected human carcinogens in mice. Nature Genetics 52, 1189–1197.
- Rosenthal et al. (2016) Rosenthal, R., McGranahan, N., Herrero, J., Taylor, B.S., Swanton, C., 2016. DeconstructSigs: Delineating mutational processes in single tumors distinguishes DNA repair deficiencies and patterns of carcinoma evolution. Genome Biology 17, 1–11.
- Rustad et al. (2021) Rustad, E.H., Nadeu, F., Angelopoulos, N., Ziccheddu, B., Bolli, N., Puente, X.S., Campo, E., Landgren, O., Maura, F., 2021. mmsig: A fitting approach to accurately identify somatic mutational signatures in hematological malignancies. Communications Biology 4, 1–12.
- Schumann et al. (2019) Schumann, F., Blanc, E., Messerschmidt, C., Blankenstein, T., Busse, A., Beule, D., 2019. SigsPack, A package for cancer mutational signatures. BMC Bioinformatics 20, 1–9.
- Van Hoeck et al. (2019) Van Hoeck, A., Tjoonk, N.H., van Boxtel, R., Cuppen, E., 2019. Portrait of a cancer: Mutational signature analyses for cancer diagnostics. BMC Cancer 19, 1–14.
- Wang et al. (2021) Wang, S., Li, H., Song, M., Tao, Z., Wu, T., He, Z., Zhao, X., Wu, K., Liu, X.S., 2021. Copy number signature analysis tool and its application in prostate cancer reveals distinct mutational processes and clinical outcomes. PLoS Genetics 17, e1009557.
- Wu et al. (2022) Wu, Y., Chua, E.H.Z., Ng, A.W.T., Boot, A., Rozen, S.G., 2022. Accuracy of mutational signature software on correlated signatures. Scientific Reports 12, 1–12.
Supporting Information
![[Uncaptioned image]](/html/2310.01562/assets/x7.png)
Supplementary Figure 1: Exponentiated Shannon entropy of signatures (top row) and exponentiated Shannon entropy multiplied with the signature’s mean absolute Pearson correlation with all other signatures (bottom row) versus the average fitting error achieved by the evaluated tools (as in SF2, we exclude YAPSA, sigminer QP, and sigminer SA that produce the same results as MutationalPatterns). We see that the exponentiated Shannon entropy (which measures an effective number of active contexts for a signature) is closely related with the fitting error and the agreement improves with the number of mutations per sample. The agreement further improves when the average correlation with other signatures is taken into account. In summary, flat signatures that are on average similar to other signatures are the most difficult to fit.
![[Uncaptioned image]](/html/2310.01562/assets/x8.png)
Supplementary Figure 2: A comparison of signature fitting tools for single-signature cohorts. Mean fitting error (top row) and mean total weight assigned to false positive signatures (bottom row) for different numbers of mutations per sample (columns) for all evaluated fitting tools. The results are averaged over 50 cohorts from eight cancer types (see Methods), all 67 COSMICv3 signatures were used for fitting. The best-performing tool in each panel is marked with a frame. Results are not shown for YAPSA, sigminer QP, and sigminer SA as they are close (fitting error correlation above 0.999) to the results of MutationalPatterns.
![[Uncaptioned image]](/html/2310.01562/assets/x9.png)
Supplementary Figure 3: As Figure 2 in the main text but with a logarithmic -axis. A straight line with the slope of in the log-log scale implies the power-law dependence between the number of mutations per sample, , and the fitting error, . When the fitting error is averaged over all non-artifact signatures (last panel), linear fits to the empirical dependencies in the range yield exponents between (for mmsig) and (sigfit).
![[Uncaptioned image]](/html/2310.01562/assets/x10.png)
Supplementary Figure 4: Tools with the lowest average fitting error in single-signature cohorts for each signature and the number of mutations per sample (for each signature, we created one cohort with 100 samples).
Supplementary Figure 5: The average running times (per sample) in single-signature cohorts (left) and heterogeneous cohorts (right) for all evaluated tools. In the right panel, sigminer QP and sigminer NNLS overlap. SigsPack and mmsig are the fastest and slowest tool in both cases; the ratios between their running times are 6,500 and 22,500 for single-signature and heterogeneous cohorts, respectively. deconstructSigs is more than 10 times slower in heterogeneous cohorts. Simulations were run on Intel CPUs i5-6500 @ 3.20GHz.
![[Uncaptioned image]](/html/2310.01562/assets/x12.png)
Supplementary Figure 6: The running times for single-signature cohorts plotted against the mean fitting error. The running times of three tools (deconstructSigs, mmsig, and SigProfilerSingleSample) grow with the signature difficulty.
![[Uncaptioned image]](/html/2310.01562/assets/x13.png)
Supplementary Figure 7: The running time as a function of the number of reference signatures (the running times have been normalized by the running time for the smallest number of reference signatures) in heterogeneous cohorts. With respect to the number of reference signatures, the running time of mmsig grows almost with the third power whereas the running times of SigsPack, MutationalPatterns, sigminer QP, sigminer NNLS, and sigLASSO are (nearly) independent of the number of reference signatures.
![[Uncaptioned image]](/html/2310.01562/assets/x14.png)
Supplementary Figure 8: The activity of signatures from the COSMICv3 reference catalog in the WGS-sequenced tissue data from various cancers at the COSMIC website (https://cancer.sanger.ac.uk/signatures/sbs/). The eight cancer types chosen for the evaluation of signature fitting tools are marked with bold.
![[Uncaptioned image]](/html/2310.01562/assets/x15.png)
Supplementary Figure 9: Relative signature contributions in heterogeneous cohorts. Empirical signature weights in WGS tissues from eight different cancer types (data obtained from the COSMIC website). Each panel shows six signatures with the highest median weight.
![[Uncaptioned image]](/html/2310.01562/assets/x16.png)
Supplementary Figure 10: Mean fitting error for the evaluated signature fitting tools stratified by the cancer type (this complements Figure 4 in the main text). Plus symbols mark the best tool for each cancer type and a given number of mutations. The results are averaged over 50 cohorts with 100 samples for each number of mutations and cancer type.
![[Uncaptioned image]](/html/2310.01562/assets/x17.png)
Supplementary Figure 11: Sample reconstruction similarity reported by SigProfilerSingleSample versus the sample fitting error in heterogeneous cohorts stratified by the number of mutations per sample. Note the different -axis range between the panels which shows that no universal reconstruction similarity threshold can be chosen.
![[Uncaptioned image]](/html/2310.01562/assets/x18.png)
Supplementary Figure 12: Sample reconstruction quality metrics reported by SigProfilerAssignment versus the sample fitting error in heterogeneous cohorts stratified by the number of mutations per sample.
![[Uncaptioned image]](/html/2310.01562/assets/x19.png)
Supplementary Figure 13: Fitting error difference between the results obtained with COSMICv3 and COSMICv3.2, respectively, as a reference. Tool sigfit is omitted here because it failed to converge with COSMICv3.2. The differences are mostly negative as a result of the increased number of signatures included in COSMICv3.2 (78 as opposed to 67 for COSMICv3).
![[Uncaptioned image]](/html/2310.01562/assets/x20.png)
Supplementary Figure 14: Fitting error difference between the results obtained using COSMICv3 and only the relevant signatures (signatures that are active for a given cancer type and all artifact signatures), respectively, as a reference (50 cohorts with 100 samples for each cancer type). The differences are mostly positive as excluding the inactive signatures cannot induce any systematic errors in the estimated signature weights. For 2,000 and 50,000 mutations, SigProfilerAssignment does not benefit from using only the relevant signatures as a reference which means that it is able to automatically identify them even when complete COSMICv3 is used as a reference.
![[Uncaptioned image]](/html/2310.01562/assets/x21.png)
Supplementary Figure 15: A comparison of signature fitting tools for heterogeneous cohorts when only the relevant signatures are used as a reference by the fitting tools. The results are averaged over 50 cohorts with 100 samples for each cancer type.
![[Uncaptioned image]](/html/2310.01562/assets/x22.png)
Supplementary Figure 16: A comparison of signature fitting tools for cohorts where 90% of mutations come from one signature (four columns corresponding to SBS1–4 being used as the main signature) and 10% of mutations come from a signature that is not in the reference catalog (SBS94 from COSMICv3.2 which is absent in COSMICv3 used by the evaluated tools as a reference). For each main signature and the number of mutations, the results are averaged over 100 samples in the generated cohort. Besides fitting error (top row), total relative weight assigned to the signatures (middle row), and the number of false positive signatures (bottom row) are shown. The dotted line shows the best possible performance of a fitting tool that does not have SBS94 in the reference catalog: Assigning the correct weight 0.9 to the main signature and 0 to all other signatures from COSMICv3 implies the fitting error of 0.05, total assigned weight 0.9, and zero false positive signatures. From all evaluated tools, signature.tools.lib comes closest to this best possible result. Two other tools that perform well here benefit from their conservative recommended practice. The authors of deconstructSigs recommend setting the relative weights below 0.06 to zero and the authors of sigfit recommend setting the relative weights whose estimated lower bounds of the 95% confidence intervals are below 0.01 to zero. This helps these two tools to differentiate from the other tools that assign all mutations to the reference signatures (this results in the fitting error of 0.1 and the total assigned weight is one).
![[Uncaptioned image]](/html/2310.01562/assets/x23.png)
Supplementary Figure 17: Fitting error difference between the results obtained using COSMICv3 and a self-determined list of active signatures (see Methods in the main text), respectively, as a reference. A positive difference means that using a self-determined list of active signatures improves the results (i.e., lowers the fitting error). For sophisticated and well-performing tools such as sigLASSO, mmsig, and SigProfilerAssignment, for example, the differences are positive only when the number of mutations per sample is small (100). By contrast, when the number of mutations per sample is high, the fitting error difference is mostly negative which shows that the process to determine the reference signatures is not beneficial.
![[Uncaptioned image]](/html/2310.01562/assets/x24.png)
Supplementary Figure 18: As SF17 but using a less strict process to prune the reference signatures: every signature that has the relative weight above for at least one sample is included ( is 0.05 for 100 mutations per sample, 0.03 for 2,000 mutations per sample, and 0.01 for 50,000 mutations per sample). While avoding the negative differences observed in SF16 for well-performing tools such as SigProfilerAssignment and a high number of mutations per sample, the benefits achieved for 10 mutations per sample are much smaller. In other words, it is difficult to formulate a well-performing ad hoc process for pruning the reference signatures.
![[Uncaptioned image]](/html/2310.01562/assets/x25.png)
Supplementary Figure 19: Fitting error difference between the results obtained using a self-determined list of active signatures and the method by Maura et al. (see Methods in the main text), respectively, as a reference. A positive difference means that the method by Maura et al. performs better (i.e., it yields a lower fitting error). We include here only the methods that perform well in Figures 3 and 5 in the main text. The mostly negative differences for SigProfilerSingleSample and SigProfilerAssignment for 100 mutations show that fitting the two-step fitting procedure described in the main text then performs better than the method by Maura et al. Fitting errors achieved by the two methods are comparable for 2,000 mutations per sample and the method by Maura et al becomes preferable for 50,000 mutations per sample. However, at that point, it does not provide any improvement compared to using all COSMICv3 as a reference.
![[Uncaptioned image]](/html/2310.01562/assets/x26.png)
Supplementary Figure 20: By increasing the number of mutations per sample in small steps, we identify the number of mutations at which SigProfilerAssignment starts to outperform SigProfilerSingleSample for each cancer type (using all COSMICv3 as a reference).
![[Uncaptioned image]](/html/2310.01562/assets/x27.png)
Supplementary Figure 21: As Figure 7 in the main text but systematic differences are introduced for signature SBS1 which is easier to fit than SBS40 used in Figure 7. We see that for “easy” signatures, the differences between fitting tools tend to be smaller than for “difficult” signatures.
![[Uncaptioned image]](/html/2310.01562/assets/x28.png)
Supplementary Figure 22: As SF 9 but using a different evaluation metric, one minus the Pearson correlation coefficient between the true and estimated signature weights. The ranking of tools is similar as in SF9.
![[Uncaptioned image]](/html/2310.01562/assets/x29.png)
Supplementary Figure 23: As SF 17 but using a different evaluation metric, one minus the Pearson correlation coefficient between the true and estimated signature weights. The impact of using a self-determined set of reference signatures is similar as in SF16.