Stable 3-dimensional Vorticies Consistent with Jovian Observations Including the Great Red Spot
Abstract
Detailed observations of the velocities of Jovian vortices exist at only one height in the atmosphere, so their vertical structures are poorly understood. This motivates this study that computes stable 3-dimensional, long-lived planetary vortices that satisfy the equations of motion. We solve the anelastic equations with a high-resolution pseudo-spectral method using the observed Jovian atmospheric temperatures and zonal flow. We examine several families of vortices and find that constant-vorticity vortices, which have nearly-uniform vorticity as a function of height and horizontal areas that go to zero at their tops and bottoms, converge to stable vortices that look like the Great Red Spot (GRS) and other Jovian anticyclones. In contrast, the constant-area vortices proposed in previous studies, which have nearly-uniform areas as a function of height and vertical vorticities that go to zero at their tops and bottoms, are far from equilibrium, break apart, and converge to constant-vorticity vortices. Our late-time vortices show unexpected properties. Vortices that are initially non-hollow become hollow (i.e., have local minima of vertical vorticity at their centers), which is a feature of the GRS that cannot be explained with 2-dimensional simulations. The central axes of the final vortices align with the planetary-spin axis even if they initially align with the local direction of gravity. We present scaling laws for how vortex properties change with the Rossby number and other non-dimensional parameters. We analytically prove that the horizontal mid-plane of a stable vortex must lie at a height above the top of the convective zone.
1 Introduction
Jupiter and Saturn have robust, long-lived vortices at their mid-latitudes. The Great Red Spot (GRS) of Jupiter, with a current mean diameter of km, has survived for more than 9,600 of its own vortex turn-around times since the time it became continuously monitored (starting with Dawes (1857)), and, if it is the same vortex observed by Hooke (1665) and Cassini (1666), then it has survived at least 21,000 turn-around times. The GRS is not unique in its longevity. Three Jovian vortices known as the White Ovals with diameters of 9,000 km, each survived for more than 6,000 turn-around times before merging to form the current Red Oval or Little Red Spot. In contrast, the Atlantic Meddies can survive for up to vortex turn-around times (Richardson et al., 2000), while terrestrial tropical cyclones over open water typically survive only vortex turn-around times. More than 200 persistent mid-latitude vortices with diameters greater than 1,000 km have been identified on Jupiter and more than 50 on Saturn (Trammell et al., 2014). These vortices are governed by the familiar laws of fluid dynamics, so their ubiquity and persistence are of interest to and should be explainable by fluid dynamicists, yet there remain many unanswered questions: Why are these vortices so prevalent in some planetary atmospheres but not others? What determines their longevity? Why are observed mid-latitude planetary vortices and Atlantic meddies predominately anti-cyclones, whereas the polar vortices on Jupiter and Saturn, and tropical storms on Earth are cyclonic? For Jovian and Saturnian mid-latitude vortices where the data is available, the vortices are all embedded in east-west zonal flows that have the same sign vorticity as the vortices, but are the zonal flows necessary for their formation or persistence? Must the vortices be continuously forced by underlying thermal convection to persist?
Although we now have high-resolution velocity maps (Simon et al., 2014; Wong et al., 2021) for many of the vortices due to advances in correlation imagery techniques (Asay-Davis et al., 2006; Shetty et al., 2006; Asay-Davis et al., 2008, 2009), the maps provide only the horizontal (north-south and east-west) velocities and are given at only one height in the atmosphere, the top of the visible clouds (which we have argued is near 1 bar in the atmosphere (Marcus et al., 2019)), but others believe to be higher in the atmosphere (Fletcher et al., 2010, 2016, 2021; Wong et al., 2021). We believe that to answer the questions posed above, we need to understand the 3-dimensional structures of these vortices, which to date remain unknown and controversial. For example, it is uncertain whether the GRS lies entirely at heights above the Jovian convective zone or whether its bottom lies deep within it. Despite recent advances in observations that are specifically designed to probe multiple depths of the Jovian atmosphere, such as radio measurements with the Very Large Array radio telescope (de Pater et al., 2016), gravity field anomaly measurements (Parisi et al., 2021) and microwave (Bolton et al., 2021) measurements by the Juno spacecraft, and infrared measurements with the James Webb Space Telescope (de Pater et al., 2022), there is not a consistent 3-dimensional picture of the vortices. We believe that the best way to obtain an understanding of the 3-dimensional vortex dynamics is with numerical simulations such that the simulated vortices are consistent with the horizontal velocities at the one available height where they can be measured in high-resolution and with the 3-dimensional equations of motion.
The few partial answers that have been found to the questions posed above were generally provided by 2-dimensional numerical simulations using reduced equations of motion (shallow-water, quasigeostrophic, etc.) (Dowling & Ingersoll, 1988, 1989; Marcus, 1993; Showman, 2007; Li et al., 2020). However, these studies beg the question of whether vortices in two dimensions behave as they do in three dimensions (and we show in this paper that in some important and relevant ways that they do not). There have been few numerical calculations of 3-dimensional, Jovian-like vortices and most used the Boussinesq approximation (Williams, 1997; Hassanzadeh et al., 2012; Lemasquerier et al., 2020), which is appropriate for a fluid without large vertical density variations, but not for the Jovian atmosphere. Even if we use one of the smallest published estimates of the vertical thickness of the GRS, 190 km, the mass density within the GRS varies by a factor of 100 from its top to its bottom.111Fletcher et al. (2010) argue that the top of GRS is at a height above mbar, while Parisi et al. (2021) estimates that the bottom of the GRS is between km and km, which corresponds to 40 and 340 bar. Using 40 bar for the bottom, we obtain that the thickness of GRS is 190 km and then obtain the difference of the densities at the top and bottom from figure 2. Therefore, it is not surprising that Boussinesq simulations have velocities that qualitatively differ from the observed GRS velocities at the cloud tops, and the results of these studies may not be applicable to Jovian vortices. Liu & Schneider (2010) used a global circulation model based on the hydrostatic primitive equations for a compressible ideal-gas atmosphere, with 30 levels of vertical resolution to compute zonal flows on Jupiter. Their focus was on the east-west jets, not the vortices. During the simulations, vortices formed spontaneously, but they were predominately cyclones, rather than anticyclones. Some numerical 3-dimensional studies used the anelastic equations (or a combination of Boussinesq and anelastic equations) to simulate the Jovian convective zone and the stable-stratified layer at heights above it containing the visible cloud tops, and they were able to create convection-forced 3-dimensional vortices at the cloud-top levels. However, these vortices survived for fewer than 5 turn-around times (Heimpel et al., 2016; Yadav & Bloxham, 2020). Cho et al. (2001) solved the 3-dimensional quasigeostrophic equation using contour dynamics and 8 vertical levels. Their focus was on correlating the horizontal contours of their simulation with the cloud patterns of the GRS, and they did not report the vertical structure or the longevity of their vortex. Their calculation was initialized with a large vortex, rather than creating one via convective forcing. The vortex was allowed to freely evolve in time. Morales-Juberías & Dowling (2013) followed this line of reasoning to examine a freely evolving vortex to see if the vertical vorticity (as a proxy for the Jovian clouds) would form the observed patterns of the GRS. They solved the primitive isentropic-coordinate equations (with the EPIC code) initialized with a 3-dimensional ellipsoidal vortex. Their vortex was not forced by convection nor with any diabatic heating from radiative transfer of latent heating or cooling from cloud formation, sublimation, or evaporation. They successfully produced long-lived vortices. However, they carried out their calculations such that the lower parts of their vortices were in an ambient atmosphere that was much more stably stratified with respect to instability than the Jovian atmosphere, and they did not report on the vertical structures of their vortices (possibly because they only used 14 levels in the vertical direction of their calculation, four of which were sponge layers at the top of the calculation used to prevent numerical instabilities). Palotai et al. (2014) followed up the study of Morales-Juberías & Dowling (2013) and modeled how ammonia clouds interact with these vortices. They found ammonia clouds forming inside anticyclones, consistent with Jovian observations.
In this paper, we follow the approach taken by Morales-Juberías & Dowling (2013) and evolve initial vortices, without forcing, diabatic heating, heat transfer, or any form of thermal or viscous dissipation with the equation of motions to see if they survive, qualitatively change, or are destroyed. The goal of this study is to produce non-decaying vortices so that in follow-up studies we can use these vortices to examine their longevity and slow evolution when realistic forcing and dissipation are included. Here, our goal is to examine the vertical structures and other properties of the unforced/undissipated vortices. We use the anelastic equations, which allow for global and local convection (the latter of which we find is important for reproducing several features of Jovian vortices). The calculations are well-resolved in the horizontal and vertical directions, with 385 vertical collocation points. Rather than comparing our simulated vortices to Jovian cloud patterns that they might produce, we compare their horizontal velocities and temperature fields at the cloud top height to observations. The simulated vortices mimic several prominent features of the GRS, including the shielded vorticity, the quiescent interiors with warm, high-velocity annular rings at their peripheries, a cool top, first observed by Voyager (Flasar et al., 1981), and a warm bottom, first proposed by Marcus et al. (2013a).
Our calculations are carried out using the observed atmospheric temperature and pressure (de Pater et al., 2019; Moeckel et al., 2023), which consists of a highly-stratified region at heights above a convection zone (see 3 for details). The atmosphere is highly-stratified at the top of our computational domain and has , where is the Brunt-Väisälä frequency of the atmosphere and is the local Coriolis frequency. The convection zone at the bottom of our computational domain is near adiabatic (). We include the convection zone in our domain because many researchers expect that the vortex bottom extends nearly to its top, which we set to be 10 bar in our calculations. Some observers believe the bottom of the large Jovian vortices lie within the convection zone (Bolton et al., 2021). We want to allow simulations of such scenarios. In addition to the choice of hydrostatic background, our method differs from previous studies because of the numerical method we use (see the Appendix for details). Most numerical methods used for computing atmospheric flows require small time steps when is large, making the computation of Jovian vortices numerically challenging. However, our time-stepping algorithm allows us to use a relatively large time step, which makes the simulations feasible with our available computational resources. Using this method we are able to have a large Courant number compared to previous calculations, without sacrificing accuracy or stability.
Our philosophy for computing stable vortices that look like Jovian vortices incorporates the same set of ideas that we used for computing vortices in non-forced and non-dissipated rotating, stratified Boussinesq flows (Hassanzadeh & Marcus, 2013; Mahdinia et al., 2017). Those Boussinesq flows have multiple families of equilibrium vortex solutions, and within each family there is a continuum of vortex solutions. The fact that each family is a continuum not only allows the vortices to have different Rossby and Burger numbers, but also allows the vortices to have a continuous range of sizes and a continuous range of locations at different heights within the flow. To compute stable vortices in stratified, rotating Boussinesq flows we used an initial-value code that was initialized with a vortex that was “close to” a stable equilibrium, Typically, but not always, if the initial vortex was sufficiently “close to” a stable equilibrium, the flows settled into a late-time vortex whose appearance looked similar to the initial condition. The approach of the initial condition to equilibrium was facilitated by the fact that the boundaries of the computational domain were designed to absorb, rather than reflect, the Poincaré waves that were generated and radiated by the initial vortex as it rapidly adjusted to come into hydrostatic and geostrophic or cyclostrophic equilibrium. Because the interior of the flow’s computational domain was dissipationless, once the rapid adjustment and shedding of Poincaré waves ended, the late-time equilibrium vortices stopped dissipating and lasted indefinitely. If the initial condition of the initial-value code was a vortex that was not sufficiently “close to” a stable equilibrium, and if the flow remained a vortex at late times, then the late-time vortex did not look like the initial vortex. Frequently, the initial vortex split into multiple vortices, some of which survived, but none of which looked like the initial vortex. Here in this study of Jovian-like vortices in a rotating, stratified Jovian-like atmosphere governed by the anelastic equations of motion, we take the same approach by using an initial-value code and choosing an initial condition that “looks like” a Jovian vortex and is sufficiently “close to” a stable equilibrium”, where “looks like” and “close to” are defined below.
One of the goals of this paper is to show how to create an initial 3-dimensional vortex that is sufficiently “close to” a stable equilibrium of the anelastic equations of motion so that at late times it converges to a vortex similar in appearance to the initial condition and also “looks like” a Jovian vortex because its cloud-top velocity is similar in appearance to that of an observed Jovian vortex.
The remainder of this paper is as follow: In 2, we review the anelastic equations. In 3 and 4 we review the Jovian observations we use to determine the initial atmosphere’s vertical thermal structure and the structure of the east-west zonal system of winds in which we embed the initial vortex. In 5 we show how to create initial vortices that are approximate equilibria so that they are sufficiently “close to ” an equilibrium that they evolve to a stable vortex that looks like the initial condition that itself “looks like” a Jovian vortex. In particular, we consider four families of anticyclonic vortices, one of which was a family proposed by Parisi et al. (2021) as a model of the GRS to interpret the Juno gravitometer data. In 6, we present the results of running the initial-value code with the families of initial anticyclones. Not all families survive. In this section, we also compare the velocity and temperature fields of the final, quasi-steady vortices to Jovian vortices. In 7 we determine how various properties of the final vortices scale with their Rossby numbers and with their vertical aspect ratios (the vertical thickness divided by the mean horizontal diameter of the vortex). We also present a semi-analytic formula that explains the shapes of the vortices in their vertical-east/west planes. In 8 we take a closer look at the vertical structures of the vortices and show how local convective instabilities constrain the locations of the tops and bottoms of the vortices. A summary and discussion of our results, along with a plan future work, are in 9.
2 Coordinate Systems, Hydrostatic Equilibrium, and Anelastic Equations of Motion
2.1 Useful Coordinate Systems
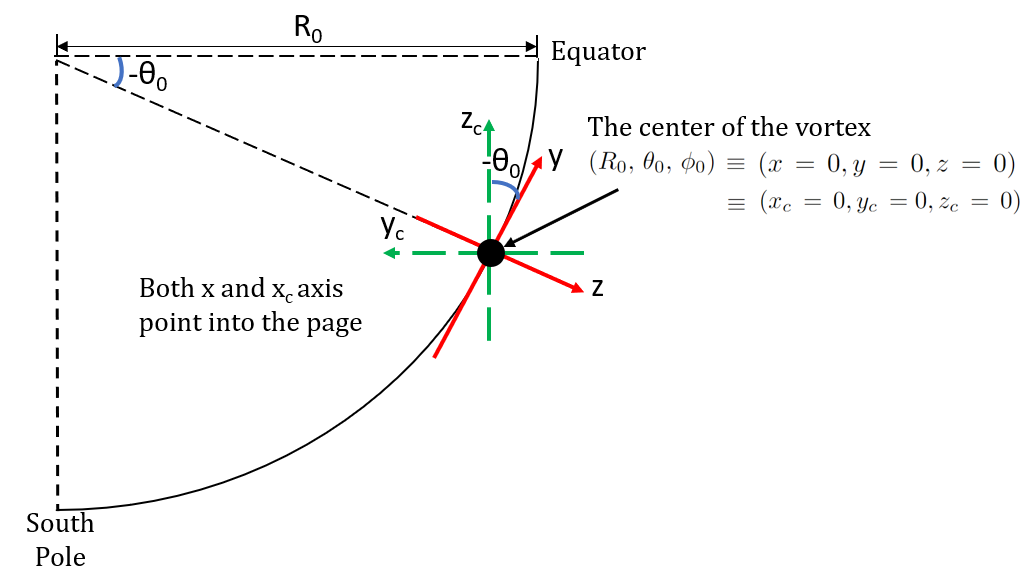
A commonly used coordinate system for studying planetary scale flows are spherical coordinates , where r is the radius, the latitude, and the longitude. However, planetary vortices are local structures in planetary atmospheres. The characteristic horizontal length of a typical planetary vortex is small compared to the planet’s radius. The largest planetary vortex, the Great Red Spot (GRS) of Jupiter, spans (longitude) (latitude), or km (Simon et al., 2018; Wong et al., 2021), so km. Because is small compared to the mean Jovian radius at the 1 bar level (near the tops of the visible clouds), we use a local Cartesian coordinate system (c.f., Pedlosky (1982) chapter 6). Let be the center of the vortex of interest, then the local Cartesian coordinates in Figure 1 are
| (1) | |||||
| (2) | |||||
| (3) |
Note is radially outward unit vector and is along the vertical direction in which the flow is stratified; is eastward; and is northward. When computing the GRS at , we can ignore Jupiter’s small oblateness and neglect the curvature correction terms because in equations (1) – (3). To exploit further approximations in the following sections, we shall also need to consider the horizontal length scale , the characteristic distance associated with the horizontal derivative of the vortex. For example, the operator acting on the velocity or pressure of a vortex will be of order . For some vortices, can be considerably different from . For example, the GRS has a relatively quiet interior surrounded by a high-velocity collar of thickness km, so although km, km.222The width of the high-velocity collar might be related to Rossby deformation radius . In two-dimensional, quasigeostrophic studies (Marcus, 1988; Dowling & Ingersoll, 1989; Shetty & Marcus, 2010) have used a “depth-averaged” value of km to try to qualitaveily simulate the velocity field of the GRS at cloud-top level. However, where is the Brunt-Vaisala frequency, the local vertical pressure scale height, and the local value of the Coriolis parameter. Because varies by three orders of magnitude over the height of the GRS, so does . (See section 3.2)
Local Cartesian coordinates are useful because much of the dynamics are controlled by gravity in the direction, which strongly stratifies the flow in that direction. However, Coriolis forces due to the planetary spin are also important, especially for low Rossby number flows. In the absence of baroclinicity and stratification, the vortices would obey the Taylor-Proudman theorem and be invariant along the direction parallel to the planet’s spin axis. Therefore, it is convenient to introduce another local Cartesian coordinate system , which has the same origin as the coordinates but is aligned with the spin of the planet (see Fig. 1) such that is in the direction of the planet’s rotation vector, , and is orthogonal to and such that the right-hand rule is satisfied. To convert between the two local Cartesian coordinate systems:
| (4) | |||||
| (5) | |||||
| (6) | |||||
| (7) | |||||
| (8) | |||||
| (9) |
Note that the coordinates of the straight line parallel to the spin axis of the planet that passes through the point obeys
| (10) | |||||
| (11) |
In other words, along the line described by equations (10) – (11), and are fixed, while varies. We will need these relations to construct our initial conditions of the vortices.
2.2 Anelastic Approximation and the Governing Equations
2.2.1 Anelastic Approximation
We denote the solutions of the steady hydrostatic (i.e., the velocity ) equations with overbars. The Euler equation and ideal gas equation become
| (12) | |||||
| (13) |
where is pressure, is mass density, is temperature, is the acceleration of gravity pointing in the direction, and is the ideal gas constant of the hydrogen-helium mixture of the planetary atmosphere of the interest, which for Jupiter at 1 bar is m2s-2K-1 (de Pater et al., 2019). For the anelastic approximation, it is useful to introduce the potential temperature with
| (14) | |||||
| (15) |
where is a reference temperature and is the heat capacity at constant pressure. To completely define the hydrostatic solution, an energy equation is needed. However, as will be discussed in 3, we replace that equation with the observed value of . Using the observed , all of the other barred thermodynamic quantities can computed with equations (12) – (15).
We decompose the thermodynamic variables as
| (16) | |||||
| (17) | |||||
| (18) | |||||
| (19) |
The anelastic approximation requires that the non-hydrostatic thermodynamic variables (denoted with the tildes) are much smaller their hydrostatic counterparts (denoted with the overbars) at each height . In addition, the Mach number must be small. These requirements are consistent with Jovian observations.
2.3 Anelastic Equation of Motion
There are different versions of the anelastic equations (Ogura & Phillips, 1962; Gough, 1969; Bannon, 1996; Brown et al., 2012; Adrian, 1984), and we chose the one developed by Bannon (1996) because it conserves energy and we have found it to be robust in astrophysical calculations (Barranco & Marcus, 2005; Marcus et al., 2015, 2016; Barranco et al., 2018).333This equation set is very similar with the Lantz-Braginsky-Roberts (LBR) equations (Lantz, 1992; Lantz & Fan, 1999; Braginsky & Roberts, 1995). The only difference is that our thermal computational variable is potential temperature but the one in the LBR equation is entropy. Brown et al. (2012) show that the LBR equations capture dynamics correctly in subadiabatic atmosphere because of energy conservation. Whereas some other versions of anelastic equations do not. In the Cartesian coordinates shown in figure 1, these equations are
| (20) | |||||
| (21) | |||||
| (22) | |||||
| (23) | |||||
| (24) |
where is the Brunt-Väisälä frequency
| (25) |
and where is the full Coriolis vector, which is along the direction of , or , where . In writing the gravitational acceleration as , rather than a vector in the spherical radial direction, we have ignored the small curvature correction terms. We also ignored the higher-order curvature terms in the Coriolis vector and the centrifugal force (Pedlosky, 1982).
In equation (21), the viscous term is dropped. In equation (22), the thermal conduction and radiative transfer terms are not considered. As the system of interest has a high Reynolds number, the dissipation length scale is much smaller than the numerical resolution, and we use hyperviscosity and hyperdiffusivity to perform numerical dissipation at the smallest resolvable scales. Dropping the viscous, thermal conduction, and radiative transfer terms means that the convective velocities below the top of the underlying convection zone are not computed. However, the near-adiabatic temperatures of the underlying convection zone are used in these calculations, and the Brunt-Väisälä frequency smoothly goes from the observed large value at the top of the computational domain down to zero at the top of the convective zone. (See 3.1 and Figure 2.) Moreover, although we have omitted the convective velocities within the convection zone itself, we do accurately compute the intermittent convective velocities above the top of the convection zone when and where the flow becomes locally superadiabatic and unstable to local convection – see 8. We do not believe that our calculations are harmed by the lack of convective velocities below the top of the convection zone because the bottoms of our computed vortices lie well above the convection zone and never penetrate down to the top of the convective zone. The details of our numerical solver and boundary condition are discussed in the Appendix.
To compute our numerical solutions using an initial-value code in 6, we numerically solve (20) – (24). However in 5 where we compute initial conditions of the vortices that are “close to” equilibrium flows, it is more useful to replace the vector momentum equation (21) with an equivalent set of three scalar equations: the vertical component of the vorticity equation; the horizontal divergence of the horizontal component of the momentum equation; and the vertical component of the momentum equation. These equations are:
| (26) | |||||
| (27) | |||||
| (28) |
where is the vorticity vector, is the horizontal velocity, is the horizontal vorticity, , is the horizontal Laplacian operator, and is the horizontal divergence of any given vector .
3 Choice of Hydrostatic Fields
3.1 Our Non-Use of the Hydrostatic Energy Equation
The reason we use the observed , rather than solve the energy equation to find it, is because the former is relatively easy to obtain and the latter is difficult to solve. The equation governing the energy or temperature of the flow is
| (29) | |||||
where is the coefficient of heat conduction and is the heat capacity at constant volume of the fluid. Because the flow is optically thin at heights above the visible cloud tops, the radiative heat transfer responsible for heating and cooling is complex (especially in regions with different cloud decks where there are phase changes).
A second complication of this equation is that, like equation (22), it will have convective velocities in any region where . To truly simulate Jovian flows, we would need to use equation (29) with correct parameter values of , the cloud compositions, and the radiation physics such that the top of the convection zone would be at 10 bar, with large convective velocities in the convection zone. Those velocities would mix the potential temperature, making the time-averaged temperature within the convection zone approximately adiabatic with .444Local, intermittent convection has been inferred in Jupiter at heights above 10 bar, but it is not generally believed that the flow is fully convective at heights above 10 bar. While experience has shown us that we can compute convection with the anelastic equations (Marcus, 1978), and Yadav & Bloxham (2020) and other authors have done so, we believe that the dynamics of 3-dimensional vortices is sufficiently complex that this first study should be carried out with the vortices in a stable rather than turbulently convective ambient atmosphere. Also, like Morales-Juberías & Dowling (2013), we wish to explore freely evolving Jovian vortices, rather than those forced by convection. For these reasons, we artificially suppress global convection (but allow local convection) in this study by choosing a that agrees with observations and is weakly sub-adiabatic (i.e., with ) beneath the top of the convective zone at 10 bar. Thus, is close to its actual value in the convection zone, but the fluid deeper than 10 bar is not filled with turbulent convection.555This replacement is what was done in the early days of calculating stellar structure (Schwarzschild, 2015). Typically, one solved the steady-state energy equation along with the other hydrostatic equations, and in any region in which the vertical gradient of the temperature made the flow unstable to convection, the temperature was replaced with an adiabat such that . Our underlying philosophy is that some of the long-lived vortices computed with this approximation might be destroyed or modified by convection. However, our belief is that there are no families of unforced vortices that could be computed with a true convective zone that would not have a counterpart using this approximation. We suspect that vortices computed with this approximation that extend into the true convective zone would be destroyed if convection were actually present, or at least, have their bottom parts that extend into the convective zone truncated. (See our Discussion.)
3.2 Constructing Hydrostatic Fields Based on Observations
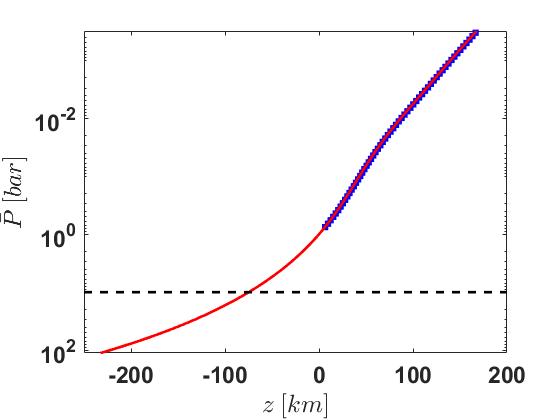
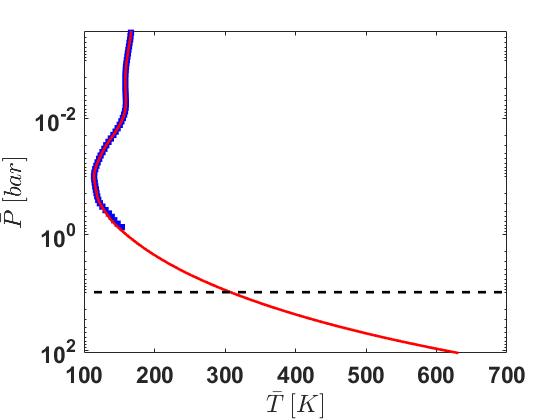
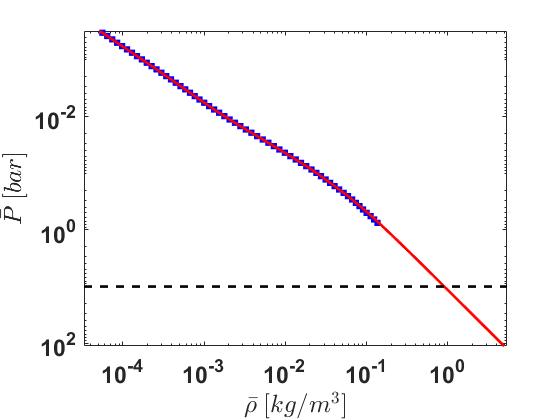
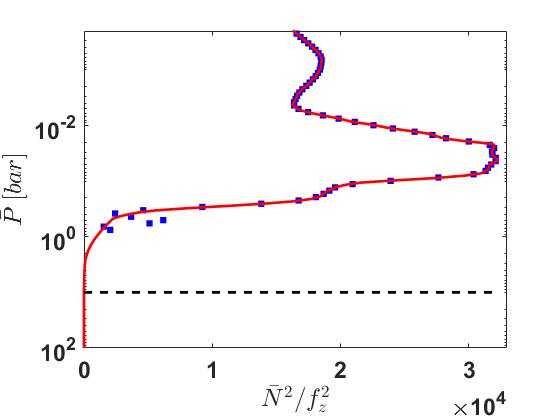
The thermal structure of Jovian atmosphere is crucial for the existence of Jovian vortices. However, directly simulating the radiative transfer and convective processes that determine the Jovian thermal structure is complex, as described in §3.1. Therefore for simplicity, we use the observed zonal-averaged values of at the GRS latitude S, as specified by de Pater et al. (2019); Moeckel et al. (2023) along with equations (12) and (13) to obtain first guesses of , , and as shown by the blue dots in figure 2. Although the temperature data appears to be smooth, when we differentiate it to compute with equation (25), we find it is not smooth, especially at heights deeper than mbar (See the blue dots in figure 2(d)). A non-smooth has the potential of producing artificial convective instabilities and internal gravity waves in our calculations. In addition, the measured values of temperature only extend to a depth of 1 bar. Therefore we have taken the observed temperature measurements and change them in three ways: (1) at heights above mbar we replace the observed (blue dots in figure 2(d)) with the locally smoothed red curve; (2) we define the top of the convective zone to be at 10 bar, so at heights deeper than 10 bar, we set ; and (3) we construct a smooth monotonic curve (red) to extrapolate between mbar and 10 bar. We then use equations (12), (13), (15), and (25) with the smooth in figure 2(d), to compute the smoothed (red) functions , , and in figure 2abc. The smoothed functions are not very different from the original observational data.
4 Choice of Zonal Flow
The Jovian east-west zonal flow , far from the large vortices is, by definition, averaged over longitude, and is therefore independent of . At the height of the visible cloud tops, it has been measured repeatedly (Limaye, 1986; Porco et al., 2003; Asay-Davis et al., 2011; Tollefson et al., 2017) and observed to be nearly independent of time. The observations are shown as a function of latitude or in figure 3. For the calculations here, we need to know for all values of that contain a Jovian vortex. The only direct measurement of at elevations other than the cloud tops was from the Galileo probe (Atkinson et al., 1998), which measured the velocity at only one location, and that result is controversial because the location was a “hot spot” with anomalous properties (Marcus et al., 2019). Furthermore, because the probe entered at latitude 7.3∘N jovigraphic, it measured velocities along a descent path more aligned with the axis than the axis. For low Rossby number flows, the thermal wind equation (Pedlosky, 1982), or the equivalent density wind equation (Kaspi et al., 2020), can be used to determine the vertical derivative of the zonal flow. However, the use of those equations requires accurate thermal or density data as a function of . The temperature and density measurements are sufficiently uncertain that the results are ambiguous (Fletcher et al., 2016, 2021). Observations based on Juno gravity measurements (Kaspi et al., 2020) suggest that the zonal flow beneath the cloud-tops depends primarily on and has an exponential decay in the direction with an e-folding length of km, which is much greater than the vertical size, km, of the Jovian vortices studied here.
Determining the exact vertical structure of the zonal flow is not the focus of this study. Therefore for simplicity, we choose a zonal flow that is independent of , satisfies the steady anelastic equations, and agrees with the observations at the cloud tops. This simple form of zonal flow is consistent with the Juno gravity measurement (Kaspi et al., 2020), which shows that the e-folding depth of Jovian zonal flow is km, which is much bigger than the vertical size of the domain in this study. It is also consistent with the recent James Webb Space Telescope (JWST) zonal wind measurement (Hueso et al., 2023), which shows that the zonal wind near the top of our vortex ( mbar) is similar to the cloud-top measurement, at the latitude of our interest (S).
Any zonal flow is a solution to the steady anelastic equations subject to the requirements that
| (30) | |||||
| (31) |
Therefore, the only constraint on our choice of zonal flow is that
| (32) |
where matches the Jovian observations in figure 3 at (the value of near the visible cloud-tops). Two different zonal flows are used in this study. One corresponds to the blue curve in figure 3, which is the observed Jovian zonal velocity, and the other is an approximation (red curve) that uses a zonal velocity with constant shear.666The observed zonal velocity is smoothed to avoid numerical instabilities. Both choices of are artificially made periodic near the y directional boundaries. See the Appendix. We include a study of vortices with the constant-shear zonal (red line in Figure 3) flow because we want to determine whether the local maximum and minimum of the zonal flow have a strong effect on the ability of a vortex to be hollow (as proposed by Shetty et al. (2007)) and whether locations where the Rossby Mach number becomes supersonic control the flow’s stability (as proposed by Dowling (2014, 2019, 2020); Afanasyev & Dowling (2022)). We note that we carried out numerous simulations in which the initial condition consisted of a zonal flow, finite-amplitude “noise”, and no vortices. In no case did the noise de-stabilize the zonal flow, so we argue that the zonal flows used in these computations and these boundary conditions are linearly stable and also stable to a variety of finite-amplitude perturbations. We note that if the zonal flows of Jupiter extend into the convective zone, as many researchers believe, then the stability of the actual Jovian zonal flows cannot be determined by our calculations.

5 Initial Condition Set Up
5.1 Strategy
The unforced and undissipated equations that govern the flow do not have a unique solution. For example, is a solution with no zones and no vortices. Purely zonal flows with no vortices also exist with the zonal vorticity equal to , and with a zonal pressure , zonal temperature , and zonal potential temperature determined by equations (30) and (31) with . In addition, there are families of solutions that have vortices embedded in the zonal flow. For these flow, it is useful to decompose the velocity into contributions due to the vortex as , with similar decompositions for pressure, temperature, and potential temperature. For the vertical vorticity, the contribution due to the vortex is where . We also define . Throughout the remainder of this paper, we define to be 1 bar, which we take to be the nominal height of the visible Jovian cloud tops where the horizontal velocity is observed.777Some observers believe the cloud tops can be as high as 500 mbar.
5.2 Stacked Models
Here we show how to construct an initial vortex that is “close to” an equilibrium solution of the governing equations of motion and that “looks like” a Jovian vortex because its is in agreement with Jovian observations at the cloud-top level. To find these near-equilibria, we note that the vertical velocities of planetary vortices are small compared to their horizontal velocities and difficult to measure. Many studies assume and the quasigeostrophic equation (Marcus et al., 2000; Shetty & Marcus, 2010; Marcus & Shetty, 2011) or shallow water equation (Dowling & Ingersoll, 1989; Cho & Polvani, 1996; Stegner & Dritschel, 2000; García-Melendo & Sánchez-Lavega, 2017; Li et al., 2020) to look at vortex dynamics. To create near-equilibria, we assume and that the flow is steady in time. With these assumptions, equations (20), (26) – (28), and (22) become
| (33) | |||||
| (34) | |||||
| (35) | |||||
| (36) | |||||
| (37) |
These equations, along with equations (23) – (24), are equivalent to the governing equations of motion (20) to (24) for a steady flow with . To construct an approximate numerical solution, we begin by solving equations (33) and (34) for for each collocation point . We can do this because equations (33) and (34) at one value of are decoupled from those at other values of . Equations (33) and (34) are equivalent to the steady, Euler equations for a 2-dimensional, incompressible velocity for a constant density fluid, and there are many ways to solve them. For example, contour dynamics (Shetty et al., 2006) allows the computation of steady equilibrium flows even if they are unstable. The most popular method is to use solve the 2-dimensional Euler equation with an initial-value solver and let the flow come to a steady state. In general if the zonal flow is given, then a multi-parameter family of steady, or slowly drifting vortices, with embedded in the zonal flow can be found. Once a solution is found at every collocation point in , the 2-dimensional solutions can be stacked (as described in the next section) on top of each other to create a steady 3-dimensional solution to equations (33) and (34).888If the initial 2-dimensional vortices at different heights drift at different speeds, it does not appear to be a problem. For all cases that we have examined so far, the initial vortex (which is not designed to be a solution to the full equations, but only to be close to an attracting solution) comes to a statistically-steady vortex when observed in some Galilean frame moving in the direction.
After finding , we substitute it into right side of equation (35) and solve for . We then use equation (36) with to find . We then use in equations (23) – (24) to find and . The only governing equation that is unsatisfied is (22), which is why this is only an approximate solution. In 6 we show numerically that with some judicious choices, this approximate solution is close to an equilibrium solution and explain why.
For the case of a vortex embedded in a uniform zonal shear flow and , Moore & Saffman (1971) found a family of analytic, stable 2-dimensional solutions to equations (33) – (35) consisting of an elliptical vortex with uniform vertical vorticity inside the vortex. For , they found
| (38) |
where is the horizontal aspect ratio (length of of the ellipse’s major diameter in to its minor diameter in ). As increases, zonal flow’s shear stretches the vortex in the directions and increases. Note that Moore-Saffman vortices, like all steady, inviscid, constant-density, 2D solutions to Euler’s equation, streamlines and vorticity contours that are coincident, so . In the limit of , , which is the case where velocity induced by the vortex is negligible. The flow streamlines are strictly zonal. One of the properties of Moore-Saffman vortices that we shall exploit later in this section is that, for constant and , the ellipticity is determined by equation (38), but the diameter of the vortex is a free parameter. Therefore, regardless of the size of the vortex in equation (38), it is a solution to equations (33) – (35) with .
Calculations of Moore-Saffman vortices in 2-dimensions show they are robust, so they are therefore potentially useful building blocks of initial 3-dimensional vortices even though they have and even though their vertical vorticities are uniform and do not look like the GRS, which has a pronounced local minimum of at or near its center (i.e., the GRS is “hollow”). However, we do make one change to the Moore-Saffman vortices when we use them to build a non-equilibrium initial vortex. We smooth the outer edge of the vortex and include an annular region of opposite-signed at the outer edge, to create shielded vortices. Observations at the cloud-top level show that the Jovian vortices are shielded (Shetty & Marcus, 2010; Wong et al., 2021; Grassi et al., 2018; Scarica et al., 2022; Choi et al., 2007) and that the horizontal thickness of the GRS’s opposite-signed annular shield is 2000 km. To create our Moore-Saffman-like vortices at the cloud-top level, we define the following elliptical coordinates for convenience.
| (39) | |||||
| (40) |
where is the center of the vortex. We define the velocity field of the vortex as
| (41) | |||||
| (42) | |||||
| (43) |
where is the elliptical radius of the vortex (the locus where the outer annular, opposite-signed, shield begins), and is the characteristic thickness of the annulus. We use throughout this study. The value of is determined by via equation (38), and . In the limit , the vortex given by equations (41) – (43) is an exact Moore-Saffman vortex with vorticity . Of course, neither the 3-dimensional initial vortex constructed from Moore-Saffman vortices or from the vortices in equations (41) – (43) are exact equilibria of equations (33) – (35), but we shall show that they work well enough.
5.3 Projection Methods
Two-dimensional vortices that satisfy equations (33) and (34) can be stacked along any arbitrary direction and satisfy the 3-dimensional governing equations (33) – (36) and (23) – (24) (but not equation (37)). Two evident directions along which to have the centers of each 2-dimensional vortex lie are the axis as in figure 4(a) or the axis, parallel to the planet’s rotation axis, as in figure 4(b). One would choose the former direction if the Rossby number were large so that the stratification was more important than the Coriolis forces (like a tornado), and choose the latter orientation if vice versa. For a low-Rossby-number barotropic flow, the Taylor-Proudman theorem would make the flow independent of and the vortex would be aligned along the axis. In either case, the strong stratification of the Jovian atmosphere makes the flow baroclinic, so that regardless of the orientation of the stacking, to satisfy equations (33) – (36) and (23) – (24), all of the 2-dimensional vortices lie in – planes rather than – planes, and the flows have , rather than . See figure 4.
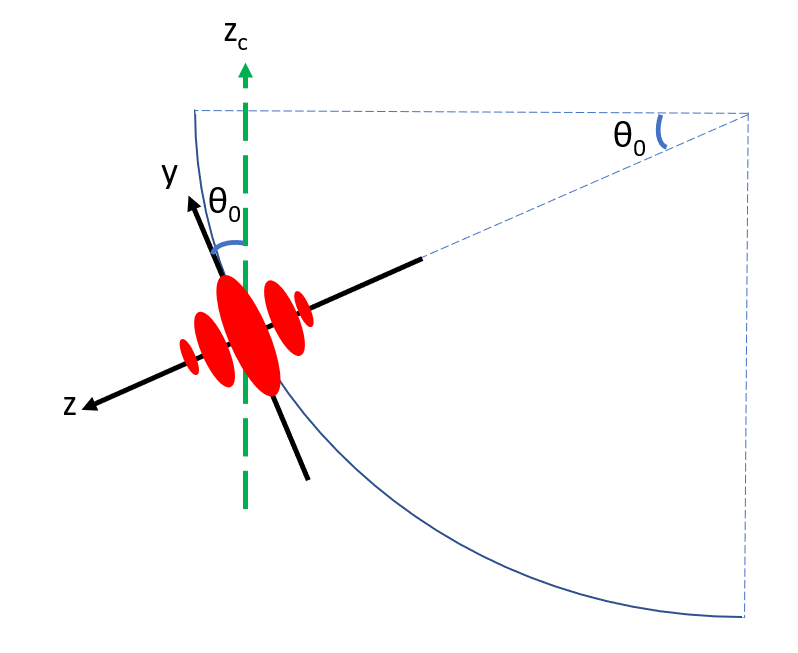
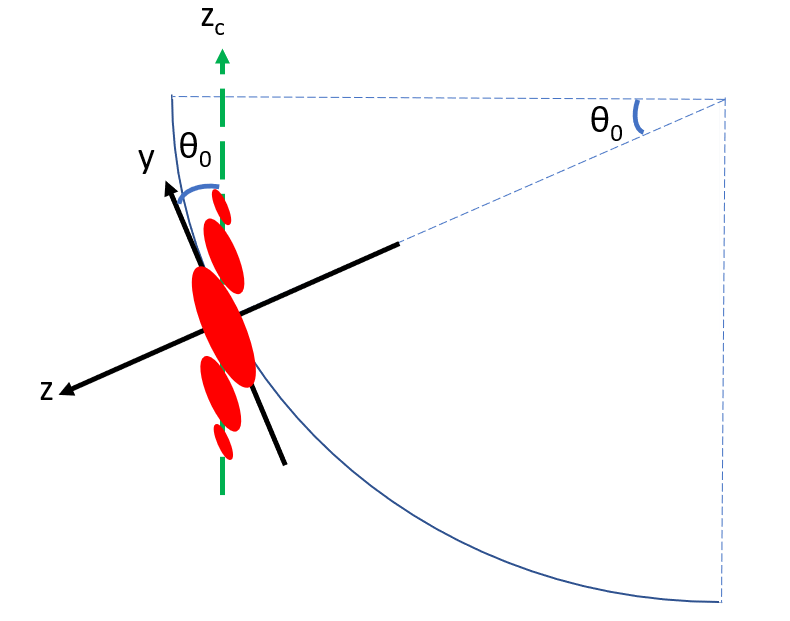
Although we shall show in the next section that a 3-dimensional vortex is well-approximated by a stack of 2-dimensional vortices with , constructing 3-dimensional vortices from observations is challenging because currently the 2-dimensional velocity can only be measured at the level of the visible cloud tops. The velocity elsewhere has little observational constraint. For this reason at height , we define a reference horizontal velocity and vertical vorticity . In future studies, we shall set equal to the observed values of the Jovian vortex we wish to study. Here, we forego observational velocities, and instead use the modified Moore-Saffman velocity in equations (41) – (43) because in this study we are more concerned with finding solutions to the full 3-dimensional equations of motion where a known and controllable reference is given. We are particularly interested in whether the vortex’s final quasi-equilibrium is approximately the same as its initial reference . In using equations (41) – (43), the value of is slaved to the value of by equation (38) and the value of . In this paper we use when calculating for all of the simulations, regardless of whether they use the constant-shear zonal velocity or the Jovian zonal velocity shown in figure 3.
To create the 2-dimensional velocities needed for the stacked vortex at the collocation points , rather than use observations (which do not exist) or using other 2-dimensional solutions to (33) and (34) (for which we have no guidance on what solutions to compute), we create new 2-dimensional velocities and vertical vorticities at the other collocation points by projecting the reference vertical vorticity to other heights . (The 2-dimensional velocity at any is uniquely determined by because at all .) For example, we could create a columnar stacked vortex aligned with the axis by defining for all . Of course, the GRS is not an infinite column, and we require that it has a well-defined top and bottom. One way to do that is by defining a family of vortices aligned with axis (that we call the family):
| (44) |
with
| (45) |
that projects along the axis. Here, is the projection function, which in this case determines how the magnitude of the vorticity changes as a function of . The choice of this functional form of is arbitrary, but note that an assumed Gaussian vertical dependence of the pressure, vertical vorticity, or angular velocity of the ocean and planetary vortices is quite common (c.f., Yim et al. (2016); Morales-Juberías & Dowling (2013); Mahdinia et al. (2017)). We do not expect the of the final quasi-equilibrium vortex to have an exact Gaussian vertical dependence. However, by carefully choosing and the other properties of the initial vortex, we are trying to “nudge” the final solution of our initial-value code to a hoped-for attracting basin that looks like a Jovian vortex. We use and not in all projections. Because , the two choices are equivalent when and are re-scaled. We have labelled the family of initial conditions represented by equation (44) as because it projects along the planet’s spherical radial axis (as in figure 4(a)), while preserving the horizontal area of the vortex and decreasing the magnitude of as increases.
To construct an initial condition stacked as in figure 4(b) to create a family of vortices in the family, then we set
| (46) |
where we have used the fact that equations (10) and (11) define the locus of point along a line parallel to the planet’s spin axis .
Rather than requiring that the tops and bottoms of vortices be defined as the locations where their go to zero, we can define them by having their horizontal areas go to zero. To do that, we map the x-y plane at the cloud-top level to other depths via a hybrid coordinate . For example,
| (47) | |||||
| (48) | |||||
| (49) |
produces a family of vortices, , oriented as in figure 4(a), where the magnitude of is constant along but the horizontal area of the vortex decreases in a self-similar way from to the tops and bottoms of the vortices. A similar family of initial vortices, , but oriented as in figure 4(b) can be created with
| (50) | |||||
| (51) | |||||
| (52) |
If we had used Moore-Saffman vortices, rather the modified velocity in equations (41) – (43), then the 2-dimensional vortices at every height within the and families would be exact solutions to equations (33) – (35) with , rather than just good approximations, so we might expect that the initial vortices in these two families are close to the equilibrium solutions of the full equations.
However, the vortices in the and families are far from equilibrium and not approximate solutions to equations (33) – (34). The shear of the zonal flow at the tops and bottoms of these vortices is the same as it is at , but the at the tops and bottoms is much smaller than it is at . Thus we expect that as these vortices evolve in time, their tops and bottoms become stretched and elongated in the direction and possible destroyed. Our motivation for examining initial vortices of the family in the next section is that Galanti et al. (2019) and Parisi et al. (2021) used them, or vortices similar to them, as GRS models (they did not solve the governing equations of motion) to interpret Juno data.
Examples of for vortices from the and families are shown in Figure 5.
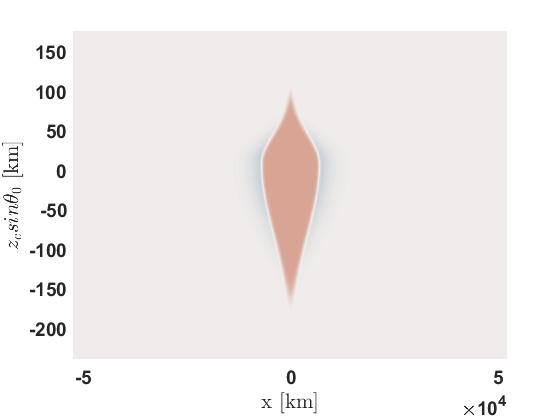
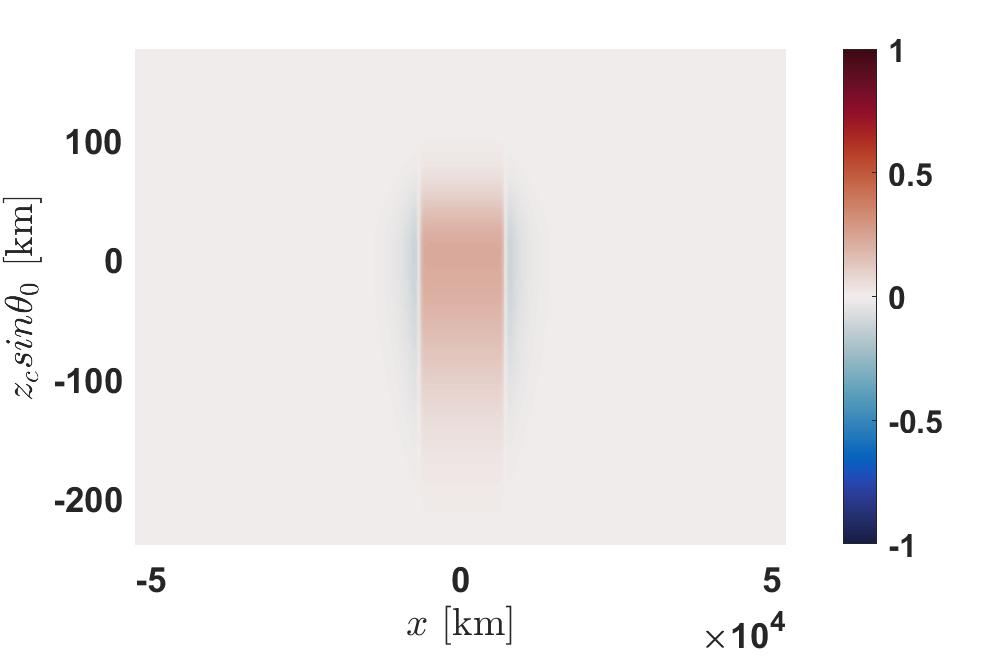
For all four families of vortices, is the height of the - plane where the initial anticyclones have their maximum values of and . It is also the - plane where the initial vortices have their maximum values of , and the - plane where the initial vortices have their maximum values of area. We define the mid-plane of the vortex as the height where the anticyclone has its maximum and note that is a function of time with . Typically, - plane at is where a vortex in the family will have its biggest vertical vorticity and where a vortex in the family will have its biggest horizontal area, so it is useful to track the flow fields in the mid-plane.
6 Numerical Results with
We examined several initial anticyclonic vortices from each of the four vortex families discussed in 5.3 with parameter values for (in equation (45)) in the range: km km, km km, and km (equivalently, between 500 mbar and 1 bar); and with parameter values for (in equations (41) – (43)) in the range , or equivalently . We chose km and km. Here, the initial Rossby number is defined as . Note that is slaved to the value of by equation (38) and the value of . In this paper we use when calculating for all of the simulations, regardless of whether they use the constant-shear zonal velocity or the Jovian zonal velocity shown in figure 3. We set S and . Throughout the paper, we report time in the unit of Earth days. Note that the figures of vertical slices are stretched vertically for graphical purposes. The simulated vortices are pancake vortices with very small vertical depths.
6.1 Orientation: aligned with the or axis?
The planetary vortices of interest in this study have low Rossby number (), and all the vortices that we examined have their final axes approximately aligned with the planet’s spin axis ( axis), even if they were initially aligned with the local gravity ( axis). This is consistent with our previous findings (Zhang & Marcus, 2022). For example, figure 6 shows how the central axis of a vortex initially in the family changes from the beginning to the end of a simulation. For all heights , we define the location of the the vortex center as
| (53) |
We use as the weighting factor because it is almost never negative and is a good proxy for the stream function of the horizontal velocity. If , then the central axis is aligned with axis, and (using equation (11)) if , it is aligned with the axis. Initially, the vortex in figure 6 is aligned with the axis, but by the end of the simulation for most values of , the slope , and the vortex is aligned with the axis. However it must be noted that because the vertical thickness of the vortex is so much smaller than its diameter (), the change in the location of the central axis during the simulation is extremely small.
The red curve defining in figure 6 does not align perfectly with the axis. A small portion of (approximately, km km) is unaligned. Our simulations show that whether the central axis of a vortex aligns with the direction of the local gravity ( axis) or with the axis depends on more than the value of the local Rossby number. However, we postpone that discussion for a future paper. All of our numerical simulations with initial vortices in the and families ended with their central axes approximately aligned with the axis. For this reason, we confine the remainder of this section to the evolution of vortices that are initially in the and families.

6.2
Using equation (50), the maximum vertical vorticity of the initial vortices is the same at each height, but the area of the vortex changes. We examined several initial vortices, and in all cases, the initial vortex converges to a large, quasi-steady vortex that drifts longitudinally. The vertical size of the vortex remains similar to its initial condition. An initially deeper vortex evolves to a deeper final state unless there is convectional instability locally (See section 8 for details).
To illustrate how this family of vortices evolves, 6.2.1 shows an example of an initial vortex embedded in a constant-shear zonal velocity (Case ). In 6.2.2, we examine the same initial vortex embedded in the observed Jovian zonal velocity (Case ). Both cases have km, km,, (equivalently, ), and km (equivalently, mbar; note that , the top of the visible clouds, corresponds to bar). One reason that we choose this value was so that there are no initial, local convective instabilities (see 8).
6.2.1 Vortex Embedded within a Zonal Velocity with Constant Shear (Case )
Figure 7 shows in the - plane at the mid-plane at four different times. Because the initial condition is not in exact equilibrium, parts of it are torn apart by the zonal flow and roll up into small vortices. However, most of the initial vortex resists the zonal shear and remains intact. By the end of the simulation, all of the small vortices have merged back into the main vortex or becomes sheared out in the direction modifying the zonal flow, and there is only one large longitudinally-drifting vortex. Figure 8 shows in the - plane at , which contains the center axis of the vortex. Throughout the simulation, the heights of the top and bottom of the vortex remain approximately constant. The hollowness, or local minimum of , at the central rotation axis of the vortex is visible at most values of .
The truly surprising result is that the vortex becomes hollow. The initial in figures 7a and 8a is non-hollow, but in the center and along the central spin axis of the vortices in figures 7bcd and 8bcd, is smaller than it is in the outer parts of the vortices. In our previous 2-dimensional, quasigeostrophic studies of vortex dynamics, we never found an initially non-hollow vortex spontaneously becoming hollow. Moreover, the only way we found to prevent an initially hollow vortex from becoming non-hollow was by adding an artificial “bottom topography” to the governing quasigeostrophic equation of motion (Youssef, 2000; Shetty et al., 2006). However, Barranco & Marcus (2005) found stable hollow vortices in 3D protoplanetary disk simulations, which indicates that the hollow vortex structure is indeed a three-dimensional effect.
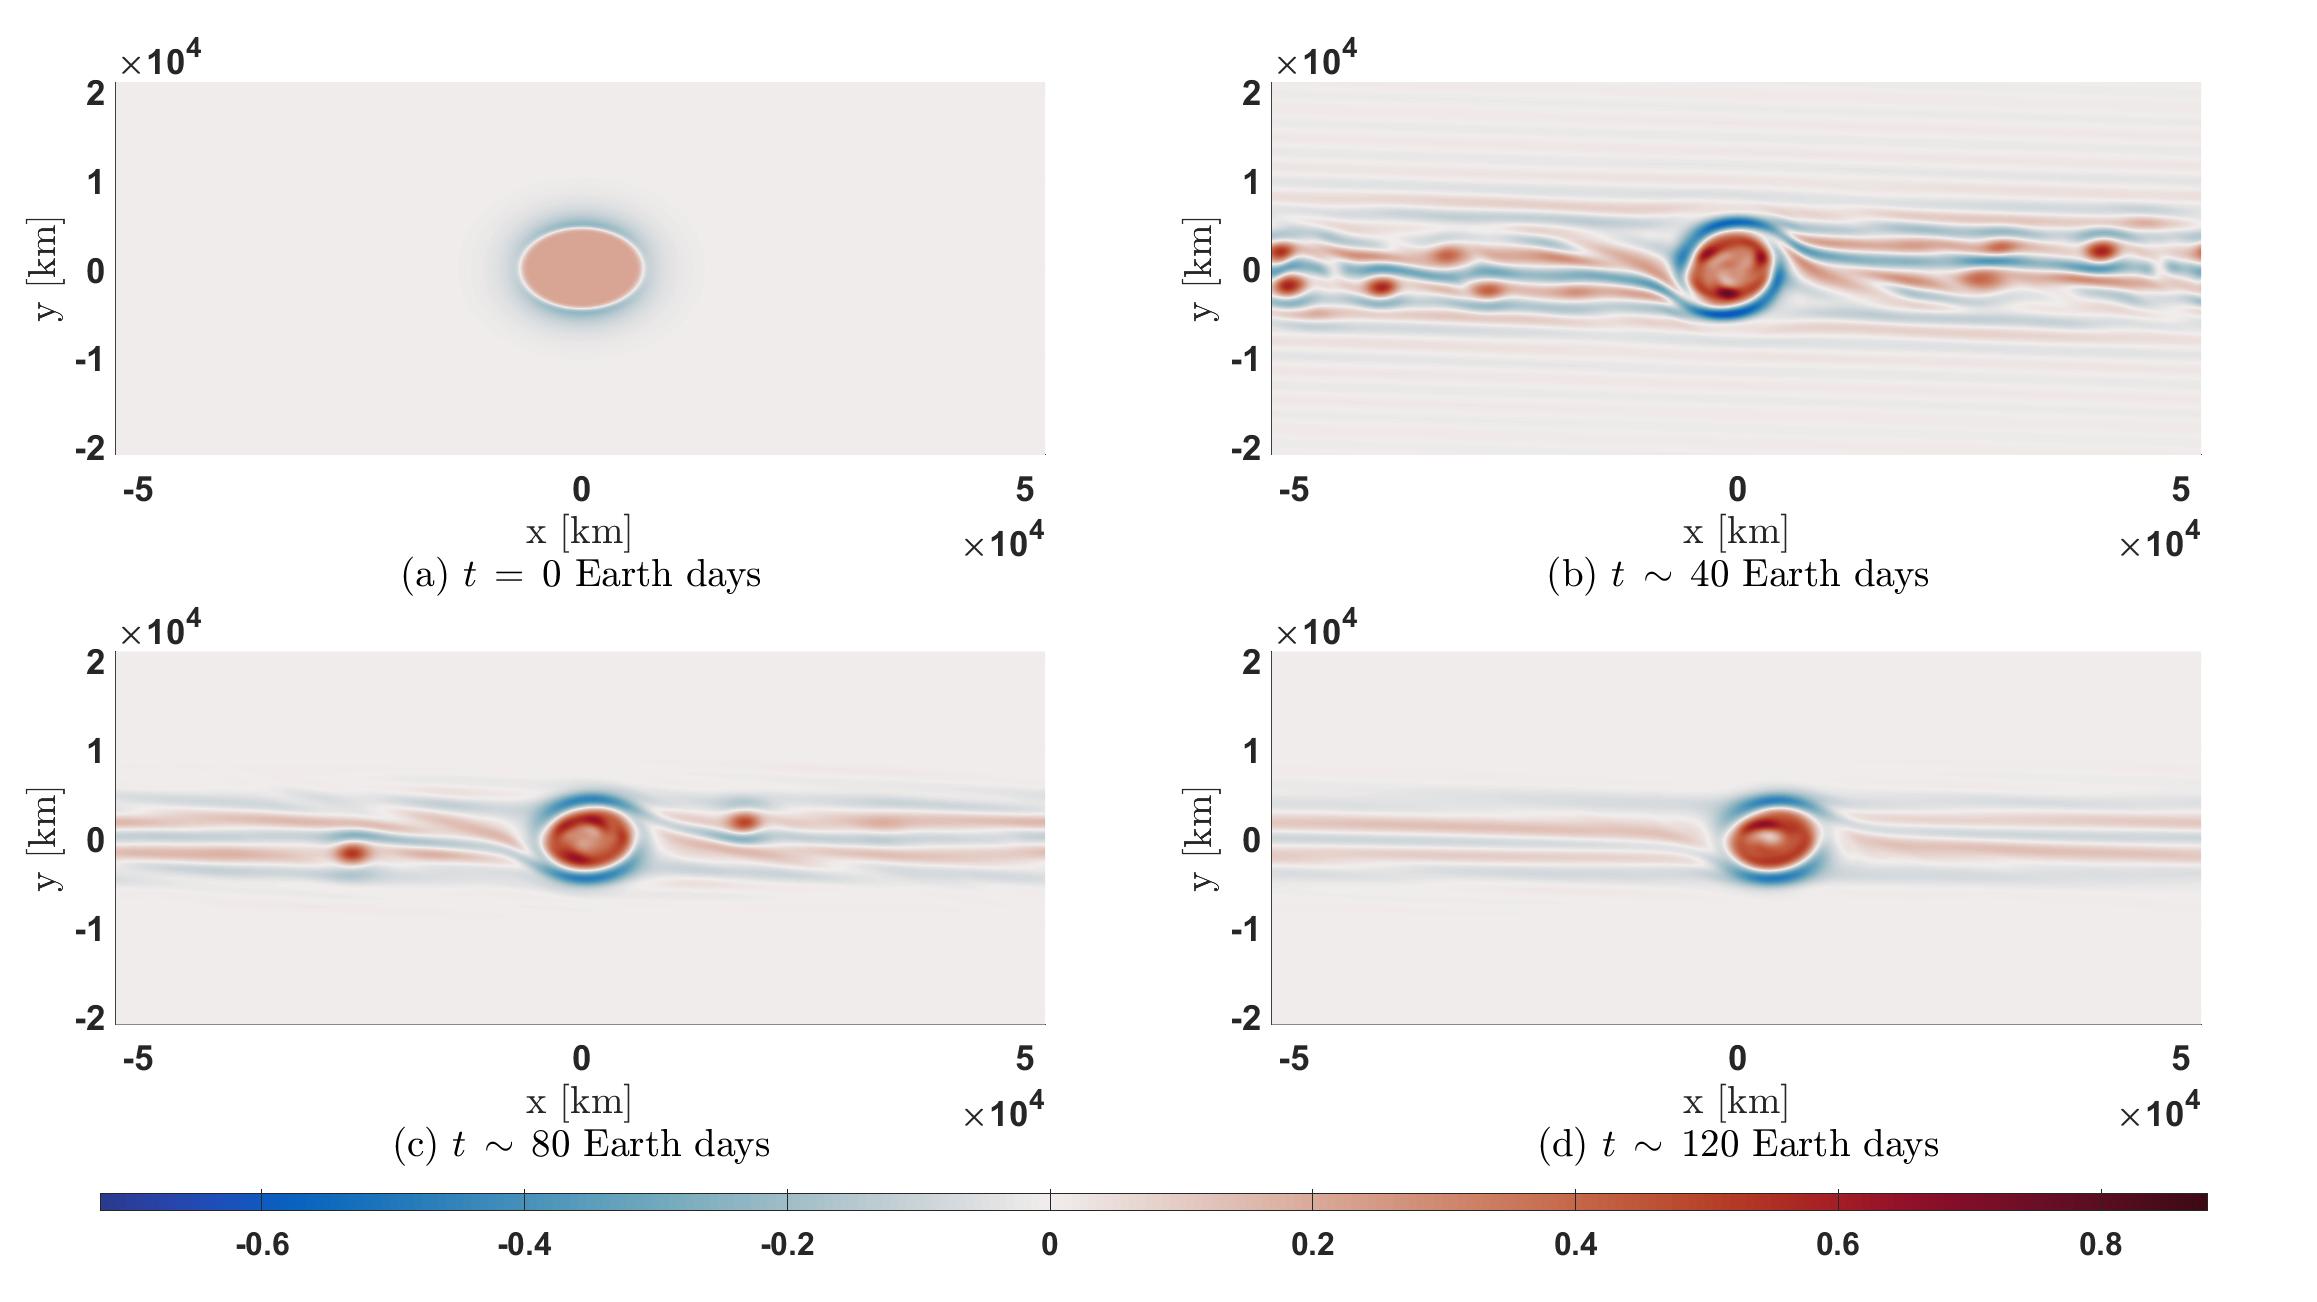
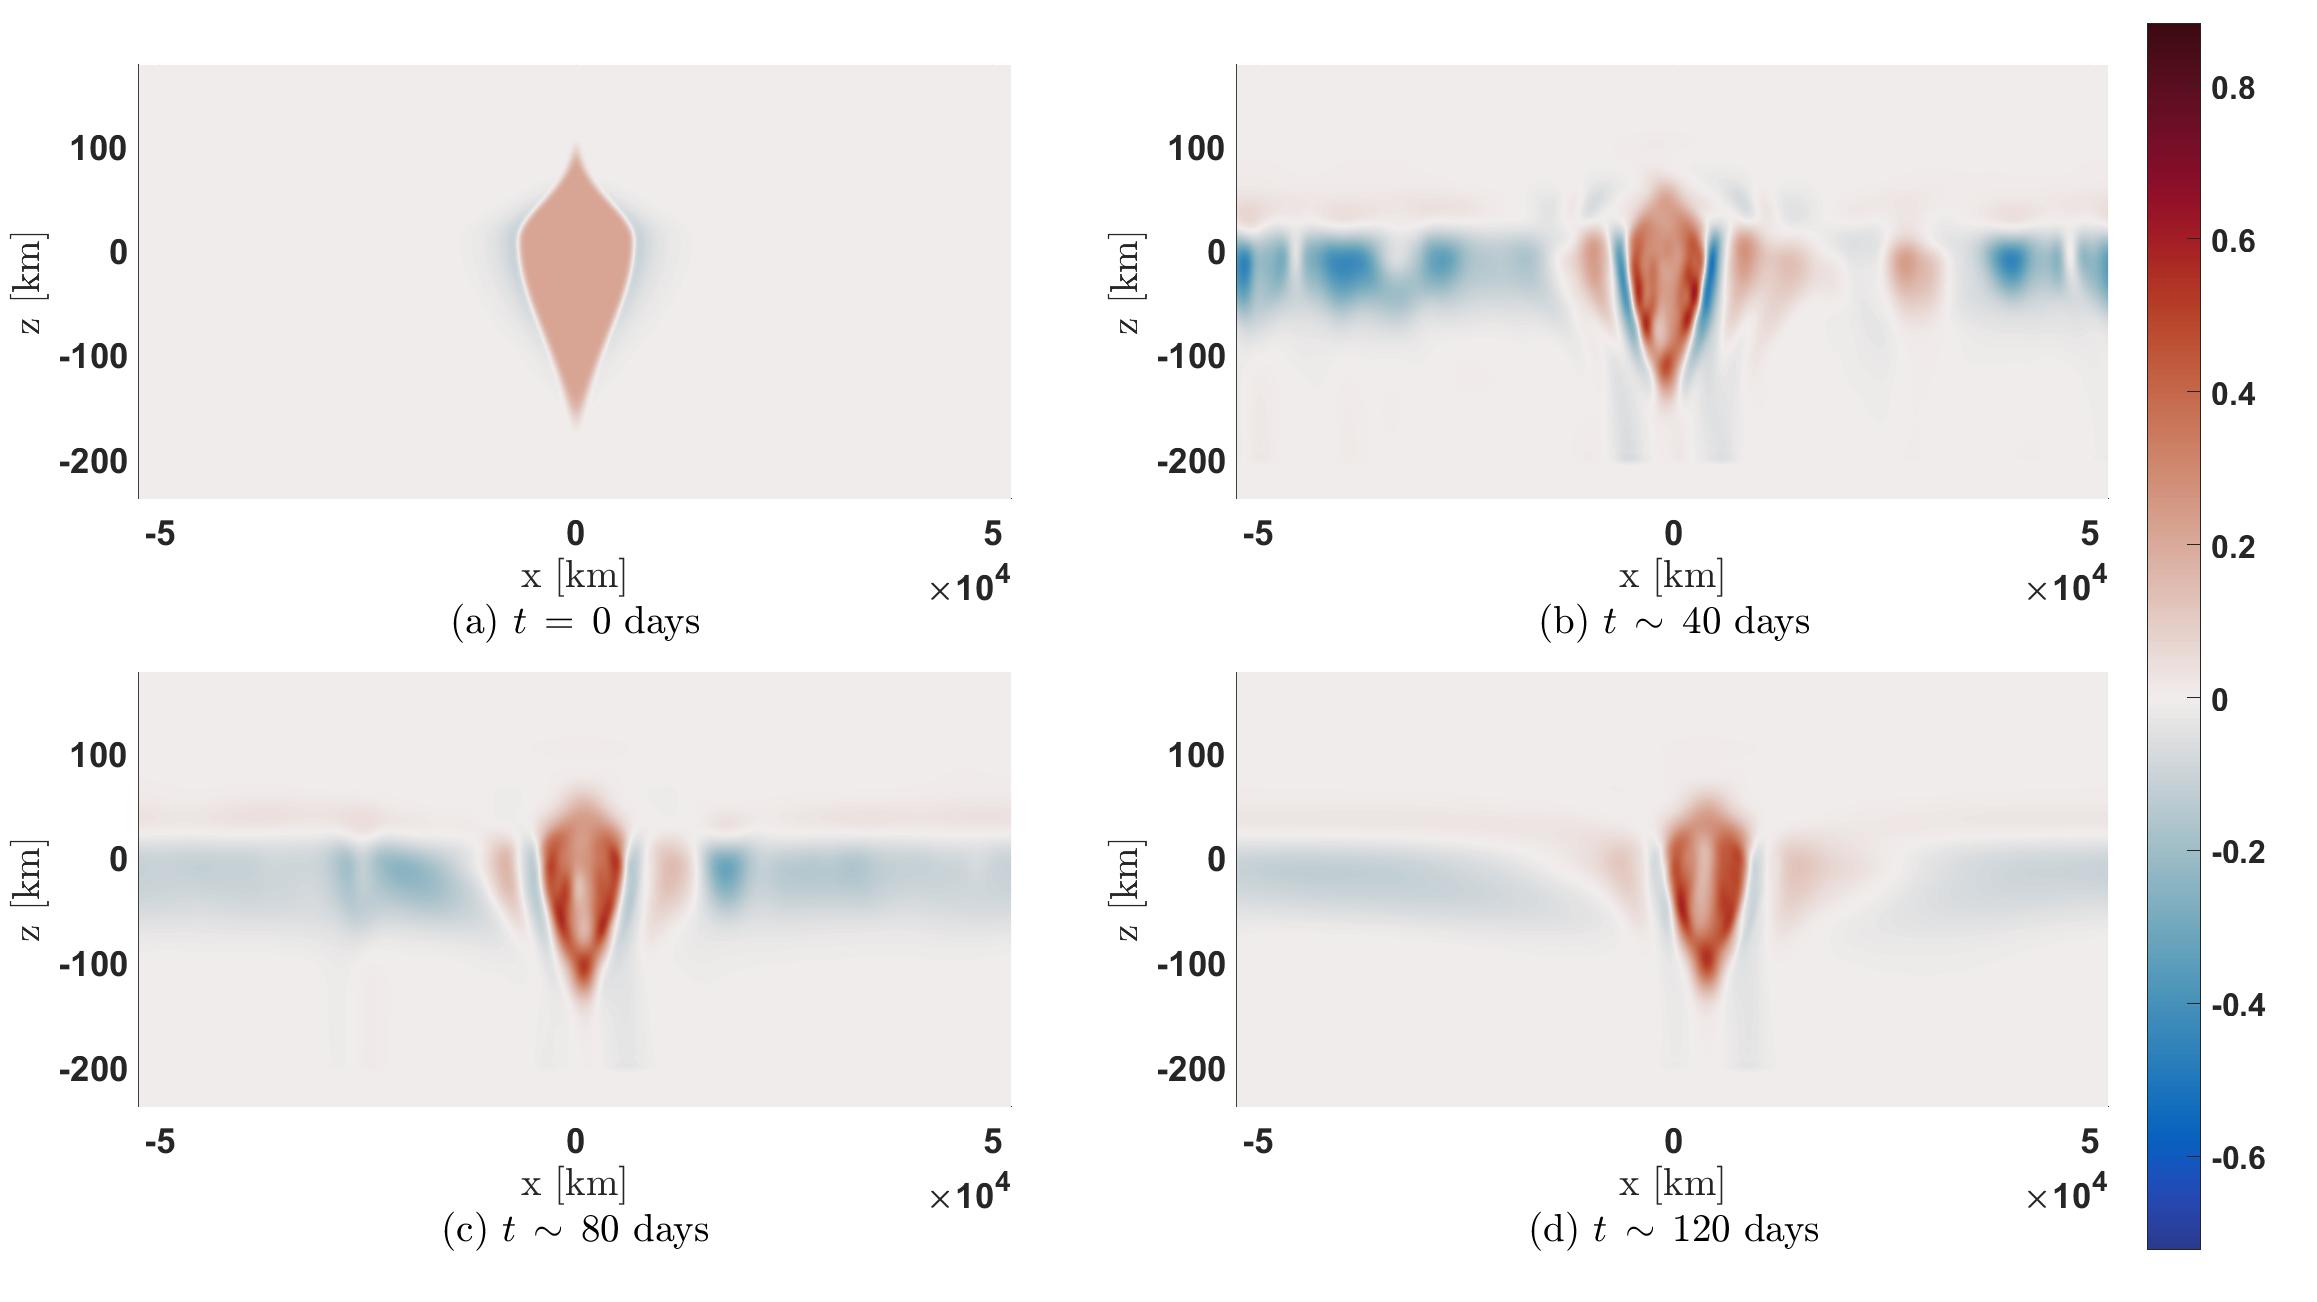
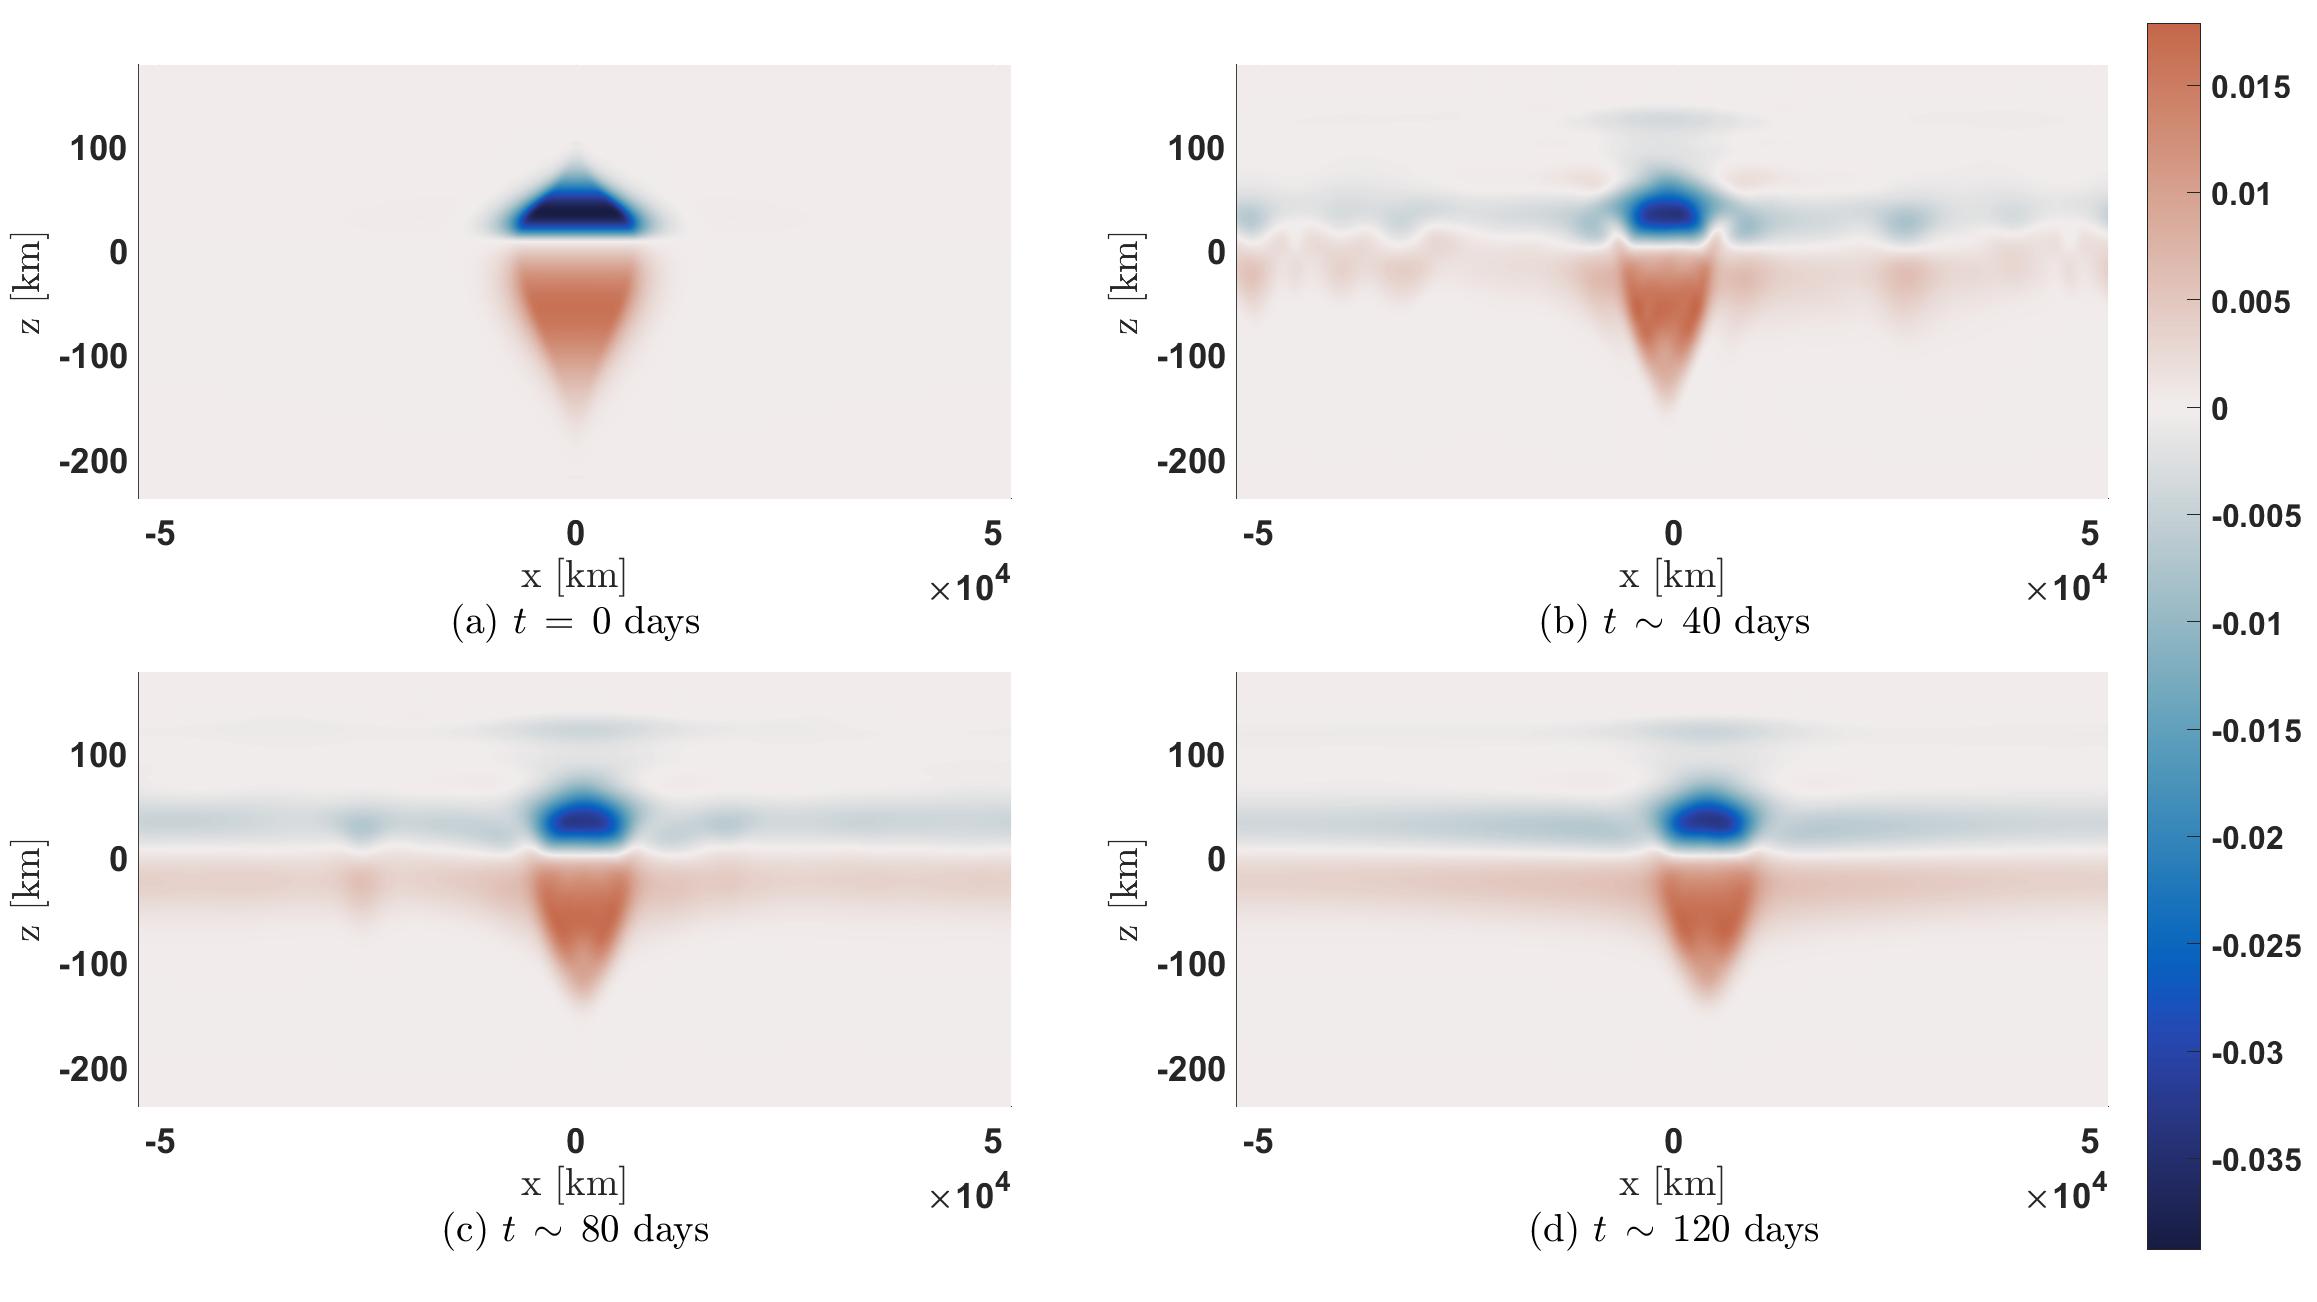
Figure 9 shows in the - plane passing through the center of the vortex. The cool-top and warm-bottom of the vortex occur because the major force balance in the component of the momentum equation is hydrostatic balance
| (54) |
An anticyclone has a high pressure center, so at heights above the mid-plane, and below the mid-plane to maintain the balance. The cooler temperature of the top of the GRS and other Jovian anticyclones has been observed many times (Flasar et al., 1981; Fletcher et al., 2010, 2016).
Figure 10 shows in the mid-plane of the vortex, corresponding to the horizontal white region in the middle of figure 9. It is not known whether the mid-planes of the Jovian vortices are at, below, or above the visible cloud-top level at (i.e., at 1 bar). Initially, the mid-planes of our vortices are at , and although the height of the mid-plane changes in time, they remain near . Figure 10 shows a thin annulus of high at the outer edge of the vortex, approximately coincident with the shield of negative . This is an unexpected result, and the figure shows that this annulus was not present in the initial conditions. Because there is no corresponding anomaly in at the location of this annulus (and because = + ), there is a high-temperature annulus of at the outer edge of the vortex where the characteristic temperature of the annulus is approximately 1 K warmer than the surrounding fluid. Because this annulus was not present initially and because , the energy equation (22) shows that the annulus of high was created by a downward vertical velocity that formed in the annulus. That is, the high-temperature annulus was created by adiabatic heating. de Pater et al. (2010) observed m bright annular rings around the GRS and other Jovian anticyclones and hypothesized (1) that the bright rings were created by down-welling velocities in the annuli that could not be directly observed; (2) that the adiabatic heating caused by the unseen down-welling locally dried out the atmosphere making the annular regions free of clouds; and (3) that the m radiation from the underlying, high-temperature atmosphere, which would normally be blocked by the clouds, would be observed. Figure 10 supports these hypotheses.
Figure 11 shows the maximum values of , , , and in each - plane as functions of for the quasi-steady final vortex at day 120. The figure also shows as a function of along the central axis of the vortex. Panels a and c show that the vertical profiles of and are similar, as would be expected from geostrophic balance in equation (21). The mid-plane of the final vortex at 120 days is not very different from its initial location at . Panel b shows that the the vertical vorticity does not have a sharp maximum at the vortex mid-plane, but is nearly constant from down to km. This is evidence that the final vortex is a vortex. Panel d shows that is of the full velocity at most in the three-dimensional simulation. Panel e shows which is the stratification due to the net velocity (zonal flow + vortex) along the central axis of the vortex. The value is nondimensionalized by . When this quantity is greater than zero, it means that the vortex has locally mixed the fluid in a way to de-stratify the vortex; the mixing has increased the potential temperature at the bottom of the vortex at the expense of the potential temperature at the top of the vortex. (In other words, mixing has increased the potential mass density at the top of the vortex at the expense of the mass density at the bottom of the vortex, making it more prone to local convective instabilities). In regions where , mixing has super-stratified the fluid, making it more stable to convection.
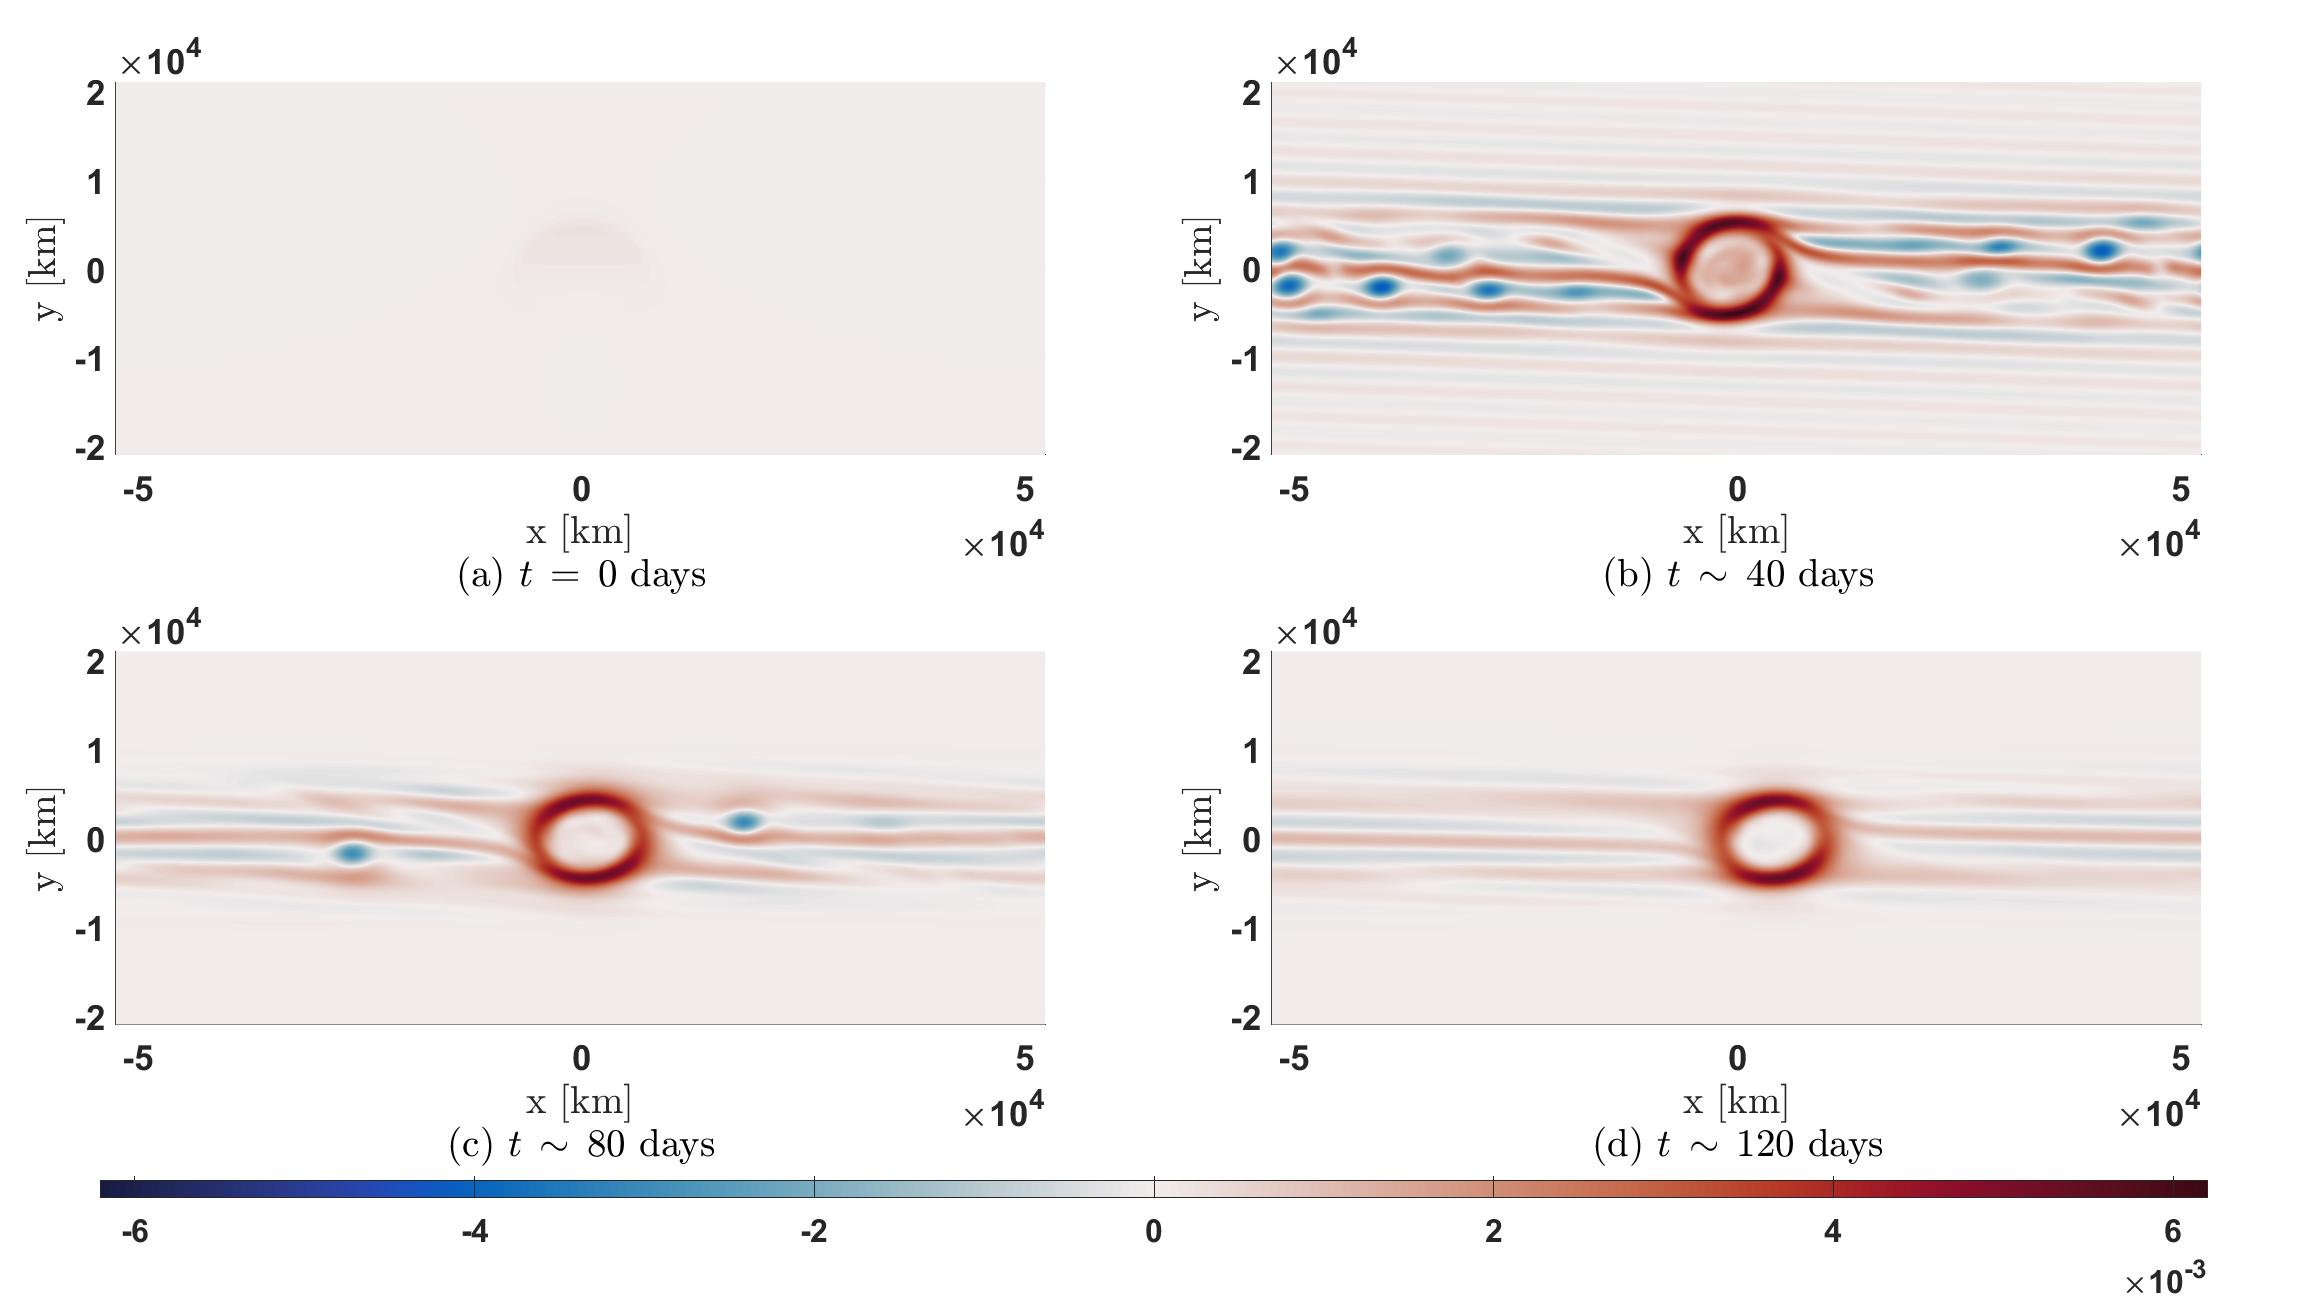

6.2.2 Vortex Embedded in the Jovian Zonal Velocity (case CV2)
Note that case CV1 is conducted in a constant-shear zonal flow without the locations of maximum and minimum zonal velocity. On the other hand, Shetty et al. (2007) suggested that the latter is important to make hollow vortices in stable equilibrium in quasi-geostrophic system with bottom topography. We repeated the numerical calculation with the same initial vortex that we used in the case, but embedded in the Jovian zonal velocity (blue curve shown in figure 3), rather than with the straight red line (which has no local maximum or minimum velocities). The purpose of this simulation is to see if including the location of maximum and minimum zonal velocity can significantly affect the simulation result. Figures 12 – 14 shows the vertical vorticity and potential temperature of this new vortex labeled . To our surprise, the two final vortices are qualitatively similar, other than the fact that the horizontal area of of the vortex is smaller than that of the vortex at day 120. They both are shielded and both developed warm, thin annular rings at their outer edges like the large Jovian anticyclones. In addition, they both developed hollow interiors like the GRS. Our result indicates that the location (or existence) of the maximum and minimum zonal velocity is not important for the vortex features we capture in both simulations (hollowness, warm ring, etc.)


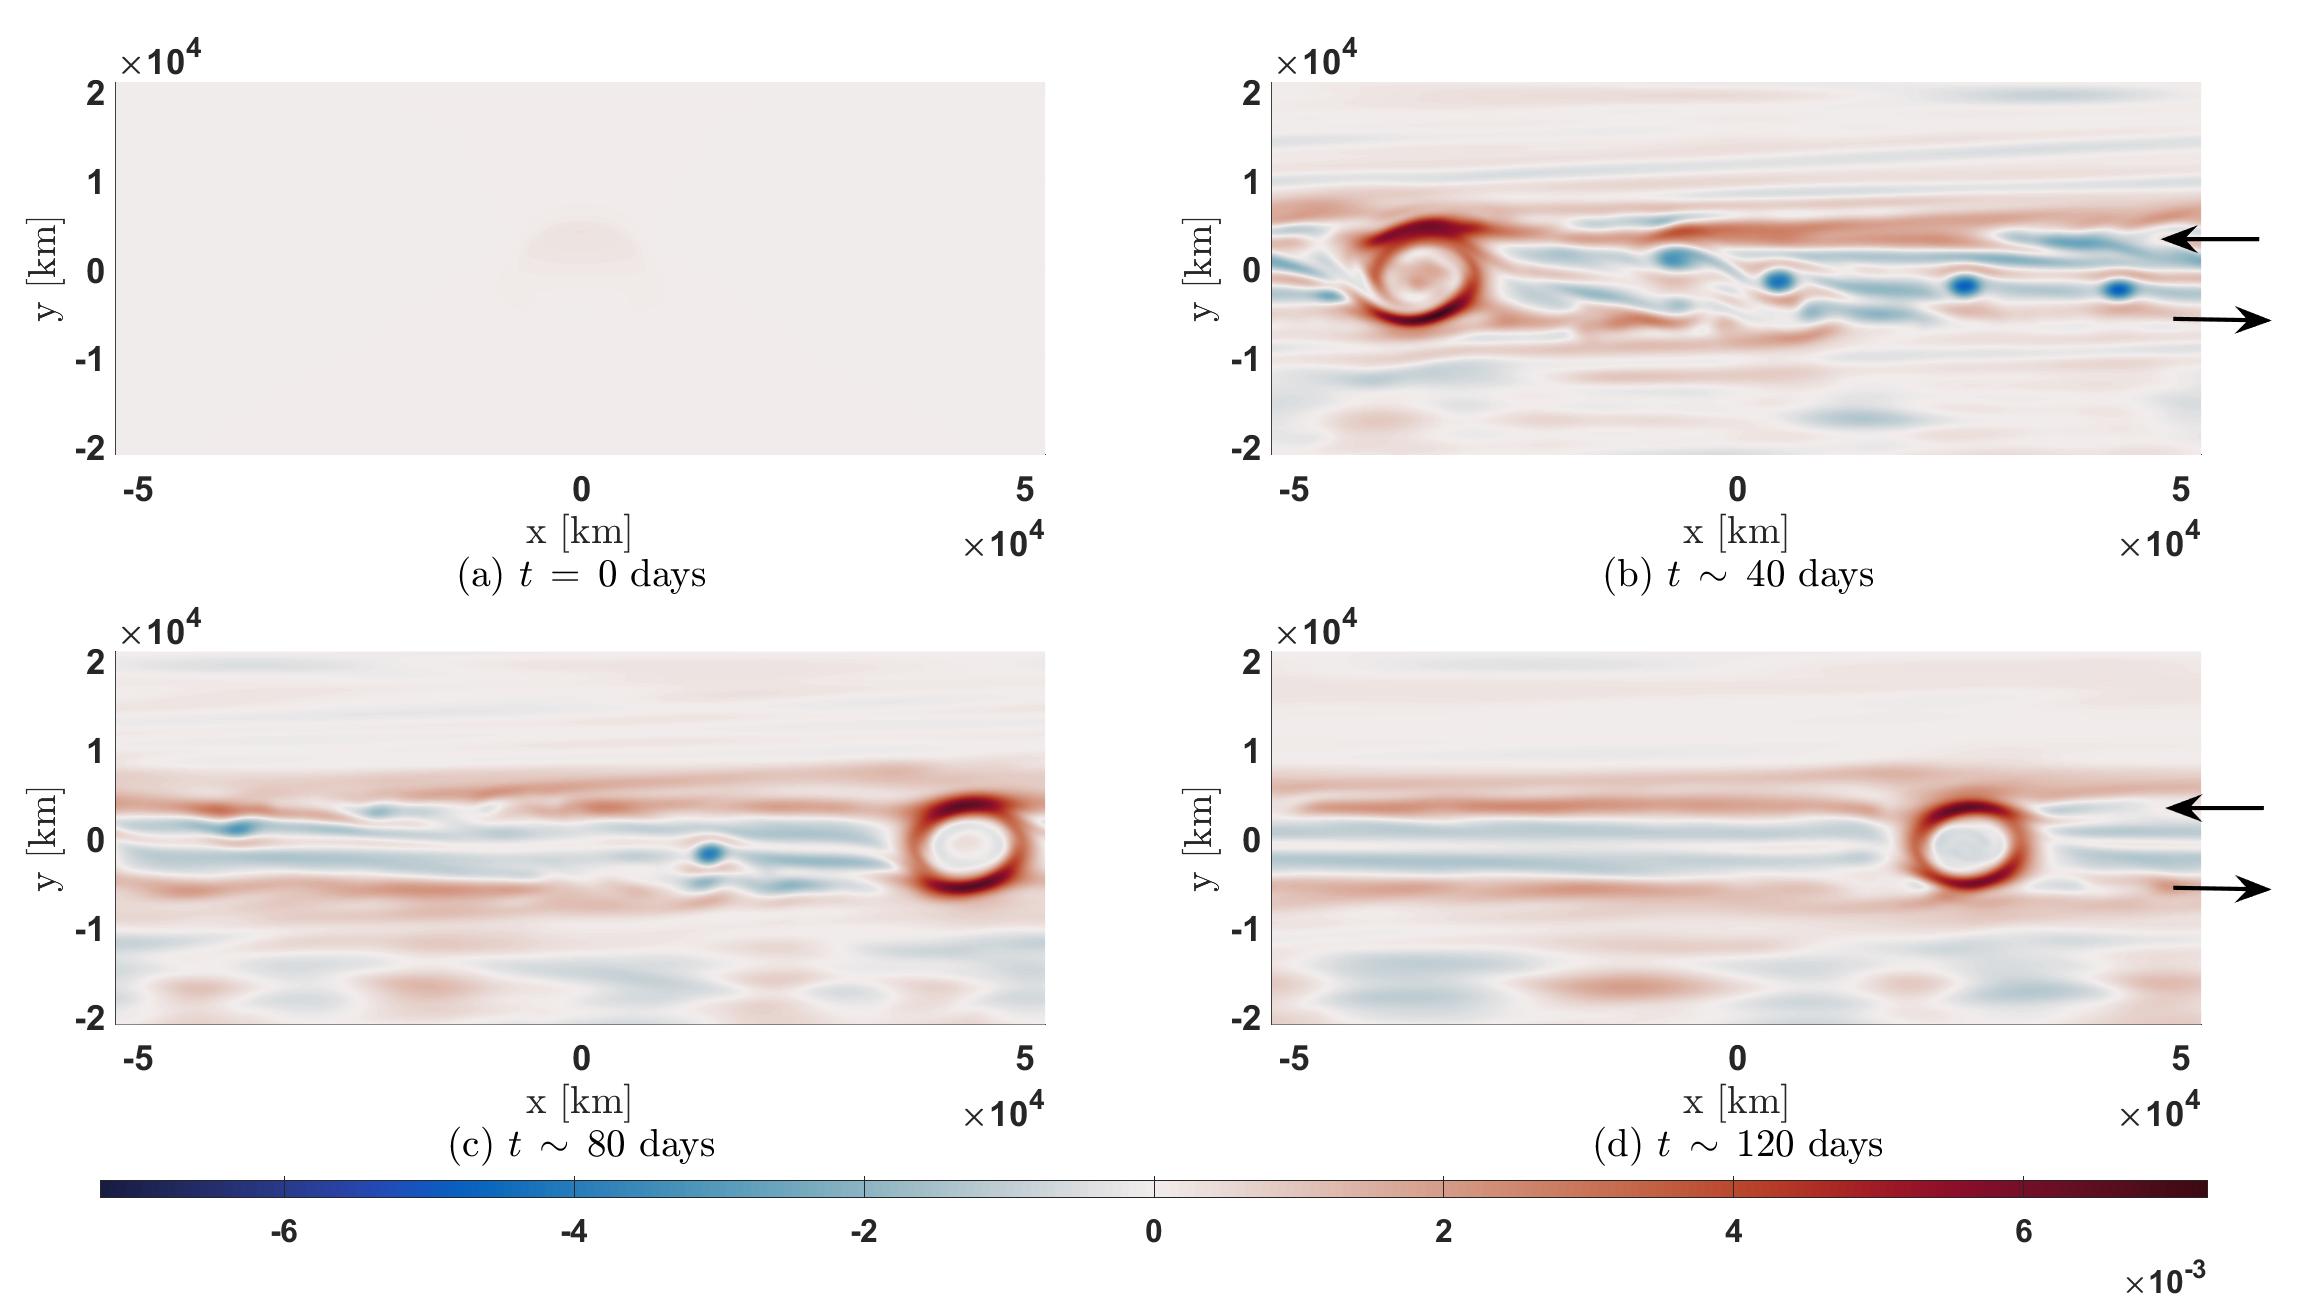
Although we did not intend to recover the velocity and temperature field of any specific Jovian vortex in this study, the velocities of the and quasi-steady vortices are qualitatively similar to the GRS because of their hollow interiors. This can be seen in figure 15, which shows the of the GRS and of the vortex along their north-south minor principle axes as functions of , at the cloud-top plane. The interiors of the vortices are the regions in where ; the shields are the regions just outside interiors where . The of a non-hollow shielded vortex would monotonically decrease as a function of from its maximum value at the latitude of the vortex center at until it became negative in the shield, and then it would increase to zero at the outer edge of the shield. Both the GRS and have pronounced local minima of at surrounded in the north and south by large “shoulders” of positive . A measure of the hollowness of a vortex is the ratio of the largest value of in the shoulders divided by the local minimum value of at the vortex center. Both the GRS and have similar ratios of 2. However, the GRS is larger than , and its region of hollowness is also larger,

6.3
Using equation (46) to create an initial vortex makes the horizontal area of the vertical vorticity of the initial vortex the same at each height, but the magnitude of decreases away from the mid-plane, vanishing at the tops and bottoms of the vortex. None of our simulations that began with vortices produced a quasi-steady vortex at the end of the simulation. The initial vortex either quickly filamented into smaller vortices due to the shear of the zonal flow being much greater than at the tops and bottoms of the vortices, or the initial vortex broke apart due to a local convective instability (as discussed in 8 because the top of the initial vortex is too close to the mid-plane). In all cases, we found that the flow creates one or more quasi-steady vortices at the end of the simulation. This is shown in figures 16 – 17 for a vortex embedded in a zonal flow with constant shear (case ) and in figures 18 – 19 for a vortex embedded in the Jovian zonal flow shown in figure 3 (case ). For both cases, km, km, (equivalently, ), and km (equivalently, mbar). Initially, the vortices are column-like in the - plane with the area of the vortex on each - plane identical. For both cases, the initial vortices fragment within the first 40 days into filaments that roll-up into smaller vortices. However, during that same time the initial vortex and the smaller vortices that it spawns evolve into vortices. By day 80, many of the smaller vortices have merged with the large vortex, and by day 120 only a few vortices remain unmerged. We truncated the calculations after day 120 because the purpose of the calculations is to show that are far from equilibrium and that they quickly evolve into vortices. Based on 2-dimensional vortex dynamics in zonal flows, we expect that if we continue calculation the vortices whose central latitudes are closer together than the semi-minor radius of the largest vortex will eventually merge together.


6.4 How the Energy Equation Comes to Equilibrium
In 5.1, we showed that our initial conditions of the vortices were such that they satisfy the continuity equation (20), all three components of the steady momentum equation (21), and the ideal gas equations (23) and (24). However because , none of our initial conditions satisfied the energy equation (22). Numerically, we found that with the exception of equation (22) that the full equations of motion (20) – (24) were nearly satisfied because the initial characteristic times for , , and to change were long compared to the turn-around time of the vortex, but the initial characteristic time for to change was much faster. Of the two terms on the far right side of equation (22), only the can initially change because is initially zero. When the vortex reaches its finally steady state, the magnitude of the term has decreased approximately by a factor of 3 from its initial magnitude and is primarily balanced by the term. Thus, even though is small compared to (see equation (55) below), cannot be zero999If , then the only way that the steady version of eq. (22) could be satisfied would be if the isocontours of coincide with the 2-dimensional horizontal streamlines. and plays an essential role in creating the final steady vortex.
7 Scaling Analyses and the Shape of Vortices
7.1 Scaling Analysis of the Vertical Vorticity Equation
In 5.2 we showed that a steady vortex with has . However, none of our computed vortices have , and it is important to understand how small is, how it scales with the small dimensionless parameters of the flow, such as the Rossby number , and what terms balance it in the vertical component of the anelastic vorticity equation 26. To understand how the various terms in eq. (26) scale, we must first understand how scales, where angle brackets around a quantity are defined to mean the “characteristic value” of that quantity. We also define the characteristic horizontal length of the vortex evaluated at the vortex mid-plane. We also define the characteristic vertical size of a vortex evaluated at the vortex mid-plane where the norms are taken over the horizontal area of the vortex. For the types of vortices considered here, which are not vertically confined by walls, the vertical and horizontal components of the velocity have the same vertical scale , and horizontal scale . In our calculations, we found that is the approximate vertical scale height of and , smaller than the prescribed vertical depth or . Our result clearly shows that the vertical characteristic length scale of Jovian vortices can be different from their depth, which is similar to the findings that the Rossby deformation radius is less than the semi-minor radius of GRS (Marcus, 1988; Dowling & Ingersoll, 1989; Shetty & Marcus, 2010).
Note that these scaling relationships differ from those used for quasigeostrophic homogeneous flows, where it is assumed that the vertical scale height of the horizontal component of the velocity is much greater than that of the vertical component (see Chapter 6 of Pedlosky (1982)). Our numerical calculations suggest the following scalings,
| (55) | |||||
| (56) | |||||
| (57) | |||||
| (58) | |||||
| (59) | |||||
| (60) | |||||
| (61) | |||||
| (62) | |||||
| (63) | |||||
| (64) |
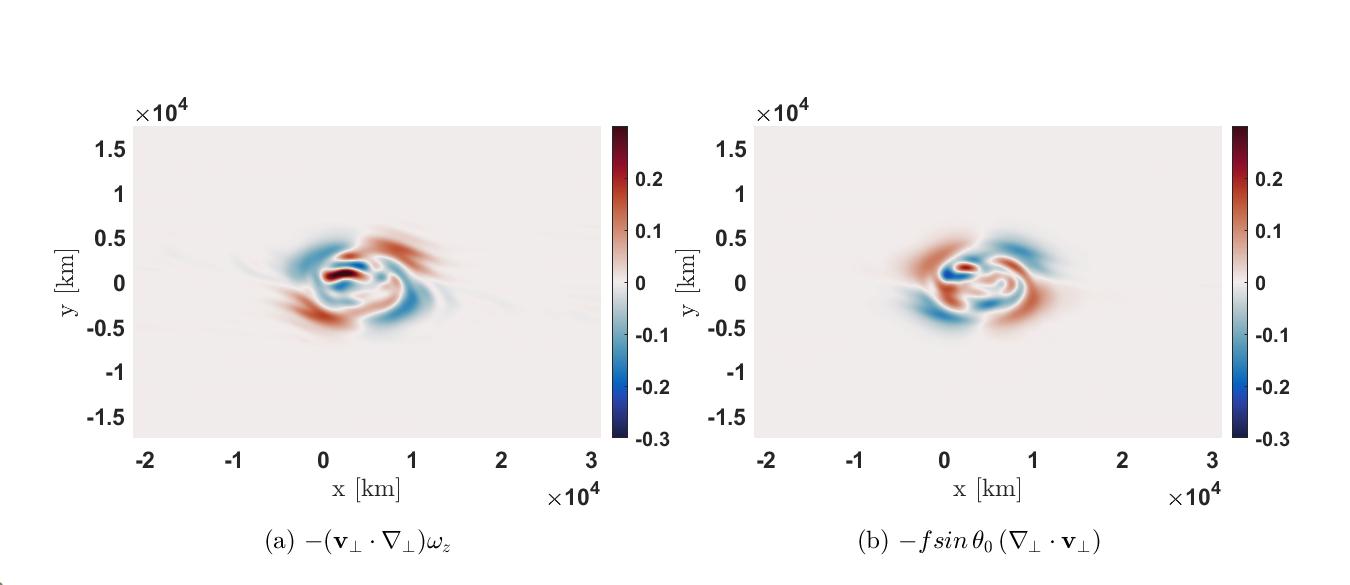
Note that the scaling equations (58) – (64) are for the seven terms on the right side of eq. (26). This tells us that when the flow is steady, that although is not identically zero as in eq. (34), it is small compared to . Thus, the 2-dimensional streamlines and the isocontours of are nearly coincident, as argued in 5.2. We remind the reader that this needed coincidence was the basis on which we argued that the CA family of vortices was far from equilibrium, whereas the CV family was near equilibrium. Scaling equations (58) – (64) also tell us that the dominant balance in eq. (26) is between and . This balance is illustrated in Fig. 20, which shows the values of (panel a) and (panel b) in the mid-plane. These two terms do not exactly cancel each other near the center because they both become small there (due to the hollowness of the vortex), and the other terms in eq. (26) become comparable to them. Note that for most Jovian vortices and our numerical simulations here, . For the simulations presented here . The value of for Jovian vortices is not well constrained by observations. Also note that for the largest Jovian vortices.
7.2 Shape of the Vortex
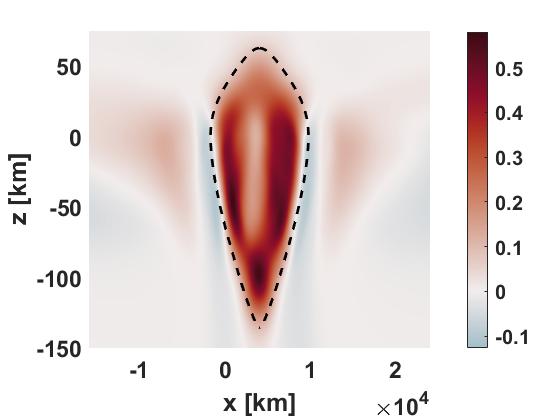
The shapes of the of the steady vortices in the - plane all have a distinctive “ice cream cone” shape (e.g., panel (d) in Figs. 8, 13, 17, and 19). We can explain these by recalling that
| (65) |
and using the hydrostatic approximation (54),
| (66) | |||||
| (67) |
To eliminate in eq, (67), we use the small-Rossby number limit (quaisgeosgtrophic approximation) of equation (35) with
| (68) |
For each within the vortex, averaging eq. (68) over the horizontal area within the vortex we define with
| (69) |
where has the dimension of a length squared. Our numerical calculations show that is approximately equal to the mean cross-sectional radius of the vortex.101010We first empirically found this relationship in Boussinesq vortices (Hassanzadeh et al., 2012). Because all the final, statistically-steady vortices computed here, regardless of their initial conditions, are vortices, it is reasonable to approximate as independent of and assign it a value . Thus, eqs. (67) – (69) become
| (70) |
Given , , , and , we can solve equation (70) for , the mean radius of the vortex, using the boundary conditions that at the top and bottom of the vortex. Figure 21 shows the results of solving equation (70) for for the and vortices, and that the equation works well in describing the vortex shapes.

8 Constraints Due to Local Convective Instabilities
We have found that if an initial vortex has any location in which is imaginary, or equivalently, that the flow is, as expected, locally unstable to convection. We can show that the convective instability limits how close the tops and bottoms of vortices can be to the vortex mid-planes.
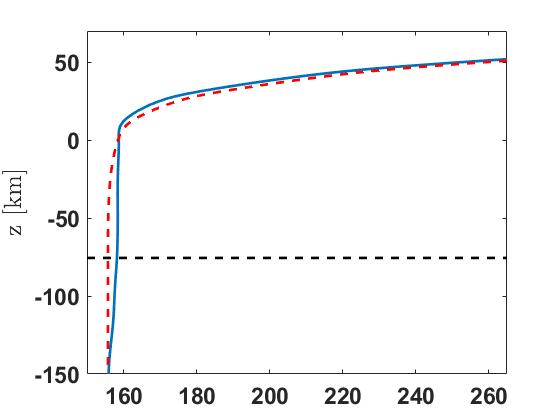
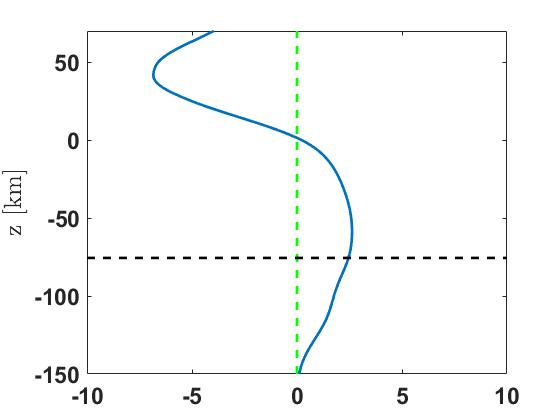
For all and locations within a vortex, we define and to be the top and bottom of the vortex, where the tops and bottom are the locations where is approximately zero. We define to be the location near the mid-plane where (where the red and blue lines cross in Fig. 22(a). The requirement that
| (71) |
at all locations in the fluid along with the hydrostatic pressure equation put bounds on and . Two integral relationships of hydrostatic equilibrium can be determined by integrating the approximate anelastic hydrostatic equation (54) from the bottom of the vortex at to and from to the top of the vortex at .
| (72) | |||||
| (73) |
Figure 23a schematically shows the potential temperature of an anticyclone similar to the one in Figure 22(a). Figure 23c shows the corresponding . Equations (72) and (73) show that the areas of the two lobes (between the vertical dotted red line and the solid blue curve in Figure 23c) above and below are the same. Let us modify the vortex in 23a for in order to minimize , while keeping the vortex at unchanged, and therefore the area of the lower lobe in figure 23c unchanged. The modified vortex is shown in figures 23b and 23d. To maintain hydrostatic equilibrium, the areas of the upper and lower lobes in the modified vortex in Figure 23d must also be the same. The modified vortex in figure 23b must have to be stable, but to minimize , it needs to have as small as possible. Thus, the vortex with the minimum has at . Our numerical simulations with initial vortices with a smaller than the minimum value implied by figure 23 show that the vortices either break apart or increase the heights of their tops as they evolve in time. A similar argument to the one illustrated in Fig. 23 shows that there is maximum upper bound to , and we have validated that argument numerically.
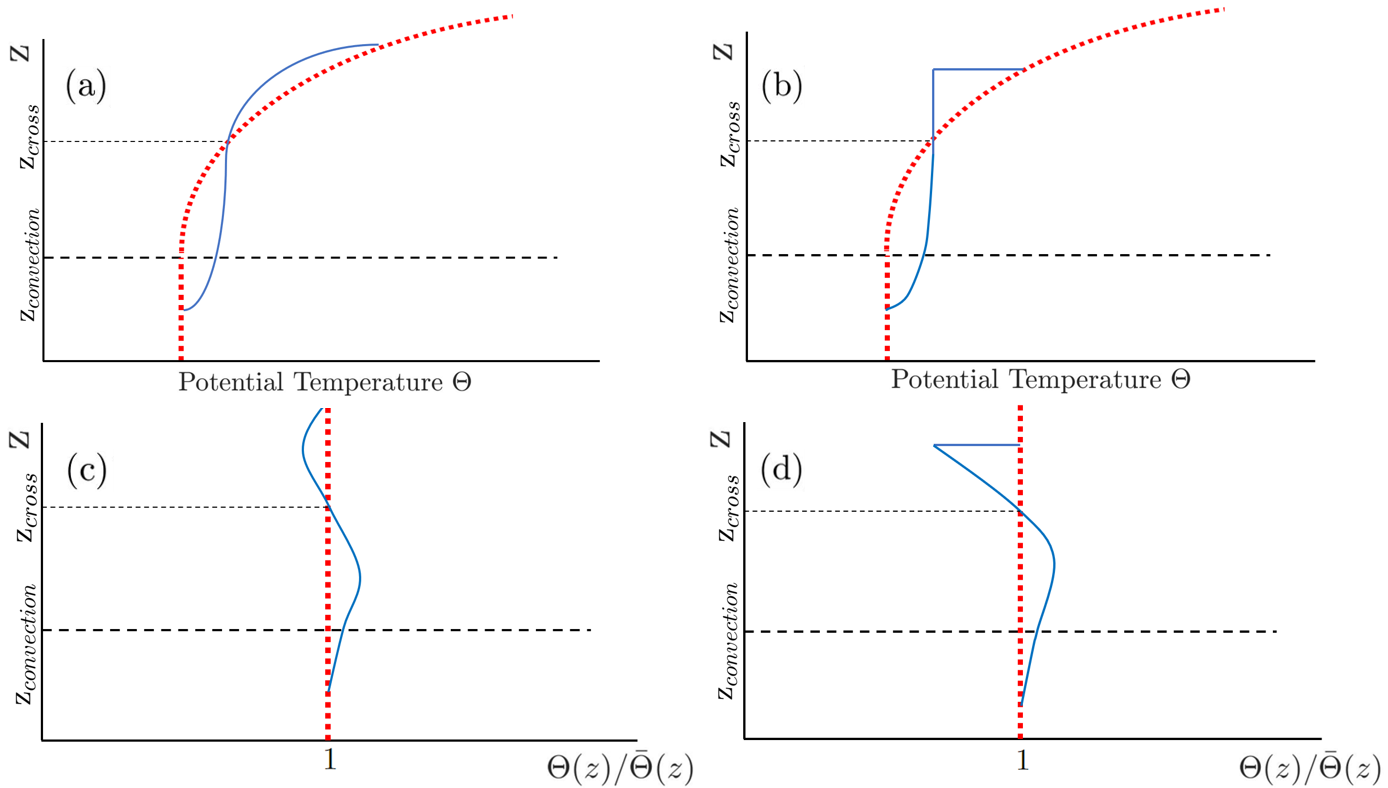
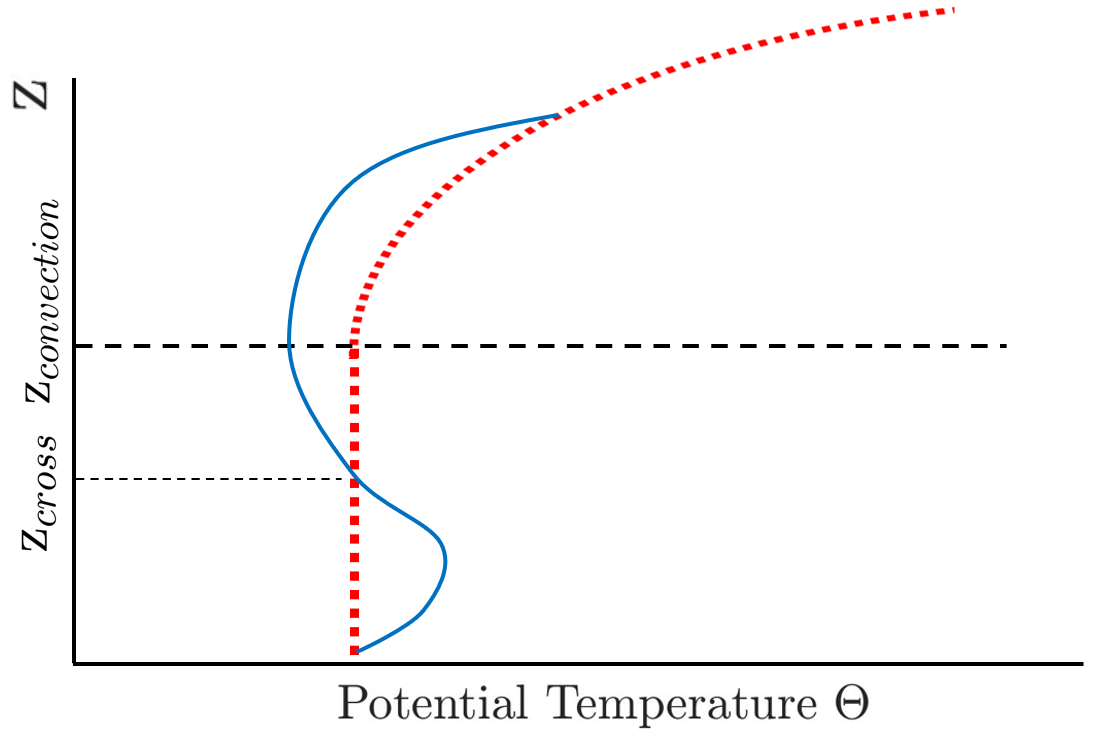
Figure 24 is a schematic like Fig. 23a. It shows that must be greater than for all and . If as pictured in figure 24, then at , . This means that for some values of in the range , making the flow locally unstable to convection. Thus, . Because our simulations show that is approximately the height of the mid-plane of the vortex (see figure 9), this suggests that the mid-plane is always at a height above the convection zone.
9 Conclusions, Discussion and Future Work
9.1 Summary
Although the main objective of this study was not to replicate any specific planetary vortex, our simulations were carried out in the anticipation that the stable, 3-dimensional vortices would qualitatively resemble Jovian vortices, including the Great Red Spot (GRS). Our focus is on understanding the vertical structure of planetary vortices because their horizontal structures are often well-constrained by observations (but typically at only one height in the atmosphere), whereas their vertical structures remain unobserved and poorly understood. Our main results are:
-
•
This is the first numerical calculation of Jovian anticyclonic vortices with temperatures and horizontal velocities similar to the GRS that are solutions to the 3-dimensional, anelastic equations of motion. The vortices are computed with the observed atmospheric vertical thermal stratification or Brunt-Väisälä frequency so that the atmosphere is strongly stratified at its top and nearly adiabatic at is bottom. The calculations use the observed (cloud-top level) east-west zonal shear flow. The vortices are shielded (i.e., no net circulation of the vertical vorticity) and their heights of their tops and bottoms are within observational bounds. The bottoms of the stable vortices that we computed were at approximately 30 bar or 150 km beneath the top of the visible clouds. The horizontal velocity field at the cloud-top level (the only height at which we have direct observations) qualitatively agree with observations. The calculations were computed with no dissipation other than hyperviscosity and hyperdiffusivity (i.e., no viscosity, radiative transfer terms, thermal conductivity, or Newton cooling) and after 120 days, the vortices do not appear to decay with time.
-
•
One of the reasons we are able to compute these vortices is that the initial-value code used to integrate the governing equations can take large time steps with no loss of accuracy or stability due to its novel-time stepping scheme that is an improvement upon the Krylov-like method of Barranco & Marcus (2006). (See Appendix.)
-
•
There is a stable family (that we call ) of vortices in which the vertical vorticity is nearly uniform in the direction parallel to the planet’s spin axis, but the horizontal cross-sectional area of the vortex varies with the distance in that direction. The top and bottom of the vortices are the locations where the cross-sectional area goes to zero, rather than locations where the vertical vorticity goes to zero.
-
•
An alternative proposed family () of vortices (Galanti et al., 2019; Parisi et al., 2021) has its horizontal cross-sectional area nearly constant in the direction parallel to the planet’s spin axis, but the magnitude of the vertical vorticity varies in that direction. The tops and bottoms of the vortices are the locations where the vertical vorticity goes to zero, rather than the locations where horizontal cross-sectional area goes to zero. We have analytically shown that these proposed vortices are far from equilibrium. The initial-value code shows that the vortices break apart and re-assemble as one or more vortices.
-
•
We develop an algorithm for creating families of vortices that are close to equilibrium. Many properties of the vortices, such as the heights of their tops, bottoms, etc., can be specified, as well as their horizontal velocities at the cloud-top levels. When the initial-value code is initialized with a vortex from the family, it often comes to a final quasi-steady state close to its initial conditions. Thus, there is an easy way to produce long-lived, Jovian-like vortices.
-
•
The computed anticyclonic vortices have cool-tops (approximately ), which is similar to the cool-top observations (Hanel et al., 1979; Flasar et al., 1981; Orton et al., 1996; Sada et al., 1996; Simon-Miller et al., 2002; Fletcher et al., 2010; Orton et al., 2022)) and warm-bottoms with respect to the surrounding atmosphere, similar to Jovian anticyclones.
-
•
An unexpected result is that initially non-hollow vortices evolve to quasi-steady hollow vortices, like the GRS (i.e., with a high-speed thin annulus at the outer edge of the vortex and a quiet center with a minimum of vorticity).
-
•
A second unexpected result is that at the outer edges of quasi-steady final anticyclonic vortices, there is a thin annular region that is warmer than the ambient fluid. The initial conditions do not have this annular temperature anomaly; it is created when a down-welling flow (i.e., ) forms spontaneously within the annulus. These warm outer annuli might explain the rings of bright infrared emissions that surround the GRS and many of the other Jovian anticyclones observed by de Pater et al. (2010) and Fletcher et al. (2010).
-
•
We find new scaling laws for vortices in a vertically unbounded rotating, stratified atmosphere (rather than that confined vertically in a thin shell as in Pedlosky (1987), Chapter 6, i.e, so that the vertical scale height of the horizontal flow is much larger than that of the vertical flow). We show that the vertical scale of the horizontal and vertical components of the velocity are the same. We determine how the ratio of the magnitudes of the vertical-to-horizontal velocities scale with Rossby number and , where is the horizontal scale of the velocities. We determine how the divergence of the velocity and other properties of the flow scale with and .
-
•
Vortices whose central axes are initially aligned with the local gravity (i.e., aligned with the spherical radial direction of the planet), evolve so that their central axes are approximately aligned with the planet’s axis of rotation.
-
•
Although we do not compute whether the bottom of a vortex can survive when it is within a fully turbulent convection zone, we prove that the mid-plane of the vortex must lie at a height above the top of the convective zone.
-
•
The cross-section of the vortex in the vertical-horizontal plane has an “ice cream cone” shape that can be explained by a simple expression.
-
•
The magnitudes of the Rossby numbers in parts of the Jovian-like vortices that we have simulated are approximately from to . so if quasigeostrophic approximations are used to model these vortices, the approximations would only be expected to be accurate to within 30%. In particular, a comparison of the thermal wind equation with the curl of the momentum equation, from which it is derived, shows that if the thermal wind equation is used to approximate the relationship between the horizontal temperature gradients within the vortices and the vertical gradients of the horizontal velocities, those approximations are only accurate to within 30%.
9.2 Discussion and Future Work
We recognize that our study is not exhaustive and that there may be other stable families of Jovian-like vortices. Our calculations do not include effects or a fully turbulent convective zone, and we shall address those problems in future calculations because we do not anticipate that they will be computationally challenging. Micro-scale physics, such as the formation and sublimation of clouds with its associated diabatic heating, etc., are not included in this study, which might be important. We plan to examine some of these effects by incorporating a subgrid-scale clould model in our future calculations.
The calculations presented here use a zonal east-west flow that does not vary in the vertical direction. It is set to the observed zonal flow at 1 bar. In future calculations we propose to make it a function of height, but currently there are no consistent observational data to guide our choices (Fletcher et al., 2021). However, we believe that future observations, using the James Webb Space Telescope (de Pater et al., 2022), will provide zonal velocities at another height, between 50 and 700 mbar in the atmosphere, to guide us and also to provide horizontal velocity fields of the GRS and other Jovian vortices which can be used to test our numerical calculations.
The focus of our future calculations will be to determine under what circumstances and for what parameter values do initial vortices in the family evolve into long-lived, quasi-steady vortices. For those vortices that do become quasi-steady, what properties (e.g., thickness of the annular shield, location of the top, horizontal area, height of the mid-plane) of the initial vortex are inherited by the final quasi-steady vortex, which change, and why? Can we initialize the flow with a large-area vortex that evolves into a long-lived vortex as large as the GRS and with a horizontal velocity field at 1 bar that quantitatively matches it? Can we start with small-area vortices that evolve into long-lived vortices with sizes and horizontal velocity fields at 1 bar that quantitatively match the current Red Oval or any of the three previous White Ovals, which are not hollow? We also plan to add radiative transfer terms to the energy equation to mimic the 4.5-year thermal dissipation time of the atmosphere near 1 bar to determine whether the numerically-computed Jovian-vortices are still long-lived.
Acknowledgements
We acknowledge the use of NSF ACCESS computational resources (ID: PHY220056). We acknowledge the use of observation data and helpful comments from Imke de Pater, Chris Moeckel, Michael Wong, Haley Wohlever, Anton Ermakov, and Amy Simon.
Declaration of Interests.
The authors report no conflict of interest.
Appendix: Numerical Method
Equations (20) to (24) are numerically solved with a 3-dimensional pseudo-spectral code. The code is based on one that we developed for Boussinesq studies of ocean vortices (Hassanzadeh et al., 2012; Mahdinia et al., 2017) and anelastic studies of protoplanetary disks (Marcus et al., 2013b, 2015, 2016; Barranco et al., 2018). The time-stepping algorithm uses different fractional steps for the nonlinear and linear terms in the equations of motion. The fractional steps for the nonlinear terms use an Adams-Bashforth method, but the fractional steps for the linear terms is not based on a Taylor series expansion, but rather, a direct form of exponentiation like a Krylov method. The time-stepping algorithm differs from the one used by Barranco & Marcus (2006), by suppressing a spurious solution that grows when the time step is too large. In regions where the flow is strongly stratified and , the criterion for a stable (and accurate) time step is not the Courant condition, but rather the requirement that is sufficiently small throughout the computational domain. In our simulations, the maximum value of is . The time step we use makes , which is a much larger value than used in most other initial-value numerical calculations of stratified flows. However, we note the Coriolis term is much smaller than this value. One test that we used to determine the accuracy of our initial-value code was to compute the dispersion relation for Poincaré waves in an isothermal atmosphere. We compared the dispersion relationship that we obtained using our initial-value code to the relationship that we obtained semi-analytically by computing the eigenmodes of the linearized equations of motion. Using the same in the initial-value code that we used to compute the Jovian vortices, we found that the fractional difference between the two dispersion relations was less than .
All simulations use 384 Fourier modes in the and the directions, and 385 Chebyshev modes in the vertical direction. The numerical code has a spatial resolution of km, km, km. The domain is periodic in the direction, and at the vertical boundaries. The computational box size in the direction is as shown in figure 7 with km. Figure 7 also displays the computational results for km, which is the region of physical interest to us in examining the vortex dynamics. However, throughout this paper we use a computational domain in that is larger, and is km. Similarly, the computational domain in the vertical direction is larger than the domain of physical interest. We use larger computational domains for two reasons. The figures display the results that we believe to be physically relevant. The undisplayed results lie in regions in which we have included sponge layers where the anomalous velocity and the anomalous potential temperature are damped to zero via Rayleigh drag and Newton cooling, respectively (Mahdinia et al., 2017) to dissipate any internal gravity waves that enter them. Without the sponge layers, the internal gravity waves would be reflected and contaminate the calculation. The sponge layers at the and boundaries are km and km thick, respectively.
The second reason that the computational domain in that is larger than the physically-relevant domain shown in figure 7 and elsewhere is that the calculations within the computational domain are periodic in , but the zonal flow is not periodic. Therefore in the regions outside the physically relevant domain, we artificially modify to make it periodic in . This is a well-known and very versatile computational trick, which does not seem to affect the results. (See Marcus (1993).)
References
- Adrian (1984) Adrian, Ronald J 1984 Scattering particle characteristics and their effect on pulsed laser measurements of fluid flow: speckle velocimetry vs particle image velocimetry. Applied optics 23 (11), 1690–1691.
- Afanasyev & Dowling (2022) Afanasyev, Yakov D & Dowling, Timothy E 2022 Evolution of jupiter-style critical latitudes: Initial laboratory altimetry results. Journal of Geophysical Research: Planets 127 (5), e2021JE007048.
- Asay-Davis et al. (2008) Asay-Davis, Xylar, Marcus, Philip, Wong, Michael H & de Pater, Imke 2008 Velocity fields of jovian dynamical features using the advection corrected correlation image velocimetry method. In APS Division of Fluid Dynamics Meeting Abstracts, , vol. 61, pp. AV–002.
- Asay-Davis et al. (2006) Asay-Davis, Xylar, Shetty, Sushil & Marcus, Philip 2006 Extraction of velocity fields from telescope image pairs of jupiter’s great red spot, new red oval, and zonal jet streams. In APS Division of Fluid Dynamics Meeting Abstracts, , vol. 59, pp. FG–006.
- Asay-Davis et al. (2009) Asay-Davis, Xylar S, Marcus, Philip S, Wong, Michael H & de Pater, Imke 2009 Jupiter’s shrinking great red spot and steady oval ba: Velocity measurements with the ‘advection corrected correlation image velocimetry’automated cloud-tracking method. Icarus 203 (1), 164–188.
- Asay-Davis et al. (2011) Asay-Davis, Xylar S, Marcus, Philip S, Wong, Michael H & de Pater, Imke 2011 Changes in jupiter’s zonal velocity between 1979 and 2008. Icarus 211 (2), 1215–1232.
- Atkinson et al. (1998) Atkinson, David H, Pollack, James B & Seiff, Alvin 1998 The galileo probe doppler wind experiment: Measurement of the deep zonal winds on jupiter. Journal of Geophysical Research: Planets 103 (E10), 22911–22928.
- Bannon (1996) Bannon, Peter R 1996 On the anelastic approximation for a compressible atmosphere. Journal of the Atmospheric Sciences 53 (23), 3618–3628.
- Barranco & Marcus (2005) Barranco, Joseph A & Marcus, Philip S 2005 Three-dimensional vortices in stratified protoplanetary disks. The Astrophysical Journal 623 (2), 1157.
- Barranco & Marcus (2006) Barranco, Joseph A & Marcus, Philip S 2006 A 3d spectral anelastic hydrodynamic code for shearing, stratified flows. Journal of Computational Physics 219 (1), 21–46.
- Barranco et al. (2018) Barranco, Joseph A, Pei, Suyang & Marcus, Philip S 2018 Zombie vortex instability. iii. persistence with nonuniform stratification and radiative damping. The Astrophysical Journal 869 (2), 127.
- Bolton et al. (2021) Bolton, Scott J, Levin, Steven M, Guillot, Tristan, Li, Cheng, Kaspi, Yohai, Orton, Glenn, Wong, Michael H, Oyafuso, Fabiano, Allison, Michael, Arballo, John & others 2021 Microwave observations reveal the deep extent and structure of jupiter’s atmospheric vortices. Science 374 (6570), 968–972.
- Braginsky & Roberts (1995) Braginsky, Stanislav I & Roberts, Paul H 1995 Equations governing convection in earth’s core and the geodynamo. Geophysical & Astrophysical Fluid Dynamics 79 (1-4), 1–97.
- Brown et al. (2012) Brown, Benjamin P, Vasil, Geoffrey M & Zweibel, Ellen G 2012 Energy conservation and gravity waves in sound-proof treatments of stellar interiors. part i. anelastic approximations. The Astrophysical Journal 756 (2), 109.
- Cassini (1666) Cassini, Jean Dominique 1666 A more particular account of those observations about jupiter, that were mentioned in numb. 8. Philosophical Transactions of the Royal Society of London 1 (10), 171–173.
- Cho & Polvani (1996) Cho, James Y-K & Polvani, Lorenzo M 1996 The emergence of jets and vortices in freely evolving, shallow-water turbulence on a sphere. Physics of Fluids 8 (6), 1531–1552.
- Cho et al. (2001) Cho, James Y-K, de la Torre Juárez, Manuel, Ingersoll, Andrew P & Dritschel, David G 2001 A high-resolution, three-dimensional model of jupiter’s great red spot. Journal of Geophysical Research: Planets 106 (E3), 5099–5105.
- Choi et al. (2007) Choi, David S, Banfield, Don, Gierasch, Peter & Showman, Adam P 2007 Velocity and vorticity measurements of jupiter’s great red spot using automated cloud feature tracking. Icarus 188 (1), 35–46.
- Dawes (1857) Dawes, WR 1857 Observations of bright spots on one of the belts of jupiter. Monthly Notices of the Royal Astronomical Society 18, 49.
- Dowling (2014) Dowling, Timothy E 2014 Saturn’s longitude: Rise of the second branch of shear-stability theory and fall of the first. International Journal of Modern Physics D 23 (04), 1430006.
- Dowling (2019) Dowling, Timothy E 2019 Jets in planetary atmospheres. In Oxford Research Encyclopedia of Planetary Science.
- Dowling (2020) Dowling, Timothy E 2020 Jupiter-style jet stability. The Planetary Science Journal 1 (1), 6.
- Dowling & Ingersoll (1988) Dowling, Timothy E & Ingersoll, Andrew P 1988 Potential vorticity and layer thickness variations in the flow around jupiter’s great red spot and white oval bc. Journal of Atmospheric Sciences 45 (8), 1380–1396.
- Dowling & Ingersoll (1989) Dowling, Timothy E & Ingersoll, Andrew P 1989 Jupiter’s great red spot as a shallow water system. Journal of Atmospheric Sciences 46 (21), 3256–3278.
- Flasar et al. (1981) Flasar, F Michael, Conrath, Barney J, Pirraglia, Joseph A, Clark, Patrick C, French, Richard G & Gierasch, Peter J 1981 Thermal structure and dynamics of the jovian atmosphere 1. the great red spot. Journal of Geophysical Research: Space Physics 86 (A10), 8759–8767.
- Fletcher et al. (2016) Fletcher, Leigh N, Greathouse, TK, Orton, GS, Sinclair, JA, Giles, RS, Irwin, PGJ & Encrenaz, T 2016 Mid-infrared mapping of jupiter’s temperatures, aerosol opacity and chemical distributions with irtf/texes. Icarus 278, 128–161.
- Fletcher et al. (2010) Fletcher, Leigh N, Orton, GS, Mousis, O, Yanamandra-Fisher, P, Parrish, PD, Irwin, PGJ, Fisher, BM, Vanzi, L, Fujiyoshi, T, Fuse, T & others 2010 Thermal structure and composition of jupiter’s great red spot from high-resolution thermal imaging. Icarus 208 (1), 306–328.
- Fletcher et al. (2021) Fletcher, Leigh N, Oyafuso, Fabiano A, Allison, M, Ingersoll, Andrew, Li, Liming, Kaspi, Yohai, Galanti, Eli, Wong, Mike H, Orton, Glenn S, Duer, Keren & others 2021 Jupiter’s temperate belt/zone contrasts revealed at depth by juno microwave observations. Journal of Geophysical Research: Planets 126 (10), e2021JE006858.
- Galanti et al. (2019) Galanti, Eli, Kaspi, Yohai, Simons, Frederik J, Durante, Daniele, Parisi, Marzia & Bolton, Scott J 2019 Determining the depth of jupiter’s great red spot with juno: A slepian approach. The Astrophysical Journal Letters 874 (2), L24.
- García-Melendo & Sánchez-Lavega (2017) García-Melendo, E & Sánchez-Lavega, Agustin 2017 Shallow water simulations of saturn’s giant storms at different latitudes. Icarus 286, 241–260.
- Gough (1969) Gough, DO 1969 The anelastic approximation for thermal convection. Journal of Atmospheric Sciences 26 (3), 448–456.
- Grassi et al. (2018) Grassi, Davide, Adriani, Alberto, Moriconi, ML, Mura, Alessandro, Tabataba-Vakili, F, Ingersoll, A, Orton, G, Hansen, C, Altieri, FRANCESCA, Filacchione, GIANRICO & others 2018 First estimate of wind fields in the jupiter polar regions from jiram-juno images. Journal of Geophysical Research: Planets 123 (6), 1511–1524.
- Hanel et al. (1979) Hanel, R, Conrath, B, Flasar, M, Kunde, V, Lowman, P, Maguire, W, Pearl, J, Pirraglia, J, Samuelson, R, Gautier, D & others 1979 Infrared observations of the jovian system from voyager 1. Science 204 (4396), 972–976.
- Hassanzadeh & Marcus (2013) Hassanzadeh, Pedram & Marcus, Philip 2013 On the unexpected longevity of the great red spot, oceanic eddies, and other baroclinic vortices. In APS Division of Fluid Dynamics Meeting Abstracts, pp. L32–002.
- Hassanzadeh et al. (2012) Hassanzadeh, Pedram, Marcus, Philip S & Le Gal, Patrice 2012 The universal aspect ratio of vortices in rotating stratified flows: theory and simulation. Journal of Fluid Mechanics 706, 46–57.
- Heimpel et al. (2016) Heimpel, Moritz, Gastine, Thomas & Wicht, Johannes 2016 Simulation of deep-seated zonal jets and shallow vortices in gas giant atmospheres. Nature Geoscience 9 (1), 19–23.
- Hooke (1665) Hooke, Robert 1665 A spot in one of the belts of jupiter. Philosophical Transactions of the Royal Society of London 1 (1), 3–3.
- Hueso et al. (2023) Hueso, Ricardo, Sánchez-Lavega, Agustín, Fouchet, Thierry, de Pater, Imke, Antuñano, Arrate, Fletcher, Leigh N, Wong, Michael H, Rodríguez-Ovalle, Pablo, Sromovsky, Lawrence A, Fry, Patrick M & others 2023 An intense narrow equatorial jet in jupiter’s lower stratosphere observed by jwst. Nature Astronomy pp. 1–9.
- Kaspi et al. (2020) Kaspi, Yohai, Galanti, Eli, Showman, Adam P, Stevenson, David J, Guillot, Tristan, Iess, Luciano & Bolton, Scott J 2020 Comparison of the deep atmospheric dynamics of jupiter and saturn in light of the juno and cassini gravity measurements. Space Science Reviews 216 (5), 1–27.
- Lantz & Fan (1999) Lantz, SR & Fan, Y 1999 Anelastic magnetohydrodynamic equations for modeling solar and stellar convection zones. The Astrophysical Journal Supplement Series 121 (1), 247.
- Lantz (1992) Lantz, Steven Richard 1992 Dynamical behavior of magnetic fields in a stratified, convecting fluid layer. Cornell University.
- Lemasquerier et al. (2020) Lemasquerier, Daphné, Facchini, Giulio, Favier, Benjamin & Le Bars, Michael 2020 Remote determination of the shape of jupiter’s vortices from laboratory experiments. Nature physics 16 (6), 695–700.
- Li et al. (2020) Li, Cheng, Ingersoll, Andrew P, Klipfel, Alexandra P & Brettle, Harriet 2020 Modeling the stability of polygonal patterns of vortices at the poles of jupiter as revealed by the juno spacecraft. Proceedings of the National Academy of Sciences 117 (39), 24082–24087.
- Limaye (1986) Limaye, Sanjay S 1986 Jupiter: New estimates of the mean zonal flow at the cloud level. Icarus 65 (2-3), 335–352.
- Liu & Schneider (2010) Liu, Junjun & Schneider, Tapio 2010 Mechanisms of jet formation on the giant planets. Journal of the Atmospheric Sciences 67 (11), 3652–3672.
- Mahdinia et al. (2017) Mahdinia, Mani, Hassanzadeh, Pedram, Marcus, Philip S & Jiang, Chung-Hsiang 2017 Stability of three-dimensional gaussian vortices in an unbounded, rotating, vertically stratified, boussinesq flow: Linear analysis. Journal of Fluid Mechanics 824, 97–134.
- Marcus (1978) Marcus, Philip Stephen 1978 Nonlinear thermal convection in boussinesq fluids and ideal gases with plane-parallel and spherical geometries. PhD thesis.
- Marcus (1988) Marcus, Philip S 1988 Numerical simulation of jupiter’s great red spot. Nature 331 (6158), 693–696.
- Marcus (1993) Marcus, Philip S 1993 Jupiter’s great red spot and other vortices. Annual Review of Astronomy and Astrophysics 31 (1), 523–569.
- Marcus et al. (2013a) Marcus, Philip S, Asay-Davis, Xylar, Wong, Michael H & de Pater, Imke 2013a Jupiter’s red oval ba: dynamics, color, and relationship to jovian climate change. Journal of Heat Transfer 135 (1).
- Marcus et al. (2000) Marcus, Philip S, Kundu, T & Lee, Changhoon 2000 Vortex dynamics and zonal flows. Physics of Plasmas 7 (5), 1630–1640.
- Marcus et al. (2016) Marcus, Philip S, Pei, Suyang, Jiang, Chung-Hsiang & Barranco, Joseph A 2016 Zombie vortex instability. ii. thresholds to trigger instability and the properties of zombie turbulence in the dead zones of protoplanetary disks. The Astrophysical Journal 833 (2), 148.
- Marcus et al. (2015) Marcus, Philip S, Pei, Suyang, Jiang, Chung-Hsiang, Barranco, Joseph A, Hassanzadeh, Pedram & Lecoanet, Daniel 2015 Zombie vortex instability. i. a purely hydrodynamic instability to resurrect the dead zones of protoplanetary disks. The Astrophysical Journal 808 (1), 87.
- Marcus et al. (2013b) Marcus, Philip S, Pei, Suyang, Jiang, Chung-Hsiang & Hassanzadeh, Pedram 2013b Three-dimensional vortices generated by self-replication in stably stratified rotating shear flows. Physical Review Letters 111 (8), 084501.
- Marcus & Shetty (2011) Marcus, Philip S & Shetty, Sushil 2011 Jupiter’s zonal winds: are they bands of homogenized potential vorticity organized as a monotonic staircase? Philosophical Transactions of the Royal Society A: Mathematical, Physical and Engineering Sciences 369 (1937), 771–795.
- Marcus et al. (2019) Marcus, Philip S, Tollefson, Joshua, Wong, Michael H & de Pater, Imke 2019 An equatorial thermal wind equation: Applications to jupiter. Icarus 324, 198–223.
- Moeckel et al. (2023) Moeckel, Chris, de Pater, Imke & DeBoer, David 2023 Ammonia abundance derived from juno mwr and vla observations of jupiter. The Planetary Science Journal 4 (2), 25.
- Moore & Saffman (1971) Moore, DW & Saffman, P Gr 1971 Structure of a line vortex in an imposed strain. In Aircraft wake turbulence and its detection, pp. 339–354. Springer.
- Morales-Juberías & Dowling (2013) Morales-Juberías, Raúl & Dowling, Timothy E 2013 Jupiter’s great red spot: fine-scale matches of model vorticity patterns to prevailing cloud patterns. Icarus 225 (1), 216–227.
- Ogura & Phillips (1962) Ogura, Yoshimitsu & Phillips, Norman A 1962 Scale analysis of deep and shallow convection in the atmosphere. J. atmos. Sci 19 (2), 173–179.
- Orton et al. (1996) Orton, GS, Spencer, JR, Travis, LD, Martin, TZ & Tamppari, LK 1996 Galileo photopolarimeter-radiometer observations of jupiter and the galilean satellites. Science 274 (5286), 389–391.
- Orton et al. (2022) Orton, Glenn S, Fletcher, Leigh N, Oyafuso, Fabiano A, Zhang, Zimeng, Brueshaber, Shawn, Wong, Michael H, Li, Cheng, Mura, Alessandro, Grassi, Davide, Melin, Henrik & others 2022 Juno 3-dimensional views of cyclonic features in jupiter’s mid-to high-northern latitudes. In AGU Fall Meeting Abstracts, , vol. 2022, pp. P25B–08.
- Palotai et al. (2014) Palotai, Csaba, Dowling, Timothy E & Fletcher, Leigh N 2014 3d modeling of interactions between jupiter’s ammonia clouds and large anticyclones. Icarus 232, 141–156.
- Parisi et al. (2021) Parisi, Marzia, Kaspi, Yohai, Galanti, Eli, Durante, Daniele, Bolton, Scott J, Levin, Steven M, Buccino, Dustin R, Fletcher, Leigh N, Folkner, William M, Guillot, Tristan & others 2021 The depth of jupiter’s great red spot constrained by juno gravity overflights. Science 374 (6570), 964–968.
- de Pater et al. (2022) de Pater, Imke, Fouchet, Thierry, Wong, Michael, Fry, Patrick, Fletcher, Leigh, Hueso, Ricardo, Melin, Henrik, Showalter, Mark, Bockelee-Morvan, Dominique, Lellouch, Emmanuel & others 2022 Jwst observations of the jovian system from commissioning and ers data. In AAS/Division for Planetary Sciences Meeting Abstracts, , vol. 54, pp. 306–07.
- de Pater et al. (2016) de Pater, Imke, Sault, RJ, Butler, Bryan, DeBoer, David & Wong, Michael H 2016 Peering through jupiter’s clouds with radio spectral imaging. Science 352 (6290), 1198–1201.
- de Pater et al. (2019) de Pater, Imke, Sault, RJ, Wong, Michael H, Fletcher, Leigh N, DeBoer, David & Butler, Bryan 2019 Jupiter’s ammonia distribution derived from vla maps at 3–37 ghz. Icarus 322, 168–191.
- de Pater et al. (2010) de Pater, Imke, Wong, Michael H, Marcus, Philip, Luszcz-Cook, Statia, Ádámkovics, Maté, Conrad, Al, Asay-Davis, Xylar & Go, Christopher 2010 Persistent rings in and around jupiter’s anticyclones–observations and theory. Icarus 210 (2), 742–762.
- Pedlosky (1982) Pedlosky, Joseph 1982 Geophysical fluid dynamics. Springer.
- Porco et al. (2003) Porco, Carolyn C, West, Robert A, McEwen, Alfred, Del Genio, Anthony D, Ingersoll, Andrew P, Thomas, Peter, Squyres, Steve, Dones, Luke, Murray, Carl D, Johnson, Torrence V & others 2003 Cassini imaging of jupiter’s atmosphere, satellites, and rings. Science 299 (5612), 1541–1547.
- Richardson et al. (2000) Richardson, PL, Bower, AS & Zenk, Walter 2000 A census of meddies tracked by floats. Progress in Oceanography 45 (2), 209–250.
- Sada et al. (1996) Sada, Pedro V, Beebe, Reta F & Conrath, Barney J 1996 Comparison of the structure and dynamics of jupiter’s great red spot between the voyager 1 and 2 encounters. Icarus 119 (2), 311–335.
- Scarica et al. (2022) Scarica, P, Grassi, D, Mura, A, Adriani, A, Ingersoll, A, Li, C, Piccioni, G, Sindoni, G, Moriconi, ML, Plainaki, C & others 2022 Stability of the jupiter southern polar vortices inspected through vorticity using juno/jiram data. Journal of Geophysical Research: Planets 127 (8), e2021JE007159.
- Schwarzschild (2015) Schwarzschild, Martin 2015 Structure and evolution of stars, , vol. 2379. Princeton University Press.
- Shetty et al. (2006) Shetty, Sushil, Asay-Davis, Xylar & Marcus, Philip S 2006 Modeling and data assimilation of the velocity of jupiter’s great red spot and red oval. In APS Division of Fluid Dynamics Meeting Abstracts, , vol. 59, pp. FG–007.
- Shetty et al. (2007) Shetty, Sushil, Asay-Davis, Xylar S & Marcus, Philip S 2007 On the interaction of jupiter’s great red spot and zonal jet streams. Journal of the Atmospheric Sciences 64 (12), 4432–4444.
- Shetty & Marcus (2010) Shetty, Sushil & Marcus, Philip S 2010 Changes in jupiter’s great red spot (1979–2006) and oval ba (2000–2006). Icarus 210 (1), 182–201.
- Showman (2007) Showman, Adam P 2007 Numerical simulations of forced shallow-water turbulence: Effects of moist convection on the large-scale circulation of jupiter and saturn. Journal of the Atmospheric Sciences 64 (9), 3132–3157.
- Simon et al. (2018) Simon, Amy A, Tabataba-Vakili, Fachreddin, Cosentino, Richard, Beebe, Reta F, Wong, Michael H & Orton, Glenn S 2018 Historical and contemporary trends in the size, drift, and color of jupiter’s great red spot. The Astronomical Journal 155 (4), 151.
- Simon et al. (2014) Simon, Amy A, Wong, Michael H, Rogers, John H, Orton, Glenn S, de Pater, Imke, Asay-Davis, Xylar, Carlson, Robert W & Marcus, Philip S 2014 Dramatic change in jupiter’s great red spot from spacecraft observations. The Astrophysical Journal Letters 797 (2), L31.
- Simon-Miller et al. (2002) Simon-Miller, Amy A, Gierasch, Peter J, Beebe, Reta F, Conrath, Barney, Flasar, F Michael, Achterberg, Richard K, Team, Cassini CIRS & others 2002 New observational results concerning jupiter’s great red spot. Icarus 158 (1), 249–266.
- Stegner & Dritschel (2000) Stegner, A & Dritschel, DG 2000 A numerical investigation of the stability of isolated shallow water vortices. Journal of Physical Oceanography 30 (10), 2562–2573.
- Tollefson et al. (2017) Tollefson, Joshua, Wong, Michael H, de Pater, Imke, Simon, Amy A, Orton, Glenn S, Rogers, John H, Atreya, Sushil K, Cosentino, Richard G, Januszewski, William, Morales-Juberías, Raúl & others 2017 Changes in jupiter’s zonal wind profile preceding and during the juno mission. Icarus 296, 163–178.
- Trammell et al. (2014) Trammell, Harold Justin, Li, Liming, Jiang, Xun, Smith, Mark, Hörst, Sarah & Vasavada, Ashwin 2014 The global vortex analysis of jupiter and saturn based on cassini imaging science subsystem. Icarus 242, 122–129.
- Williams (1997) Williams, GP 1997 Planetary vortices and jupiter’s vertical structure. Journal of Geophysical Research: Planets 102 (E4), 9303–9308.
- Wong et al. (2021) Wong, Michael H, Marcus, Philip S, Simon, Amy A, de Pater, Imke, Tollefson, Joshua W & Asay-Davis, Xylar 2021 Evolution of the horizontal winds in jupiter’s great red spot from one jovian year of hst/wfc3 maps. Geophysical Research Letters 48 (18), e2021GL093982.
- Yadav & Bloxham (2020) Yadav, Rakesh K & Bloxham, Jeremy 2020 Deep rotating convection generates the polar hexagon on saturn. Proceedings of the National Academy of Sciences 117 (25), 13991–13996.
- Yim et al. (2016) Yim, Eunok, Billant, Paul & Ménesguen, Claire 2016 Stability of an isolated pancake vortex in continuously stratified-rotating fluids. Journal of Fluid Mechanics 801, 508–553.
- Youssef (2000) Youssef, Ashraf 2000 The dynamics of the jovian white ovals and the great red spot in the presence of the east-west zonal flow. PhD thesis.
- Zhang & Marcus (2022) Zhang, Aidi & Marcus, Philip 2022 Hydrodynamic stability constraints on the three-dimensional structure of planetary vortices. Bulletin of the American Physical Society .