2022
[1]\fnmJ. Eduardo \surMéndez-Delgado
[1]\orgdivAstronomisches Rechen-Institut, \orgnameZentrum für Astronomie der Universität Heidelberg, \orgaddress\streetMönchhofstraße 12-14, \cityHeidelberg, \postcodeD-69120, \stateBaden-Württemberg, \countryGermany
2]\orgdivInstituto de Astrofísica de Canarias, \orgname(IAC), \orgaddress\streetVía Láctea, 1, \citySan Cristóbal de La Laguna, \postcodeE-38205, \stateSanta Cruz de Tenerife, \countrySpain
3]\orgdivDepartamento de Astrofísica, \orgnameUniversidad de La Laguna, \orgaddress\streetAstrofísico Francisco Sánchez, s/n., \citySan Cristóbal de La Laguna, \postcodeE-38206, \stateSanta Cruz de Tenerife, \countrySpain
4]\orgdivInstituto de Astronomía, \orgnameUniversidad Nacional Autónoma de México, \orgaddress\streetApartado Postal 70-264, \cityCoyoacán, \postcode04510, \stateMexico City, \countryMexico
Temperature inhomogeneities in Mrk 71 can not be discarded
In a very recent work, Chen:2023 claim that the scenario of temperature inhomogeneities proposed by Peimbert:1967 () is not able to explain the O2+/H+ abundance discrepancy observed between the calculations based on the optical [O III] collisional excited lines (CELs) and the O II recombination lines (RLs) in the star forming galaxy Mrk 71. In this work, we show that conclusions of Chen:2023 depend on several assumptions on the absolute flux calibration, reddening correction and the adopted electron density. In fact, using the data of Chen:2023 in a different way and even considering their 1 uncertainties, it is possible to reach the opposite conclusion, consistent with . Therefore, the existence of temperature inhomogeneities causing the O2+/H+ abundance discrepancy in Mrk 71 can not be ruled out.
Chen:2023 tested the presence of temperature inhomogeneities in the star forming galaxy Mrk 71. To carry out their analysis, Chen:2023 used an optical spectrum from the Keck Cosmic Web Imager (KCWI) at the W. M. Keck Observatory as well as IR spectra from the Far Infrared Field-Imaging Line Spectrometer (FIFI-LS) at the Stratospheric Observatory for Infrared Astronomy (SOFIA) and from the Photodetector Array Camera and Spectrometer (PACS) at the Herschel Space Observatory.
By comparing the different H I line flux ratios with the theoretical predictions, they infer a reddening constant , considering the reddening curve of Cardelli:1989 with . They derive the electron density () of the gas with three indicators: [O II] , [O III] and the O II V1 RL multiplet. On the other hand, they derive the by considering [O III] as well as [O III] and . From the comparison of the O2+/H+ abundance derived both with optical [O III] CELs and O II RLs and assuming that the abundance discrepancy (AD) is produced by temperature variations, they infer a (see Eq. (12) from Peimbert:1967 ). This result would imply that both the derived temperature from [O III] and should be lower than what is obtained from [O III] . However, Chen:2023 found a good consistency between their calculations of based on [O III] , and and therefore they claim the absence of significant temperature fluctuations in Mrk 71.
The results obtained by Chen:2023 are highly dependent on the accuracy of the absolute flux calibration between the three instruments, since there are no H I detections in the IR data that could be used to normalize the spectra. Considering that the KCWI observations were taken under non-photometric conditions Chen:2023 , that the FIFI-LS observations present telluric features Sutter:2022 and that the PACS observations were carried out in the “un-chopped” mode and show detector response variations Fadda:2016 , the absolute flux calibration between the three different kinds of data is not straightforward. In fact, the comparison of [C II] , detected both in FIFI-LS and PACS reveals a difference of between the flux calibrated data of both instruments even after the PACS detector response variations correction. Possible systematic differences between the optical and IR-spectra are not analyzed or quantified by Chen:2023 .
The difference between the FIFI-LS and PACS spectra implies the existence of a systematic bias in the flux of at least one of the [O III] IR CELs used. Dividing the flux difference of quadratically and including it in the uncertainty bars does not properly treat the systematic error, as it impacts differently [O III] than [O III] , given their different -dependence. Considering that both [O III] IR CELs have similar fluxes, a more robust way to reduce the impact of the flux bias is to use the sum of their fluxes instead, comparing derived from [O III] with the value obtained using . The flux systematic difference also calls into question the density derived from [O III] with the reported absolute fluxes.
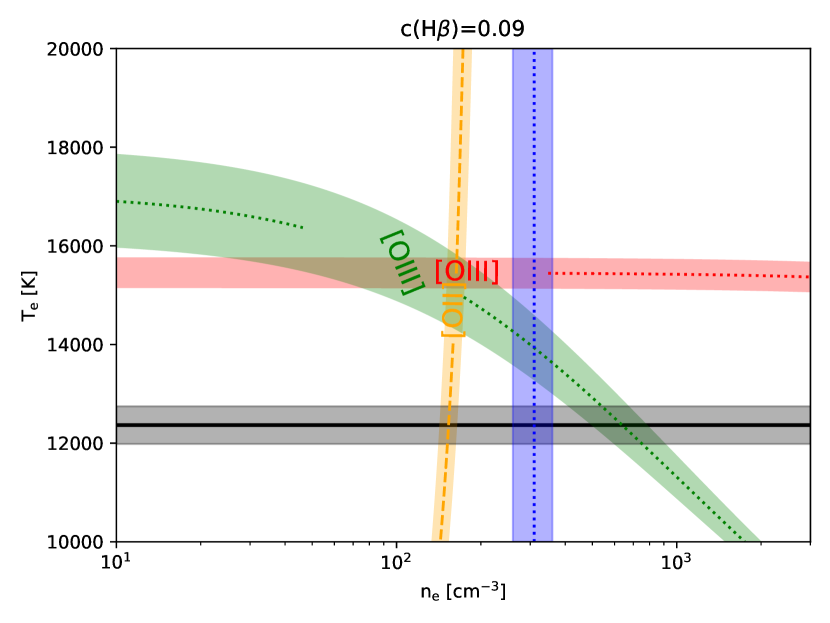
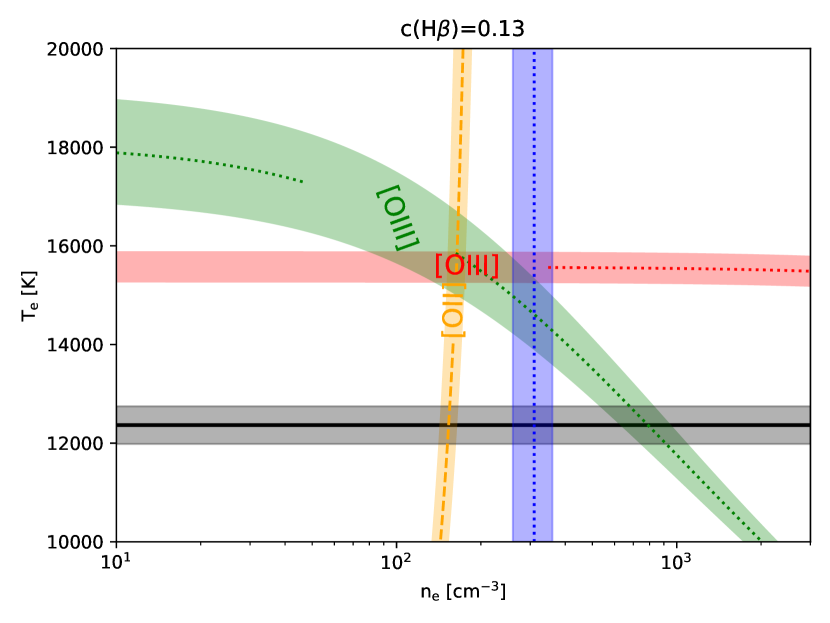
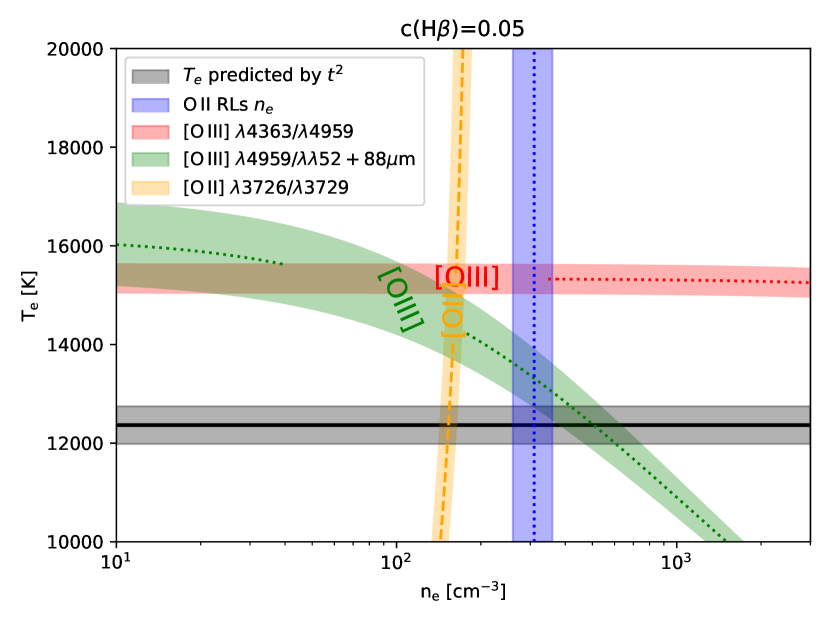
In Fig. 1 we present the resulting plasma diagnostics considering the line fluxes and uncertainties reported by Chen:2023 under three values of , all consistent within the reported 1. In all cases, the reddening curve of Cardelli:1989 with was used. The atomic data used were the default ones from PyNeb Luridiana:2015 in its version 1.1.16, the same ones assumed by Chen:2023 . As shown in Fig. 1, depending on the and the adopted, it is possible to be consistent either with the absence of temperature inhomogeneities (as Chen:2023 concluded) or the opposite case, predicted by .
The adoption of a density value close to ([O II] )= instead of the available (O II)= was not justified by Chen:2023 . Both values could be considered typical within the range of densities found in previous studies of Mrk 71 Gonzalez-Delgado:1994 ; Esteban:2002 ; Esteban:2009 . The most evident problem with the value derived from [O II] by Chen:2023 is that panels (c) and (d) of their Fig. 2 show that the spectral resolution of KCWI is insufficient to have at least a partial separation of the [O II] doublet. Therefore, this density value strongly depends on the assumptions imposed on the Gaussian deblend required to measure the lines separately with uncertainty bars of .
In order to reinforce their arguments on the absence of strong density and temperature fluctuations in Mrk 71, Chen:2023 mention that in a sample of regions, among which Mrk 71 does not appear, Mingozzi:2022 found differences of only between [O III] and [O III] and and that this is not sufficient for the temperature fluctuations scenario to explain the observed AD factor. However, such an assertion can be proven to be incorrect. Considering Eq. 15 from Peimbert:1967 : . For the most common value of found for the star forming regions garcia_rojas:2007 ; Peimbert:2012 , the temperature difference would be of . A very extreme value of , would imply a difference of . This exercise demonstrates that the temperature differences found by Mingozzi:2022 can comprise typical and extreme values of .
We conclude that based on the data and the analysis presented by Chen:2023 , one cannot be conclusive on the presence or absence of temperature inhomogeneities in Mrk 71, since both interpretations are possible even within their estimated 1 uncertainties. To be conclusive in this regard, it is necessary to consider the possible presence of density variations that could introduce systematic biases on the diagnostics even if the line intensity ratios are well measured Rubin:1989 . -biases could affect determinations of O2+/H+ based on [O III] in a much higher extent than those based on O II V1. Observational evidence of temperature and density inhomogeneities in star-forming regions (including Mrk 71) is presented by mendez2023a and mendez2023b , respectively.
Acknowledgments JEM-D thanks the help provided by V. Gomez-Llanos in managing the assignment of colors in the PyNeb plasma diagnostics and to O. V. Egorov for fruitful discussions.
Authors’ contributions JEM-D lead the analysis and writing of the manuscript. CE, JG-R, KK and MP provided critical feedback and modified the text.
Conflict of interest/Competing interests
The authors declare that they have no competing financial interests.
Data availability
All the data discussed here was presented by Chen:2023 .
Code availability Our results use the PyNeb code, publicly available on GitHub. https://github.com/Morisset/PyNeb_devel
Funding
JEM-D and KK gratefully acknowledge funding from the Deutsche Forschungsgemeinschaft (DFG, German Research Foundation) in the form of an Emmy Noether Research Group (grant number KR4598/2-1, PI Kreckel). CE and JG-R acknowledge support from the Agencia Estatal de Investigación del Ministerio de Ciencia e Innovación (AEI-MCINN) under grant Espectroscopía de campo integral de regiones H II locales. Modelos para el estudio de regiones H II extragalácticas with reference 10.13039/501100011033 and support under grant P/308614 financed by funds transferred from the Spanish Ministry of Science, Innovation and Universities, charged to the General State Budgets and with funds transferred from the General Budgets of the Autonomous Community of the Canary Islands by the MCIU. JG-R acknowledges support from an Advanced Fellowship under the Severo Ochoa excellence program CEX2019-000920-S and financial support from the Canarian Agency for Research, Innovation and Information Society (ACIISI), of the Canary Islands Government, and the European Regional Development Fund (ERDF), under grant with reference ProID2021010074.
Additional Information
Correspondence should be addressed to JEM-D: jemd@uni-heidelberg.de
References
- \bibcommenthead
- (1) Chen, Y. et al. Accurate Oxygen Abundance of Interstellar Gas in Mrk 71 from Optical and Infrared Spectra. arXiv e-prints arXiv:2304.09898 (2023). 10.48550/arXiv.2304.09898, arXiv:2304.09898 [astro-ph.GA].
- (2) Peimbert, M. Temperature Determinations of H II Regions. ApJ 150, 825 (1967). 10.1086/149385 .
- (3) Cardelli, J. A., Clayton, G. C. & Mathis, J. S. The Relationship between Infrared, Optical, and Ultraviolet Extinction. ApJ 345, 245 (1989). 10.1086/167900 .
- (4) Sutter, J. & Fadda, D. [C II] Map of the Molecular Ring and Arms of the Spiral Galaxy NGC 7331. ApJ 926 (1), 82 (2022). 10.3847/1538-4357/ac4252, arXiv:2112.05706 [astro-ph.GA].
- (5) Fadda, D., Jacobson, J. D. & Appleton, P. N. Transient effects in Herschel/PACS spectroscopy. A&A 594, A90 (2016). 10.1051/0004-6361/201527612, arXiv:1601.07729 [astro-ph.IM].
- (6) Luridiana, V., Morisset, C. & Shaw, R. A. PyNeb: a new tool for analyzing emission lines. I. Code description and validation of results. A&A 573, A42 (2015). 10.1051/0004-6361/201323152, arXiv:1410.6662 [astro-ph.IM].
- (7) Gonzalez-Delgado, R. M. et al. Violent Star Formation in NGC 2363. ApJ 437, 239 (1994). 10.1086/174992 .
- (8) Esteban, C., Peimbert, M., Torres-Peimbert, S. & Rodríguez, M. Optical Recombination Lines of Heavy Elements in Giant Extragalactic H II Regions. ApJ 581 (1), 241–257 (2002). 10.1086/344104, arXiv:astro-ph/0208313 [astro-ph].
- (9) Esteban, C. et al. Keck HIRES Spectroscopy of Extragalactic H II Regions: C and O Abundances from Recombination Lines. ApJ 700 (1), 654–678 (2009). 10.1088/0004-637X/700/1/654, arXiv:0905.2532 [astro-ph.CO].
- (10) Mingozzi, M. et al. CLASSY IV. Exploring UV Diagnostics of the Interstellar Medium in Local High-z Analogs at the Dawn of the JWST Era. ApJ 939 (2), 110 (2022). 10.3847/1538-4357/ac952c, arXiv:2209.09047 [astro-ph.GA].
- (11) García-Rojas, J. & Esteban, C. On the Abundance Discrepancy Problem in H II Regions. ApJ 670 (1), 457–470 (2007). 10.1086/521871, arXiv:0707.3518 [astro-ph].
- (12) Peimbert, A., Peña-Guerrero, M. A. & Peimbert, M. A Classification of H II Regions Based on Oxygen and Helium Lines: The Cases of TOL 2146-391 and TOL 0357-3915. ApJ 753 (1), 39 (2012). 10.1088/0004-637X/753/1/39, arXiv:1204.4507 [astro-ph.CO].
- (13) Rubin, R. H. The Effect of Density Variations on Elemental Abundance Ratios in Gaseous Nebulae. ApJS 69, 897 (1989). 10.1086/191330 .
- (14) Méndez-Delgado, J. E., Esteban, C., García-Rojas, J., Kreckel, K. & Peimbert, M. Temperature inhomogeneities cause the abundance discrepancy in H II regions. Nature 618 (7964), 249–251 (2023). 10.1038/s41586-023-05956-2, arXiv:2305.11578 [astro-ph.GA].
- (15) Méndez-Delgado, J. E. et al. Density biases and temperature relations for DESIRED H II regions. MNRAS 523 (2), 2952–2973 (2023). 10.1093/mnras/stad1569, arXiv:2305.13136 [astro-ph.GA].