Crystal nucleation in a vapor deposited Lennard-Jones mixture
Abstract
Understanding the pathways to crystallization during the deposition of a vapor phase on a cold solid substrate is of great interest in industry, e.g., for the realization of electronic devices made of crystallites-free glassy materials, as well as in the atmospheric science in relation to ice nucleation and growth in clouds. Here we numerically investigate the nucleation process during the deposition of a glassformer by using a Lennard-Jones mixture, and compare the properties of this nucleation process with both its quenched counterpart and the bulk system. We find that all three systems homogeneously nucleate crystals in a narrow range of temperatures. However, the deposited layer shows a peculiar formation of ordered domains, promoted by the faster relaxation dynamics toward the free surface even in an as-deposited state. In contrast, the formation of such domains in the other systems occurs only when the structures are fully relaxed by quenching. Furthermore, the nucleus initially grows in an isotropic symmetrical manner, but eventually shows sub-3D growth due to its preference to grow along the basal plane, irrespective of the layer production procedure.
I Introduction
The pathways to crystallization during the deposition of a vapor phase on a cold solid substrate are of great interest in a variety of contexts. For example, in the tech industry, it is crucial to realize electronic devices made of crystallites-free glassy materials, such as Organic Light-Emitting Diode (OLED) displays Ediger (2017); Rodriguez-Tinoco et al. (2022). What makes glasses ideal materials for such applications is their remarkable spatial homogeneity on a macroscopic scale free from localized defects. This unique property holds true for both single-component and multi-component systems, as long as the components have the ability to mix. On the other hand, polycrystalline materials can be very sensitive to the presence of defects such as grain boundaries which cause diffraction and then the loss of electric signals Ediger (2017). In atmospheric science, it is debated whether ice nucleation in clouds occurs directly via vapor deposition on ice nucleating particles present in the atmosphere, or if it occurs homogeneously from liquid water that condenses in cavities found on the surfaces of ice nucleating particles due to the “inverse Kelvin” effect Kanji et al. (2017). For a repulsive colloidal model, it has been observed that the surface confining the liquid may favor the heterogeneous or the homogeneous nucleation depending on its structure Espinosa et al. (2019). Water as a polymorphic and polyamorphic substance can show more complex crystallization mechanisms, both in bulk Leoni and Russo (2021), in droplets Espinosa et al. (2018), and in vapor deposition systems Tonauer et al. (2023), with respect to liquids that admit one crystal phase. For example, simulations of vapor deposition of the monatomic water model mW on graphitic surfaces have shown that with increasing the temperature of the substrate, bilayer ice, ice I, and liquid droplets are nucleated in the deposited amorphous ice layer Lupi et al. (2014).
In the last 15 years, vapor deposition has been employed in experiments, as well as more recently studied with simulations, to obtain so-called ultra-stable glasses (USG) thanks to the fine-tuning of the substrate temperature. USG shows extraordinary kinetic and thermodynamic stability. Achieving such stability in an ordinary glass would require significantly longer timescales, ranging from hundreds to even hundreds of thousands of years Ediger (2017). Simulations of vapor deposition mimicking experiments Malshe et al. (2011); Lyubimov et al. (2013); Berthier et al. (2017); Reid et al. (2016); Moore et al. (2019) have shown that, in a range of substrate temperatures, the enhanced mobility at the free surface of the deposited layer is responsible for its ultra-stability. In particular, this mechanism has been recently shown Leoni et al. (2023) to be crucial also for the stability of the glass-former model investigated in the present work (see below). For stabilizing an ultrastable glass, several possibilities have been explored, such as having locally favored structures incompatible with the crystal symmetry Shintani and Tanaka (2006), a large crystal unit cell extending beyond locally favored structures Pedersen et al. (2010, 2021), competing interactions Russo et al. (2018), and/or compositional frustration Hu and Tanaka (2020).
A recent study Leoni et al. (2023) has shown that a deposited glass composed of an equimolar additive bi-disperse Lennard-Jones (LJ) mixture, known as Wahnström (WAHN) model Wahnström (1991), outperforms in stability the conventional glass version of the same material when the substrate is kept at a temperature in a specific range of values below the glass transition temperature . Furthermore, it is shown that the enhanced mobility at the free surface of the deposited layer triggers the formation of locally favored structures (LFS) Leoni et al. (2023) (see below), which are the signature of an ultrastable glass with low free energy. At the same time, LFS driven by local free-energy minimization promotes crystallization if their structures are compatible with a crystal Tanaka (2012); Russo and Tanaka (2016). Thus, it is an intriguing question how this apparently conflicting features hidden in LFS affect the stability of a ultrastable glass.
The WAHN system is an ideal model system to address this question since its LFS’s, icosahedra, are also found in the crystal phase, which has been found in simulations to be a Frank-Kasper crystal Pedersen et al. (2010). This model offers both the possibility to study the USG configurations below , where LFS are correlated with the stability of the glassy phase (see Ref. Leoni et al. (2023)) then disfavoring crystallization, and to perform a straightforward characterization of the solid phase during the nucleation of the crystal phase above , where, after a long relaxation, the appearance of Frank-Kasper crystal structures involves the formation of LFS (an aspect to be taken into account when applying the present results on nucleation to other glassformers). Moreover, it is suitable to describe metallic glasses, which are of great interest for applications due to their unique mechanical properties Wang (2009); Ashby and Greer (2006).
II Methods
Here we focus on the nucleation of the WAHN model by performing molecular dynamics simulations (using LAMMPS Thompson et al. (2022)) of vapor deposition, the quenched solid, and the bulk. The WAHN model is described by the potential
| (1) |
where and can be particles of type 1 and 2. The energies are , the masses , and the diameters with the cross-interaction diameter given by the Lorentz-Berthelot mixing rule: . We set . The units of energy, length and time are , and , respectively. Quantities are expressed in these reduced units. The chosen integration time step is 0.005.
Similarly to Refs. Lyubimov et al. (2013); Berthier et al. (2017); Leoni et al. (2023), 2000 particles of type 1 and 2000 particles of type 2 are introduced in the box alternately from a random position in the xy plane at the top of the simulation box with a fixed vertical velocity and lateral components randomly extracted between -0.01 and 0.01. The frequency with which particles are introduced in the system is described by the deposition rate , given by the ratio between the thickness of the deposited layer and the time elapsed to make it: . We inject one particle every integration steps, so that we obtain . As a reference, to convert internal units in real numbers, we consider type 1 particles as Argon atoms with K, where is the Boltzmann constant, and ps Pedersen et al. (2010), such that K/ns.
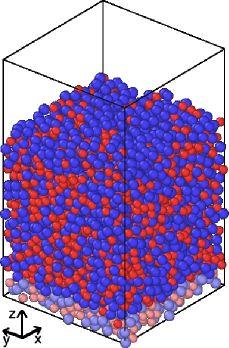
The top edge of the box elastically reflects particles that, eventually, at high T, bounce or detach from the free surface. Injected particles are integrated in the NVE ensemble. The substrate placed at the bottom of the simulation box (see Fig. 1) is composed of a disordered WAHN mixture with 250 particles of type 1 and 250 of type 2 at the number density in reduced units , and kept at temperature by using the Nosé-Hoover thermostat (NVT ensemble). The configuration of the substrate is obtained by cutting a bulk system equilibrated at a temperature (in units of ) and a number density in reduced units which is . The choice to take the substrate made of the same particles deposited on it avoids the possible formation of a gap between the deposited layer, and the substrate Lyubimov et al. (2013). The lateral size of the box is . A spring force of stiffness is independently applied to each substrate particle to tether it to its initial position. This value of is large enough to keep particles fluctuating around their initial position and small enough to allow the equilibration of the deposited layer. As we verified by simulations, below the glass transition temperature at zero pressure, Leoni et al. (2023), the use of springs is not necessary to keep the particles of the substrate confined at the bottom of the box (in which case the bottom edge of the box is reflective as the top edge), while above they prevent these particles from mixing with the deposited particles.
To investigate the effect of the deposition process on nucleation, we compare the deposited glass layer (DL) with a quenched glass layer (QL) whose quenching rate is comparable to DL (see below) and the bulk glass. The QL is obtained by melting the DL (by instantaneously heating the system temperature to ), letting it equilibrate for a time of (in reduced units), and then cooling it down to in a time equal to , so that the resulting cooling rate is comparable to . During the cooling procedure, we keep the substrate in contact with the deposited layer with springs active during heating and cooling. In this case, to make the QL, the full system (deposited layer plus substrate) is in contact with a thermal bath (i.e., refers to the full system). Since the presence of a free surface implies a vapor pressure, we consider the bulk case at pressure . The bulk system’s size is 4000 particles, the same as the DL and QL. In the following section, we compare the DL and QL with their relaxed versions obtained by putting the full system in contact with a thermal bath.
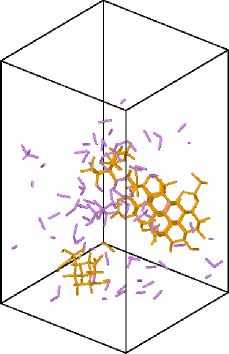
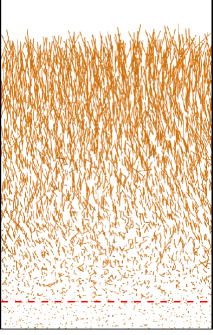
WAHN mixtures eventually crystallize into a structure of composition A2B Pedersen et al. (2010), where A and B correspond to particles of type 1 and 2, respectively. Crystals with this structure, such as MgZn2, MgCu2 and MgNi2, are known as Laves phases Pedersen et al. (2010). To detect the formation of crystalline nuclei in our simulations, we look for the presence of Frank-Kasper (FK) polyhedra Frank and Kasper (1958) adapted to WAHN mixtures Pedersen et al. (2010). FK bonds connect two neighboring particles of type 2 if they share at least 6 neighbors of type 1 (see a snapshot in Fig. 2). We compute neighbors using the radical Voronoi algorithm suited for additive mixtures Rycroft (2009). The crystalline nuclei are composed of a tetrahedral network of FK bonds. While in previous works Pedersen et al. (2010, 2021) only type 2 particles from which 4 FK bonds emanate towards other neighboring type 2 particles are considered to belong to the crystal phase, here we identify crystal clusters as composed of neighboring type 2 particles linked by an FK bond. We found that the shape of the nuclei is not affected by this definition.
III Results and discussions
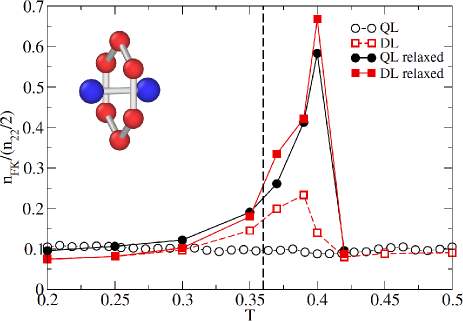
After relaxing configurations of as-deposited layers up to a maximum of time steps (i.e., in internal units), we find crystallization in the narrow range of temperatures . In Fig. 2, we show the number of FK bonds normalized for half the number of particles of type 2, , versus for both the deposited and supported layers. The as-deposited layer (open red squares) shows a peak of FK bonds around , while the supported layer (open black circles) shows a flat profile. After relaxation, the peak of the DL (full red squares) increases in intensity and shifts to , and also the QL (full black circles) develops a similar peak.
First, we investigate the structure of the layer at a temperature () where it reaches equilibrium and no nucleation occurs within the maximum time simulated. In addition to particle number density and FK bonds we characterize local order through the locally favored structures (LFS) defined as those geometric motifs which allow to identify molecular arrangements corresponding to some local minima of the free energy Jenkinson et al. (2017). LFS in the Wanström model has been shown to consist of particles forming icosahedra Malins et al. (2013a); Wahnström (1991); Coslovich and Pastore (2007). In Leoni et al. (2023) it has been found in WAHN a strong correlation between the number of LFS and temperature, a result also found in systems as different as colloids Patrick Royall et al. (2008); Leocmach and Tanaka (2012), metallic glasses Royall and Williams (2015), or water in combination with a neural network classification scheme Martelli et al. (2020). We identify icosahedra with the topological cluster classification (TCC) algorithm Malins et al. (2013b).
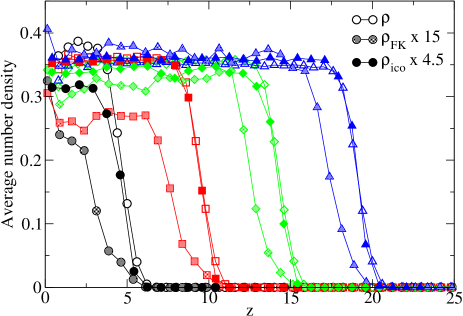
We compare the average number density profile along for particles distribution (), for FK bonds () and for icosahedra () at after relaxing each one of the four systems obtained by depositing particles up to a time , , and (, , , , where is the time duration of the full deposition process), i.e., by depositing a fraction , and of the full DL system. Each system is relaxed for a time equal to , and averages are computed considering only the second half of the relaxation process for a single realization of the substrate. In order to compare and with on the same scale, both densities are rescaled by a factor 15 and 4.5, respectively. Figure 3 shows that the distribution of icosahedra mirrors the distribution of particles at liquid-vapor interfaces as expected Godonoga et al. (2011), while FK bonds are suppressed near the free surface by about an extra length due to the wider range involved in the formation of an FK bond compared to an icosahedron, and to the segregation of type 2 particles near the free surface (see below and Fig. 5).
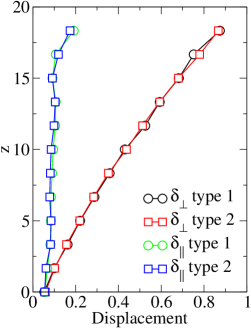
To study the stability of the DL at , we perform an energy minimization of the as-deposited system by using the FIRE algorithm Bitzek et al. (2006), which employs a damped dynamics method to adjust particle coordinates giving the inherent structures (IS). In the right panel of Fig. 4, we show a snapshot of the displacement vectors for each particle in the system, where and are the position before and after minimization, respectively. In the left panel of Fig. 4 we show the average displacement along the direction, , and along a direction within the plane, for particle type 1 and 2 separately. Figure 4 shows that for both type 1 and 2 particles increases with increasing , that is, when approaching the free surface, while remains constant. This behavior is reminiscent of that of a free-standing layer Shi et al. (2011) made of Kob-Andersen (KA) Kob and Andersen (1994) particles, where energy minimization displaces particles near both free surfaces towards the center of the free-standing layer. Interestingly, this behavior persists even in the presence of a single free surface, as shown in Fig. 4. These findings further support the notion that free surfaces play a crucial role in enhancing the efficiency of landscape sampling.
To investigate the nucleation process during deposition, we perform simulations at for 30 different realizations of the system (different spatial disordered configurations of the substrate keeping fixed its density to , and different random sequences of initial position and lateral velocities of injected particles). We compute properties of the deposited layer at four times during deposition (, , , and ) and at and for the relaxed layer.
First, we compute the number density profile along the direction for type 1, 2 and 1+2 particles (see Fig. 5). We notice that the density profile in the middle of the pore is always flat and sharply drops to zero near the free surface (within ). Particles of type 2 (of larger diameter) show segregation at the free surface.
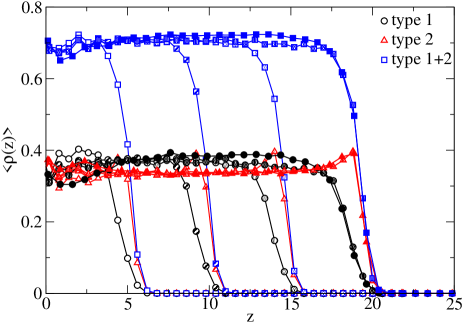
This effect has been observed in previous simulations for the deposition of KA mixtures in 2D Reid et al. (2016) and 3D free-standing layers of KA Shi et al. (2011). In these works, this effect has been attributed to the maximization of type 1 – type 2 interactions in the layer since for KA mixtures (where type 1 and 2 are commonly indicated with B and A particles, respectively) and type 2 and 1 particles are and of the total, respectively. In the present case, type 2 and 1 particles are present in the same proportion, and all the are the same. Therefore, the segregation of type 2 particles we observe at the free surface should be linked to the system’s minimization of the energetic cost associated with interface formation through the maximization of the number, rather than the type, of particle interactions, coming from optimal particle packing. This effect could be relevant in explaining segregation phenomena in the Kob-Andersen (KA) model as well.
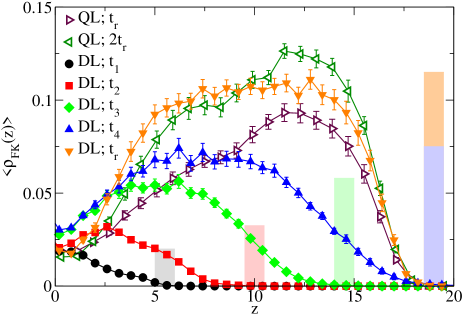
After we verified that the density profile along is flat and sharply decreases towards zero near the free surface, i.e., it does not show a peak that would favor the formation of crystallites, we compute the average density profile of FK bonds during deposition and after relaxation (see Fig. 6). From it, we can notice the formation of a broad peak in with time corresponding to the formation of a critical nucleus (starting on average at ), as we verified by computing the average size of the main cluster with time (not shown). Together with the for the DL, in Fig. 6, we show its behavior for the QL at two times, and . We can notice that after a time , the QL shows a lower concentration of FK bonds compared to the DL relaxed for the same duration , and the distribution in is asymmetric with a peak emerging near the free surface. This difference between the DL and QL is due to the higher stability reached by the DL during the deposition process compared to the QL. As shown in Ref. Leoni et al. (2023), the internal potential energy and the specific volume in the DL are lower compared to the QL, while the concentration of LFS is correspondingly higher in a range of temperatures around . Indeed, the symmetrical shape of for the DL shown in Fig. 6 is due to the fact that all the particles forming the DL were near the free surface at some point during the deposition process, while for the QL particles near the substrate never come close to the free surface during the quench process when . After a relaxation of , the peak in shown by the QL near the free surface overcomes the value of the DL (which has been relaxed for a time equal to ), while it still does not keep up with it near the substrate.
at .
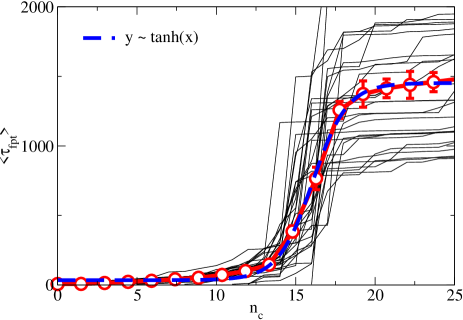
Usually, to estimate the size of the critical nucleus , one can compute the mean first passage time defined as the average time elapsed until the appearance of a nucleus of size in the system. In Fig. 7, we show for every single realization of the system (black lines) together with the average curve (red circles). The mean first passage theory Reguera et al. (2005); Wedekind et al. (2007) would predict a critical nucleus corresponding to the inflection point of , which in our case gives . A more refined version of the mean first passage theory, including space- and time-dependent diffusivity, could give a more precise estimation of .
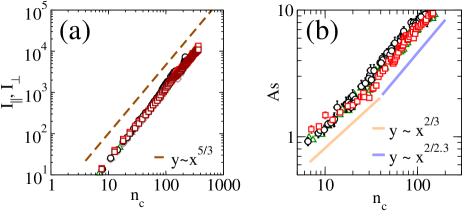
To investigate the structural properties of nuclei, we compute their moment of inertia with respect to the axis passing through their barycenter and parallel to one of the coordinate axis (, , , respectively). Due to the cylindrical symmetry of the system, we compute and . In panel (a) of Fig. 8, we show that for both the DL and QL, the moment of inertia along different directions follows the typical scaling holding for nuclei which are symmetric on average. More specific information on the geometrical properties of nuclei can be obtained from the radius of gyration and the asphericity as a function of their size . We obtain and from the gyration tensor, so defined:
| (2) |
where , and is the component of the position vector of the particle belonging to the cluster. The eigenvalues of are also called principal moments and can be written as the ordered elements . The radius of gyration is defined as , and the asphericity as . The asphericity is for a perfect sphere and otherwise. The behavior of (Fig. 8(b)) shows an increasing asymmetric character of nuclei with the increasing of their size, suggesting an asymmetric growth along the principal axis of inertia.
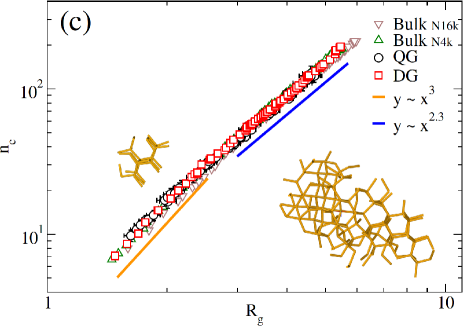
Indeed, from Fig. 8(c) we can see that the size of a nucleus grows with as for small size, in agreement with the behavior of an isotropic 3D object, while it grows as for large nucleus size, suggesting either a sub-3D growth in this regime or a developing fractal or spongy morphology.
Considering all the results shown in Fig. 8(a),(b),(c), together with snapshots inspection as those shown in the inset of panel (c), we conclude that nuclei grow following a sub-3D behavior after an initial 3D growth. Including type 1 particles in the cluster analysis would give further insights into the nuclei growth behavior with their size. Here we notice that the growth of nuclei showing multiple fully formed oblong tetrahedral networks (i.e., hexagonal rings of FK bonds forming a compact network) stacking onto each other (as for the right snapshot shown in panel (c) of Fig. 8) suggests that even considering type 1 particles would give a sub-3D growth behavior and that the standard 3D growth could take over for larger clusters (i.e., for ). During the formation of crystalline clusters, due to their structural composition with A and B corresponding to particles of type 1 and 2, respectively (as described in Sec. II), particles of type 1 are depleted. In Fig. 8(c), alongside the results for the systems of size N=4000 particles, we also consider a larger bulk system () to check whether this depletion affects the statistics of nuclei up to the size we considered in this work. From simulations of 20 independent trajectories, we find the same scaling laws for vs shown for both system sizes. While the stability, and then the structure, of solid clusters can be size-dependent for small cluster size (as observed for systems as different as simple one-component liquids Mossa and Tarjus (2003) or a coarse-grained water model Leoni et al. (2019)), the behavior of WAHN clusters for large cluster size is related to the preference of Laves phases such as the MgZn2 to grow along the direction normal to the basal plane Li et al. (2018).
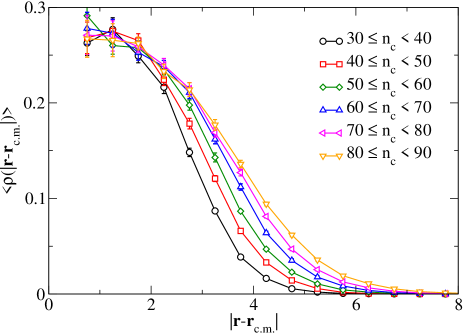
To further characterize the structure of nuclei, we computed their average radial number density profile as a function of the distance from the center of mass for different range of nucleus sizes (see Fig. 9). Up to nuclei of size , the density profile shows a 3D growth (profiles translate to larger values of for increasing nucleus size ), while further increasing the nucleus size the density profile shows a sub-3D growth (profiles translate to larger values of for increasing only in their tails). This result confirms the change in the growth behavior of nuclei with for (see Fig. 8). We notice that the scaling of the average moment of inertia of the nuclei with their size (right inset of Fig. 8) is the same along the axis parallel and perpendicular to the interface, i.e. the nuclei do not have a preferential orientation on average. This means that the presence of a free surface does not affect the orientation of nuclei.
IV Conclusion
In conclusion, we investigated the nucleation process in a popular metallic glassformer (Wahnström mixture) during the layer formation by vapor deposition on a cold substrate and compared it with the conventional quenched solid in the same geometry and the bulk. We found that the as-deposited layer shows the significant enhancement of peculiar local ordered structures (FK bonds) compared to the QL (open red squares in Fig. 2) and the bulk, even before relaxing the system (full symbols in Fig. 2). Since the formation of these local structures is triggered by the enhanced mobility at the surface Leoni et al. (2023), the fact that all the particles of the deposited layer are part of the free surface at some point during the deposition process explains why the DL shows a larger content of FK bonds compared to the QL (see Fig. 6) and the bulk before the relaxation process takes place. On the other hand, we observe homogeneous nucleation in all the systems studied here and find that the nuclei share the same growth behavior, 3D-like up to a size of 40-50 type 2 particles and sub-3D for larger size due to the preference of clusters to grow along the basal plane. It is worth noting that it has recently been shown Hayton et al. (2023) that nucleation of water in film geometries remains bulk-like even for films size of the order of the critical nucleus. These findings provide further insights into nucleation behavior in confined environments for systems that are prone to crystallization, such as simple metallic glasses, and small molecular systems, such as water, for which nucleation during vapor deposition is commonly observed.
Acknowledgements.
This work is dedicated to the 80th birthday of Myroslav Holovko, an outstanding scientist in the theory of the liquid state. We also wish to express solidarity with other Ukrainian scientists in these difficult times. F.L. and J.R. acknowledge support from the European Research Council Grant DLV-759187, partial support by ICSC – Centro Nazionale di Ricerca in High Performance Computing, Big Data and Quantum Computing, funded by European Union – NextGenerationEU, and CINECA-ISCRA for HPC resources. H.T. acknowledges the grant-in-aid for Specially Promoted Research (JP20H05619) from the Japan Society of the Promotion of Science (JSPS).References
- Ediger (2017) M. D. Ediger, J. Chem. Phys. 147, 210901 (2017).
- Rodriguez-Tinoco et al. (2022) C. Rodriguez-Tinoco, M. Gonzalez-Silveira, M. A. Ramos, and J. Rodriguez-Viejo, Riv. del Nuovo Cim. , 1 (2022).
- Kanji et al. (2017) Z. A. Kanji, L. A. Ladino, H. Wex, Y. Boose, M. Burkert-Kohn, D. J. Cziczo, and M. Krämer, Meteorological Monographs 58, 1 (2017).
- Espinosa et al. (2019) J. R. Espinosa, C. Vega, C. Valeriani, D. Frenkel, and E. Sanz, Soft Matter 15, 9625 (2019).
- Leoni and Russo (2021) F. Leoni and J. Russo, Phys. Rev. X 11, 031006 (2021).
- Espinosa et al. (2018) J. R. Espinosa, C. Vega, and E. Sanz, The Journal of Physical Chemistry C 122, 22892 (2018).
- Tonauer et al. (2023) C. M. Tonauer, L.-R. Fidler, J. Giebelmann, K. Yamashita, and T. Loerting, The Journal of Chemical Physics 158, 141001 (2023).
- Lupi et al. (2014) L. Lupi, N. Kastelowitz, and V. Molinero, J. Chem. Phys. 141, 18C508 (2014).
- Malshe et al. (2011) R. Malshe, M. D. Ediger, L. Yu, and J. J. de Pablo, The Journal of Chemical Physics 134, 194704 (2011).
- Lyubimov et al. (2013) I. Lyubimov, M. D. Ediger, and J. J. de Pablo, J. Chem. Phys. 139, 144505 (2013).
- Berthier et al. (2017) L. Berthier, P. Charbonneau, E. Flenner, and F. Zamponi, Phys. Rev. Lett. 119, 188002 (2017).
- Reid et al. (2016) D. R. Reid, I. Lyubimov, M. Ediger, and J. J. De Pablo, Nature communications 7, 1 (2016).
- Moore et al. (2019) A. R. Moore, G. Huang, S. Wolf, P. J. Walsh, Z. Fakhraai, and R. A. Riggleman, Proceedings of the National Academy of Sciences 116, 5937 (2019).
- Leoni et al. (2023) F. Leoni, F. Martelli, C. P. Royall, and J. Russo, Phys. Rev. Lett. 130, 198201 (2023).
- Shintani and Tanaka (2006) H. Shintani and H. Tanaka, Nat. Phys 2, 200 (2006).
- Pedersen et al. (2010) U. R. Pedersen, T. B. Schrøder, J. C. Dyre, and P. Harrowell, Phys. Rev. Lett. 104, 105701 (2010).
- Pedersen et al. (2021) U. R. Pedersen, I. Douglass, and P. Harrowell, The Journal of Chemical Physics 154 (2021).
- Russo et al. (2018) J. Russo, F. Romano, and H. Tanaka, Phys. Rev. X 8, 021040 (2018).
- Hu and Tanaka (2020) Y.-C. Hu and H. Tanaka, Science Advances 6, eabd2928 (2020).
- Wahnström (1991) G. Wahnström, Phys. Rev. A 44, 3752 (1991).
- Tanaka (2012) H. Tanaka, Eur. Phys. J. E 35, 113 (2012).
- Russo and Tanaka (2016) J. Russo and H. Tanaka, J. Chem. Phys. 145, 211801 (2016).
- Wang (2009) W. Wang, Advanced Materials 21, 4524 (2009).
- Ashby and Greer (2006) M. Ashby and A. Greer, Scripta Materialia 54, 321 (2006).
- Thompson et al. (2022) A. P. Thompson, H. M. Aktulga, R. Berger, D. S. Bolintineanu, W. M. Brown, P. S. Crozier, P. J. in ’t Veld, A. Kohlmeyer, S. G. Moore, T. D. Nguyen, R. Shan, M. J. Stevens, J. Tranchida, C. Trott, and S. J. Plimpton, Comp. Phys. Comm. 271, 108171 (2022).
- Stukowski (2009) A. Stukowski, Modelling and Simulation in Materials Science and Engineering 18, 015012 (2009).
- Frank and Kasper (1958) F. C. Frank and J. S. Kasper, Acta Crystallographica 11, 184 (1958).
- Rycroft (2009) C. H. Rycroft, Chaos: An Interdisciplinary Journal of Nonlinear Science 19, 041111 (2009).
- Jenkinson et al. (2017) T. Jenkinson, P. Crowther, F. Turci, and C. P. Royall, J. Chem. Phys. 147, 054501 (2017).
- Malins et al. (2013a) A. Malins, J. Eggers, C. P. Royall, S. R. Williams, and H. Tanaka, J. Chem. Phys. 138, 12A535 (2013a).
- Coslovich and Pastore (2007) D. Coslovich and G. Pastore, J. Chem. Phys. 127, 124504 (2007).
- Patrick Royall et al. (2008) C. Patrick Royall, S. R. Williams, T. Ohtsuka, and H. Tanaka, Nat. Mater. 7, 556 (2008).
- Leocmach and Tanaka (2012) M. Leocmach and H. Tanaka, Nat. Commun. 3, 1 (2012).
- Royall and Williams (2015) C. P. Royall and S. R. Williams, Phys. Rep. 560, 1 (2015), the role of local structure in dynamical arrest.
- Martelli et al. (2020) F. Martelli, F. Leoni, F. Sciortino, and J. Russo, J. Chem. Phys. 153, 104503 (2020).
- Malins et al. (2013b) A. Malins, S. R. Williams, J. Eggers, and C. P. Royall, J. Chem. Phys. 139, 234506 (2013b).
- Godonoga et al. (2011) M. Godonoga, A. Malins, J. Eggers, and C. P. Royall, Molecular Physics 109, 1393 (2011).
- Bitzek et al. (2006) E. Bitzek, P. Koskinen, F. Gähler, M. Moseler, and P. Gumbsch, Phys. Rev. Lett. 97, 170201 (2006).
- Shi et al. (2011) Z. Shi, P. G. Debenedetti, and F. H. Stillinger, The Journal of Chemical Physics 134, 114524 (2011).
- Kob and Andersen (1994) W. Kob and H. C. Andersen, Phys. Rev. Lett. 73, 1376 (1994).
- Reguera et al. (2005) D. Reguera, J. Rubi, and J. Vilar, “The mesoscopic dynamics of thermodynamic systems,” (2005).
- Wedekind et al. (2007) J. Wedekind, R. Strey, and D. Reguera, The Journal of chemical physics 126, 134103 (2007).
- Mossa and Tarjus (2003) S. Mossa and G. Tarjus, The Journal of Chemical Physics 119, 8069 (2003).
- Leoni et al. (2019) F. Leoni, R. Shi, H. Tanaka, and J. Russo, J. Chem. Phys. 151, 044505 (2019).
- Li et al. (2018) L. Li, C. Ban, Y. Bi, R. Zhang, H. Zhang, T. Liu, Q. Zhu, Y. Zuo, X. Wang, and J. Cui, Journal of Materials Science 53, 15181 (2018).
- Hayton et al. (2023) J. A. Hayton, M. Davies, T. F. Whale, A. Michaelides, and S. J. Cox, Faraday Discussions (2023), 10.1039/D3FD00099K.