∎
22email: raffaella.schneider@uniroma1.it 33institutetext: R. Maiolino 44institutetext: Cavendish Laboratory, University of Cambridge, 19 J. J. Thomson Ave., Cambridge CB3 0HE, UK
Kavli Institute for Cosmology, University of Cambridge, Madingley Road, Cambridge CB3 0HA, UK
44email: r.maiolino@mrao.cam.ac.uk
The formation and cosmic evolution of dust in the early Universe. I. Dust sources
Abstract
Dust-obscured star formation has dominated the cosmic history of star formation since . However, the recent finding of significant amount of dust in galaxies out to has opened the new frontier of investigating the origin of dust also in the earliest phases of galaxy formation, within the first 1.5 billion years from the Big Bang. This is a key and rapid transition phase for the evolution of dust, as galaxy evolutionary timescales become comparable with the formation timescales of dust. It is also an area of research that is experiencing an impressive growth, especially thanks to the recent results from cutting edge observing facilities, ground-based and in space. Our aim is to provide an overview of the several findings on dust formation and evolution at , and of the theoretical efforts to explain the observational results. We have organized the review in two parts. In the first part, presented here, we focus on dust sources, primarily supernovae and asymptotic giant branch stars, and the subsequent reprocessing of dust in the interstellar medium, through grain destruction and growth. We also discuss other dust production mechanisms, such as Red Super Giants, Wolf–Rayet stars, Classical Novae, Type Ia Supernovae, and dust formation in quasar winds. The focus of this first part is on theoretical models of dust production sources, although we also discuss the comparison with observations in the nearby Universe, which are key to put constraints on individual sources and processes. While the description has a general applicability at any redshift, we emphasize the relative role of different sources in the dust build-up in the early Universe. In the second part, which will be published later on, we will focus on the recent observational results at , discussing the theoretical models that have been proposed to interpret those results, as well as the profound implications for galaxy formation.
Keywords:
Galaxies: high-redshift, formation, evolution, ISM ISM: dust, extinction, supernova remnants Stars: AGB and post-AGB, Population II, Population III, supernovae: general1 Introduction
Dust is a fundamental component of the interstellar medium. Dust extinction and reddening at optical and UV wavelengths, as well as its thermal emission at infrared and sub-millimetre wavelengths, have important implications on the observational properties and detectability of galaxies, especially at high redshift. Dust has a fundamental role in the cooling of the interestellar medium and, therefore, facilitating the gravitational collapse, hence the formation of stars across a broad range of masses.
Dusty galaxies have been extensively studied in the local Universe and across the cosmic epochs. Obscured systems are found to dominate the cosmic star formation budget out to (Zavala et al. 2021). The new frontier that has been opened in recent years had been the finding of significant amount of dust in galaxies beyond and out to , i.e. within the first 1.5 billion years after Big Bang (e.g. Laporte et al. 2017; Inami et al. 2022; Wang et al. 2021; Witstok et al. 2023; Bañados et al. 2018; Tamura et al. 2019; Popping et al. 2017). This is an interesting timescale from a theoretical perspective, indeed it is comparable with the timescales of some of the most prominent star formation processes, hence opening different scenarios on the relative contribution of various dust formation channels at such early epochs. Therefore, the first 1.5 Gyr after Big Bang represent a key and rapid transition phase in the production and processing of dust grains.
This area of research has recently experienced an impressive growth, expecially thanks to the several recent observational results from the Atacama Large Millimeter/submillimeter Array (ALMA) and from the James Webb Space Telescope (JWST), which have triggered the development of several models to explain the content and properties of dust in the early Universe, as well as their implications for galaxy formation and observability.
Although this field is evolving very rapidly, we believe it is now a proper time to provide an overview of the several findings on early dust formation and evolution, and of the theoretical efforts to explain the observational results. As this is a massive area of research, we have organized the review in two parts.
The first part is presented here and aims at reviewing the landscape of the theoretical models of the possible sources of dust in the early Universe. This is meant to provide the essential backbone required for understanding the observations at high redshift, as well as the key ingredient for the models specifically aimed at interpreting in detail the high redshift observations. In this part we focus on the theoretical scenarios describing nucleation and growth of dust grains in different sources of dust, primarily various models for dust formation in atmospheres of Asymptotic Giant Branch (AGB) and Supernova (SN) ejecta. However, we will also discuss models of additional sources of dust that might be relevant in the early phases of galaxy formation, such as Red Super Giants, Wolf–Rayet stars, and also dust formed in the quasar-driven winds, and we will also discuss the dust reprocessing in the interstellar medium. Our presentation can be useful to describe dust formation and evolution at any redshift. However, we will emphasize their specific role in the context of the timescales available in the early Universe. Figure 1 gives a quick glimpse of the timescales involved in the dust formation associated with some of these sources (see Sect. 5 for more details); while the figure is highly incomplete, it serves to illustrate the timescales at play and why these sources of dust are relevant in different stages of galaxy formation in the early Universe, hence the motivation for this part of the review.
In this part of the review we do not cover in detail the observational aspects associated with the sources of dust, through the extensive observational studies of dust formation and destruction in various classes, which would require a separate review, and out of the scope of our primary goals of providing the information for the early universe. However, we do briefly compare the expectations of different theoretical models with observations, which are mostly confined in the nearby Universe, for each category of dust sources.
In the second part of the review, which will be published later on, we will focus on the recent observational results investigating the dust content and properties in different classes of galaxies at , out to the earliest epochs for which such constraints have been obtained. We will also discuss the theoretical models and cosmological simulations that have been proposed to interpret those results, as well as the profound implications for galaxy formation.
We clarify that this is not, by any means, the first review on the dust sources and dust reprocessing. Many other extensive review have been presented in the past, starting from Draine (2003), which discussed the observed properties of interstellar dust grains (wavelength dependent extinction, scattering, emission, and polarization), and their implications for dust models (Draine 2009); dust production by supernovae (Gall et al. 2011; Sarangi et al. 2018), and its subsequent processing and survival in supernova remnants (Micelotta et al. 2018); dust formation and mass loss of stars on the asymptotic giant branch (Höfner and Olofsson 2018); and the properties of dust in the interstellar medium of nearby galaxies (Galliano et al. 2018), which provide an invaluable laboratory to explore fundamental dust processes across a diversity of environmental conditions (metallicity, star formation activity, etc.), hence constituting a necessary intermediate step towards understanding distant galaxies.
Here we leverage on those reviews, by expanding and updating them in some areas, with the specific focus of exploring the nature and origin of dust in the early universe.

2 Supernovae
2.1 Models of dust formation in supernova ejecta
Since the explosion of SN1987A, direct observations of dust formation in core-collapse SNe have motivated theoretical investigations of dust condensation in SNe. Three main approaches have been followed, with increasing degree of complexity.
2.1.1 Classical nucleation theory
The simplest approach adopts the so-called classical nucleation theory (CNT), which was first applied by Kozasa et al. (1989, 1991) to model dust formation in SN 1987A. In CNT, when a gas becomes supersaturated, particles (monomers) aggregate in a seed cluster that subsequently grow by accretion of other monomers.
For grain materials whose molecules are not present in the gas phase, the rates of nucleation and grain growth are controlled by one chemical species, which is referred to as the key species. This is the species of the reactants that has the least collisional frequency onto a target nuclei (Kozasa and Hasegawa 1987). Under these conditions, the steady-state nucleation rate (that is the number of critical clusters formed per unit volume and unit time) is given by:
| (1) |
and the grain growth rate is:
| (2) |
In these expressions, is the sticking coefficient (the probability that when a collision occurs, the collider sticks to the target), is the volume of the monomer of the key species in the condensed phase, is the surface tension of the condensed material, and are the mass, concentration and velocity of the key species monomers, is a parameter, is the ejecta temperature and is the super-saturation ratio, expressed as:
| (3) |
where is the Gibbs free energy for the condensation reaction solid ( are the chemical species of the reactants and products in the gas-phase and are the stoichiometric coefficients, which are positive for the reactants and negative for the products), and are the partial pressures of the -th species.
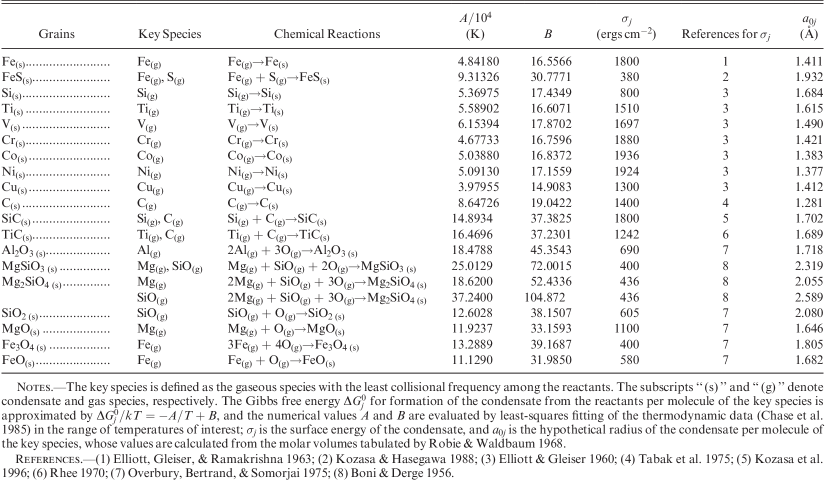
The grain properties that are generally included in SN dust formation models are reported in Fig. 2.
The presence of CO and SiO molecules in SN ejecta is very important for dust formation, because carbon atoms bound in CO molecules are not available to form Amorphous Carbon (AC) grains and SiO molecules take part in the reactions that lead to the formation of oxide grains, such as MgSiO3, Mg2SiO4 and SiO2. In some of the models, the CO and SiO abundance is computed under the assumption of chemical equilibrium, balancing radiative association rates with destruction rates through collisions with energetic electrons and, for SiO, charge transfer with positive Ne ions (Todini and Ferrara 2001; Schneider et al. 2004). Other models have computed the CO and SiO abundance under non-steady state conditions (Bianchi and Schneider 2007), including in the reaction network additional species, such as C2 and O2, and bimolecular neutral-neutral reactions (Marassi et al. 2014, 2015, 2019). When applied to the same SN progenitor, the CO abundance predicted by this upgraded molecular network at the onset of dust nucleation is in good agreement with the result of chemical kinetic model (Sarangi and Cherchneff 2013, see Sect. 2.1.3). Finally, some of the models perform dust formation calculations assuming that the formation of CO and SiO molecules is complete, so that no carbon-bearing grains condense if C/O , and no Si-bearing grains – except for oxide grains – condense if Si/O (Nozawa et al. 2003, 2010).
In general, at the beginning of the nucleation process the gas is moderately supersaturated, the nucleation rate is small and large seed clusters, made of monomers, tend to form. Due to the expansion, the volume of the ejecta increases, the supersaturation rate grows and smaller clusters form with a larger formation rate. This occurs until the gas becomes sufficiently rarefied (because of expansion and/or exhaustion of monomers in the gas phase), and the formation rate drops. This sequence of events, together with accretion, results in a typical log-normal-like grain size distribution (Bianchi and Schneider 2007).
Thanks to its relative simplicity, CNT has been applied to perform systematic explorations of dust condensation in 1D spherically symmetric SN explosion models with varying progenitor mass, metallicity, rotation rate, explosion energy, and supernova type. Todini and Ferrara (2001) used it to model dust formation in core collapse supernovae starting from the grid of explosion models by Woosley and Weaver (1995), hence assuming progenitors masses in the range , and initial metallicities . Using the same grid of SN explosion models, Bianchi and Schneider (2007) explored the additional effect of the partial destruction by the SN reverse shock (see Sect. 2.3 for more details). CNT has been also applied to explore dust formation in pair-instability (Schneider et al. 2004) and faint SN explosions (Marassi et al. 2014) with massive metal-free (Population III) stellar progenitors, to provide a formation pathway of iron-poor stars in the Galactic halo (see e.g. de Bennassuti et al. 2017), and to explain their observed surface elemental abundances. Finally, Marassi et al. (2019) has applied CNT on a new extensive grid of core-collapse SN models (Limongi and Chieffi 2018)111The grid of SN models comprises progenitor masses in the range [13 - 120] with initial equatorial rotational velocities of and km/s, and four different initial progenitor metallicities, (see Marassi et al. 2019 for more details). to investigate how metallicity, rotation, and fallback impact the nucleosynthetic output of the explosion, and the total mass, size, and composition of dust formed in the ejecta.
The applicability of CNT in astrophysical environments has been questioned due to the lack of chemical equilibrium resulting from the low number density (and collision rate) of monomers (Donn and Nuth 1985). However, recent calculations show that even when the number of critical clusters was artificially depressed far below than the value predicted by CNT, the resulting grain size distribution and mass are little affected, with changes in the mean grain radius smaller than 15% (Paquette and Nuth 2011). In addition, Nozawa and Kozasa (2013) have demonstrated that a steady-state nucleation rate is a good approximation in SN ejecta, at least until the collisional timescales of the key species is much smaller than the timescale with which the supersaturation ratio increases, , otherwise the effects of non-steady state lead to lower condensation efficiencies and larger average radii of newly formed grains. Since the dust destruction efficiency by the SN reverse shock heavily depends on the grain size distribution (see Sect. 2.3), the knowledge of the size distribution of newly formed dust is critical to predict the mass and sizes of grains that survive and enrich the interstellar medium (ISM). The analysis performed by Nozawa and Kozasa (2013) shows that the steady state nucleation rate is applicable only if , and can be expressed as a function of the gas density and temperature at the time when dust formation starts222Nozawa and Kozasa (2013) also provide fitting formulae to their non-steady state models, that express the final average grain size and condensation efficiency as a function of and that can be used to estimate the typical size and mass of newly formed grains formed in different astrophysical environments.. When applied to the physical conditions predicted by Type-IIp or Type-IIb SN models, is generally found to be , and the steady state approximation is found to be appropriate.
2.1.2 Kinetic nucleation theory
A second method to model dust formation in SN ejecta is the so-called kinetic nucleation theory (KNT). Compared to CNT, KNT is more realistic as it does not assume a steady state between condensation and evaporation: the condensation rate of clusters of atoms is computed from kinetic theory and the evaporation rate by applying the principle of detailed balance. The method is fully described in Nozawa et al. (2003) where it has been applied to model dust formation in Population III core-collapse SN explosions with progenitor masses and in pair instability SN explosions with progenitor masses of and .
Dust formation is expected to depend on the type of core-collapse SN explosion, and in particular on the mass of the outer H-rich envelope (Kozasa et al. 2009). A less massive outer envelope leads to larger expansion velocities of the He-core, causing a rapid decrease in the temperature and density of the expanding ejecta. Investigation of dust formation applying KNT to a SN-Ib explosion model similar to the observed SN 2006jc (Nozawa et al. 2008), and to a SN-IIb explosion model similar to Cas A (Nozawa et al. 2010), show that dust formation can occur earlier than in Type-IIp SN explosions, the total dust mass formed is comparable but the grain sizes are strongly reduced, with important implications for their destruction by the reverse shock (see Sect. 2.3). An exploration of the dependence of dust formation on the properties of the SN explosions (progenitor mass, explosion energy) has been recently carried out by Brooker et al. (2022), who applied KNT to a large database of SN explosion models based on the work by Fryer et al. (2018), with 15, 20, and 25 progenitor masses and covering a wide range of explosion energies. They generally find that the bulk of dust production, irrespective of individual grain species, occurs earlier for more energetic explosions, as these explosions evolve more rapidly owing to higher initial kinetic velocity. As a result, for a given progenitor mass, there is also a clear dependence of grain size of individual species on the explosion energy, where less energetic models ultimately produce larger dust grains, as their ejecta experience the physical conditions amenable to dust production over a longer period of time. Because the energy of the SN explosion sensitively impacts the resulting nucleosynthesis, both the dust composition and dust mass are found to depend on the explosion energy, consistent with previous findings (Marassi et al. 2019).
Despite the encouraging results discussed above, CNT and KNT do not consider the actual chemical pathway that leads to the formation of the molecular precursors and seed nuclei. To overcome this limitation, Lazzati and Heger (2016) developed a formalism that is able to join the chemical phase with the grain growth phase using KNT. As a proof of concept, they applied this hybrid approach to the formation of carbonaceous grains in the ejecta of a 15 SN explosion with initial solar metallicity. Compared to CNT, they find a more gradual dust formation, extending from a few months up to a few years after the explosion, in closer agreement with observations of local SN remnants (see Sect. 2.4).
2.1.3 Molecular nucleation theory
The third method to compute dust formation is the chemical kinetics model or molecular nucleation theory (MNT), where the chemical pathway proceeds through simultaneous phases of nucleation and condensation. The nucleation phase, which leads to the formation of molecular and cluster precursors, is described by an extended non equilibrium chemical network. In the condensation phase, the small clusters formed in the gas phase condense through coagulation and coalescence to form large grains, provided suitable conditions are met. The method was introduced by Cherchneff and Lilly (2008), which applied it to investigate the nucleation phase in the ejecta of a Population III pair-instability supernova explosion with progenitor mass of 170 . Cherchneff and Dwek (2009) and Cherchneff and Dwek (2010) applied the same approach to investigate the formation of molecules and early dust precursors in the ejecta of Population III supernova explosions with progenitor masses of 20 and 170 , studying the effect of different levels of heavy element mixing in the ejecta. The model was then applied to the stratified ejecta of Type-IIp SN explosions with progenitor masses of 12, 15, 19, and 25 and initial solar metallicity (Sarangi and Cherchneff 2013), and then extended from the nucleation phase to the condensation phase by Sarangi and Cherchneff (2015). In this approach, the condensation phase occurs through coagulation between small clusters rather than grow through adsorption of gas monomers or molecules, as in CNT, KNT and in the hybrid model by Lazzati and Heger (2016). In the latter model, it is found that monomers are more abundant than clusters, and, being lighter, have a larger thermal velocity that makes collisions more frequent. The formation of large grains likely requires coagulation and growth to be taken into account simultaneously in the condensation phase (see Sluder et al. 2018 and the discussion below).
In all the models described above, the physical properties of the expanding SN ejecta were based on fully mixed one zone models or on 1D spherically symmetric models where the elemental abundances are distributed in concentric shells, with different degrees of mixing and a uniform or clumpy gas distribution. Attempt to incorporate dust formation into more sophisticated description of the ejecta have been made by Sluder et al. (2018), who developed a model to account for anisotropic 56Ni dredge-up, the so-called “nickel bubbles”, that arise as a consequence of the strongly a-spherical explosion geometry (see Sluder et al. 2018 and references therein). Using MNT in a framework where the nucleation phase is joined to the condensation phase through both coagulation and grain growth, they modelled dust formation in SN1987A adopting a core-collapse SN model with LMC initial metallicity ().
2.1.4 Models comparison

A comparison between the predictions of all these theoretical models is shown in Fig. 3. For each model, we report the total mass of dust predicted in core-collapse SN explosions with different initial progenitor masses (hereafter we refer to as the zero-age main sequence stellar mass) and assuming that stars have initially a solar metallicity (except for the model by Sluder et al. 2018). When reporting the results of each study, we attempted to select the SN models with explosion energies as close as possible to erg. The predicted dust masses are scattered between and , with no clear coherent trend. In general, at least for the few stellar progenitors where the comparison is possible, models based on CNT (Bianchi and Schneider 2007; Marassi et al. 2019) (represented with the blue color palette) tend to predict larger dust masses compared to models based on MNT (Sarangi and Cherchneff 2015, red colour palette) or on KNT (Lazzati and Heger 2016; Brooker et al. 2022, pink and violet). Note, however, that the results of Brooker et al. (2022) and Sluder et al. (2018) for the progenitor are very close to what expected on the basis on CNT by Bianchi and Schneider (2007). At the same time, the comparison between the results of Bianchi and Schneider (2007) and Marassi et al. (2019) shows that – even assuming a very similar approach to follow dust formation – the resulting dust masses are sensitive to the adopted SN explosion models and to the assumed rotation rate of the progenitor star, at least for stars with initial masses . Similarly, assuming a clumpy rather than a homogeneous ejecta can increase the dust mass by almost 0.5 dex for the same progenitor mass (see the difference between the dark and light red points, corresponding to the clumpy and homogeneous ejecta model for a progenitor predicted by Sarangi and Cherchneff 2015). The figure also shows that the most efficient dust factories are SN explosions from low-mass rotating stellar progenitors (), as a consequence of rotational mixing, which leads to more metal-enriched ejecta. This also causes stronger mass loss by stellar winds in the pre-SN evolution of more massive progenitors (), reducing the mass of the ejecta and of the newly synthesized dust compared to non rotating models. Finally, above , the strong fallback experienced during the SN explosion is the main limiting factor to dust production, at least in models based on CNT.

In Fig. 4 we show a comparison of the grain composition predicted by different theoretical models when applied to SN explosions with three initial progenitor masses, (top row), (middle row), and (bottom row). The symbols and color-coding of theoretical models is the same as the one adopted in Fig. 3. Here we have broadly classified the grain species into carbon grains, silicates (which comprise enstatite, MgSiO3, forsterite, Mg2SiO4, silicon dioxide SiO2, pure silicon, Si, and silicon carbide, SiC), and other grain types, which comprise alumina (Al2O3), pure iron (Fe), iron sulfide (FeS), iron oxyde (FeO), magnetite (Fe3O4), pure magnesium (Mg), and magnesia (MgO). The figure shows that a large variety of grain species are predicted to form. For the SN model with progenitor, all the non-rotating models predict the formation of more carbon grains than silicates, although the mass of carbon dust depends on the dust formation scheme adopted, being larger for models based on CNT (Bianchi and Schneider 2007; Marassi et al. 2019), and becoming progressively smaller for models based on KNT (Lazzati and Heger 2016; Brooker et al. 2022) and MNT (Sarangi and Cherchneff 2015). For rotating models, instead, the abundance of heavier and more internal elements is very sensitive to rotational mixing, and the dominant grain species in the model are predicted to be magnetite and forsterite. Even for non-rotating models, silicate formation by the progenitor depends on the adopted SN explosion model, being negligible for Bianchi and Schneider (2007) and Brooker et al. (2022), and small but not negligible for Sarangi and Cherchneff (2015) and Marassi et al. (2019), despite the different microphysical approach to dust nucleation adopted in the latter models. Similar considerations apply for the and progenitors333Note that in the middle panels we show the results of Bianchi and Schneider (2007) for a SN progenitor, and of Sarangi and Cherchneff (2015) for a SN progenitor.. All the models predict the formation of carbon, silicates and other grains, with masses that are larger when CNT is adopted.
2.2 The case of SN 1987A
When comparing the predictions of different SN dust models, it is important to consider the grain size distributions expected for different grain species. In fact, depending on the properties of the ejecta and on the timing of dust nucleation, the condensation phase via coagulation and/or accretion may lead to very different predictions regarding the characteristic grain sizes. This aspect is important when comparing with observational indications of the time evolution of dust formation in young SN remnants, and to estimate the fraction of newly formed dust that will be able to survive the passage of the reverse shock, with larger grains generally being more resistant to destruction (see Fig. 20 in Kirchschlager et al. 2023 for a discussion on the impact of gas density and magnetic field on the survival fraction of grains as a function of their sizes).
To this aim, we selected a few studies where the supernova model (progenitor mass, metallicity, explosion energy) has been chosen to provide a fair counterpart to SN 1987A (Sarangi and Cherchneff 2015; Bocchio et al. 2016; Sluder et al. 2018; Brooker et al. 2022). Depending on the model, both the time evolution of dust formation and the final dust mass, composition and sizes, can vary significantly. Bocchio et al. (2016) select a progenitor exploding with an energy of erg, and releasing a 56Ni mass of . Using CNT, they find that of dust forms in the ejecta (see their Table 2), mostly composed by Mg2SiO4 (), SiO2 (), Fe3O4 (), and carbon grains (). The grain species follow a log-normal-like size distribution function, with central (peak) grain size which depends on the grain species, and which is larger for carbon grains (90.4 nm), Mg2SiO4 (68.9 nm) and SiO2 (55.5 nm), and smaller for Fe3O4 (9.3 nm), reflecting the ejecta initial composition, and the timing of dust nucleation.
A similar SN model was considered by Brooker et al. (2022) (see their M20cE1.00 model). Using KNT they find that forms, mostly in the form of carbon (), forsterite () and alumina grains (). They do not show the time evolution of the dust mass and the final grain size distribution for this specific model, but based on the results of other SN models with the closest explosion energies, they predict silicate (carbon) grains to form () days after the explosion, and average grain sizes which range from m (m) for forsterite (alumina) grains, to m for carbon grains. Hence, not only the total dust mass and composition is different, but also the average grain sizes are considerably larger compared to Bocchio et al. (2016).
The results of SN 1987A models based on MNT have been discussed by Sluder et al. (2018) (see their Sects. 7.1 and 7.2), who compare their 20 SN model with the 19 clumpy SN model considered by Sarangi and Cherchneff (2015). In Figs. 5 and 6 we show the mass evolution as a function of the post-explosion time for different grain species as predicted by Sarangi and Cherchneff (2015) and Sluder et al. (2018), respectively. In the same figures, we also show the dust mass per logarithm of the radius () for different species at the end of the simulations. This corresponds, respectively, to days and days after the explosion.


At 2000 days after the explosion, the total dust mass predicted by Sluder et al. (2018) is 0.44 , while it is 0.14 in the model by Sarangi and Cherchneff (2015). This difference is attributed to the effect of grain growth by accretion, which is not considered by Sarangi and Cherchneff (2015). The final dust composition predicted by Sarangi and Cherchneff (2015) is dominated by forsterite (), pure magnesium (), alumina (), pure silicon () and iron (). Carbon grains represent only of the total dust mass ().
In the model by Sluder et al. (2018), the dust mass at the end of the simulation ( days) is 0.51 , mostly composed by magnesia (0.16 ), pure silicon (), forsterite (), iron sulfide (), carbon (), and silicon dioxyde ().
In both models, dust formation starts at 100–200 days after the explosion, but for most species appears to be more gradual in Sluder et al. (2018), as a consequence of the lower densities in the ejecta compared to Sarangi and Cherchneff (2015). The overall evolution of forsterite, alumina, iron sulfide, pure iron and silicon grains appears similar, despite the resulting masses are different. A striking difference is that C and SiC grains start to form at days in Sluder et al. (2018) and only at days in Sarangi and Cherchneff (2015), and that magnesium grains do not form in Sluder et al. (2018) due to the rapid formation of magnesia grains. These differences may be due to the different SN model considered, as well as to the inclusion of additional physical processes in Sluder et al. (2018), such as accretion of the grains, grain sublimation, grain charge (which may affect the coagulation rate, see Sluder et al. 2018 for more details).
If we compare the final dust mass distribution as a function of the grains radii, we find that the peak radii agree to within a factor of a few for some grain species (forsterite, carbon, alumina, iron, and iron sulfide), while they differ significantly for others (silicon). In general, the bulk of the grains are found to have radii ranging between to Å in Sluder et al. (2018), and between to Å in Sarangi and Cherchneff (2015). These figures extend to significantly larger radii compared to the predictions of Bocchio et al. (2016), but are at the lower end of the range of grain sizes obtained by Brooker et al. (2022). It is hard to discriminate to what extent these differences can be attributed to the different microphysical processes implemented in the various models, and to what extent these depend on the adopted physical properties of the expanding SN ejecta. Whatever the cause, these differences have important consequences for grain survival and ejection in the ISM.
It is important to comment on the comparison between model predictions and observations of dust formation in SN 1987A. This can be done by looking at the left panel of Fig. 6, where observationally estimated dust masses are reported by the coloured data points, as explained in the legend. These values have been obtained by fitting the observed spectral energy distribution (SED) at different epochs, as derived from observations made by the Kuiper Airborne Observatory (KAO) at , 250, 415, 615, and 775 days after the explosion (Wooden et al. 1993), and at later time by Spitzer ( days, Dwek et al. 2010), Herschel ( days, Matsuura et al. 2011, 2015), and ALMA ( days, Indebetouw et al. 2014; Cigan et al. 2019).
The analyses have been made under different assumptions and using different methodologies. Wesson et al. (2015) use a 3D radiative transfer model to fit the SED, finding a gradual increase in the dust mass, from 0.001 at 615 days, at 1300 days, at 8515 days, to at 9200 days (see the red crosses in the left panel of Fig. 6 indicated by W15 in the legend). This gradual increase has been confirmed by Bevan and Barlow (2016) (green open squares, B16), who used a 3D Monte Carlo model to estimate the dust mass from the observed blueshifting of the emission lines.
None of the models that we have discussed above predicts a sufficiently slow gradual increase of the dust mass to be in agreement with these findings. However, the above interpretation has been questioned by Dwek (2016); Dwek et al. (2019), who argued that dust grains could have formed promptly, but could be hidden in optically thick clumps. By using a simple analytic approach to estimate the probability that a photon can escape a dusty sphere, they estimated that at 615 days the ejecta already contains of enstatite and of carbon dust, but the clumps are optically thick, and remain so until – at 8815 days – they become optically thin and enstatite and carbon grains have coagulated to form composite grains with masses at 8815 days and at 9090 days. Yet, studies based on radiative transfer modelling find it hard to hide early dust formation in clumps while at the same time reproducing the observed spectral energy distribution (SED) and emission line profiles of SN 1987A (Ercolano et al. 2007; Wesson et al. 2015; Bevan and Barlow 2016). After a large parameter exploration of dust models with pure composition and a variety of spatial configurations, Wesson and Bevan (2021) show that – at an epoch of days, a carbon dust mass of , a clump volume filling factor of , and grain radius m is the only parameter set accounting for both the observed constraints on the SED and emission line profiles. Even if assuming carbon-silicate mixture would be consistent with a slightly higher dust mass, these constraints are still a factor of 50–100 below the masses estimated using the most recent observations of SN 1987A with Herschel (Matsuura et al. 2011, 2015) and ALMA (Indebetouw et al. 2014). Hence, these studies support a scenario in which dust formation in SN 1987A continues for many years after the supernova explosion and it is largely dominated by carbon grains444Note that, according to Dwek et al. (2019), if most of the dust forms within two years after the explosion, and the IR emission from the dust is initially self absorbed, the lack of the 9.7 and 18 m silicate emission features in the spectra of SN 1987A is not evidence for the absence of silicate dust, but due to the large optical depth of the ejecta (Dwek and Arendt 2015)., at odds with most (if not all) the theoretical models. Note, however, that these results assume spherically symmetric ejecta, while the 3D distribution of H, He, O, Mg, Si, Ca, and Fe has been found by Larsson et al. (2016) to be sufficiently anisotropic at yrs after the explosion to explain on its own the spectral line asymmetries that are generally attributed to dust (Bevan and Barlow 2016; Wesson and Bevan 2021).
A more general discussion on observations of SN remnants is presented in Sect. 2.4.
2.3 Dust processing and survival in supernova remnants
It has been known since many years that not all the dust newly formed in SN ejecta will be able to enrich the ISM. On longer timescales, compared to the ones discussed above, the ejecta where dust resides is crossed by the reverse shock generated by the interaction between the expanding SN blast wave and the ISM. Depending on the grain properties (compositions and sizes) and on its spatial distribution, the processing by the reverse shock can lead to significant dust destruction. The effective SN dust yield (the dust mass that survives the passage of the reverse shock) is expected to have a different total mass, composition and grain size distribution compared to the newly formed grains that we have discussed above.
The processing and survival of dust formation in SN remnants have been recently reviewed by Micelotta et al. (2018), where an extensive description of the observational evidences and theoretical models can be found. Here we provide a critical discussion of the main findings with the aim of providing a synthetic picture of our current understanding of the effective SN yield.
2.3.1 Physical processes at work
When dust grains are invested by the reverse shock, their interaction with gas particles and with other grains is mediated by different physical processes, such as: sputtering (grain collision with high-velocity atoms and ions which leads to the erosion of the grains via ejection of atoms from its surface), sublimation due to collisional heating to high temperatures, shattering (grain–grain collisions that lead to fragmentation in smaller grains), and vaporization (due to the intense heating generated during grain–grain collisions, that leads to partial or complete return of grain constituents to the gas phase). Sputtering is defined as kinetic when the collision velocities are determined by the relative motion between the grains and the gas (when the grain-gas relative velocity is much larger than the gas thermal speed, generally in cold/warm gas phase, with K), and as thermal when the collision velocities arise from the thermal motion of the gas (when the gas thermal speed is much larger than the grain-gas relative velocity, generally in the hot gas phase, with K). Dust grains in the ionized shocked gas are heated mainly by collisions with electrons. If the grains are small, heating is stochastic and an equilibrium temperature does not exist. Instead, a broad temperature distribution establishes, but only a negligible fraction of the grains is found to exceed the sublimation temperatures (Bianchi and Schneider 2007).
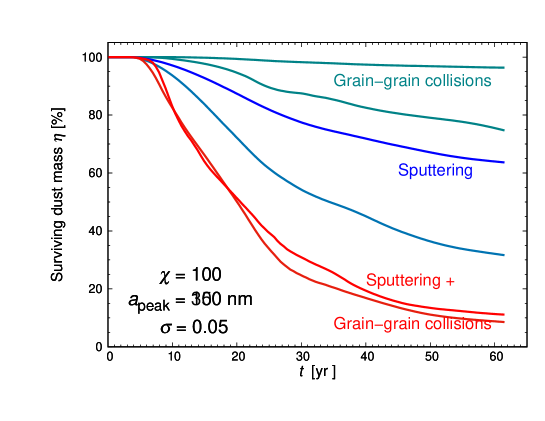
The relative importance of these physical processes in SN remnants depends on the assumed initial dust spatial distribution: assuming a smooth, uniform distribution within the ejecta, Bocchio et al. (2016) find that due to the low dust density, grain-grain collisions are expected to be rare, and shattering and vapourisation lead to minor processing with respect to sputtering. Conversely, if the dust is initially located in overdense clumps within the ejecta, the increased grain number density enhances grain-grain collision probabilities, while the grains are sheltered in the clumps from the high gas velocities caused by the shock and from the high gas temperatures in the inter-clump medium, reducing the sputtering rates (Kirchschlager et al. 2019). It is important to consider that grain–grain collisions and sputtering can be synergistic processes since sputtering of the grain fragments resulting from collisions can be eroded in a more efficient way than the larger colliding grains, as shown by Kirchschlager et al. (2019). In Fig. 7, we report the fraction of surviving dust mass as a function of time obtained from their 2D hydrodynamical simulation of a shock wave interacting with a clumpy SN ejecta, where the clumps are assumed to be 100 times denser than the surrounding gas. The initial grain population in this particular case is made by carbon grains with a log-normal-like size distribution peaked at Å and with a width . The green, blue and red lines show the results obtained considering, respectively, the effects of grain–grain collisions, sputtering, and the two processes acting together. It is evident that the total dust destruction rate by sputtering and grain-grain collisions can be significantly higher than their individual contributions acting alone. Interestingly, Kirchschlager et al. (2020) have shown that – in suitable environments – heavy ions that impact the grains can penetrate deep enough to be trapped, leading to grain growth and to an increase of the dust mass. Using the same set-up adopted by Kirchschlager et al. (2019), they show that grain growth can partly counteract destructive processes, increasing the fraction of surviving dust mass by by factors of up to two to four, depending on initial grain radii.

2.3.2 Grain dynamics
The efficiency of kinetic sputtering depends also on the dynamics of the grains. When invested by the reverse shock, the grains, which are initially coupled with the gas, have a different inertia with respect to the shocked gas, and start to move with respect to the gas with a velocity proportional to the velocity of the shock. Depending on the gas conditions and grain size, dust grains are slowed by drag forces and processed by collisions with gas particles. Small grains are quickly stopped and destroyed within the ejecta, while larger grains are eroded to a lower extent. However, if they are initially placed in the innermost part of the ejecta, the grains may not have enough inertia to cross the forward shock, and may be stopped and destroyed, or they may be reached by the faster forward shock, crossing the shock front a second time.
Figure 8 exemplifies the time evolution of the position (top panel), size (middle panel), and velocity relative to the gas (bottom panel) of forsterite grains, adopting initial sizes of 102 (dotted lines), 103 (solid lines), and 104 Å (dashed lines), as predicted by Bocchio et al. (2016). In this study, they adopt the self-similar analytical approximation of the ejecta dynamics by Truelove and McKee (1999). The green and red lines refer to grains placed initially at one fourth and one half of the ejecta radius, respectively. As a reference, in the top panel the positions of forward and reverse shocks are indicated by black lines, while the position of the boundary between the ejecta and the ISM are plotted by the blue line. It is clear that 10 nm grains are quickly destroyed (on timescales of yr), while the fate of 100 nm grains depends on their initial position. The grains that are initially at one-fourth of the ejecta radius (green lines) have enough inertia to cross the forward shock, while grains that are initially at one-half of the ejecta radius (red lines) are stopped and destroyed on timescales of yr. Finally, the larger grains stream through the reverse and forward shock without suffering significant erosion, and they reach the ISM on timescales yr, gradually reducing their velocity until they get at rest with the surrounding gas ( Myr). Hence, the extent of grain destruction through sputtering depends on the initial size of the grains and on its initial position (Bocchio et al. 2016). In addition, escaping grains are further destroyed while being slowed in the ISM.
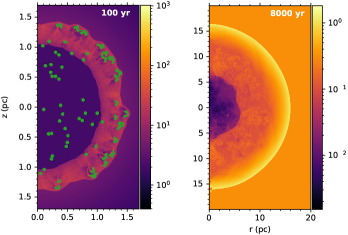
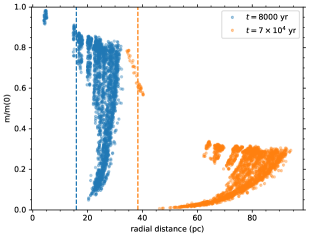
In Fig. 9 we show time evolution of silicate grains with sizes Å at , , and yr as predicted by Slavin et al. (2020). The first two panels are based on a 2D hydrodynamical simulations of the expanding SN ejecta, assuming that equal-sized grains are formed in gas clumps which have a radius of cm and a density that is 100 times larger than that of the smooth ejecta ( g cm-3) with initial radius of cm. The color bars in the first two panels show the number density of the ejecta, and the green points show the position of the silicate grains, assuming that grain particles are initially randomly scattered inside the clumps (with 40 grains per clump), and have an initial size of Å. At yr, most of the grains are still in their birth clumps, but at 8000 yr, a significant fraction of the grains have streamed out of ejecta clumps, crossing the forward shock. In the right panel, the blue points indicate the fractional mass reduction at yr for silicate grains with initial size of Å, and vertical blue dashed line shows the position of the forward shock at the same time. Nearly all the grains have crossed the forward shock, with a fractional mass reduction ranging from to . However, these grains are moving at substantial speed when they cross the forward shock (which has a speed of km/s at 8000 yr). Hence, they will suffer further sputtering as they get slowed down, finally reaching a velocity of km/s, when the sputtering is no longer effective. To follow this additional evolution, Slavin et al. (2020) used the radially averaged profiles of pressure, density and radial velocity from the final time step of the 2D simulation to initiate a 1D, spherically symmetric simulation, adopting a Sedov–Taylor type similarity solution up to yr. The effects of the subsequent evolution of the grains in the ISM are represented by the orange points in Fig. 9 and show that substantial mass loss occurs between 8000 yr and yr and that most of the initially Å silicate grains have a final mass that is 1 –30% smaller than their initial mass.
2.3.3 Effects of magnetic field
It is important to note that the above studies do not consider the impact of magnetic fields on the dynamics of charged grains. As a consequence of Lorentz force, charged grains may gyrate around magnetic field lines, and the betatron acceleration can cause kinetic decoupling between gas and dust, enhancing grain sputtering (Slavin et al. 2015). The importance of magnetic fields in SN remnants depends on the strength and orientation of the magnetic field lines. Due to flux freezing, the stellar magnetic field is expected to be extremely small in the expanding SN ejecta. In the ISM, the magnetic fields may have typical magnitudes of several G, but their importance for the trajectories of the grains depends on the morphology of the field. A uniform field could allow for reflection of the grains back into the remnant (Fry et al. 2020), while a field with a turbulent component could allow for diffusion of the grains through the ISM (Slavin et al. 2020). Given the uncertainties in the charging of the grains and in the ISM fields, the effects of magnetic fields on grain trajectories have been neglected in most studies (Bianchi and Schneider 2007; Bocchio et al. 2016; Micelotta et al. 2016; Martínez-González et al. 2019; Slavin et al. 2020). Recent work by Fry et al. (2020) show that charged Fe grains created in a unmagnetized SN can suffer large deflections when encountering the shocked ISM, in which the pre-existing turbulent magnetic fields have been amplified by shock compression. Due to magnetic trapping and mirroring, occurring at the interface between the SN ejecta and the shocked ISM, the reflected particle moves back into the SN ejecta, traversing the SNR until it encounters the ejecta/ISM interface and is reflected again, in a sort of pinball behaviour within the SNR.
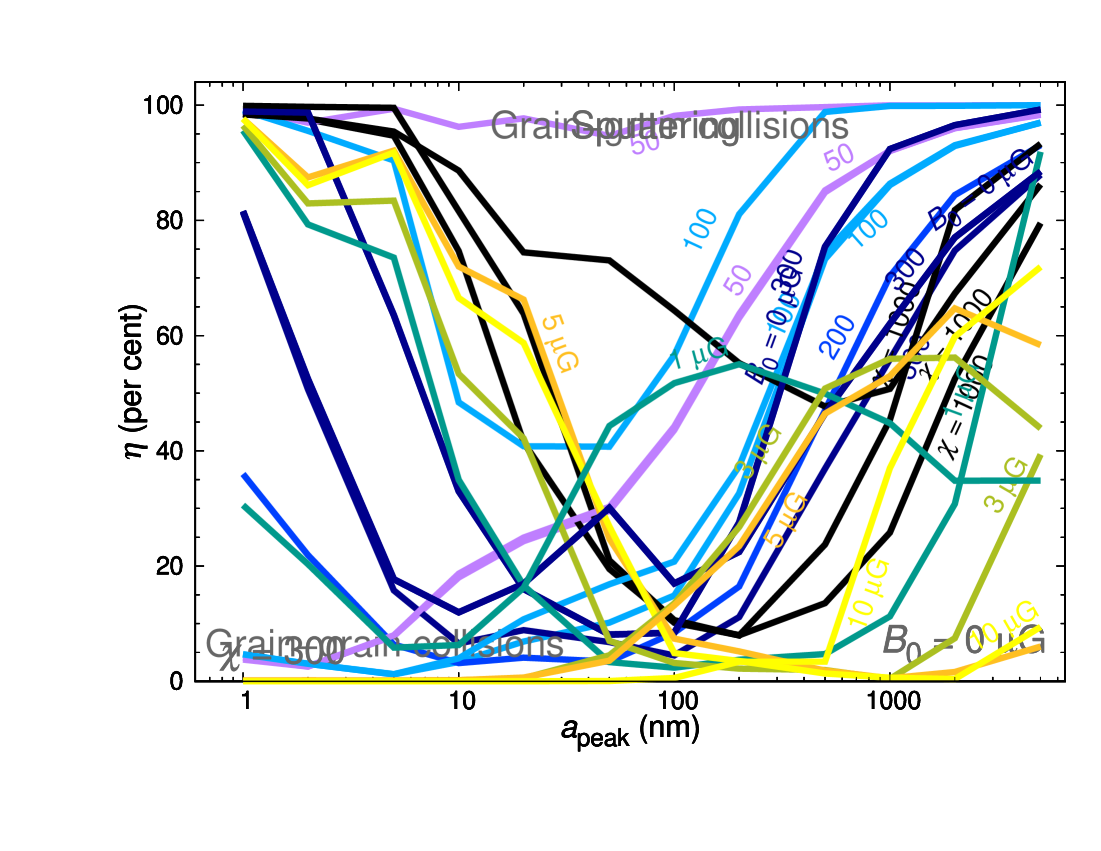
Using a magneto-hydrodynamic simulation of a plane parallel shock investing a single clump embedded in a lower density magnetized medium (cloud-crushing problem), Kirchschlager et al. (2022) find a significantly lower dust survival rate when magnetic fields are aligned perpendicular to the shock direction compared to the non-magnetic case. The grain survival fractions depend sensitively on the magnetic field strength, , on the gas density contrast between the clump and the ambient medium, , and on the grain sizes. A schematic summary of their findings is shown in Fig. 10. Three different grain size intervals can be identified: small grains, with radii nm, are mostly affected by sputtering and their survival fraction is very high for sufficiently large density contrasts and low magnetic field strengths, as the grains are effectively confined and shielded in ejecta clumps. These grains are completely destroyed when and/or G. Large grains, with radii nm are mostly affected by grain-grain collisions. Their survival fraction is almost 100 % for very low density contrast (), but decreases with increasing and , as these enhance the number density and collision velocities of the grains. Medium-sized grains, with nm experience a mixture of the effects described above: for low-density contrasts () sputtering dominates and their survival fraction increase with grain size between a few % to when , but magnetic fields reduce the surviving dust mass. For higher density contrasts, both sputtering and grain-grain collisions operate, and the survival fractions strongly decrease, with or without magnetic fields. Similar conclusions are found when carbon grains are considered. Although limited to a cloud-crushing set-up and therefore missing the global evolution of the SNR, this study shows that magnetic field strengths of a few G may be able to destroy significant amounts of grains therefore limiting the amount of dust that will be injected in the ISM (Kirchschlager et al. 2023).


2.3.4 Models comparison
Estimating the effective SN dust yield requires to integrate the effects of sputtering on individual grains onto a grain size distribution. The results, which are generally expressed as the surviving dust mass fraction, depend on a number of assumptions, such as the composition, size, and spatial distribution of newly formed SN dust, the properties of the SN explosion and of the dynamical evolution of the SN remnant, the physical processes implemented in the models, the late-time evolution of the grains when they cross the forward shock and are slowed down in the ISM. Micelotta et al. (2018) present a detailed description of the different assumptions made by different studies, warning that this prevents the possibility of making direct comparisons between different model results. While we agree with this concern, we believe that their Table 2 – which summarizes the theoretically calculated fractions of surviving dust mass – provides an important indication on the persisting uncertainties affecting the effective SN dust yields. For this reason, in Table 1 we update their original table with more recent findings and supplementary information. In particular, we provide the dust survival mass fraction (), the timescale at which is estimated, the clumpy ejecta overdensity ( for uniform ejecta models), the physical processes that have been considered (sp = sputtering, th spu = thermal sputtering, sub = sublimation, gg = grain-grain collisions, B = magnetic field), the range of grain sizes before dust destruction (in nm), the SN progenitor/explosion properties, and the ambient medium density, .
The lesson learnt from this model comparison is that there exist physical conditions for which a moderate to large fraction ( %) of SN dust is able to survive in the SNR phase, enriching the ISM. These are more easily met when clumpy ejecta, with moderate to high over-densities, produce grains with initial sizes nm, and/or explode in a very tenuous ambient medium, and when the magnetic field is very low or absent.
More specific notes on individual studies reported in Table 1 are given below:
- a:
-
grid of core-collapse SN progenitors with , , and explosion energy erg.
- b:
-
core-collapse SN progenitors with , , and explosion energy erg with mixed ejecta.
- c:
-
same as but with stratified (unmixed) ejecta.
- d:
-
Pair Instability Supernovae with progenitor masses and , initial metallicity , and explosion energy erg with mixed/unmixed ejecta.
- e:
-
calculation performed for a core-collapse SN with ejecta mass , explosion energy of erg, and assuming a uniform density core and a power-law density envelope. Graphite and silicate grains are considered, with power-law grain size distribution ( with and -2.5). Note that we quote this estimate as an upper limit as the authors themselves warn that their analytical formalism ignores further sputtering of grains in hot plasma between the forward and reverse shocks.
- f:
-
cloud-crushing set of simulations varying clump over-density, shock velocity (1000–5000 km/s), cooling timescale. The initial grain composition and size distribution is the same as the Pop III core-collapse SN progenitor of Nozawa et al. (2003), for the unmixed case, and the ejecta metallicity is . We quote the range of surviving dust mass fractions of Si and Mg2SiO4 and FeS, which are the three dominant dust species.
- g:
-
same as , but varying the ejecta metallicity from to , and exploring shock velocities up to km/s.
- h:
-
grid of Pop III core-collapse SNe with progenitor masses , initial metallicity , and explosion energy erg.
- i:
-
same as but for faint SN explosion, where little mixing and strong fallback allows for carbon-rich ejecta.
- l:
-
4 different core-collapse SN models, tailored to reproduced the observed properties of Crab, Cas A, N49, and SN 1987 A, with progenitor masses and , explosion energies erg, and metallicities and 1 . We report the survival fractions of the currently observed dust mass at the end of the simulation.
- m:
-
clumpy ejecta of a type-IIb SN with progenitor mass appropriate to describe Cas A.
- n:
-
same as the previous explosion model, but assuming a homogeneous ejecta with 2000 times larger density, appropriate to describe the ejecta of type-IIp SNe.
- o:
-
clumpy ejecta of a type-IIb SN with progenitor mass and explosion energy of erg, appropriate to describe Cas A. The initial grains (AC and MgSiO3) are assumed to follow a power-law size distribution with .
- p:
-
3D hydro-simulation of a type-IIp SN explosion with progenitor mass , explosion energy erg, an equal amount of carbonaceous and silicate grains with a log-normal size distribution with nm, width , and minimum/maximum sizes as reported in the table. In the first line we show when the explosion takes place in a uniform medium with density 1 and 1000 cm-3. In the second line, we show when the explosion takes place after the wind-driven shell has excavated a very tenuous region, with density cm-3.
- q:
-
2D hydro simulations with cloud-crushing set-up applied to Cas A, with shock velocity 1600 km/s and a range of cloud-overdensities, . The initial size distribution is assumed to be log-normal, with peak radii and width , and the dust survival rate is computed for carbon and silicate dust grains. Here we report the results for nm with and .
- r:
-
same set-up as above, but computed using 3D simulations and assuming . The initial size distribution is assumed to be log-normal in the range 0.6 nm–10 m, with peak radii m, and width , and the dust survival rate is computed for silicate dust grains.
- s:
-
clumpy ejecta of a type-IIb SN with progenitor mass and explosion energy of erg, appropriate to describe Cas A. We report the for individual grain sizes and for two adopted initial size distribution, a log-normal with peak size 100 nm and width 0.1 (LN1) and a power-law with index in the range [5–250] nm (PL1). For all these cases, lower (upper) values of refer to silicate (carbonaceous) grains.
- t:
-
same as , but including the effects of magnetic fields. Here we report adopting a fixed overdensity and varying the magnetic field strength from 0 to 10 G. The results for carbonaceous and silicate grains are very similar.
| paper | [%] | [ yr] | processes | [nm] | SN type | ||
|---|---|---|---|---|---|---|---|
| Bianchi and Schneider (2007) | 2 – 20 | [40 – 80] | 1 | sp, sub | [2 – 60] | cc SNea | 0.06, 0.6, 6 |
| Nozawa et al. (2007) | 0 – 0.4 | [300 – 2000] | 1 | sp, sub | [0.2 – 100] | Pop III cc SNeb | 0.1, 1, 10 |
| 0.004 – 0.8 | [300 – 2000] | 1 | sp, sub | [0.2 – 500] | Pop III cc SNec | 0.1, 1, 10 | |
| 0 – 0.45 | [700 – 5000] | 1 | sp, sub | [0.2 – 300] | Pop III PISNd | 0.1, 1, 10 | |
| Nath et al. (2008) | 0.8 – 1 | [1 – 4] | 1 | sp | [0.1 – 300] | cc SNe | 0.6 |
| Silvia et al. (2010) | 0.05 – 0.89 | 100, 1000 | th sp | [0.2 – 500] | cloud-crushf | – | |
| Silvia et al. (2012) | 0.02 – 1 | 1000 | th sp | [0.2 – 500] | cloud-crushg | – | |
| Marassi et al. (2015) | 3 – 50 | 1 | sp, sub | [1 – 500] | Pop III cc SNeh | 0.06, 0.6, 6 | |
| 10 – 80 | 1 | sp, sub | [30 – 220] | Pop III faint SNei | 0.06, 0.6, 6 | ||
| Bocchio et al. (2016) | 1 – 8 | 1 | sp, sub, gg | [2 – 400] | cc SNel | 0.9 – 1.9 | |
| Biscaro and Cherchneff (2016) | 6 – 11 | 200 | sp | [0.1 – 20] | SN-IIbm | – | |
| 14 – 45 | 2000 | sp | [0.1 – 50] | SN-IIpn | – | ||
| Micelotta et al. (2016) | 9 – 16 | 100 | sp | [5 – 250] | SN-IIbo | 2 | |
| Martínez-González et al. (2019) | 60, 0 | 1 | th sp | [10 – 500] | SN-IIpp | 1, 1000 | |
| 96 | 1 | th sp | [10 – 500] | SN-IIpp | |||
| Kirchschlager et al. (2019) | 0, 5, 30 | 100, 300, 1000 | sp, gg | 20 [0.02] carb | cloud-crushq | 1 | |
| 6, 2, 4 | 100, 300, 1000 | sp, gg | 100 [0.02] carb | cloud-crushq | 1 | ||
| 13, 28, | 100, 300, 1000 | sp, gg | 1000 [0.02] carb | cloud-crushq | 1 | ||
| 6, 15, 37 | 100, 300, 1000 | sp, gg | 20 [0.02] sil | cloud-crushq | 1 | ||
| 8, 3, 2 | 100, 300, 1000 | sp, gg | 100 [0.02] sil | cloud-crushq | 1 | ||
| 100, 300, 1000 | sp, gg | 1000 [0.02] sil | cloud-crushq | 1 | |||
| Kirchschlager et al. (2020) | 5 – 22 | 100 | sp, gg, ion trp | 10 – 1000 [0.1] sil | cloud-crushr | 1 | |
| Slavin et al. (2020) | 70 | 100 | sp | 40 sil, carb | SN-IIbs | 0.3 – 1.5 | |
| 70 | 100 | sp | 100 sil, carb | SN-IIbs | 0.3 – 1.5 | ||
| 70 | 100 | sp | 250 sil, carb | SN-IIbs | 0.3 – 1.5 | ||
| 70 | 100 | sp | 395 sil, carb | SN-IIbs | 0.3 – 1.5 | ||
| 70 | 100 | sp | 625 sil, carb | SN-IIbs | 0.3 – 1.5 | ||
| 70 | 100 | sp | LN1 sil, carb | SN-IIbs | 0.3 – 1.5 | ||
| 70 | 100 | sp | PL1 sil, carb | SN-IIbs | 0.3 – 1.5 | ||
| Kirchschlager et al. (2023) | 0 – 10 | 0.1 | 300 | sp, gg, B | 20 [0.02] | cloud-crusht | 1 |
| 0 – 10 | 0.1 | 300 | sp, gg, B | 100 [0.02] | cloud-crusht | 1 | |
| 0 – 70 | 0.1 | 300 | sp, gg, B | 1000 [0.02] | cloud-crusht | 1 |
2.4 Confronting models with observations of SNRs
While some simulations show that dust sputtering continues on timescales yr (Nozawa et al. 2007; Bocchio et al. 2016; Slavin et al. 2020), important constraints on model predictions are provided by observations of SN remnants.
Dust mass estimates have been derived through modelling dust thermal emission and/or the effects of dust absorption and scattering on the optical line emission profiles (see also Sect. 2.2 for the application of these observational techniques to the specific case of SN1987A). A first collection of observations, mostly obtained with the Spitzer Space Telescope, of warm dust emission in SNe and SNRs was reported by Gall et al. (2011) (see, in particular, their Tables 3 and 4). These observations showed the unambiguous presence of hot dust, with temperatures ranging from K up to K, at early epochs (post-explosion time days), with a maximum inferred dust mass of . At later epochs ( days), studies based on observations of SNRs provided a large dispersion in the inferred dust masses (from to ), with higher inferred dust masses related to cold dust.
Since then, and starting from the work of Matsuura et al. (2011); Indebetouw et al. (2014); Matsuura et al. (2015); Cigan et al. (2019) on SN1987A, FIR and sub-mm observations of several Galactic SNRs (Barlow et al. 2010; Gomez et al. 2012; Arendt et al. 2014; De Looze et al. 2017; Temim et al. 2017; Rho et al. 2018; De Looze et al. 2019; Chawner et al. 2019, 2020; Chastenet et al. 2022) using the Herschel Space Observatory and the Atacama Large Millimeter Array (ALMA) have been obtained, reporting up to of cold dust ( K) in several of these. Similarly large dust masses have been inferred by modelling the red-blue asymmetries of optical line emission profiles for a sample of (mostly) extragalactic SNRs (Bevan and Barlow 2016; Bevan et al. 2017, 2019, 2020; Wesson and Bevan 2021; Niculescu-Duvaz et al. 2022; Wesson et al. 2023). Very recently Shahbandeh et al. (2023) has obtained the first mid-IR detections with JWST of two SNR (5–18 years old), revealing masses of warm ( K) dust higher than in the older of the two systems (although they warn that this is likely a lower limit), second only to SN1987A.
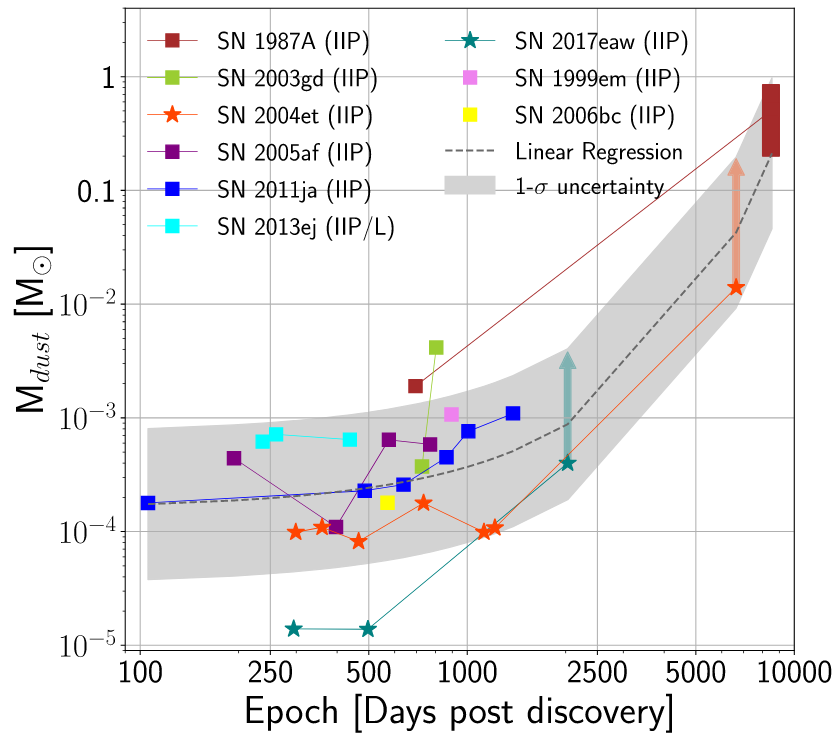
A collection of dust mass determinations as a function of the estimated post-explosion time is shown in Fig. 11, from Niculescu-Duvaz et al. (2022), based on the modelling of red-blue asymmetries of optical emission lines (left), and from Shahbandeh et al. (2023), based on mid-IR observations (right). In the left panel the red solid line represents a best fit to the observations, with the grey band representing its uncertainty. Taken at face value, these results suggest a dust mass growth with time that can be fit by a sigmoid (Wesson et al. 2015),
| (4) |
with , , and days-1, which implies a saturation around a value of at around 55 years after the explosion (see however the discussion on SN1987A in Sect. 2.2 for a different interpretation of this time sequence). Right panel, which includes recent JWST detections, show a similar increase of dust mass, although Shahbandeh et al. (2023) warn that the observed trend may actually trace a variation in optical thickness, and also warn about inhomogeneity of the data and in the way dust masses have been inferred in different studies.

One important point to keep in mind is that a considerable spread in the dust mass determination at given epochs is found when the same set of data is analysed by independent studies (see, for example, the case of SN1987A represented in Fig. 11 with blue horizontal triangles). Indeed, as already emphasized by Gall et al. (2011) and thoroughly discussed by Micelotta et al. (2018), dust mass determinations are affected by the adopted dust composition, optical constants, and grain sizes555The dust masses are , so even a relatively small variation in the adopted grain sizes can lead to a significant variation in the inferred dust mass.. For most of the SNRs considered by Niculescu-Duvaz et al. (2022), the best-fitting line profiles require either 100% silicate composition or 50% silicates and 50% amorphous carbon grains, with grain radii between 100 and 500 nm. While JWST observations promise to significantly advance our understanding of dust formation and survival in SN ejecta, currently dust composition remains largely unconstrained for most of the sources, with the exception of those for which polarized dust emission has been detected, such as Cas A (Rho et al. 2022), and the Crab pulsar wind nebula (Chastenet et al. 2022). In the latter case, the polarized signal suggests the presence of (50–100) nm grains, carbon-rich grain mass fraction that varies between 12 and 70%, and temperatures that range from to K ( to K) for carbonaceous (silicate) grains.
Table 2 attempts to summarize dust mass determinations in Cas A and Crab SNRs obtained by different studies. For Cas A, we have collected the results from Barlow et al. (2010), Arendt et al. (2014), De Looze et al. (2017), Bevan et al. (2017), Niculescu-Duvaz et al. (2021), and Priestley et al. (2022a). For the Crab, we have integrated the compilation recently presented by Chastenet et al. (2022) (see their Table 2). The table shows that the most recent studies tend to converge towards values of the dust masses in the range for the younger Cas A, and in the range for the older Crab.
| Cas A | 340 [yr] | ||
| Reference | Notes | ||
| Barlow et al. (2010) | silicates | ||
| Arendt et al. (2014) | cold | undetermined | |
| De Looze et al. (2017) | [30 - 32] | silicates | |
| 50% silicates, 50% carbonaceous grains | |||
| Bevan et al. (2017) | nm 50% silicates, 50% carbonaceous grains | ||
| Niculescu-Duvaz et al. (2021) | nm 50% silicates, 50% carbonaceous grains | ||
| nm 75% silicates, 25% carbonaceous grains | |||
| Priestley et al. (2022a) | cold | nm silicate grains | |
| cold | nm 50% silicates, 50% carbonaceous grains | ||
| Crab | 969 [yr] | ||
| Reference | Notes | ||
| Gomez et al. (2012) | [25 - 34] | silicate grains | |
| [32 - 36] | carbonaceous grains | ||
| silicate + carbonaceous grains | |||
| Temim and Dwek (2013) | nm carbonaceous grains | ||
| [23 - 55] | nm silicate grains | ||
| Owen and Barlow (2015) | - | [50-700]nm clumped carbonaceous grains | |
| - | [10-900]nm clumped silicates | ||
| + | - | [10-1000]nm silicates + carbonaceous grains | |
| De Looze et al. (2019) | 1000 nm carbonaceous grains | ||
| Nehmé et al. (2019) | |||
| Priestley et al. (2020) | - | [1-1000]nm carbonaceous grains | |
| - | [1-1000]nm silicate grains | ||
| Chastenet et al. (2022) | [100-5000]nm carbonaceous grains | ||
| [100-5000]nm silicate grains |
How do theoretical models compare with these findings? The models by Bianchi and Schneider (2007) and Nozawa et al. (2010) predict that and of dust should be currently present in Cas A, corresponding to of the initial dust mass formed in the ejecta. These values are smaller than the most recent observational estimates reported in Table 2. Due to the relatively small grain sizes, most of this dust will be destroyed before being injected in the ISM (see Table 1). Micelotta et al. (2016) predict a surviving dust mass fraction which ranges between ) to for amorphous carbon (silicate) grains. Taking a reference value of for the currently observed dust mass in Cas A (De Looze et al. 2017), with 50% silicates and 50% carbonaceous grains, these figures imply an unrealistically high dust condensation efficiency in SN ejecta, with an initial dust mass of of carbonaceous and silicate grains. These values are larger than those typically found by theoretical models (see Sect. 2.1), and require very large dust-to-gas mass ratios, given the ejecta mass determination (of which have been already been through the reverse shock) obtained by Laming and Temim (2020) by modeling the IR emission spectrum of Cas A. Biscaro and Cherchneff (2016) model grain formation in the SN ejecta and its reprocessing by the reverse shock and predict the time evolution of the total grain mass, composition and size distribution. They find that of the initial of dust formed in the ejecta, between 30% and 60% is present today in Cas A, and only 6% to 11% will survive in the SNR and be injected in the ISM. Similar to Bianchi and Schneider (2007) and Nozawa et al. (2007), their selected progenitor model for Cas A appears to produce too little dust mass, being at least a factor of smaller than the currently observationally estimated dust mass.
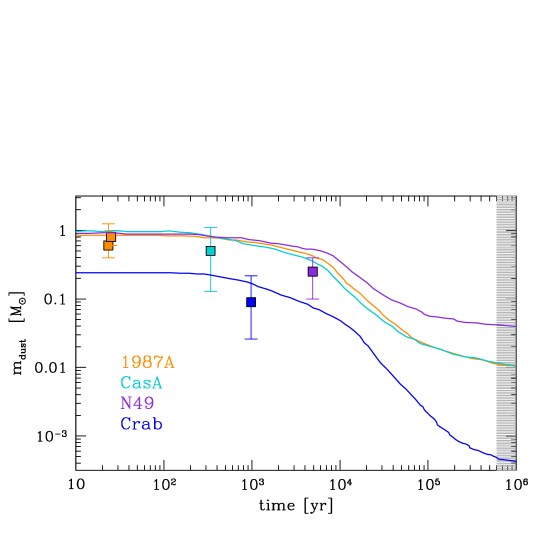
Finally, Bocchio et al. (2016) considered four different SN remnants (1987A, Cas A, Crab, N49), with ages ranging between 36 to 4800 years. They used observed/estimated physical properties of the four SNe to select the input parameters (progenitor mass, metallicity, explosion energy, and ambient gas density) of their simulations to model the time dependent dust mass in the SNRs. The results are shown in Fig. 12. According to these model predictions, a dust mass of , such as the one observed in SN 1987A, can be indicative of the efficiency of dust production in massive stars, as the ejecta have not yet been invested by the reverse shock. This conclusion does not apply to the other three SNRs where, at their currently estimated age, between 10 to 40% of the initial dust mass has already been destroyed. For Cas A and Crab, this translate into (15% carbonaceous, silicates, and magnetite) and (46% carbonaceous, silicates, and alumina) of dust grains, in reasonable agreement with the values estimated from the observations. We note that for Crab the estimated dust mass is smaller than for the other SNRs considered, as this could be the remnant of an electron-capture SN event from a lower mass progenitor of 8–10 (Smith 2013).
According to Bocchio et al. (2016), for none of the SNRs considered the reverse shock travelled to the center of the ejecta, and the simulations predict that the surviving dust mass that will be injected in the ISM (the effective dust yield), will be significantly smaller, ranging between (for Crab) to , for the other three SNRs, indicative of survival fractions of (see Table 1). It is important to stress that these conclusions depend on the dynamical modeling of the reverse shock, as a faster moving reverse shock would have affected a larger fraction of the ejecta volume by the present time, implying that smaller additional dust destruction will take place before the SN dust will be injected in the ISM. Indeed, De Looze et al. (2017) estimate that the reverse shock in Cas A has already travelled through of the ejecta volume (in agreement with the estimate by Laming and Temim 2020 reported above), and that a large fraction of dust destruction ( 70–90%) has already occurred, leading to an effective dust yield for Cas A of (De Looze et al. 2017; Priestley et al. 2022a). However, as explained above, this would imply unrealistically large dust condensation efficiencies in the ejecta, and additional work is required to better understand the origin of this tension.
3 Asymptotic giant branch stars (AGBs)
Low- and intermediate-mass (, where is the zero-age main sequence mass) stars end their lives with a phase of strong mass loss and thermal pulses (TP) on the asymptotic giant branch (AGB), and are one of the main contributors to the chemical enrichment of the interstellar medium. The mechanisms responsible for driving the winds, the status of theoretical models and of high-resolution observations have been recently reviewed by Höfner and Olofsson (2018). Here we present a summary of the most important results regarding dust formation in AGBs.
3.1 Theoretical models
The most promising scenario to explain the large mass loss rates observed in AGBs is based on a combination of atmospheric levitation by pulsation-induced shock waves and radiative acceleration of dust grains which form in the atmospheres. These models are generally referred to as Pulsation-Enhanced Dust-DRiven Outflow (PEDDRO) and their theoretical description requires full hydrodynamical computations with self-consistent dust formation and multi-wavelength radiative transfer (see Höfner and Olofsson 2018 for a recent review on AGB mass loss). Extensive grids of C-stars (Mattsson et al. 2010; Eriksson et al. 2014) and M-stars666A star is classified as a C-star when carbon is more abundant than oxygen in its atmosphere. M-stars are oxygen-rich and S-stars are an intermediate class, when C/O . (Bladh et al. 2019) have been computed using the DARWIN code (Höfner et al. 2003, 2016), which combines frequency-dependent radiative transfer with nonequilibrium dust formation in 1D. Their results provide mass loss rates and other wind properties that well compare with observational data, but still rely on a parameterized description for treating convective energy transport, which is probably not adequate to account for the strongly nonlinear, large-scale convective motions that couple to AGB stellar pulsations (Ahmad et al. 2023). Recently, Freytag and Höfner (2023) have presented the first 3D radiation-hydrodynamical simulations of dust-driven winds of AGBs, exploring the interplay of convection, pulsation, atmospheric shocks, dust formation, and wind acceleration. In these simulations, computed with the CO5BOLD code, convection and pulsations emerge self-consistently and strong deviations from spherical symmetry lead to a patchy stellar atmospheric structure. As a result, dust grains can efficiently form closer to the star than spherical averages of the temperature would indicate, in dense regions with enhanced grain growth rates. This can lead to dust-driven outflows with low mass-loss rates in situations where 1D models with the same stellar parameters do not produce winds. In contrast, for stars where the overall conditions for dust formation and wind acceleration are favorable, it is not obvious whether the resulting mass-loss rates will be higher or lower than predicted by 1D models, as the increased efficiency of dust formation in high-density clumps may be set off by a lower filling factor of these regions (Freytag and Höfner 2023). While these first exploratory 3D models are important to recover the complex 3D morphology and clumpy dust distribution observed in AGBs, they are time-consuming to run and analyse.
For this reason, AGB dust yields have been generally computed assuming a stationary, spherically symmetric wind (Ferrarotti and Gail 2006). This approximation is not fully-consistent, as it decouples the properties of the wind from dust growth that, as we have seen above, plays a major role in the wind dynamics. However, at present this simplified method is the only feasible way to couple dust formation with stellar evolution calculations.
The first pioneering works by Ferrarotti and Gail (2006); Zhukovska et al. (2008); Gail et al. (2009) were based on synthetic models to describe the properties of the central star, and allowed to compute the dust yields for the three different evolutionary phases of AGBs, when the stars appear spectroscopically as M-, S- or C-stars. In all these models, it is assumed that the grains grow on some kind of seed nuclei, such as small TiO2 clusters, but the results are shown to be independent of the adopted size and composition of these seeds. The grain growth rate is determined by the slowest reaction, which generally involve the least abundant chemical element (the key species). The evolution of grain size with time is determined by the competition between grain growth and grain destruction by thermal evaporation and/or chemical sputtering.
As a lower limit to the stellar mass spectrum, they consider because the mass loss rate in lower mass stars that reach the thermally-pulsating AGB phase (down to ) is too small to significantly contribute to dust production. They explore stellar initial masses up to and vary the initial stellar metallicity from () to ()777Here we have assumed a solar metallicity of =0.0142 (Asplund et al. 2009)..
The grain properties depend on the elemental composition of the stellar atmospheres, which change during stellar evolution. Particularly important are the third dredge-up (TDU) episodes that follow each thermal pulse and that transport the products of the He-burning shell to the stellar surface, transforming the original O-star in a C-star.
However, stars more massive than 3–4 experience hot bottom burning (HBB), i.e. proton-capture nucleosynthesis at the base of the outer envelope, that favours the conversion of C to N by the CN-cycle and the reconversion of the C-rich to an O-rich atmosphere.
Simple parametric formulae are used to describe TDU in the models by Ferrarotti and Gail (2006); Zhukovska et al. (2008); Gail et al. (2009), where TDU parameters depend on the initial stellar mass, metallicity and on the number of pulses (Karakas et al. 2002) and are fixed by comparing the model results to the observed distribution of carbon stars in the Large Magellanic Cloud (LMC).
Similarly, HBB is also accounted for in a simplified way, assuming that it occurs for all stars with masses above 4 as long as the envelope mass remains above a critical metallicity-dependent limit. When this occurs, all the C and N nuclei are immediately converted into their equilibrium abundance predicted by the CN-cycle. Hence, the models do not account for partial conversion of C into 14N for stellar masses at the lower mass limit for HBB, potentially overestimating the duration of the M-stars phase (Ferrarotti and Gail 2006).
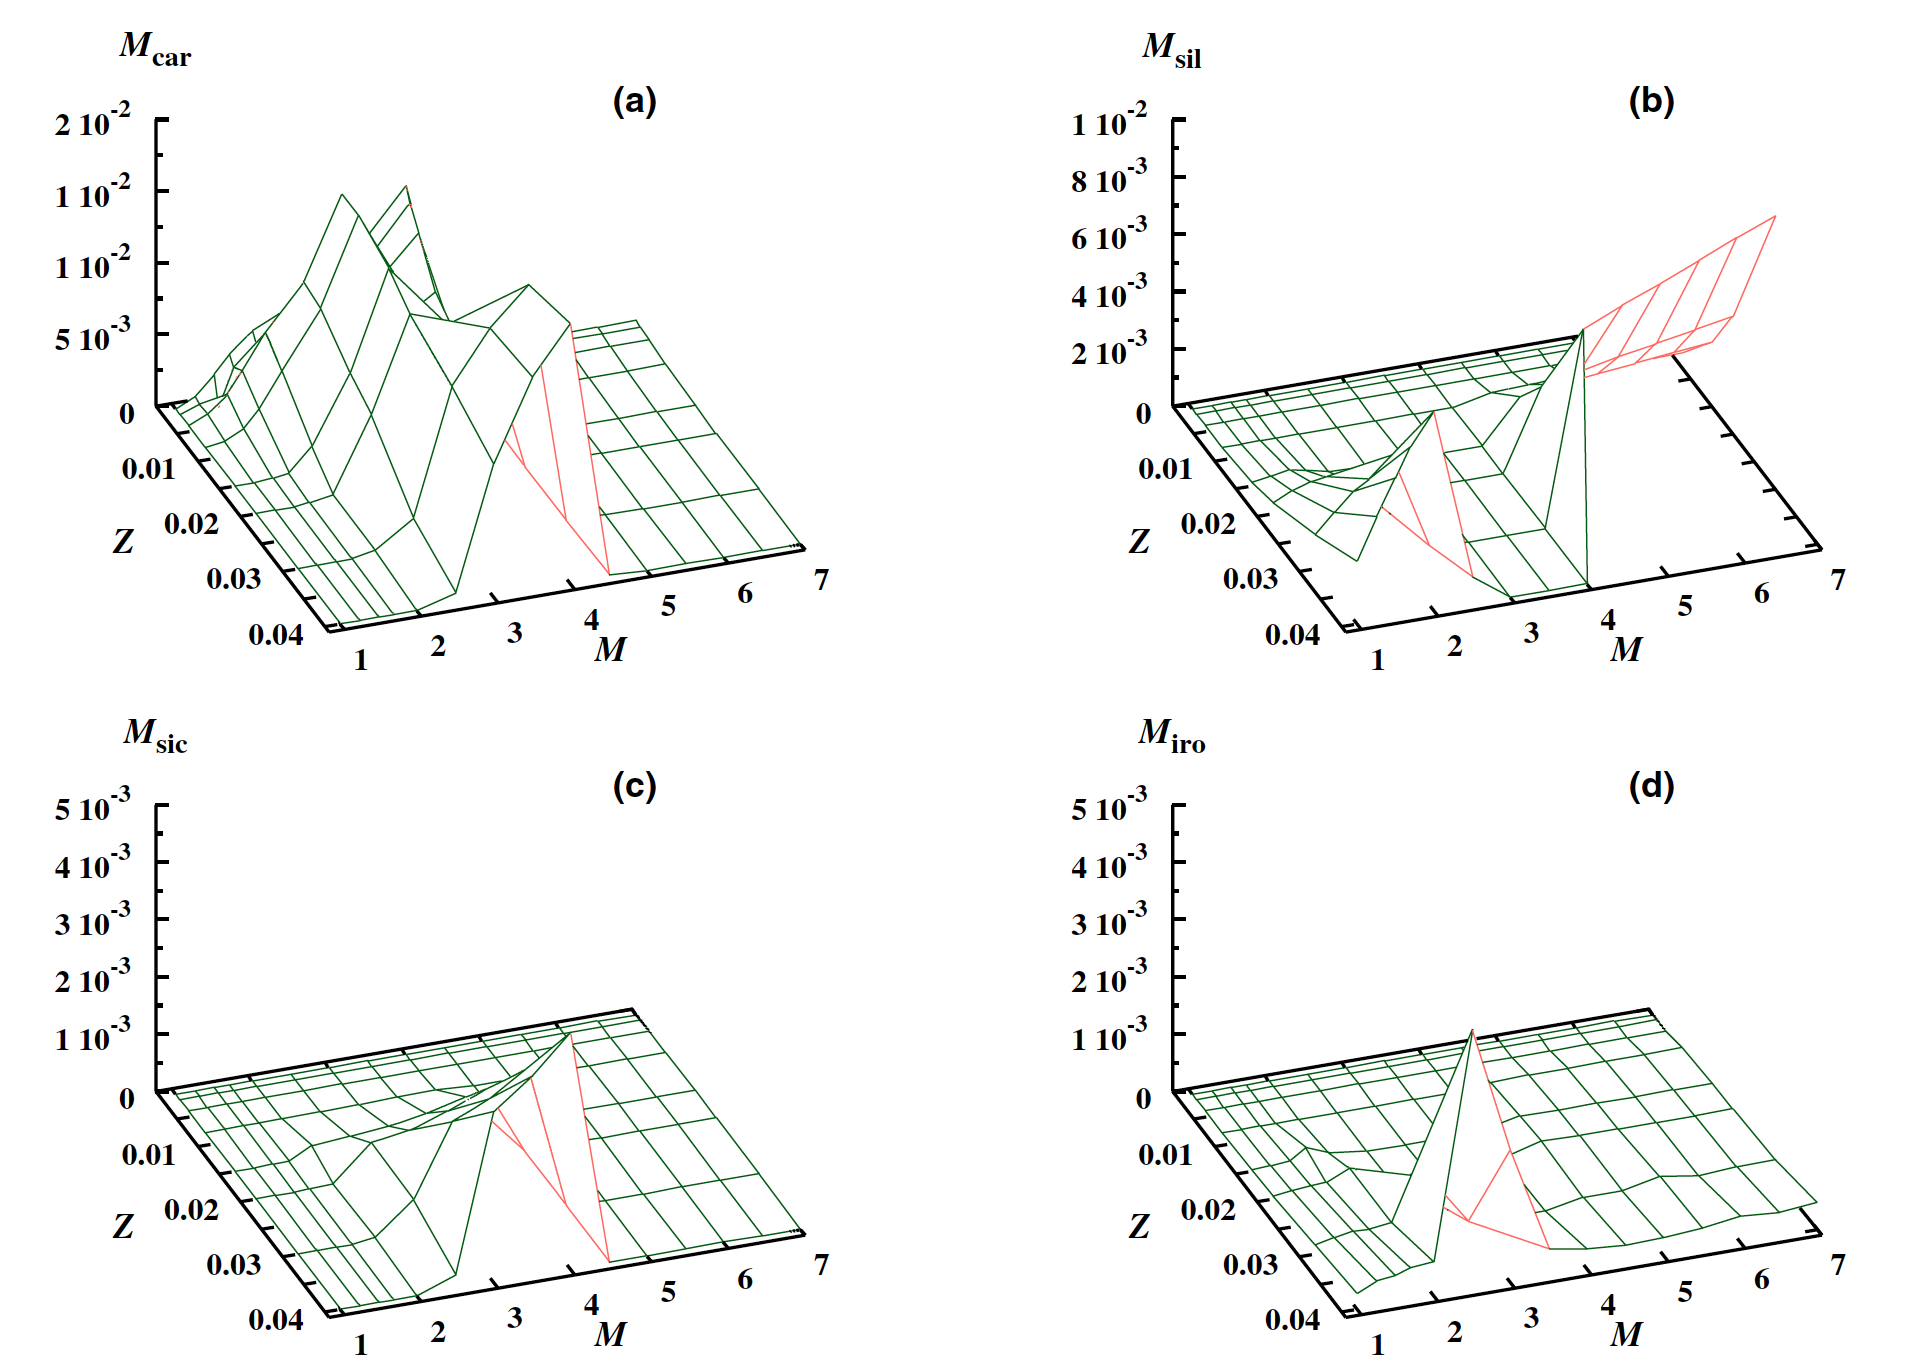
The resulting dust yields (the total dust mass released by individual AGBs) for a finer metallicity grid have been presented by Zhukovska et al. (2008); Gail et al. (2009) and are shown in Fig. 13. The four panels illustrate the predicted mass of the four main dust species: carbon dust, silicate dust (that comprises forsterite, Mg2SiO4, fayalite, Fe2SiO4, enstatite, MgSiO3, ferrosilite, FeSiO3, and quarz SiO2), iron dust, and silicon carbide888Part of the data shown in Fig. 13 can be found as online material in Ferrarotti and Gail (2006)..
The production of carbon dust is essentially limited to stars from the mass range that become C-rich during the TP-AGB phase. It is largely independent of the initial stellar metallicity, although TDU becomes more efficient with decreasing metallicity and even lower mass stars produce carbon dust (Gail et al. 2009). Silicate dust is formed only by low-mass stars, with , that enter the instability strip before they become C-stars, and by stars suffering HBB, .
Silicate dust production depends strongly on metallicity, as the refractory elements required for its formation (O, Si, Mg, Fe) are not synthesized by low and intermediate mass stars and have to be present in the material from which the stars formed. This requires a metallicity (). The production of silicon carbide and iron grains requires even higher metallicity and is less efficient than carbon or silicate dust production (Ferrarotti and Gail 2006; Zhukovska et al. 2008).
The results presented above are strongly dependent on the efficiency of TDU and HBB, which in turn depend on the modelling of convection and on the complex coupling between the outer region of the degenerate core and the inner region of the external mantle during the TP-AGB phase.
Dust formation calculations based on improved models have been accomplished independently by Nanni et al. (2013, 2014) and by Ventura et al. (2012b, a); Di Criscienzo et al. (2013); Dell’Agli et al. (2014, 2017, 2019b).
The models999The total dust yields of TP-AGB stellar evolution models as a function of the stellar mass and metallicity are available online at https://ambrananni085.wixsite.com/ambrananni/online-data-1. by Nanni et al. (2013, 2014) are based on a set of TP-AGB evolutionary tracks with initial mass and metallicity , computed with the COLIBRI code (Marigo et al. 2013). This integrates the stellar structure equations from the atmosphere down to the bottom of the hydrogen-burning shell, using the characteristic quantities at the first thermal pulse obtained from the PARSEC database of stellar models (Bressan et al. 2012). Compared to purely synthetic models, this approach allows to accurately follow the changing envelope structure and the energetics and nucleosynthesis of HBB. The models uses specific prescriptions for mass loss and TDU, whose efficiencies are parametrized as a function of the current stellar mass and metallicity. The models are then calibrated against observations of AGBs in the Galaxy (Nanni et al. 2013) and in the Magellanic Clouds (Nanni et al. 2016, 2018).
Conversely, the models first presented by Ventura et al. (2012b, a) and later expanded to lower (Di Criscienzo et al. 2013; Dell’Agli et al. 2019b) and higher (Dell’Agli et al. 2017; Ventura et al. 2018) initial stellar metallicity, are based on the ATON code (Ventura et al. 1998), which integrates the evolution of the stars from their pre-main-sequence phase until the almost complete ejection of their external mantle. This allows to compute the changes in the surface chemical composition due to TDU or HBB in a self-consistent way, overcoming some of the limitations of synthetic and semi-synthetic stellar models. Mass loss is computed as function of the current stellar mass and luminosity using empirical prescriptions, with parameters calibrated against observations (Ventura et al. 2012a).
The models are very similar for what concerns the wind description and dust formation model, as both Nanni et al. (2013, 2014) and Ventura et al. (2012b, a) follow the method adopted by Ferrarotti and Gail (2006): a spherically symmetric wind and a two-steps dust formation scheme. Yet, Nanni et al. (2013) discuss two alternative cases, named low condensation temperature (LCT) and high condensation temperature (HCT) models, where different assumptions are made regarding the regimes where silicate and carbon grains are allowed to grow. Here we discuss only their more recent data (Nanni et al. 2014, 2015), where the conditions for carbon dust growth are the same as in Ferrarotti and Gail (2006) and Ventura et al. (2012b), but silicates are allowed to form when K, as if the only grain destruction process were sublimation due to heating by the stellar radiation101010In Ferrarotti and Gail (2006) dust species that can react with hydrogen molecules can be chemi-sputtered and this process inhibits dust condensation unless K.


A comparison between the AGB dust yields predicted by COLIBRI and ATON models is shown in Figs.14 and 15,where we also report the results obtained by Zhukovska et al. (2008) for the same stellar initial metallicity. Some general trends are common to all the models: carbon and SiC dust are mostly formed by lower mass AGBs while silicates are more efficiently formed by higher mass AGBs. In addition, all the models show that the formation of silicates, SiC and iron dust strongly depends on metallicity. However, in some mass and metallicity ranges, the dust mass released by individual AGBs can greatly vary between models. These variations can be mostly ascribed to differences in the efficiency of TDU and HBB and in the duration of the TP-AGB phase (Nanni et al. 2013; Ventura et al. 2014).
One peculiar feature of ATON models is the sharp transition from carbon dust to silicate dust production that occurs around (Ventura et al. 2012b). Indeed, stars with lower masses never reach the conditions for HBB (the temperature at the base of the convective envelope must become MK to activate advanced proton capture nucleosynthesis), independently of the convective model adopted. However, the efficiency of TDU for stars with masses , close to the limit for HBB, is very sensitive to the convection model adopted111111All the ATON models are based on the full spectrum of turbulence and evolve at larger luminosities, on more expanded configurations, in comparison with their counterparts calculated with the traditional mixing length theory. This partially limits the efficiency of TDU for masses close to the limit for HBB (Ventura et al. 2014). (Ventura et al. 2014). Fig.16 shows that this trend is maintained for all ATON models down to ). At lower metallicity, the dust production efficiency in stars with drops by more than 1 dex, because HBB prevents the formation of carbon-type dust and their mass-loss rates and metallicity are too small to form silicates. For , higher mass models produce more dust, mostly in the form of silicates, because they evolve at larger luminosities and experience larger mass loss rates (Dell’Agli et al. 2019b).
One obvious implication of the above findings is that the contribution of AGBs to dust enrichment in young ( Myr) starbursts is mostly limited to silicate dust and starts to be significant when . On longer timescales, when reach their TP-AGB phase, AGBs can contribute to carbon dust enrichment, independently of the initial stellar metallicity.
3.2 Confronting models with observations
Theoretical models of AGB winds based on the PEDDRO scenario provide information on the mass loss rate, wind velocity and dynamical structure that can be compared to observations. The agreement is generally good (see Figs. 15 and 18 in Höfner and Olofsson 2018) for both C-stars (Eriksson et al. 2014) and M-stars (Bladh et al. 2015, 2019). The comparison is limited by the number of models, that often do not cover all the ranges of possible stellar parameters, and by the difficulty in inferring the stellar parameters from the observations. With this in mind, the comparison seems to suggest a scarcity of models with low outflow rates compared to the observations, pointing to possible deviations from the adopted spherical symmetry or to clumpy gas and dust distributions in the atmospheres (Höfner and Olofsson 2018).
Regarding specifically dust in AGB envelopes (and also in post-AGB envelopes, which may provide a cleaner view of dust produced in the AGB phase), extensive observations have been performed to characterize it at millimeter, infrared and optical wavelengths (e.g. Mauron and Huggins 2006; Buemi et al. 2007; Groenewegen et al. 2011; Matsuura et al. 2013; Gottlieb et al. 2022; Velilla-Prieto et al. 2023; Montargès et al. 2023). AGB dust formation models have been used to interpret such observations in our Galaxy (Ventura et al. 2018; Tosi et al. 2023; Dell’Agli et al. 2023), in the Magellanic Clouds (Dell’Agli et al. 2014, 2015b, 2015a; Nanni et al. 2016, 2018; Matsuura et al. 2013) and in Local dwarf galaxies (Dell’Agli et al. 2016, 2018, 2019a). By running radiative transfer calculations on time-dependent grids of AGBs, these studies allow to characterize individual sources as well as to derive global information on the galaxies, such as the AGB dust production rate (DPR) at the present time. Table 3 presents a summary of these results, indicating – where possible – the sources that currently dominate dust production and the observations used in the analysis.
Table 3 shows that current DPRs strongly depend on the galaxy properties, particularly the total stellar mass and star formation history. Yet, for all the systems considered so far, the current DPR of AGBs is found to be largely dominated by carbon grains produced by C-stars. Very likely, the contribution of AGBs to silicate dust enrichment would be apparent in metal-rich young starbursts, with stellar populations younger than Myr.
It should be noted that a major limitation of the vast majority of the models is that they assume spherical symmetry. Indeed, recent high resolution millimeter and optical observations of AGBs (Fig. 17) have revealed a very clumpy and inhomogeneous structure of their dusty envelopes. Additionally, the distribution of dust is found to be decoupled from the distribution of molecular gas (Montargès et al. 2023; Velilla-Prieto et al. 2023). These observations are a clear warning about the suitability of simple, spherically symmetric models. Additionally, the same authors report that the degree of polarisation and its dependence on wavelength is different for different AGBs in their sample, suggesting that both the dust chemical composition and grain size distribution is different among different AGBs. This could be an evolutionary effect and/or indicate a dependence on the metallicity and mass of the progenitor, as expected by theoretical models.

| Name | Log | SFR | DPR | dominant species | relevant data | reference | |
| Sextan A | 6.6 | 0.07 | 0.006 | 90% m carbon | WHIRC/WIYNc, Spitzerb | Dell’Agli et al. (2019a) | |
| 10% m silicates | |||||||
| IC10 | 8.5 | 0.2 | 0.01 | m carbon | WFCAM/UKIRTa, Spitzerb | Dell’Agli et al. (2018) | |
| IC1613 | 6.7 | 0.05 | 0.08 | 80% m carbon | WFCAM/UKIRTd, Spitzerb | Dell’Agli et al. (2016) | |
| 20% m silicates | |||||||
| LMC | 9.04 | 0.6 | 0.39 | 85% m carbon | Spitzere | Dell’Agli et al. (2015b) | |
| 15% m silicates | |||||||
| LMC | 9.04 | 0.6 | 0.39 | carbon | mixed cataloguesf,g,h | Nanni et al. (2019) | |
| SMC | 8.5 | 0.2 | 0.03 | Spitzeri | Dell’Agli et al. (2015a) | ||
| SMC | 8.5 | 0.2 | 0.03 | carbon | mixed catalogueh,l | Nanni et al. (2019) |
4 Additional stellar sources of dust
4.1 Red Super Giants
Red Super Giants (RSGs) are the evolved, He-burning descendants of stars with initial masses between about 12 and 30 (Levesque et al. 2006). Stars that are less massive undergo second dredge-up and end their lives as asymptotic giant branch (AGB) stars (Eldridge et al. 2007). Mass-loss rates increase with mass and stars that are more massive suffer enough mass loss to remove their hydrogen envelopes and become Wolf–Rayet stars.
Levesque et al. (2006) modeled the optical spectra of RSGs in the Milky Way showing that many of these stars suffer extinction beyond that of their neighbouring O and B stars. They attribute this excess to dust extinction in the circum-stellar shells of these “smoky” stars, in the sense that when the surface temperature of a red supergiant falls below about 5000 K, dust begins to condense out of the stellar wind at a distance of around 5–10 (Massey et al. 2009). This dust is thought to be partially responsible for driving the stellar wind via radiation pressure, and interferometry in the IR has demonstrated that for some RSGs the dust is found very close to the star itself (3–5 ), while in other cases it is found at greater distances, suggesting that the production of substantial amounts of dust is episodic in nature, with timescales of a few decades (Danchi et al. 1994).
It might be expected that the amount of dust production would correlate with the mass loss, which in turn correlates with the luminosity because this is responsible for the stellar wind (van Loon et al. 2005). Massey et al. (2005) show that the RSG dust production rate (indicated by the 12 m excess) is well correlated with bolometric luminosity:
| (5) |
for , which roughly corresponds to masses and where the dust production rate is measured in /yr. In Levesque et al. (2005) they used the evolutionary tracks of Meynet and Maeder (2003) to estimate that the masses of RSGs scale with luminosity as , so they expect:
| (6) |
for RSGs with masses . From the evolutionary models of Meynet and Maeder (2003), they find that the RSG phase lasts 2 Myr (10 ) to 0.4 Myr (25 ), and they use the models to approximate:
| (7) |
From the two above relations, one finds a scaling between the dust mass released by a RSG and its stellar mass:
| (8) |
so that RSGs with masses release a dust mass in the range during their evolution. These figures are comparable to the expected dust masses released by core-collapse SNe when accounting for reverse shock destruction.
It is noteworthy that extra intrinsic extinction close to the red supergiant progenitors would give reduced luminosities and lower predicted masses, since mass estimates are based on mass-luminosity relations. Walmswell and Eldridge (2012) show that even using a crude spherically symmetric model, with no metallicity variation, dust extinction and corrected mass determinations at the high-mass end provide a solution to the so-called RSG problem, i.e. the apparent lack of RSG progenitors with masses in the pre-explosion images of Type IIP SN (Smartt 2009, 2015). Indeed, evidence for circumstellar extinction around SN2017eaw progenitor star supports the conclusion that progenitor mass estimates can be low if circumstellar extinction is not properly accounted for (Kilpatrick and Foley 2018). By modeling the optical-to-mid IR SED in the 5 months before the explosion, Kilpatrick and Foley (2018) show that the dust shell around SN2017eaw was compact, with a radius of approximately 4000 (five times the photospheric radius), and so it is likely that this dust was vapourized within the first few days after explosion. Hence, the question of whether such dust can survive the impact of high-velocity ejecta from the subsequent supernova and thereby go on to enrich the dust content of the host galaxy is an interesting one.
4.2 Wolf–Rayet stars
Stars with initial masses greater than 30 loose their hydrogen envelope and become Wolf–Rayet (WR) stars. Their different emission spectra suggest that WR stars experience three phases of evolution: the WN phase is characterised by hydrogen burning in the core, the more evolved WC phase corresponds to helium burning in the core, have no hydrogen left in their atmosphere, are rich in helium and carbon and have a varying amount of oxygen. Those WCs with the most oxygen are classified as WO stars.
Only WCs are known to produce dust, and even those may require a hydrogen-rich OB binary companion for dust ejection (see Crowther 2003; Lau et al. 2020, 2021, 2022). Owing to the photospheric chemical composition, carbon-based dust is expected to form (Cherchneff et al. 2000). The mixing of carbon-rich material from the WC star plus hydrogen from the OB companion, together with efficient shielding from their harsh ionizing fluxes via the shocked region of their colliding winds most likely provides the necessary ingredients for dust nucleation and growth to occur (Cherchneff et al. 2000; Crowther 2003). Indeed, Lau et al. (2020) performed a dust spectral energy distribution analysis of 19 Galactic WC binaries, revealing a broad range of dust production rates, , and carbon dust condensation fractions between 0.002% and 40%, consistent with predictions from theoretical models of dust formation in colliding-wind binaries. Recent observations with JWST reveal the spatial and spectral signatures of over 17 carbon-rich nested circumstellar dust shells around the WR binary WR 140, indicating their persistence in the luminous and hard radiation field of the central binary system for at least 130 yr after the initial dust-formation event (Lau et al. 2022).
According to the evolutionary models of Meynet and Maeder (2003), WCs come from stars with masses greater than 40 ; the lifetime of the WC stage is independent of mass, with Myr. The (total) mass-loss rates of WCs are roughly independent of mass, and are about /yr (Nugis and Lamers 2000). Assuming a dust nucleation efficiency of (Dwek 1998), the dust mass released by a WC star is expected to be:
| (9) |
Similarly to RSGs, it is possible that a large fraction of this dust will be destroyed by the explosion of the SN Ib/c that ends the evolution of WR stars.
It is important to stress that for a standard stellar initial mass function, WC stars are very rare, such that they are expected to be minor contributors to interstellar dust. In addition, late-type WCs are known to be absent in low-metallicity galaxies (see Massey 2003 and references therein), although Lau et al. (2021) show that efficient dust-formation is feasible even at metallicities , provided that the systems host an O-type companion with a high mass-loss rate (). In more extreme environments (such as very metal-poor starbursts, or for most galaxies at early times), RSGs could play a more prominent role compared to WR stars.
4.3 Classical Novae
Classical Novae (CNae) are transient events driven by runaway thermonuclear reactions on the surfaces of accreting white dwarfs (WDs) in interacting binary systems (see Starrfield et al. 2016 for a recent review). Observations of the outburst show that a CN eject metal-enriched gas, and when the expanding gas has cooled to temperatures of 1500 K (50 to 200 days after the eruption), a dust condensation phase starts, characterized by declining visual light and rising IR emission (Gehrz 1988).
Infrared observations have confirmed the formation of carbon, SiC and oxygen-rich silicate grains (Starrfield et al. 2016 and references therein). The IR emission continues to rise as the grains grow to a maximum radius of 0.2–0.55 m within a few hundred days after their condensation, and then falls as the mature grains are dispersed by the outflow into the ISM (Gehrz et al. 1998). The rate of decline of the IR radiation suggests that the grains begin to decrease in radius shortly after having grown to their maximum size, consistent with the hypothesis that they could be processed by evaporation or sputtering before eventually reaching the ISM. About of dust forms in each episode (see Table 5 in Gehrz et al. 1998).
The above results have been recently corroborated by Derdzinski et al. (2017), who suggested that dust formation could occur in the cool dense shells behind shocks caused by the interaction of the nova outflow with lower velocity mass ejected earlier in the outburst. By applying classical nucleation theory and a thermodynamic evolution model for the post-shock gas, they find that silicates and carbon grains can form and grow to sizes m, and total dust masses of , consistent with the observed ones.
Given these figures, CNe are unlikely to be a major contributor to interstellar grains, although their rate is observed to be per year (possibly 50 per year) in the Galaxy (Starrfield et al. 2016).
4.4 Type Ia supernovae
Despite extensive searches, no evidence for dust condensation in type Ia SNe (SNIa) has been found to date. Spitzer and Herschel observations of type Ia SN remnants, including Kepler and Tycho (Blair et al. 2007; Gomez et al. 2012; Williams et al. 2013), have provided no evidence for any dust associated with the ejecta, showing that all the IR emission from these remnants come from pre-existing circumstellar dust heated by the explosion blast wave. Explanations for the lack of newly formed dust in type Ia SNe have been proposed, based on unfavourable physical conditions in the ejecta and/or on the destructive effect caused by the reverse shock (Nozawa et al. 2011). Indeed, compared to core-collapse SNe, type Ia are characterized by a larger expansion velocity of the ejecta (up to km/s, one order of magnitude larger than for Type IIp SNe) that translates into lower gas density and less efficient grain condensation and growth. As a result, even if they form, grains have radii that never exceed 0.01 m (Nozawa et al. 2011). A larger abundance of 56Ni (0.6 ) compared to core-collapse SNe (about 0.06 ) implies a larger flux of energetic electrons and gamma photons produced during the radioactive decay, that can prevent the formation of grain molecular precursors.
Despite these unfavourable conditions, theoretical models predict that, depending on the efficiency of molecule formation and on the adopted sticking probability, a mass of dust ranging between to 0.2 is able to form. While present observational limits on type Ia SNe allow for the presence of of silicate grains in the ejecta, carbon grain formation must be significantly smaller than predicted by some of the models, pointing to a larger suppression of C grain condensation by energetic electrons and photons and/or that the outermost C-O layers are almost fully burnt (Nozawa et al. 2011).
Finally, the effects of the reverse shock are expected to be more destructive for SNIa than for type IIP SNe (see Sect. 2.3). Due to the lack of a hydrogen envelope, the reverse shock can sweep up the dust formation region much earlier ( yr) than in envelope-retaining SNe ( yr). At such early times, the gas density in the shocked ejecta is high enough that dust grains are efficiently decelerated and eroded due to frequent collisions with the gaseous ions. In addition, the radii of newly formed grains are small (0.01 m), they are quickly destroyed by thermal sputtering without being injected into the ISM. As a result, if the circumstellar medium density is larger than 0.1 cm-3, as suggested by the observed sizes of type Ia SN remnants (Borkowski et al. 2006; Badenes et al. 2007) the dust mass decreases to in less than 1 Myr.
It is important to mention that the lack of dust formation in type Ia SN ejecta has important implications for the origin of iron grains, as it implies that more than 65% of iron is injected in the ISM in gaseous form (Dwek 2016). Yet, ultraviolet and X-ray observations along many lines of sight in the ISM show that iron is strongly depleted in the gas phase and that about 90% of the total iron mass must be locked up in interstellar dust. These two evidences suggest that most of the missing iron must have formed outside the traditional stellar condensation sources, likely through accretion of ISM gas onto pre-existing silicate, carbon, or composite grains (Dwek 2016).
5 Relative importance of SNe and AGBs as dust polluters
If we restrict the analysis to the two main classes of stellar dust sources, SNe and AGBs, estimating their relative importance in producing interstellar dust depends on a number of factors: the adopted mass- and metallicity-dependent dust yields, , the stellar initial mass function (IMF), , and the star formation history, . Following Valiante et al. (2009), we can express the total mass of dust released in the ISM by stars as:
| (10) |
where is the mass of a star with lifetime which formed at time , and the metallicity is computed at the stellar formation time, . Adopting the SN dust yields from Bianchi and Schneider (2007), with of the newly formed dust surviving the passage of the reverse shock, and the AGB dust yields from Ferrarotti and Gail (2006), Valiante et al. (2009) compute assuming a Larson IMF,
| (11) |
with and varying the characteristic mass from (equivalent to a Salpeter-like or Kroupa-like IMF), to (equilavent to a top-heavy IMF). They also explored the effect of changing the star formation history from a single burst to a constant star formation rate, and adopted different (constant) stellar metallicities ( and ). Using the mass- and metallicity-dependent stellar lifetimes from Raiteri et al. (1996), they find that – at early times – dust production is dominated by SNe as a consequence of the shorter lifetimes of their progenitor stars. AGB stars start to produce dust after about 30 Myr (i.e. when a star evolves off the main sequence to the AGB phase). When , the characteristic timescale at which AGBs dominate dust production ranges between 150 and 500 Myr, depending both on the assumed star formation history and on the initial stellar metallicity. This conclusion is significantly affected by variations of the IMF: for a , dust from AGB starts to dominate only on time-scales larger than 1 Gyr, and SNe are found to dominate dust evolution when . Thus, variations of the stellar IMF over cosmic history due to the smaller gas metallicity (see e.g. Omukai et al. 2005; Schneider et al. 2012; Chon et al. 2021) and/or to the larger cosmic microwave background temperature (see e.g. Schneider and Omukai 2010; Chon et al. 2022) might significantly affect the origin and properties of dust in the high-redshift Universe. Here we revisit their analysis by exploring different combinations of SN dust survival fractions and AGB dust yields.
5.1 Dependence on the adopted dust yields and stellar metallicity
We first explore in Fig. 18 the relative importance of SNe and AGBs when the stars are formed according to a Salpeter IMF in the mass range . We consider two extreme star formation histories: in the left panels, the stars are formed in a single burst at , i.e. a single stellar population (SSP) model, and the time-dependent dust mass released in the ISM, , is normalised to the total stellar mass formed in the burst, . In the right panels, the stars are continuously formed with a constant SFR, and is normalised to the constant value of SFR. As a result, in order to compare the two models, we need to assume a specific value of and time, , and multiply the SSP model by , and the constant SF model by .
The different colours represent different sets of SN and AGB dust yields, with the shaded regions reflecting variations in the adopted initial metallicity in the range . In general, the dust mass released by a star is expected to depend on the initial stellar metallicity. However, the extent of this dependence varies among models. For SN dust yields, the Bianchi and Schneider (2007) models predict a moderate dependence, with solar metallicity stars producing, on average, more dust than stars with initial metallicity of (see the orange shaded region). The metallicity dependence is found to be more significant in the SN dust yields computed by Marassi et al. (2019), partly also as a consequence of the different grid of SN models adopted. Due to the reduced amount of mass lost in stellar winds, stars with initial metallicity experience a strong fallback or fail to explode; as a result, their dust (and metal) production is negligble, compared to more metal-rich stars of comparable mass (see Marassi et al. 2019 for more details). Similar considerations apply to AGB dust yields: the metallicity dependence of dust yields depends on the adopted model (see also Sect. 3.1). For ATON yields, stars – which experience HBB and do not produce carbon dust – produce a dust mass that decreases by almost 2 dex when their initial metallicity decreases from solar to (see Fig. 16). The metallicity dependence of stellar dust yields is also reflected in the dust composition, as it will be discussed in Sect. 5.3.
The top and bottom panels show, respectively, the results of SN dust production with no/with the effects of the reverse shock destruction, assuming a circumstellar medium density of (see Table 1). In the first 3–5 Myr of evolution, no dust is released in the ISM, until the most massive SN progenitors explode; SNe dominate dust production for the first 35–50 Myr of the evolution, until the most massive AGBs () start to contribute (see the first vertical dotted line at Myr). On longer timescales, the relative importance of AGBs and SNe depend on a number of factors: the degree of dust destruction by the reverse shock, the adopted set of yields, and the initial metallicity of the stars. Assuming no reverse shock destruction, the fractional contribution of AGBs is always less than 10%, while it grows to 30–40% ( %) at Myr (corresponding to the lifetime of a star, see the second vertical dotted line in Fig. 18), and to 40–70% (%) at Gyr for a SSP model (continuous SFR model) when SN dust destruction by the reverse shock is taken into account. The range of fractional contribution reflect the variation of the dust yields with initial stellar metallicity, and we have taken the maximum spread among the different dust yields shown in Fig. 18 (ATON models and M19 SN dust yields). The solid black lines in the two panels indicate the empirical SN dust yield inferred by Galliano et al. (2021) from a detailed analysis of a sample of local galaxies (see Sect. 8 for more details). This empirical value provides an estimate of the effective SN dust yield, and appears to be consistent with the theoretical predictions, when the effect of the reverse shock is accounted for.


.
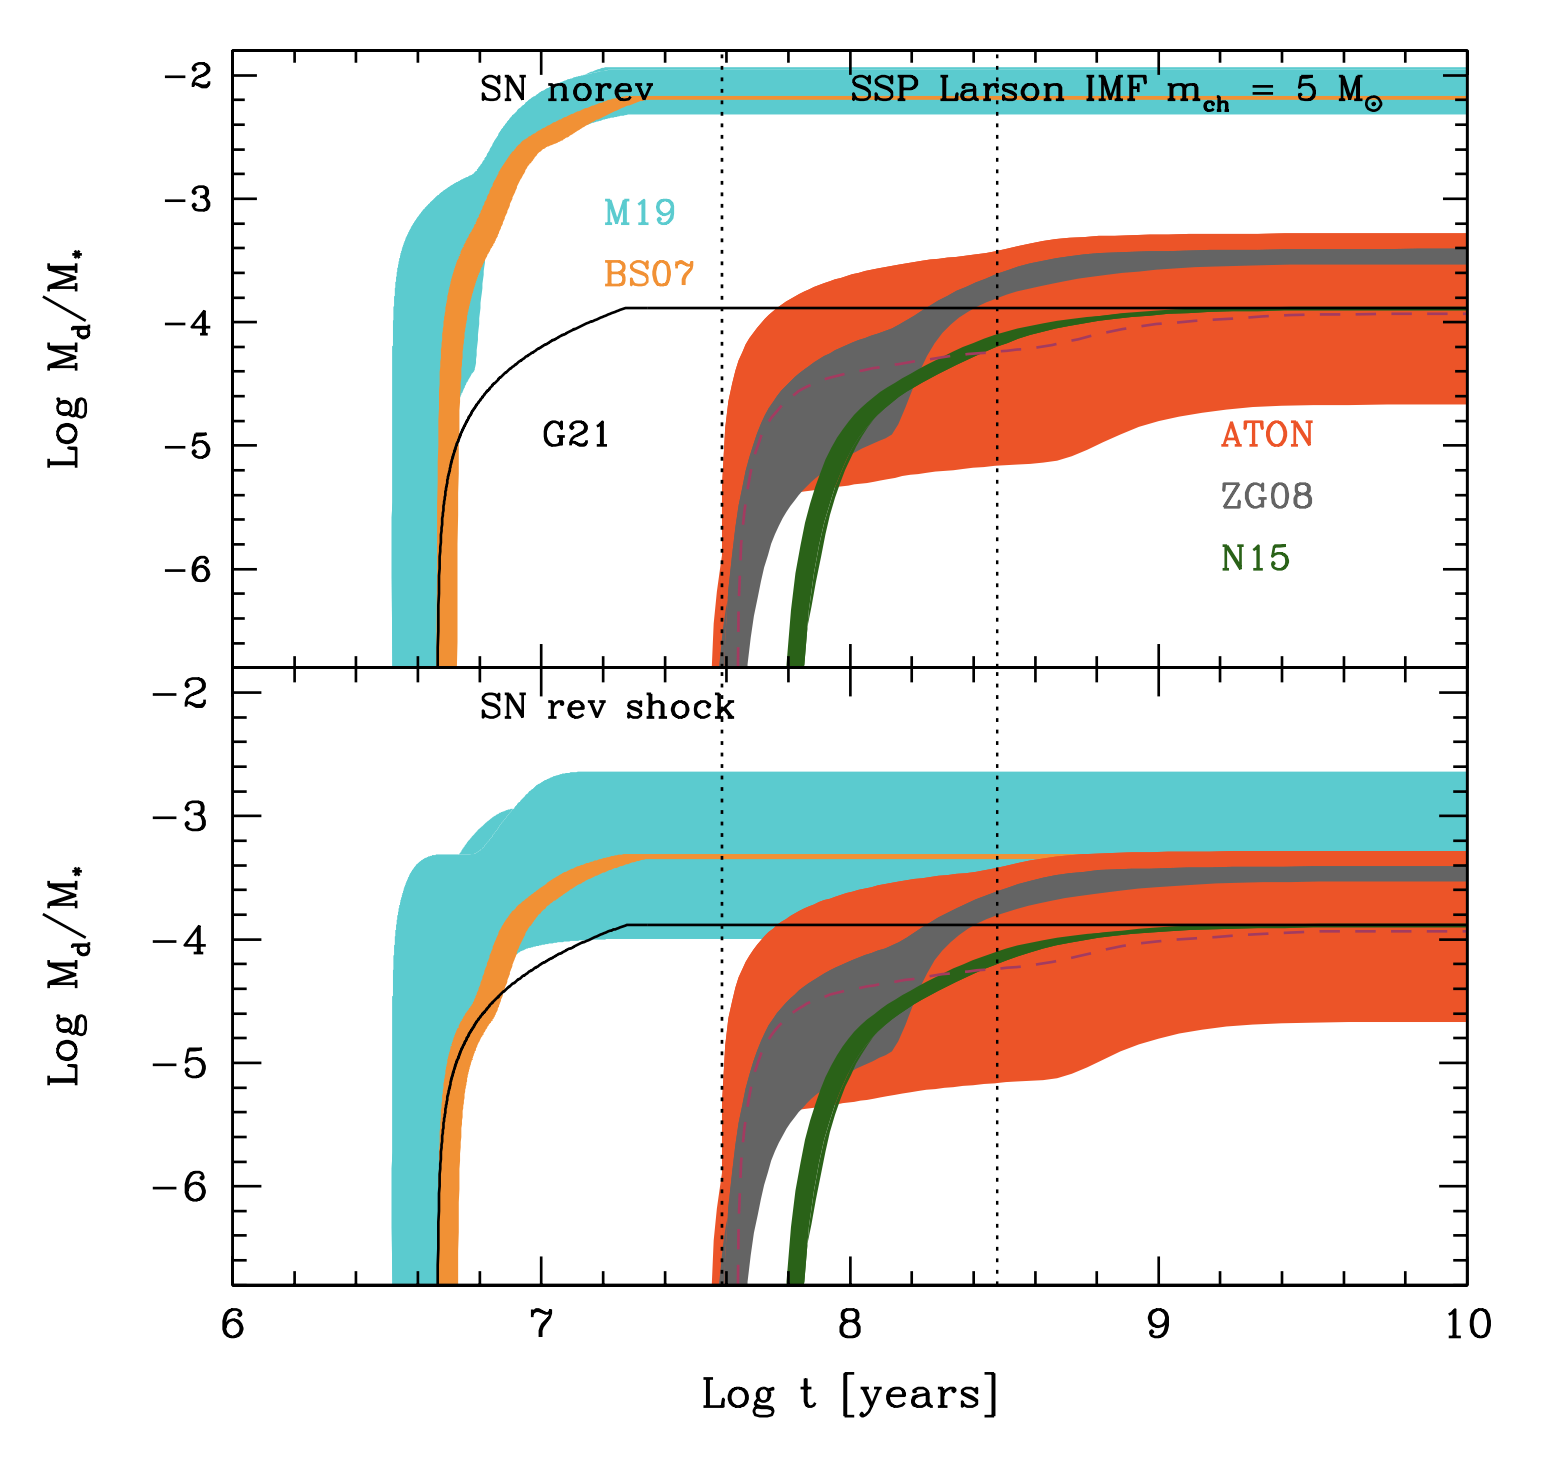

5.2 Dependence on the stellar IMF
In Fig. 19, we further explore how the relative importance of SNe and AGBs depend on the adopted stellar IMF. Following Valiante et al. (2009), we consider a Larson IMF (see Eq. (11)) in the mass range and we vary the characteristic stellar mass, assuming (left panels), and (right panels), adopting a SSP model; hence, the results can be compared with the left panels of Fig. 18 which are indicative of a Larson IMF with . Compared to this reference case, increasing the characteristic mass of the IMF leads to an increase of the SN dust yield by a factor 4–6; compared to the reference Salpeter IMF model, the AGB dust yields increase by a factor when , and decrease by a factor when . The fractional contribution of AGB dust yields is always , adopting the maximum spread among the different dust yields (ATON models and M19 SN dust yields).

5.3 Effects on dust composition
The relative importance of SNe and AGBs for silicate (left panels) and carbon (right panels) dust production is shown in Fig. 20, for a SSP model where all stars are formed according to a Salpeter IMF in the mass range . Similarly to Figs. 18 and 19, top and bottom panels show SN dust production with no/with the effect of the reverse shock, with coloured shaded regions representing different sets of SN and AGB dust yields, adopting an initial metallicity of progenitor stars in the range . The figure shows that silicate dust enrichment is very sensitive to the initial metallicity of the stars, as illustrated by the large extent of the shaded regions, both for SNe (particularly, when the effect of the reverse shock is considered), and for AGBs (particularly when considering ATON dust yields). Also, the degree of silicate dust destruction by the reverse shock strongly depends on the adopted SN dust yields: the surviving silicate dust mass fraction is only for the SN dust yields by Bianchi and Schneider (2007), for the non rotating SN models by Marassi et al. (2019), and for the least massive rotating SN models with by Marassi et al. (2019). Conversely, carbon dust production is less sensitive to the initial metallicity of the star, but depends on the adopted dust yields: as anticipated in Sect. 3.1, ATON models predict a sharp transition from silicate dust production (for initial stellar masses ) to carbon dust production (for initial stellar masses ), which can start only on timescales longer than Myr. Hence, we expect SNe to dominate carbon dust production in young galaxies, where most of the stars have ages Myr. The recent detection with JWST of the 2175 Å absorption feature, which is attributed to carbonaceous dust grains (specifically polycyclic aromatic hydrocarbons, PAHs, or nano-sized graphitic grains), in the spectrum of a galaxy at by Witstok et al. (2023), is a strong indication of rapid carbon dust production, likely by Wolf–Rayet (WR) stars or by SNe.
5.4 Relevance of stellar sources of dust at
A summary of the typical dust enrichment timescales for some of the dust production mechanisms discussed in the previous sections is shown in Fig. 1. To provide an indication of their relative importance – given the time constraints at – we also represent with vertical dotted lines some reference values of the Hubble time at (adopting a standard CDM cosmology with , , and ). These are compared with the dust enrichment timescales of stars that are formed in a single burst at () according to a Salpeter IMF with masses in the range . On the vertical axis we show the time-dependent cosmic dust yield, i.e. the dust mass released in the ISM (computed from Eq. (10)) normalized to the total stellar mass formed (similar to the left panels in Figs. 18 and 20). The dark (light) blue shaded regions illustrate the contribution of core-collapse SNe, adopting the yields for non rotating stellar progenitors with initial mass in the range from Marassi et al. (2019, see the cyan squares in Fig. 3) spanning an initial progenitor metallicity in the range (). For the same yields and the same metallicity ranges, the cyan shaded regions illustrate the effects of the partial dust destruction due to the reverse shock (indicated as SN rev. sh. in the legend), adopting a constant circumstellar medium density of (see Sect. 2.3 and Table 1). The figure shows that SNe provide a prompt enrichment channel, which is capable of enriching the ISM of galaxies already at . The degree of dust enrichment can be as big as or as small as , depending mostly on the effects of the reverse shock and on the initial metallicity of the stars. SNe provide the dominant contribution to early dust enrichment in the first few tens of Myr, compared to WRs and RSGs (shown as the green dashed and red solid lines in Fig. 1). These two contributions have been computed adopting the corresponding yields presented in Sects. 4.1–4.2. In particular, we assume that stars with initial masses become WRs and contribute to dust enrichment as described by Eq. (9), while stars with initial mass in the range 10–25 become RSGs and contribute to dust enrichment as described by Eq. (8). Finally, the dark (light) yellow shaded regions illustrate the contribution of AGBs with initial progenitor metallicity in the range (). Here we have adopted the yields from the ATON model for stars with initial mass in the range from Ventura et al. (2012b, 2018); Dell’Agli et al. (2019b). It is clear that the most massive AGBs start to contribute already after 35 Myr since the onset of star formation, but their dust yield is very sensitive to the initial metallicity of the stars: at (300 Myr since the onset of star formation at ) the AGBs contribution can be as large as for stars with initial metallicity in the range , but can drop down to for stars with initial metallicity .
Hence, at early cosmic times the contribution of AGBs can not be neglected, particularly if the stars have metallicities . However SNe appear to dominate early dust production, in most of the cases, unless the effect of the reverse shock is very significant. This is even more so if at early cosmic times the stellar IMF deviates from the Salpeter law, becoming progressively more top-heavy (biased towards larger stellar masses), as suggested by semi-analytical models (Omukai et al. 2005; Schneider and Omukai 2010), high-resolution hydrodynamical simulations (Chon et al. 2021, 2022), or empirical models (Jermyn et al. 2018; Steinhardt et al. 2022).
6 Alternative models: smoking quasar
So far we have discussed stellar sources of dust, which are generally considered the primary factories of dust. However, Elvis et al. (2002) first pointed out that gas in the circumnuclear region of accreting supermassive black holes, aka Active Galactic Nuclei (AGN), can also have the physical conditions adequate for the formation of dust. Indeed, at least those AGN accreting at substantial rate relative to the Eddington limit (), are surrounded by very dense (, i.e. approaching the densities of stellar atmospheres), ionized clouds, which emit a large number of recombination and collisionally excited nebular lines. These clouds are located within the central parsec and are characterised by large velocities (a few percent of the speed of light), causing their nebular emission lines to be highly Doppler-broadened, which has resulted in this region being dubbed “Broad Line Region” (BLR). The temperature of the gas in this region ( K) is too high for the formation of dust. However, there are various indications that at least a fraction of the BLR clouds are in outflow (e.g. Elvis 2000; Elitzur et al. 2014; Kollatschny and Zetzl 2013; Matthews et al. 2020). Elvis et al. (2002) pointed out that – during their outward trajectory, at a few pc from the BH – the clouds cool down, because of both adiabatic expansion and reduction of the radiation flux from the accretion disk, while maintaining relatively high densities. Therefore, such outflowing clouds are expected to experience a phase in which temperature and density are adequate for the nucleation of dust grains, and far enough from the AGN not to be destroyed by its intense radiation field. The outflow velocities are large enough to escape the central region, so they can enrich with dust the ISM of the host galaxy and, potentially, even its intergalactic medium (IGM). Elvis et al. (2002) estimate that the most powerful AGN (quasars), with luminosities of about , could produce dust at a rate of .

As we will discuss in the second part of this review, such large production rate can potentially be a rapid channel of dust formation rate in the early universe, and could explain some of the dust in distant galaxies, especially quasar host galaxies, which have been observed to harbour large masses of dust (e.g. Bertoldi et al. 2003; Venemans et al. 2018; Fan et al. 2023; Wang et al. 2008; Bañados et al. 2018; Wang et al. 2021). In particular, Maiolino et al. (2006) already pointed out that this channel of dust production could potentially explain most of the dust observed in some distant quasars. However, Pipino et al. (2011) integrated the quasar dust formation scenario by Elvis et al. (2002) into a more comprehensive model of dust evolution in massive galaxies, finding that dust produced in quasar winds contributes little to the global dust budget, and can play a significant role only in the central region of galaxies.
More recently, Sarangi et al. (2019) explored this scenario via a more detailed magneto-hydrodynamical modelling of quasar-driven winds. They confirmed that in a significant fraction of such winds the outflowing gas clouds reach temperatures and densities adequate for the nucleation of dust (see Fig.21). Most of the dust formed in these winds is expected not to sublimate and to experience significant growth. As a consequence, they predict a significant fraction of the quasar-driven wind (especially towards the equatorial directions) to be heavily dust-loaded, possibly having most of the metals locked into dust. They suggest that the “dusty torus” envisaged by the unified model of AGNs, and observed by interferometric IR observations (Raban et al. 2009; Burtscher et al. 2013; Tristram et al. 2014), could actually be a dynamic structure resulting from dust formation and growth in such quasar-driven winds, in agreement with previous suggestions on the nature of this nuclear structure (Elitzur and Shlosman 2006; Nenkova et al. 2008). From their model, they derive an analytical expression for the dust production rate in quasar-driven winds, given by:
| (12) |
where is the accretion rate in units of the Eddington limit, and is the black hole mass in units of . They however clarify that, because of the various assumptions, the expression above is likely an upper limit on the dust production rate. It is also important to note that their model predict that most of the dust formed in these winds is in the form of silicate dust (in agreement with observational results indicating that a large fraction of the nuclear dust is made of silicates), as a consequence of the nuclear region being oxygen rich.

We shall note that, in contrast to stellar sources of dust, this alternative scenario requires the nuclear ISM to be pre-enriched. So the actual timescales for dust production have to be convolved with the timescales for production of the refractory elements. With this caveat in mind, in Fig. 22 we attempt to quantify the expected dust mass formed by smoking quasars, using Eq.12 and different BH evolutionary scenarios. The bottom panel shows the redshift evolution of the BH mass, assuming that that BH forms from a light seed with at (light green) or from a heavy BH seed with at (dark green), and then grows continuously with (solid lines) or (dashed lines)121212The adopted BH evolutionary tracks are meant to be indicative of possible evolutionary scenarios which lead to the formation of super-massive black holes powering the observed Active Galactic Nuclei (AGNs) and quasars at . See Inayoshi et al. (2020) and Volonteri et al. (2021) for recent reviews on early BH formation and growth.. For each of these evolutionary tracks, the top panel shows the corresponding dust mass formed in the winds, normalized to the final BH mass at , showing that quasar winds can lead to dust masses up to .
While more realistic models for the cosmological evolution of nuclear BHs and their host galaxies are required to better assess the relative contribution of quasar winds and stellar sources to ISM dust enrichment (Valiante et al. 2012, 2014), we can provide an approximate estimate assuming a system with at , as suggested by observations of high-redshift quasars (Fan et al. 2023) and AGNs, including recent JWST observations (see e.g. Maiolino et al. 2023 and references therein). Adopting an indicative value of the dust-to-stellar mass contributed by stellar sources of (in the range of what predicted for a Salpeter IMF, see e.g. Fig. 18), we find that the dust mass formed in quasar wind can be comparable to the dust mass released by stellar sources if , an efficiency that is well within the upper limits derived above and shown in Fig. 22.
7 Dust reprocessing in the ISM
Once injected in the ISM, dust grains produced by stellar sources are expected to experience significant reprocessing as they travel in the different phases of the ISM.
Some grains will be removed from the ISM if they are in star forming regions and will be incorporated in newly formed stars, a process generally known as astration. Grains that are in the warm and hot ISM phase can undergo thermal and kinetic sputtering when hit by SN shocks, or can be sublimated. This leads to a modification of the size distribution of ISM grains and to a reduction of the ISM dust mass. In regions exposed to intense radiation fields, photo-destruction of small grains can occur.
Other processes can increase the ISM dust mass. In the cold neutral medium of the ISM, grain growth by accretion of gas-phase elements, a process also referred to as depletion of condensible elements from the gas, can lead to an increase in dust mass as well as to a modification of the grain size distribution.
Finally, there are other processes which do not lead to a change in the total ISM dust mass, but which alter the grain size distribution, such as grain shattering and fragmentation by grain-grain collisions in low-velocity shocks, grain coagulation, or which lead to structural modifications such as impact with high energy photons or cosmic rays.
Some of these processes depend on the structural properties of the grains (composition, size, and grain structure), and their relative importance is also tightly dependent on the nature of the environment where they reside, i.e. on the ISM properties of the host galaxy. Hence, a detailed discussion of these processes is beyond the scope of the present review, and we refer the interested readers to Draine (2009), Hirashita (2013), and Galliano et al. (2018) for more information on their theoretical descriptions and observational evidences.
Our purpose here is to provide a synthetic summary of how some of these processes have been incorporated into galaxy evolution models, and how observations of local galaxies have recently provided important clues on their relative importance. This may serve as a valuable support when interpreting the properties of high redshift galaxies.
7.1 Destruction by interstellar shocks
The expanding shock waves generated by SN explosions provide the dominant destruction process of pre-existing ISM dust grains, through thermal and kinetic sputtering, aided by shattering due to grain-grain collisions (see e.g. Jones et al. 1996). Similarly to what has been discussed in Sect. 2.3, the results of different studies depend on the physical processes implemented, on the treatment of the shocks (steady state shock or time-dependent hydro-dynamical description in 1 or 3D), on the adopted initial grain size distribution and composition. A summary of some of the existing estimates of dust survival fractions can be found in Table 2 of Micelotta et al. (2018). Here we briefly summarize a few recent results obtained by Bocchio et al. (2014); Slavin et al. (2015); Hu et al. (2019); Martínez-González et al. (2019); Kirchschlager et al. (2023).

Bocchio et al. (2014) adopted the grain model by Jones et al. (2013) to re-evaluate dust processing by steady state shocks with velocities km/s, propagating in a homogeneous ambient medium with density cm-3. The results of their study is summarized in Fig. 23, where the pre-shock (solid lines) and post-shock (histograms) grain size distributions of carbonaceous (blue) and silicate (orange) grains are compared for increasing shock velocities (from left to right). The smallest carbonaceous grains start to be destroyed already by a shock with velocity km/s, and are completely destroyed when km/s. Silicate grains are more resistant, and their size distribution is affected by grain destruction and fragmentation when km/s. The following expressions provide a good fit to their estimated carbonaceous and silicate grains destruction efficiencies as a function of the shock velocity (Bocchio et al. 2014):
where is the shock velocity in units of 100 km/s. When this implies that and .
This result can be compared with the values of and that are found by Slavin et al. (2015) by running 1D hydro-dynamical simulations of SNR evolution in order to follow dust destruction beyond the point at which the remnant becomes radiative, where the plane parallel, steady state shock approximation breaks down. This is because during the late stage remnant phase, relatively slow shocks still destroy dust. In addition, they sweep up increasing volumes of the ISM such that even with a low efficiency of grain destruction, slow shocks can be important for the overall grain destruction in the ISM (Slavin et al. 2015). However, the difference in the dust destruction efficiency, particularly of carbonaceous grains, compared to Bocchio et al. (2014), are due to the initial grain properties adopted by Slavin et al. (2015), who start from an MRN distribution ( with 5 nm nm, Mathis et al. 1977) for both silicates and carbonaceous grains, with a significantly smaller fraction of dust mass in very small carbon grains, compared to Bocchio et al. (2014). For silicate grains following the same initial size distribution, Kirchschlager et al. (2022) find that grain-grain collisions are very important and can significantly increase the dust destruction rates, compared to runs when only sputtering is considered. They evolve the SNR by running 3D hydro-dynamical simulations and find that when the blast wave expands in a homogeneous ambient medium with density (1) cm-3.
The dust destruction efficiencies can be used to evaluate the dust destruction timescale, , also known as the lifetime of dust against destruction by SN shocks (Dwek and Scalo 1980):
| (13) |
where is the rate of SN explosions, is the total mass of the ISM, and is the ISM mass that is completely cleared out of dust by a single SN explosion. This can be written as:
| (14) |
where is the mass of the ISM shocked to a velocity of at least . For a Sedov-Taylor blastwave expanding in a uniform medium, this can be expressed as (McKee 1989):
| (15) |
where is the SN explosion energy in units of erg, and (Ostriker and McKee 1988).
The results of different studies, particularly those based on hydro-dynamical simulations, are sometimes compared in terms of . These generally depend on the adopted SN explosion energy, ISM density, initial grain size distribution, as well as on the physical processes implemented in the simulations and the total integration time. Table 4 reports a compilation of recent results.
| Reference | carb | sil | Notes |
|---|---|---|---|
| Bocchio et al. (2014) | 21100 | 4220 | cm-3, |
| Slavin et al. (2015) | 1220 | 1990 | cm-3, |
| Hu et al. (2019) | 1330 (1050) | 1990 (1370) | cm-3, |
| Kirchschlager et al. (2022) | – | 6470 (7090) | cm-3, |
| dust mix | |||
| Martínez-González et al. (2019) | WDB | cm-3, | |
| Martínez-González et al. (2019) | no WDB | cm-3, |
By using 3D hydro-dynamical simulations, Hu et al. (2019) quantify the amount of ambient dust destroyed by thermal and non-thermal sputtering by a single SN explosion exploring a broad range of ambient densities. In Table 4 we only report their result for and 1 cm-3, which appear in very good agreement with Slavin et al. (2015), although both of these studies predict smaller compared to Kirchschlager et al. (2022), which also include the effect of grain-grain collisions. Note also that Kirchschlager et al. (2022) adopts a larger SN explosion energy and ambient gas density compared to Slavin et al. (2015), and follow the evolution on a longer timescale. Martínez-González et al. (2019) explore dust destruction when the SN blast wave expands in the tenuous medium excavated by a pre-existing stellar wind, terminating with a wind-driven shell. If the mass of the wind-driven shell (WDS) is the mass of the SN ejecta, the SN forward shock is unable to overrun the WDS, and the ambient ISM medium ahead of the WDS remains unaffected. This significantly decreases the dust destruction efficiencies, as shown in Table 4. It is important to note, however, that even when the explosion takes place in a homogeneous medium, their estimated for a mixture of silicate and carbon grains is significantly smaller compared to other studies, due to the shorter timescale at which is evaluated ( kyr, compared to kyr, see Kirchschlager et al. 2022).
The above studies allow to estimate dust destruction when a single SNR interacts with its homogeneous environment. However, in a multi-phase ISM, the effects of the interaction between the SNR and the ISM will be different if dust resides in cold clouds, in the warm medium, or in the hot phase (McKee 1989). In addition, the temporal and spatial correlation of SN explosions needs to be taken into account, as SNe exploding in superbubbles or above the galactic disk will not be effective at destroying dust (McKee 1989; Dwek and Scalo 1980). To account for these effects, Eq. (13) is generally modified as:
| (16) |
where is the effective SN rate, and , where the parameter accounts for the multi-phase structure of the ISM. Following McKee (1989), in a three phase ISM model the filling factor of the hot, warm and cold phases are , , , respectively. Since the density of the hot phase is too low for any dust destruction to occur, and the filling factor of cold clouds is very small, the dominant contribution comes from the warm phase, and 131313A derivation of this expression can be found in McKee (1989) and in Slavin et al. (2015). It is based on the idea that the warm gas is confined into clouds (with filling factor ) embedded in the hot intercloud medium (with filling factor ), and that the shocked cloud is at the same pressure of the shocked hot gas, so that , where () and () are the mass density and shock velocity in the cloud (hot gas). The cloud shocks can be radiative, but the blast wave in the hot gas is not. Hence, Eq. (15) in the hot phase can be written as: , and the shocked cloud mass can be written as: , which then leads to Eq.16, with .. However, if the ISM is instead dominated by the warm phase (), and the part of the shock front that propagates into the hot gas does not destroy any dust, then , with (Slavin et al. 2015). Using observations in our own galaxy, the correction factor for the SN effective rate has been estimated by McKee (1989) to be . A very similar value, , has been found by Hu et al. (2019) by investigating dust sputtering in a multi-phase ISM that resembles the solar-neighbourhood environment, where SNe are injected stochastically into the ISM.
Assuming , and , one of the two ISM models incorporated in , and from Table 4, it is possible to estimate the dust destruction timescales in the Milky Way predicted by different studies. The results are shown in Fig. 24.

With the exception of the very small dust destruction timescales predicted for carbonaceous grains by Bocchio et al. (2014), all the other studies141414We do not show the results by Martínez-González et al. (2019) here, as they predict grain destruction timescales that are longer than the age of the Universe, when applied to Milky Way conditions. predict values of in the range 100 Myr–1 Gyr.
It is important to note that both and are likely to be non-universal, i.e. to depend on the star formation history, stellar initial mass function, and ISM properties of the galaxy, which adds additional uncertainty on . In Fig. 24 we also show the empirical results found by Galliano et al. (2021) applying a Bayesian analysis to a large sample of local galaxies of the DustPedia project (Davies et al. 2017) and of the dwarf galaxy sample (DGS Madden et al. 2013). The vertical solid line represents the value of that they find assuming this to be a universal parameter (the same for all the galaxies in the sample), the horizontal dashed line is the value of Myr that they infer for the Milky Way (yellow star), and the shaded region provides the range of values of found for the galaxies in the sample, which are characterized by a broad range of metallicities, star formation rates, and stellar masses (see Galliano et al. 2021 and Sect. 8).
7.2 Destruction in the hot gas
In addition to dust destruction by SN shocks, once the grains enter a hot plasma ( K), they are sputtered away by thermal collisions with both protons and helium nuclei. This process has been investigated in the past by many authors (Draine and Salpeter 1979; Seab 1987; Tielens et al. 1994) and it has been implemented in models describing dust evolution in elliptical galaxies (Tsai and Mathews 1995; Hirashita et al. 2015), where the hot phase largely dominates the galactic ISM. Recently, thermal sputtering in galactic haloes has also been included in cosmological hydrodynamical simulations which follow dust evolution on-the-fly (Aoyama et al. 2017; McKinnon et al. 2017; Li et al. 2019; Vogelsberger et al. 2019; Graziani et al. 2020).
In general, the sputtering yield (target species ejected per incident ion/projectile) for ions of type i depends upon the kinetic energy of the impinging ion, , and on the angle of incidence between the ion and the surface, , .
The sputtering rate therefore depends upon the angle-averaged yield,
| (17) |
which is generally taken to be twice the normal incidence yield, i.e. (Draine and Salpeter 1979). The erosion rate of grain by thermal sputtering is given by:
| (18) |
where is the number density of hydrogen, is the average mass of the sputtered species, is the density of the grain material, is the mass fraction of impinging species i with velocity , and the average is over a Maxwellian distribution.
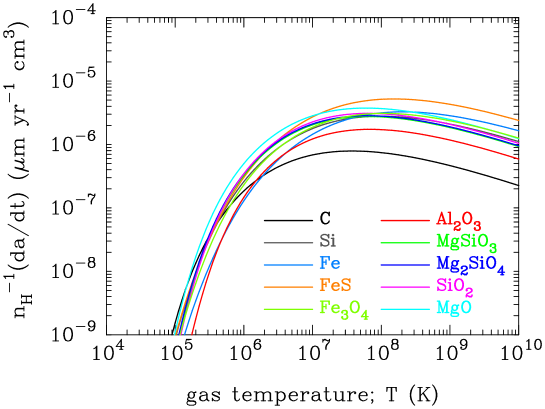
Different methods to evaluate the sputtering yields for projectile – target combinations of astrophysical interests have been adopted, based either on simulated data (using the TRIM code, see e.g. Bianchi and Ferrara 2005, or the EDDY code, see e.g. Nozawa et al. 2006), on fitting experimental data with an analytic formula (the so-called universal relation derived by Bohdansky 1984, see e.g. Tsai and Mathews 1995), or a mix of the two (Nozawa et al. 2006). The tabulated parameters to compute the sputtering yields can be found in Nozawa et al. (2006), and the corresponding erosion rate of each dust species in a gas with a metallicity of is shown in Fig. 25 as a function of the gas temperature. The temperature dependence reflects the energy dependence of the sputtering yields, and the erosion rates steeply increase from K, reach a peak in the range K, and then slowly decline. At K, C grains have the lowest erosion rate, while FeS grains have an erosion rate at K which is about 1 dex larger, and is the highest among the dust species considered. At , the erosion rate varies in the interval .
Alternatively, the analytic form proposed by Tsai and Mathews (1995) can be adopted:
| (19) |
where is the gas mass density, is the hydrogen mass, K, and . When recast in the same units, the above expression leads to a sputtering rate of at , in good agreement with the results presented in Fig. 25.
Starting from the above expressions, the sputtering timescale can be defined as:
| (20) |
where we have assumed a typical grain radius m, and a gas density in the hot phase of cm-3. Given a grain of density and mass , the variation of the dust mass due to thermal sputtering in the hot gas can be written as,
| (21) |
where the number of grains is assumed to be constant. The above equation is the way thermal sputtering in the hot gas has been generally included in semi-analytical (Popping et al. 2017) and hydrodynamical simulations (Aoyama et al. 2017; McKinnon et al. 2017; Li et al. 2019; Vogelsberger et al. 2019; Graziani et al. 2020).
7.3 Grain growth in the interstellar medium
Given the dust destruction timescales estimated above, many authors, starting from Draine and Salpeter (1979), have reached the conclusion that most of the interstellar dust is not stardust, but was formed in the ISM (see Draine 2009 and references therein). Following Draine (2011), the argument is very simple: the mean residence time of an atom in the ISM of the Milky Way can be computed as yr, where the ISM mass is , and the star formation rate is . If we assume that all the Si atoms enter the ISM as stardust grains, only a fraction of of these would still be found in dust grains. Yet, observations of gas-phase ISM abundances show that of the Si atoms are missing from the gas-phase, i.e. they are depleted onto dust grains (Jenkins 2009). Hence, most of the currently observed silicate grains must have formed in the ISM (Draine 2011).
7.3.1 Empirical evidences
There are empirical evidences of localized dust processing in the ISM of the Milky Way and Magellanic Clouds, such as variations in the grain emissivity (Köhler et al. 2015), that could be explained by coagulation and accretion of grain mantles (Ysard et al. 2015). Depletion studies provide evidence that the fraction of heavy elements that is locked up in grains correlates with the density (Jenkins 2009; Tchernyshyov et al. 2015; Jenkins and Wallerstein 2017; Roman-Duval et al. 2021). Resolved FIR observations of dust emission in nearby galaxies, combined with atomic and molecular gas maps, show that the dust-to-gas ratio, D/G, increases with density within each galaxy, with grain growth being the most likely explanation (Roman-Duval et al. 2017; Clark et al. 2023). Finally, the relation between the D/G and metallicity in local galaxies does not follow a linear trend, but shows a knee, at approximately , below which the D/G drops sharply (Rémy-Ruyer et al. 2014; Galliano et al. 2018; De Vis et al. 2019; Galliano et al. 2021, see also the discussion in Section 8). This is generally interpreted to reflect a threshold above which grain growth starts to dominate over stellar dust production (Asano et al. 2013; de Bennassuti et al. 2014; Feldmann 2015; Zhukovska et al. 2016; Schneider et al. 2016; Ginolfi et al. 2017; Galliano et al. 2021; Choban et al. 2022)151515Even before these studies, the contribution of grain growth to ISM dust enrichment was included in the models by Dwek (1998) and Hirashita (1999), and found to be important to explain the observed depletion patterns and dust-to-gas mass ratios in high metallicity galaxies., even in high redshift galaxies (Mancini et al. 2015; Popping et al. 2017; Graziani et al. 2020; Di Cesare et al. 2023), although other explanations have been proposed (De Looze et al. 2020; Priestley et al. 2022b). In particular, De Looze et al. (2020) apply a Bayesian approach similar to Galliano et al. (2021) to fit the local sample of JINGLE galaxies (Saintonge et al. 2018), finding that their present-day dust masses can be explained primarily by stellar dust, with a contribution of 20–50% from grain growth in the ISM, if dust destruction timescales are long ( Gyr), and if the survival fraction of newly formed SN dust passing through the reverse shock is high (). This conclusion differs from the results by Galliano et al. (2021) based on the DustPedia and Dwarf Galaxy Sample (DGS), which indicate that grain growth is the dominant formation mechanism at metallicity above . The difference between these two analyses is probably due to the broader extent in metallicity (particularly to low-metallicity galaxies, with ) of the sample considered by Galliano et al. (2021) (see the discussion in Galliano et al. 2021 and Sect. 8). A different conclusion has also been found in the analysis by Nanni et al. (2020), who fit individual galaxies of the DGS with a dust evolution model with the aim of reproducing the observed dust-to-stellar mass evolution as a function of time. They find that dust growth in the ISM is not necessary in order to reproduce the properties of the galaxies in their sample, and, if present, the importance of this process would be counterbalanced by galactic outflows. This shows that the assumptions in the dust evolution model and parameter degeneracies may bias the results, leading to different conclusions even when the same galaxy sample is considered.
7.3.2 The physics of grain growth
It is to be said that we do not yet understand how grain growth occurs in the ISM (see the seminal work by Barlow 1978, which already highlighted some of the difficulties in growing grains in the ISM). The collision rate between atoms or ions onto pre-existing grains depends on the physical conditions of the interstellar gas (temperature and density, which affect the thermal velocities of colliding ions and atoms, as well as the degree of turbulence, which may accelerate the grains), and on the geometric cross section of the grains, which will be dominated by the smallest grains. In addition, it will be sensitive to the charge state of the grains, with neutral and negatively charged grains having an increased collision rate with positive ions thanks to Coulomb focusing (Draine 2009). Weingartner and Draine (1999) discussed the collision rates of positively charged ions in different phases of the ISM, accounting for the charge distribution of small grains. They find that in the cold neutral medium (CNM), with cm-3 and K, the accretion timescale, , defined as,
where is the number density of the ions, can be as short as yr, sufficiently rapid to account for the observed depletion factors of elements like Si and Ti (Savage and Sembach 1996).
It is important to stress that the above quoted value was obtained under the assumption of a sticking coefficient (a maximum probability of sticking of the ion with the grain surface in each collision), and an idealized phase of the ISM, characterised by constant values of and . Zhukovska (2014) used 3D hydrodynamical simulations of giant molecular clouds in a Milky-Way like galaxy, and allow for a temperature-dependent sticking coefficient, using the observed Si depletion as a critical constraint of the model. They find that a sticking coefficient that decreases with temperature provides a better match the observed Si depletion, with (30) % of grain growth occurring in gas with (, see their Fig. 5, where the show the evolution of the grain growth rate in different bins of density). Also, enhanced collision rates due to Coulomb focusing are important to match the observed depletion – density relations for both silicate and iron dust (Zhukovska et al. 2016), reducing the accretion timescales from Myr ( Myr) to Myr ( Myr) for Si (Fe) species in the CNM (assuming typical values of cm-3 and K).

Grain growth is not only a matter of kinetics: the colliding atom or ion must also be bound to the surface of the grain in a way that it allows it to be retained against thermal desorption, UV and Cosmic Ray irradiation, which may provide enough energy to the accreted species to eject them from the grain surface and back to the gas phase. A discussion of the relevant processes and of the current uncertainties is provided by Draine (2009), Zhukovska et al. (2016), Ferrara et al. (2016), and Ceccarelli et al. (2018). It is generally assumed that grain growth occurs once the accreted atom or ion (adsorbed species) reaches an active sites of the grain surface, i.e. a site with dangling bonds and high binding energy. The diffusion of adsorbed species on the surface of the grain occurs on the so-called ”scanning timescale”,
where is the diffusion energy, is the dust temperature, is the vibrational frequency of the sticking species, and is the number of active sites for a grain with radius , with being the surface density of physisorption sites (Hasegawa et al. 1992). Hence, for a grain radius of nm, , while for small grains, with nm, . The diffusion energy is poorly known, and it is generally taken to be a fraction of the binding energy of the adsorbed species (Ferrara et al. 2016). The scanning timescale is generally compared to the thermal desorption timescale,
When , the adsorbed species can scan the entire surface of the grain before being thermally desorbed. Unfortunately, the binding energies of the atoms of interest (C, Mg, Si, Fe) to surfaces of interest (amorphous silicate or carbonaceous materials) are not known. In Zhukovska et al. (2016), Ferrara et al. (2016), and Ceccarelli et al. (2018), the binding energy for Si and Fe is taken to be K and 4200 K from Table 4 of Hasegawa and Herbst (1993), respectively. From the same Table, we find the binding energy for C to be 800 K. Adopting these values and , in Fig. 26 we show the ratio of as a function of for C and Si assuming three different grain sizes, , and 100 nm. The shaded region is where grain growth is hindered by thermal desorption. The result is very sensitive to the binding energy of the adsorbed species and C atoms can grow only on very small grains, while Si (and Fe) atoms can grow for a range of grain sizes and temperatures (see also the discussion in Zhukovska et al. 2016). It is important to keep in mind that the scanning timescale has a very steep dependence on , and becomes smaller than 1 Myr when K ( K) for for Si (C) atoms scanning grains with sizes nm. Stochastic heating of very small grains due to UV photon absorption can increase the grain temperature well above the equilibrium value, and drastically reduce the scanning timescales, even when accounting for radiative cooling (Zhukovska et al. 2016).
The above considerations lead us to conclude that very small grains, with sizes nm, are likely to play a very important role for grain growth in the cold neutral medium, as they have the largest total surface area, the highest fraction of negatively charged grains, and – aided by stochastic heating – their scanning timescales is shorter than the thermal desorption timescale. Once the grains are incorporated in dense molecular clouds, their growth is problematic as the accretion of silicon and carbon-bearing species occurs simultaneously with the formation of icy mantles (Ferrara et al. 2016; Ceccarelli et al. 2018). Icy mantles are weakly bound to the grain surface and rapidly evaporate when the grains return to the diffuse phase.
It is important to stress that despite the uncertainties that persist on the surface reactions leading to the growth of silicate and amorphous carbon grains in the ISM, the condensation of complex silicates with pyroxene composition at temperatures between 10 and 20 K by accretion of molecules and atoms on cold surfaces and subsequent reactions between them has been proven experimentally (Rouillé et al. 2014). The experiments clearly demonstrate an efficient silicate formation at low temperatures, with final fluffy aggregates consisting of small nanometer-sized primary grains. More recently, both silicate and carbonaceous materials have been experimentally proved to condense from cold precursors in the absence of radiations such as interstellar UV photons and cosmic rays, and that species from one of two groups that consist respectively of silicate precursors and carbonaceous matter precursors do not react at cryogenic temperatures with those belonging to the other group (Rouillé et al. 2020). Such a finding constitutes a clue as to the separation between silicate and carbonaceous materials in the ISM, and supports the hypothesis that dust grains can be grown in the ISM.
7.3.3 The grain growth timescale
Chemical evolution models generally adopt a very simplified description of the process, capturing the kinetics of the process. Different expressions have been proposed for the grain growth timescales. Following Asano et al. (2013), the dust mass growth rate in the ISM can be expressed as:
| (22) |
where is the number of grains, is the second moment of the grain size, is the sticking coefficient, is the gas-phase metal density, and is the mean velocity of gas-phase metals. The number of grains can be estimated as , where is the average mass of spherically symmetric grains with density , and is the 3rd moment of the grain size. We can write, , where is the gas metallicity, is the number density of the ISM phase where grain growth occurs, and is the mean molecular weight. Assuming , (for silicate grains), , a mean mass of colliding species of with , and that , the grain growth timescale can be written as:
| (23) |
where is the typical size of the grains, defined as (Hirashita and Kuo 2011), and . For the CNM, the above expression leads to a grain growth timescale of Myr assuming an average grain radius of 10 nm and solar metallicity. This is approximately consistent with the value reported by Zhukovska et al. (2016) for silicate grains in the CNM (15 Myr), although they show that the enhanced collision rate due to Coulomb focusing reduces the grain growth timescale to 1 Myr (see above). We shall note that while this simple parametrization allows to reproduce galaxy-integrated dust-to-metals (D/Z) ratios, more sophisticated chemical models that track the evolution of specific dust species are needed to reproduce the observed scaling relation between individual element depletions and D/Z with column density and local gas density (see e.g. Zhukovska 2014; Zhukovska et al. 2016; Choban et al. 2022).


A different parametrization of the grain growth timescale has been proposed by Mattsson and Andersen (2012). They start from the assumption that grain growth occurs predominantly in molecular clouds, and define the grain growth timescale as:
| (24) |
where is the dust surface density, is the molecular cloud surface density of gas-phase metals, and is the typical size of molecular clouds. Assuming that , and that , the grain growth timescale is written as:
| (25) |
where
| (26) |
is the grain growth parameter, a dimensionless factor that depends on the physical properties of the ISM environment where grain growth occurs, and it is assumed to be constant (Mattsson and Andersen 2012). Often, Eq. (25) is written in terms of the total gas mass and SFR (De Looze et al. 2020; Galliano et al. 2021),
| (27) |
and is left as a tuning parameter, to be determined by observations. By applying a Bayesian analysis of a large sample of local galaxies from the DustPedia and Dwarf Galaxy Sample (see Sect. 8), Galliano et al. (2021) find an empirical value of , and a distribution of values for that is quite scattered, ranging from Gyr, for the lowest metallicity galaxies in the sample, to Myr around solar metallicity. Yet, there are significant variations in for similar values of , suggesting that even in the simple parametrization described by Eq. (27), the grain growth timescale depends on the specific conditions prevailing in each galaxy. When compared to Eq. (23), we find that – for a solar metallicity galaxy – the two parametrizations lead to comparable results if we assume that the average radius may vary in the range nm, and that the CNM may be characterised by a broader range of gas densities, with . The significant scatter in the grain growth timescales inferred for galaxies with comparable metallicities by Galliano et al. (2021) reflect their different star formation histories and ages.
8 A nearby galaxy perspective on dust evolution processes
Recently, Galliano et al. (2021) have conducted an empirical statistical study based on the sample of nearby galaxies of the DustPedia project (Davies et al. 2017) and of the dwarf galaxy sample (DGS Madden et al. 2013), which spans a broad range of metallicities, gas fractions, specific star formation rates, and galaxy types. By adopting a hierarchical bayesian approach (Galliano et al. 2018), they infer the dust properties of each object from its spectral energy distribution, and then fit theoretical tracks to their sample to derive empirical constraints on key dust evolution processes. Following Rowlands et al. (2014) and De Vis et al. (2017), they adopt a one-zone dust evolution model where dust is produced by SN and AGBs161616Following De Vis et al. (2017), AGBs are assumed to condense 15% of their heavy elements into dust., can grow in the ISM, can be destroyed by SN shocks, and can be removed from the ISM by astration and galaxy outflows. The efficiencies of individual processes are described by simple parametrizations, that depend on three main tuning parameters: the IMF-averaged SN dust yield per SN, defined as,
that enters in the definition of the dust condensation timescale,
| (28) |
where is the SN rate and the total dust mass in the ISM. The other tuning parameters are the grain growth efficiency that enters in the definition of the grain growth timescale given by Eq.27, and mass of gas that is cleared out of dust by a single SN explosion, , that enters in the definition of the dust destruction timescale given by Eq.13. These tuning parameters are assumed to be universal, i.e. they are fitted to the whole galaxy sample assuming their values to be the same for each galaxy171717There is another set of model parameters that are fitted to each individual galaxy, and that control its particular star formation history (see Table 6 in Galliano et al. 2021).. Hence, the main assumption in this approach is that differences between galaxies are due to their particular star formation history.
Figure 27 shows the posterior distribution of the three tuning parameters assuming a Salpeter IMF. From this analysis, they infer the following values: SN, , .
From these values, it is possible to infer the posterior PDF of the dust evolution timescales for each galaxy, using Eqs. 13, 27, and 28. The results are shown in Fig.28, where the three panels show , , and (from top to bottom) for each galaxy as a function of the metallicity, expressed as the oxygen over hydrogen abundance ratio181818Following Galliano et al. (2021), we adopt here a solar metallicity value of 12 + log(O/H) = , so that .. Although there is a scatter between galaxies with similar metallicity, which results from variations in their star formation histories, some clear trends appear: the dust condensation timescale increases with metallicity, and ranges from Gyr for the most metal-poor systems to Gyr for solar metallicity galaxies, indicating that this process is too inefficient to account for the dust mass in chemically evolved galaxies. The grain growth timescale decreases with metallicity, ranging from Gyr for the most metal-poor systems to Gyr for solar metallicity galaxies, with an average value at 12 + log(O/H) 8.5 () of Myr, indicating that in this metallicity range dust formation is dominated by grain growth. Finally, the dust destruction timescale is also very scattered but appears to stay approximately constant and with a value of Gyr accross the metallicity range encompassed by the sample. These results imply that dust production is dominated by grain growth in the ISM above a metallicity of 12 + log(O/H) 8.0 ().
It is important to stress that a key aspect of this analysis is that the galaxy sample extends to very low metallicity systems, in the range . These systems appear to be very critical in constraining the main dust evolution tuning parameters, as they sample a regime where dust production is dominated by stellar sources. The steep non-linear dustiness-metallicity relation reported in the left panel of Fig. 27 supports the evidence that stardust can not be the dominant dust formation process in solar metallicity systems. This also explains the different conclusions drawn by De Looze et al. (2020) by means of a bayesian analysis of the JINGLE galaxy sample, which have a more limited metallicity coverage (only 1 source between , and none below this range). According to their analysis, the average galaxy scaling relations, including the dustiness vs metallicity, can be reproduced using closed-box galaxy evolution models (no gas infall or outflows) with a high fraction of SN dust that survives the reverse shock (37–89%), low grain growth parameters , and long dust destruction timescales, Gyr (these parameters are not assumed to be universal in their analysis). Hence, low-metallicity dwarfs appear key to disentangle the two main mechanism of dust production, effectively constraining the stellar dust yields (Galliano et al. 2021).
While the above results appear promising, the analyses conducted so far rely on relatively simplified modeling of the relevant physical processes. More realistic star formation histories, metal-dependent stellar dust yields, as described in Sects. 2.1 and 3.1, metal-dependent dust destruction efficiencies (as recently suggested by Priestley et al. 2022b) need to be explored and incorporated in dust evolution models, particularly when attempting to constrain the origin of dust by comparing galaxy samples with a broad range of physical properties.

9 Implications for dust formation scenarios in the early Universe
In the second part of this review we will discuss in detail how these various channels are relevant for the production of dust in the early Universe, and especially at , by illustrating how they have been incorporated in cosmological models and by comparing them with available observational constraints. However, here we provide an overview of the relevance and implications of these sources of dust for the enrichment in the early Universe.
Core collapse SNe are the most probable candidates for producing the bulk of, at least, dust seeds in the early Universe. Indeed, the dust yields of their ejecta is observed (and predicted) to be fairly high (more that dust masses per every stellar mass formed); in combination with the high supernova rate in the earliest phases of stellar evolution (within the first few tens Myr), this potentially implies that grains produced by SNe might dominate the dust content in galaxies in the earliest cosmic epochs. However, the main source of uncertainty is the effect of the reverse shock, which, may destroy most of the dust produced in the ejecta. Models span a wide range of predictions about the dust survival in the ejecta, from nearly total disruption to most of the grains surviving. Additionally, even for what concerns the dust formed in the ejecta, models can span a wide range of yields and dust composition, depending on progenitor mass, metallicity, and model assumptions. These predictions can be directly tested with observations of supernovae only locally, hence spanning a limited parameter space. In the early Universe the metallicities and progenitors masses were much different than probed locally, hence implying that the local obsravational constraints may not fully apply. However, observational constraints on dust properties and composition at high- (, temperature, emissivity and extinction curve) can shed light on the fraction of dust produced by SNe in the early Universe, and potentially even discriminate between different models.
Contrary to some early claims, AGBs can also be an early and effective source of dust at . Indeed, the first AGBs start producing dust as soon as 35 Myr after the onset of star formation. In the next review we will show that models can ascribe to AGBs even more than half of the dust observed in massive systems already in place at . AGBs from progenitors more massive than (leaving the Main Sequence at 300 Myr, hence more likely to contribute to dust at high redshift), have grain production yields that plummets strongly with metallicity, which may be an issue at . In this regime the bulk of the dust produced is dominated by silicates, which could potentially be tested via observations. The production of dust in AGBs from lower mass progenitors is less dramatically sensitive on metallicity, and in this range the composition of most of grains is carbonaceous in nature. However, already for progenitors with masses of the lifetime on the main sequence is half a Gigayear, implying that the timescale for dust production would start to be in tension with the age of galaxies observed at (generally no more than a few hundreds Myr) or even with the age of the Universe.
Red Super Giant stars (RSGs), which originate from massive stars, can potentially be a fast dust enrichment channel. Their dust yields can approach that of SNe after reverse shock, hence they could potentially contribute to the dust enrichment in the early Universe. However, it is very likely that the supernova explosion at the end of the RSG phase destroys most of the dust produced. Therefore, RSGs are a less plausible channel for the dust production at high-, and overall across most of the cosmic epochs.
Wolf–Rayet stars (WRs) are also a very fast factory of dust, which can therefore be potentially relevant in the earliest epochs, with yields even higher than RSGs. However, they are subject to the same issue as the latter, in the sense that the SNIb/c following the WR phase is likely to destroy most of the dust produced. Additionally, dust is observed to form only in the WC subclass of WR, and WC are not observed to form in low metallicity systems. The latter is an additional major problem, which makes WC an unlikely source of dust at , where the bulk of the galaxy population have subsolar metallicities.
Dense AGN driven winds are predicted to provide the optimal environment for dust production. Given the large population of AGN revealed by JWST at , this is a potential channel of early enrichment that should be considered seriously. It does require the ISM to be pre-enriched, but observations show that most galaxies (including those hosting AGN) have already reached metallicities , even at . According to models, quasar winds can potentially produce as much dust as the black hole mass by , hence potentially accounting for the large dust masses observed in quasar hosts at this early epochs. However, the predicted dust mass is likely an upper limit, as it would require the black hole accreting at a substantial rate (Eddington or super-Eddington) for a few hundred million years. However, the primary problem remains that this scenario would require a direct observational evidence of dust formation in quasar winds.
Finally, the dust reprocessing in the ISM is likely much more relevant in the early Universe. For instance the high SN rate, in the compact star forming regions characterizing galaxies in the first billion years, may result into an enhanced destruction rate by shocks in the ISM. The strong radiation pressure from young stars is also likely to preferentially expel dust grains from galaxies.
On the other hand, the high gas density of the ISM in early galaxies may result into very short timescales ( yr) for the growth of dust grains in the ISM at . Therefore, once dust seeds are produced through various possible channels (SNe, AGBs or AGN winds), growth in the ISM might likely provide the bulk of the dust mass. Of course, this requires the ISM to be enriched; however, as already mentioned, the ISM of galaxies is already fairly enriched by .
We will discuss more in detail these various scenarios in the second part of our review.
10 Conclusions and outlook
In this review we have attempted to summarise the findings on dust production mechanisms, which are relevant for understanding the formation of dust in the early Universe, and which will provide the backbone of the second part of the review, which will discuss the observational findings and models of dust at high redshift. We have focused on theoretical models of dust sources, but also discussing comparison with observations.
Summarising the various models of dust formation is not simple, given that, as we have seen throughout the review, there is a large variety of models and assumptions, which can result into completely different dust yield and dust properties for the same class of objects. With this caveat in mind, in the following we can provide some general summarizing consideration about the possible sources of dust.
-
Core-Collapse Supernovae
-
–
Different models have been developed to describe the formation of dust in SN ejecta, from Classical Nucleation Theory (CNT) to Kinetic and Molecular Nucleation Theories (KNT, MNT). In these frameworks theories have spanned a broad range of assumptions in terms of properties of the SN explosion, dynamical evolution of the SN remnant, physical processes implemented in the models, and late-time evolution of the grains when they cross the forward shock and are slowed down in the ISM.
-
–
Depending on the assumptions and model prescriptions, the predicted dust masses produced by SN ejecta (before reverse shock) range between and .
-
–
These predictions embrace the mass of dust typically observed in SN remnants (about , 50 years after the explosion); although we warn that there is a large dispersion in the measurements, and that the dust masses inferred from the observations can change significantly based on the different assumption to convert observational quantities to dust masses.
-
–
The reverse shock ( yr after explosion) is recognised to be a crucial phenomenon that can drastically reduce the yield of dust production of SNe and reshape the distribution of grain sizes and species. Yet, different models predict quite different survival rates, spanning from scenarios in which the disruption is essentially total to models that predict a survival rate of up to 80%.
-
–
Despite these uncertainties it is generally acknowledged that supernova ejecta are likely the main channel for dust production associated with stars more massive than 8 .
-
–
-
Asymptotic Giant Branch stars (AGBs)
-
–
This is the dominant dust production for low and intermediate mass stars ().
-
–
Most models adopt a simplified approach of stationary, spherically symmetric winds, due to the difficulties of integrating self-consistently the dust production in the complex AGB atmosphere models. Yet depending on the detailed assumption about the structure of the stellar envelope and energetics of nucleosynthesis in the various evolutionary steps, the dust mass production can vary by more than one order of magnitude in certain stellar mass ranges, and in certain metallicity ranges.
-
–
Carbon grains are mostly produced in AGBs with masses in the range (which become C-rich during the TP-AGB phase). This is the range for which the AGB dust production is maximum, reaching about per star, which, convolved with the IMF, results into the main dust production mechanisms in the local Universe and for evolved systems.
-
–
The limited mass range in which carbon dust is produced has also implications for observations in the early Universe, as AGBs are unlikely to produce carbon-rich dust in systems younger than about
-
–
Silicate dust production requires initial metallicities , and it is formed primarily by low-mass AGBs (), and by stars more massive than 4–5 (suffering Hot Bottom Burning). This implies that in young systems dust produced by AGBs is mostly in the form of silicates.
-
–
-
Red Super Giant Stars (RSGs)
RSGs with masses are estimated to produce and eject a dust mass in the range , which is comparable to the expected dust masses from core-collapse SNe, after reverse shock. However, it is likely that most of this dust is destroyed in the subsequent supernova explosion. -
Wolf–Rayet (WR) stars
WR stars, formed out of stars more massive than , are expected and observed to produce and expel gas, but only in the more evolved WC phase. The estimated dust production during this phase is about . However, most of this dust is expected to be destroyed by the subsequent SN explosion. Moreover, WR stars are very rare (at least for a standard IMF) and are therefore expected to be a minor dust contributor. Finally, WCs are known to be absent in low-metallicity galaxies, hence unlikely to contribute to the dust production in the early Universe. -
Classical Novae
Classical Novae are observed to be another interesting source of dust, which form in the dense shells behind the shocks produced in the outburst. However, although the rate of these events is about 35 per year in the Milky-Way, each event is estimated to produce dust masses of only . Therefore, they are unlikely to be major contributors of dust. -
Type Ia SNe
Although theoretical models predict that type Ia supernovae can produce dust masses in the range between , no observational evidence has been found for dust formed in their ejecta, with upper limits of . The much higher energetics (and lower densities) involved in type Ia SN explosions are likely responsible for the lack of dust formation (and rapid destruction). The lack of iron dust formed in type Ia SNe, implies that most of the depletion of iron in dust grains must happen via accretion from the ISM. -
Quasar winds
The dense clouds ejected from quasars are expected to pass through a phase in which density and temperature are optimal for the nucleation of dust grains. In powerful quasars models expect that the dust production rate could be up to a few /yr, hence they could potentially contribute to the dust enrichment of the host galaxy, even in the early Universe. However, it should be taken into account that this mechanism requires the pre-enrichment of the ISM in the nuclear region.
Clearly, the emerging picture is that the primary source of dust in galaxies are SN ejecta and AGB winds. Assessing the relative contribution of these two sources of dust at different times, hence at different cosmic epochs, is less obvious. While the production by SNe is essentially prompt, the production of dust by the first AGBs starts as early as 35 Myr after the beginning of star formation, and catches up fairly quickly (Fig. 1). Whether and when AGB dust dominates over the SN production (including reverse shock) depends on various factors, primarily the stellar IMF, metallicity, the degree of dust destruction by the SN reverse shock, and other parameters affecting the dust yield in the two phenomena. For instance, with a standard IMF AGB-dust may start dominating the dust content within a few 100 Myr, while in the case of a top heavy IMF the AGB dust may need more than 1 Gyr to dominate over the SN-produced dust. Such susceptibility on the IMF (but also on metallicity) has obviously important implications at high redshift if, as expected by various models, the IMF evolves with time (along with the chemical enrichment).
We have finally discussed that, regardless of the source of dust, its fate is unavoidably affected by its evolution and reprocessing in the ISM. Interstellar shocks generated by SNe can easily destroy dust grains in the ISM and change their size distribution, depending on the shock velocity and on the initial size distribution of the grains. Another fundamental process is the growth of grains through the accretion of gas-phase metals. This process is still poorly understood, but in the cold neutral medium of the ISM can be very efficient and very rapid (with timescales as short as a few Myr), implying that possibly most of the dust mass in the ISM of evolved (metal rich) galaxies is actually primarily resulting from growth in the ISM. In the early Universe, the dense environments in high-redshift galaxies may enhance dust growth. However, the lower gas metallicity can result into grain growth timescales comparable to the age of the Universe at those epochs.
The results reported in this review have highlighted the tremendous progress in modelling the dust formation and processing mechanisms, as well the impressive observational results obtained on dust sources through various cutting edge facilities. New models and numerical simulations, that consistently treat the dust formation with the complex physical processes and with less idealised assumptions, together with extensive observing programs, especially probing dust thermal emission in the far-IR/submm (e.g. with ALMA and NOEMA), and in the mid-IR (e.g. with JWST and, in the near future, with the ELT), will certainly provide tighter constraints on the relative role of the various dust production sources and processing, as well as on the resulting population of dust grains in different environments. However, the results obtained so far already provide an adequate backbone for the extensive models that are being developed to interpret the puzzling observations on dusty (and non-dusty) galaxies at high redshift. These exciting observational results, that are being obtained with facilities such as ALMA and JWST, as well as the models that have been proposed to explain them, will be the topic of the second part of this review.
Acknowledgements.
We dedicate this review to the memory of Stefania Marassi, a brilliant and enthusiastic scientist, who has given important contributions to the understanding of dust formation and survival in supernovae. She will be greatly missed.We are grateful to the Referees for their careful reading and useful suggestions. We warmly thank Simone Bianchi, Ilse De Looze, Florian Kirchschlager, Fred Galliano, Mikako Matsuura, Hiroyuki Hirashita, Arka Sarangi, Isabelle Cherchneff, John Slavin for their constructive and insightful comments, and for allowing us to reproduce some of their figures. RS thanks the Kavli Institute for Cosmology in Cambridge for their support and kind hospitality. RM acknowledges support by the Science and Technology Facilities Council (STFC), by the ERC through Advanced Grant 695671 “QUENCH”, and by the UKRI Frontier Research grant RISEandFALL. RM also acknowledges funding from a research professorship from the Royal Society.
Competing interests The authors declare no competing interests.
References
- Ahmad et al. (2023) Ahmad A, Freytag B, Höfner S (2023) Properties of self-excited pulsations in 3D simulations of AGB stars and red supergiants. A&A 669:A49. https://doi.org/10.1051/0004-6361/202244555. arXiv:2211.07682 [astro-ph.SR]
- Aoyama et al. (2017) Aoyama S, Hou KC, Shimizu I, Hirashita H, Todoroki K, Choi JH, Nagamine K (2017) Galaxy simulation with dust formation and destruction. MNRAS 466:105–121. https://doi.org/10.1093/mnras/stw3061. arXiv:1609.07547
- Arendt et al. (2014) Arendt RG, Dwek E, Kober G, Rho J, Hwang U (2014) Interstellar and Ejecta Dust in the Cas A Supernova Remnant. ApJ 786(1):55. https://doi.org/10.1088/0004-637X/786/1/55. arXiv:1403.3008 [astro-ph.GA]
- Asano et al. (2013) Asano RS, Takeuchi TT, Hirashita H, Nozawa T (2013) What determines the grain size distribution in galaxies? MNRAS 432:637–652. https://doi.org/10.1093/mnras/stt506. arXiv:1303.5528
- Asplund et al. (2009) Asplund M, Grevesse N, Sauval AJ, Scott P (2009) The Chemical Composition of the Sun. ARA&A 47(1):481–522. https://doi.org/10.1146/annurev.astro.46.060407.145222. arXiv:0909.0948 [astro-ph.SR]
- Bañados et al. (2018) Bañados E, Venemans BP, Mazzucchelli C, Farina EP, Walter F, Wang F, Decarli R, Stern D, Fan X, Davies FB, Hennawi JF, Simcoe RA, Turner ML, Rix HW, Yang J, Kelson DD, Rudie GC, Winters JM (2018) An 800-million-solar-mass black hole in a significantly neutral Universe at a redshift of 7.5. Nature 553(7689):473–476. https://doi.org/10.1038/nature25180. arXiv:1712.01860 [astro-ph.GA]
- Badenes et al. (2007) Badenes C, Hughes JP, Bravo E, Langer N (2007) Are the Models for Type Ia Supernova Progenitors Consistent with the Properties of Supernova Remnants? ApJ 662(1):472–486. https://doi.org/10.1086/518022. arXiv:astro-ph/0703321 [astro-ph]
- Barlow (1978) Barlow MJ (1978) The destruction and growth of dust grains in interstellar space. I - Destruction by sputtering. MNRAS 183:367–395. https://doi.org/10.1093/mnras/183.3.367
- Barlow et al. (2010) Barlow MJ, Krause O, Swinyard BM, Sibthorpe B, Besel MA, Wesson R, Ivison RJ, Dunne L, Gear WK, Gomez HL, Hargrave PC, Henning T, Leeks SJ, Lim TL, Olofsson G, Polehampton ET (2010) A Herschel PACS and SPIRE study of the dust content of the Cassiopeia A supernova remnant. A&A 518:L138. https://doi.org/10.1051/0004-6361/201014585
- Bertoldi et al. (2003) Bertoldi F, Carilli CL, Cox P, Fan X, Strauss MA, Beelen A, Omont A, Zylka R (2003) Dust emission from the most distant quasars. A&A 406:L55–L58. https://doi.org/10.1051/0004-6361:20030710. arXiv:astro-ph/0305116 [astro-ph]
- Bevan and Barlow (2016) Bevan A, Barlow MJ (2016) Modelling supernova line profile asymmetries to determine ejecta dust masses: SN 1987A from days 714 to 3604. MNRAS 456(2):1269–1293. https://doi.org/10.1093/mnras/stv2651. arXiv:1509.00858 [astro-ph.SR]
- Bevan et al. (2017) Bevan A, Barlow MJ, Milisavljevic D (2017) Dust masses for SN 1980K, SN1993J and Cassiopeia A from red-blue emission line asymmetries. MNRAS 465(4):4044–4056. https://doi.org/10.1093/mnras/stw2985. arXiv:1611.05006 [astro-ph.SR]
- Bevan et al. (2019) Bevan A, Wesson R, Barlow MJ, De Looze I, Andrews JE, Clayton GC, Krafton K, Matsuura M, Milisavljevic D (2019) A decade of ejecta dust formation in the Type IIn SN 2005ip. MNRAS 485(4):5192–5206. https://doi.org/10.1093/mnras/stz679. arXiv:1809.09055 [astro-ph.SR]
- Bevan et al. (2020) Bevan AM, Krafton K, Wesson R, Andrews JE, Montiel E, Niculescu-Duvaz M, Barlow MJ, De Looze I, Clayton GC (2020) Disentangling Dust Components in SN 2010jl: The First 1400 Days. ApJ 894(2):111. https://doi.org/10.3847/1538-4357/ab86a2. arXiv:2004.01503 [astro-ph.SR]
- Bianchi and Ferrara (2005) Bianchi S, Ferrara A (2005) Intergalactic medium metal enrichment through dust sputtering. MNRAS 358:379–396. https://doi.org/10.1111/j.1365-2966.2005.08762.x. astro-ph/0501147
- Bianchi and Schneider (2007) Bianchi S, Schneider R (2007) Dust formation and survival in supernova ejecta. MNRAS 378(3):973–982. https://doi.org/10.1111/j.1365-2966.2007.11829.x. arXiv:0704.0586 [astro-ph]
- Biscaro and Cherchneff (2016) Biscaro C, Cherchneff I (2016) Molecules and dust in Cassiopeia A. II. Dust sputtering and diagnosis of supernova dust survival in remnants. A&A 589:A132. https://doi.org/10.1051/0004-6361/201527769. arXiv:1511.05487 [astro-ph.SR]
- Bladh et al. (2015) Bladh S, Höfner S, Aringer B, Eriksson K (2015) Exploring wind-driving dust species in cool luminous giants. III. Wind models for M-type AGB stars: dynamic and photometric properties. A&A 575:A105. https://doi.org/10.1051/0004-6361/201424917. arXiv:1502.00032 [astro-ph.SR]
- Bladh et al. (2019) Bladh S, Liljegren S, Höfner S, Aringer B, Marigo P (2019) An extensive grid of DARWIN models for M-type AGB stars. I. Mass-loss rates and other properties of dust-driven winds. A&A 626:A100. https://doi.org/10.1051/0004-6361/201935366. arXiv:1904.10943 [astro-ph.SR]
- Blair et al. (2007) Blair WP, Ghavamian P, Long KS, Williams BJ, Borkowski KJ, Reynolds SP, Sankrit R (2007) Spitzer Space Telescope Observations of Kepler’s Supernova Remnant: A Detailed Look at the Circumstellar Dust Component. ApJ 662(2):998. https://doi.org/10.1086/518414
- Bocchio et al. (2014) Bocchio M, Jones AP, Slavin JD (2014) A re-evaluation of dust processing in supernova shock waves. A&A 570:A32. https://doi.org/10.1051/0004-6361/201424368
- Bocchio et al. (2016) Bocchio M, Marassi S, Schneider R, Bianchi S, Limongi M, Chieffi A (2016) Dust grains from the heart of supernovae. A&A 587:A157. https://doi.org/10.1051/0004-6361/201527432. arXiv:1601.06770 [astro-ph.HE]
- Bohdansky (1984) Bohdansky J (1984) A universal relation for the sputtering yield of monatomic solids at normal ion incidence. Nucl Instr Meth Phys Res B 2(1-3):587–591. https://doi.org/10.1016/0168-583X(84)90271-4
- Borkowski et al. (2006) Borkowski KJ, Williams BJ, Reynolds SP, Blair WP, Ghavamian P, Sankrit R, Hendrick SP, Long KS, Raymond JC, Smith RC (2006) Dust Destruction in Type Ia Supernova Remnants in the Large Magellanic Cloud. ApJ 642(2):L141–L144. https://doi.org/10.1086/504472. arXiv:astro-ph/0602313 [astro-ph]
- Boyer et al. (2015) Boyer ML, McQuinn KBW, Barmby P, Bonanos AZ, Gehrz RD, Gordon KD, Groenewegen MAT, Lagadec E, Lennon D, Marengo M, Meixner M, Skillman E, Sloan GC, Sonneborn G, van Loon JT, Zijlstra A (2015) An Infrared Census of Dust in nearby Galaxies with Spitzer (DUSTiNGS). I. Overview. ApJS 216(1):10. https://doi.org/10.1088/0067-0049/216/1/10. arXiv:1411.4053 [astro-ph.GA]
- Bressan et al. (2012) Bressan A, Marigo P, Girardi L, Salasnich B, Dal Cero C, Rubele S, Nanni A (2012) PARSEC: stellar tracks and isochrones with the PAdova and TRieste Stellar Evolution Code. MNRAS 427(1):127–145. https://doi.org/10.1111/j.1365-2966.2012.21948.x. arXiv:1208.4498 [astro-ph.SR]
- Brooker et al. (2022) Brooker ES, Stangl SM, Mauney CM, Fryer CL (2022) Dependence of Dust Formation on the Supernova Explosion. ApJ 931(2):85. https://doi.org/10.3847/1538-4357/ac57c3. arXiv:2103.12781 [astro-ph.HE]
- Buemi et al. (2007) Buemi CS, Umana G, Trigilio C, Leto P (2007) A 1.2 mm MAMBO survey of post-AGB stars. A&A 462(2):637–644. https://doi.org/10.1051/0004-6361:20065264. arXiv:astro-ph/0610399 [astro-ph]
- Burtscher et al. (2013) Burtscher L, Meisenheimer K, Tristram KRW, Jaffe W, Hönig SF, Davies RI, Kishimoto M, Pott JU, Röttgering H, Schartmann M, Weigelt G, Wolf S (2013) A diversity of dusty AGN tori. Data release for the VLTI/MIDI AGN Large Program and first results for 23 galaxies. A&A 558:A149. https://doi.org/10.1051/0004-6361/201321890. arXiv:1307.2068 [astro-ph.CO]
- Ceccarelli et al. (2018) Ceccarelli C, Viti S, Balucani N, Taquet V (2018) The evolution of grain mantles and silicate dust growth at high redshift. MNRAS 476(1):1371–1383. https://doi.org/10.1093/mnras/sty313. arXiv:1802.01142 [astro-ph.GA]
- Chastenet et al. (2022) Chastenet J, De Looze I, Hensley BS, Vandenbroucke B, Barlow MJ, Rho J, Ravi AP, Gomez HL, Kirchschlager F, Macías-Pérez J, Matsuura M, Pattle K, Ponthieu N, Priestley FD, Relaño M, Ritacco A, Wesson R (2022) SOFIA/HAWC+ observations of the Crab Nebula: dust properties from polarized emission. MNRAS 516(3):4229–4244. https://doi.org/10.1093/mnras/stac2413. arXiv:2208.10935 [astro-ph.GA]
- Chawner et al. (2019) Chawner H, Marsh K, Matsuura M, Gomez HL, Cigan P, De Looze I, Barlow MJ, Dunne L, Noriega-Crespo A, Rho J (2019) A catalogue of Galactic supernova remnants in the far-infrared: revealing ejecta dust in pulsar wind nebulae. MNRAS 483(1):70–118. https://doi.org/10.1093/mnras/sty2942. arXiv:1811.00034 [astro-ph.GA]
- Chawner et al. (2020) Chawner H, Gomez HL, Matsuura M, Smith MWL, Papageorgiou A, Rho J, Noriega-Crespo A, De Looze I, Barlow MJ, Cigan P, Dunne L, Marsh K (2020) A complete catalogue of dusty supernova remnants in the Galactic plane. MNRAS 493(2):2706–2744. https://doi.org/10.1093/mnras/staa221. arXiv:2001.05504 [astro-ph.GA]
- Cherchneff and Dwek (2009) Cherchneff I, Dwek E (2009) The Chemistry of Population III Supernova Ejecta. I. Formation of Molecules in the Early Universe. ApJ 703:642–661. https://doi.org/10.1088/0004-637X/703/1/642. arXiv:0907.3621 [astro-ph.SR]
- Cherchneff and Dwek (2010) Cherchneff I, Dwek E (2010) The Chemistry of Population III Supernova Ejecta. II. The Nucleation of Molecular Clusters as a Diagnostic for Dust in the Early Universe. ApJ 713:1–24. https://doi.org/10.1088/0004-637X/713/1/1. arXiv:1002.3060 [astro-ph.SR]
- Cherchneff and Lilly (2008) Cherchneff I, Lilly S (2008) Primordial Massive Supernovae as the First Molecular Factories in the Early Universe. ApJ 683(2):L123. https://doi.org/10.1086/591906. arXiv:0807.2511 [astro-ph]
- Cherchneff et al. (2000) Cherchneff I, Le Teuff YH, Williams PM, Tielens AGGM (2000) Dust formation in carbon-rich Wolf-Rayet stars. I. Chemistry of small carbon clusters and silicon species. A&A 357:572–580
- Choban et al. (2022) Choban CR, Kereš D, Hopkins PF, Sandstrom KM, Hayward CC, Faucher-Giguère CA (2022) The galactic dust-up: modelling dust evolution in FIRE. MNRAS 514(3):4506–4534. https://doi.org/10.1093/mnras/stac1542. arXiv:2201.12369 [astro-ph.GA]
- Chon et al. (2021) Chon S, Omukai K, Schneider R (2021) Transition of the initial mass function in the metal-poor environments. MNRAS 508(3):4175–4192. https://doi.org/10.1093/mnras/stab2497. arXiv:2103.04997 [astro-ph.GA]
- Chon et al. (2022) Chon S, Ono H, Omukai K, Schneider R (2022) Impact of the cosmic background radiation on the initial mass function of metal-poor stars. MNRAS 514(3):4639–4654. https://doi.org/10.1093/mnras/stac1549. arXiv:2205.15328 [astro-ph.GA]
- Cigan et al. (2019) Cigan P, Matsuura M, Gomez HL, Indebetouw R, Abellán F, Gabler M, Richards A, Alp D, Davis TA, Janka HT, Spyromilio J, Barlow MJ, Burrows D, Dwek E, Fransson C, Gaensler B, Larsson J, Bouchet P, Lundqvist P, Marcaide JM, Ng CY, Park S, Roche P, van Loon JT, Wheeler JC, Zanardo G (2019) High Angular Resolution ALMA Images of Dust and Molecules in the SN 1987A Ejecta. ApJ 886(1):51. https://doi.org/10.3847/1538-4357/ab4b46. arXiv:1910.02960 [astro-ph.HE]
- Clark et al. (2023) Clark CJR, Roman-Duval JC, Gordon KD, Bot C, Smith MWL, Hagen LMZ (2023) The Quest for the Missing Dust. II. Two Orders of Magnitude of Evolution in the Dust-to-gas Ratio Resolved within Local Group Galaxies. ApJ 946(1):42. https://doi.org/10.3847/1538-4357/acbb66. arXiv:2302.07378 [astro-ph.GA]
- Crowther (2003) Crowther PA (2003) Dust formation around Wolf-Rayet stars. Ap&SS 285(3):677–685. https://doi.org/10.1023/A:1026157126395
- Danchi et al. (1994) Danchi WC, Bester M, Degiacomi CG, Greenhill LJ, Townes CH (1994) Characteristics of dust shells around 13 late-type stars. AJ 107:1469. https://doi.org/10.1086/116960
- Davies et al. (2017) Davies JI, Baes M, Bianchi S, Jones A, Madden S, Xilouris M, Bocchio M, Casasola V, Cassara L, Clark C, De Looze I, Evans R, Fritz J, Galametz M, Galliano F, Lianou S, Mosenkov AV, Smith M, Verstocken S, Viaene S, Vika M, Wagle G, Ysard N (2017) DustPedia: A Definitive Study of Cosmic Dust in the Local Universe. PASP 129(974):044102. https://doi.org/10.1088/1538-3873/129/974/044102. arXiv:1609.06138 [astro-ph.GA]
- de Bennassuti et al. (2014) de Bennassuti M, Schneider R, Valiante R, Salvadori S (2014) Decoding the stellar fossils of the dusty Milky Way progenitors. MNRAS 445:3039–3054. https://doi.org/10.1093/mnras/stu1962. arXiv:1409.5798
- de Bennassuti et al. (2017) de Bennassuti M, Salvadori S, Schneider R, Valiante R, Omukai K (2017) Limits on Population III star formation with the most iron-poor stars. MNRAS 465:926–940. https://doi.org/10.1093/mnras/stw2687. arXiv:1610.05777
- De Looze et al. (2017) De Looze I, Barlow MJ, Swinyard BM, Rho J, Gomez HL, Matsuura M, Wesson R (2017) The dust mass in Cassiopeia A from a spatially resolved Herschel analysis. MNRAS 465(3):3309–3342. https://doi.org/10.1093/mnras/stw2837. arXiv:1611.00774 [astro-ph.GA]
- De Looze et al. (2019) De Looze I, Barlow MJ, Bandiera R, Bevan A, Bietenholz MF, Chawner H, Gomez HL, Matsuura M, Priestley F, Wesson R (2019) The dust content of the Crab Nebula. MNRAS 488(1):164–182. https://doi.org/10.1093/mnras/stz1533. arXiv:1906.02203 [astro-ph.HE]
- De Looze et al. (2020) De Looze I, Lamperti I, Saintonge A, Relaño M, Smith MWL, Clark CJR, Wilson CD, Decleir M, Jones AP, Kennicutt RC, Accurso G, Brinks E, Bureau M, Cigan P, Clements DL, De Vis P, Fanciullo L, Gao Y, Gear WK, Ho LC, Hwang HS, Michałowski MJ, Lee JC, Li C, Lin L, Liu T, Lomaeva M, Pan HA, Sargent M, Williams T, Xiao T, Zhu M (2020) JINGLE - IV. Dust, H I gas, and metal scaling laws in the local Universe. MNRAS 496(3):3668–3687. https://doi.org/10.1093/mnras/staa1496. arXiv:2006.01856 [astro-ph.GA]
- De Vis et al. (2017) De Vis P, Gomez HL, Schofield SP, Maddox S, Dunne L, Baes M, Cigan P, Clark CJR, Gomez EL, Lara-López M, Owers M (2017) Using dust, gas and stellar mass-selected samples to probe dust sources and sinks in low-metallicity galaxies. MNRAS 471(2):1743–1765. https://doi.org/10.1093/mnras/stx981. arXiv:1705.02340 [astro-ph.GA]
- De Vis et al. (2019) De Vis P, Jones A, Viaene S, Casasola V, Clark CJR, Baes M, Bianchi S, Cassara LP, Davies JI, De Looze I, Galametz M, Galliano F, Lianou S, Madden S, Manilla-Robles A, Mosenkov AV, Nersesian A, Roychowdhury S, Xilouris EM, Ysard N (2019) A systematic metallicity study of DustPedia galaxies reveals evolution in the dust-to-metal ratios. A&A 623:A5. https://doi.org/10.1051/0004-6361/201834444. arXiv:1901.09040 [astro-ph.GA]
- Dell’Agli et al. (2014) Dell’Agli F, García-Hernández DA, Rossi C, Ventura P, Di Criscienzo M, Schneider R (2014) On the alumina dust production in the winds of O-rich asymptotic giant branch stars. MNRAS 441(2):1115–1125. https://doi.org/10.1093/mnras/stu647. arXiv:1404.0507 [astro-ph.SR]
- Dell’Agli et al. (2015a) Dell’Agli F, García-Hernández DA, Ventura P, Schneider R, Di Criscienzo M, Rossi C (2015a) AGB stars in the SMC: evolution and dust properties based on Spitzer observations. MNRAS 454(4):4235–4249. https://doi.org/10.1093/mnras/stv2298. arXiv:1510.01230 [astro-ph.SR]
- Dell’Agli et al. (2015b) Dell’Agli F, Ventura P, Schneider R, Di Criscienzo M, García-Hernández DA, Rossi C, Brocato E (2015b) Asymptotic giant branch stars in the Large Magellanic Cloud: evolution of dust in circumstellar envelopes. MNRAS 447:2992–3015. https://doi.org/10.1093/mnras/stu2559. arXiv:1412.1365 [astro-ph.SR]
- Dell’Agli et al. (2016) Dell’Agli F, García-Hernández DA, Ventura P, Schneider R, Di Criscienzo M, Rossi C (2016) Dust from AGBs: understanding the Spitzer observations of evolved stars in the Large Magellanic Cloud . Mem. Soc. Astron. Ital. 87:255
- Dell’Agli et al. (2017) Dell’Agli F, García-Hernández DA, Schneider R, Ventura P, La Franca F, Valiante R, Marini E, Di Criscienzo M (2017) Asymptotic giant branch and super-asymptotic giant branch stars: modelling dust production at solar metallicity. MNRAS 467:4431–4440. https://doi.org/10.1093/mnras/stx387. arXiv:1702.03904 [astro-ph.SR]
- Dell’Agli et al. (2018) Dell’Agli F, Di Criscienzo M, Ventura P, Limongi M, García-Hernández DA, Marini E, Rossi C (2018) Evolved stars in the Local Group galaxies - II. AGB, RSG stars, and dust production in IC10. MNRAS 479(4):5035–5048. https://doi.org/10.1093/mnras/sty1614. arXiv:1806.04160 [astro-ph.SR]
- Dell’Agli et al. (2019a) Dell’Agli F, Di Criscienzo M, García-Hernández DA, Ventura P, Limongi M, Marini E, Jones OC (2019a) Evolved stars in the Local Group galaxies - III. AGB and RSG stars in Sextans A. MNRAS 482(4):4733–4743. https://doi.org/10.1093/mnras/sty2727. arXiv:1810.02379 [astro-ph.SR]
- Dell’Agli et al. (2019b) Dell’Agli F, Valiante R, Kamath D, Ventura P, García-Hernández DA (2019b) AGB dust and gas ejecta in extremely metal-poor environments. MNRAS 486(4):4738–4752. https://doi.org/10.1093/mnras/stz1164. arXiv:1904.11734 [astro-ph.SR]
- Dell’Agli et al. (2023) Dell’Agli F, Tosi S, Kamath D, Ventura P, Van Winckel H, Marini E, Marchetti T (2023) Study of oxygen-rich post-AGB stars in the Milky Way as a means to explain the production of silicates among evolved stars. A&A 671:A86. https://doi.org/10.1051/0004-6361/202245250. arXiv:2211.13029 [astro-ph.SR]
- Derdzinski et al. (2017) Derdzinski AM, Metzger BD, Lazzati D (2017) Radiative shocks create environments for dust formation in classical novae. MNRAS 469(2):1314–1329. https://doi.org/10.1093/mnras/stx829. arXiv:1610.02401 [astro-ph.SR]
- Di Cesare et al. (2023) Di Cesare C, Graziani L, Schneider R, Ginolfi M, Venditti A, Santini P, Hunt LK (2023) The assembly of dusty galaxies at z 4: the build-up of stellar mass and its scaling relations with hints from early JWST data. MNRAS 519(3):4632–4650. https://doi.org/10.1093/mnras/stac3702. arXiv:2209.05496 [astro-ph.GA]
- Di Criscienzo et al. (2013) Di Criscienzo M, Dell’Agli F, Ventura P, Schneider R, Valiante R, La Franca F, Rossi C, Gallerani S, Maiolino R (2013) Dust formation in the winds of AGBs: the contribution at low metallicities. MNRAS 433:313–323. https://doi.org/10.1093/mnras/stt732. arXiv:1304.7120 [astro-ph.SR]
- Donn and Nuth (1985) Donn B, Nuth JA (1985) Does nucleation theory apply to the formation of refractory circumstellar grains? ApJ 288:187–190. https://doi.org/10.1086/162779
- Draine (2003) Draine BT (2003) Interstellar Dust Grains. ARA&A 41:241–289. https://doi.org/10.1146/annurev.astro.41.011802.094840. astro-ph/0304489
- Draine (2009) Draine BT (2009) Interstellar Dust Models and Evolutionary Implications. In: Henning T, Grün E, Steinacker J (eds) Cosmic Dust - Near and Far. ASP Conference Series, vol 414. PASP , p 453. arXiv:0903.1658 [astro-ph.GA]
- Draine (2011) Draine BT (2011) Physics of the Interstellar and Intergalactic Medium. Princeton University Press
- Draine and Salpeter (1979) Draine BT, Salpeter EE (1979) On the physics of dust grains in hot gas. ApJ 231:77–94. https://doi.org/10.1086/157165
- Dwek (1998) Dwek E (1998) The Evolution of the Elemental Abundances in the Gas and Dust Phases of the Galaxy. ApJ 501:643. https://doi.org/10.1086/305829. arXiv:astro-ph/9707024 [astro-ph]
- Dwek (2016) Dwek E (2016) Iron: A key element for understanding the origin and evolution of interstellar dust. ApJ 825(2):136. https://doi.org/10.3847/0004-637X/825/2/136
- Dwek and Arendt (2015) Dwek E, Arendt RG (2015) The Evolution of Dust Mass in the Ejecta of SN1987A. ApJ 810(1):75. https://doi.org/10.1088/0004-637X/810/1/75. arXiv:1507.07019 [astro-ph.SR]
- Dwek and Scalo (1980) Dwek E, Scalo JM (1980) The evolution of refractory interstellar grains in the solar neighborhood. ApJ 239:193–211. https://doi.org/10.1086/158100
- Dwek et al. (2010) Dwek E, Arendt RG, Bouchet P, Burrows DN, Challis P, Danziger IJ, De Buizer JM, Gehrz RD, Park S, Polomski EF, Slavin JD, Woodward CE (2010) Five Years of Mid-infrared Evolution of the Remnant of SN 1987A: The Encounter Between the Blast Wave and the Dusty Equatorial Ring. ApJ 722(1):425–434. https://doi.org/10.1088/0004-637X/722/1/425. arXiv:1004.0928 [astro-ph.CO]
- Dwek et al. (2019) Dwek E, Sarangi A, Arendt RG (2019) The Evolution of Dust Opacity in Core Collapse Supernovae and the Rapid Formation of Dust in Their Ejecta. ApJ 871(2):L33. https://doi.org/10.3847/2041-8213/aaf9a8. arXiv:1812.08234 [astro-ph.SR]
- Eldridge et al. (2007) Eldridge JJ, Mattila S, Smartt SJ (2007) Ruling out a massive asymptotic giant-branch star as the progenitor of supernova 2005cs. MNRAS 376(1):L52–L56. https://doi.org/10.1111/j.1745-3933.2007.00285.x. arXiv:astro-ph/0701152 [astro-ph]
- Elitzur and Shlosman (2006) Elitzur M, Shlosman I (2006) The AGN-obscuring Torus: The End of the “Doughnut” Paradigm? ApJ 648(2):L101–L104. https://doi.org/10.1086/508158. arXiv:astro-ph/0605686 [astro-ph]
- Elitzur et al. (2014) Elitzur M, Ho LC, Trump JR (2014) Evolution of broad-line emission from active galactic nuclei. MNRAS 438(4):3340–3351. https://doi.org/10.1093/mnras/stt2445. arXiv:1312.4922 [astro-ph.GA]
- Elvis (2000) Elvis M (2000) A Structure for Quasars. ApJ 545(1):63–76. https://doi.org/10.1086/317778. arXiv:astro-ph/0008064 [astro-ph]
- Elvis et al. (2002) Elvis M, Marengo M, Karovska M (2002) Smoking Quasars: A New Source for Cosmic Dust. ApJ 567(2):L107–L110. https://doi.org/10.1086/340006. arXiv:astro-ph/0202002 [astro-ph]
- Ercolano et al. (2007) Ercolano B, Barlow MJ, Sugerman BEK (2007) Dust yields in clumpy supernova shells: SN 1987A revisited. MNRAS 375(3):753–763. https://doi.org/10.1111/j.1365-2966.2006.11336.x. arXiv:astro-ph/0611719 [astro-ph]
- Eriksson et al. (2014) Eriksson K, Nowotny W, Höfner S, Aringer B, Wachter A (2014) Synthetic photometry for carbon-rich giants. IV. An extensive grid of dynamic atmosphere and wind models. A&A 566:A95. https://doi.org/10.1051/0004-6361/201323241. arXiv:1404.7515 [astro-ph.SR]
- Fan et al. (2023) Fan X, Bañados E, Simcoe RA (2023) Quasars and the Intergalactic Medium at Cosmic Dawn. ARA&A 61:373–426. https://doi.org/10.1146/annurev-astro-052920-102455. arXiv:2212.06907 [astro-ph.GA]
- Feldmann (2015) Feldmann R (2015) The equilibrium view on dust and metals in galaxies: Galactic outflows drive low dust-to-metal ratios in dwarf galaxies. MNRAS 449:3274–3292. https://doi.org/10.1093/mnras/stv552. arXiv:1412.2755
- Ferrara et al. (2016) Ferrara A, Viti S, Ceccarelli C (2016) The problematic growth of dust in high-redshift galaxies. MNRAS 463:L112–L116. https://doi.org/10.1093/mnrasl/slw165. arXiv:1606.07214
- Ferrarotti and Gail (2006) Ferrarotti AS, Gail HP (2006) Composition and quantities of dust produced by AGB-stars and returned to the interstellar medium. A&A 447:553–576. https://doi.org/10.1051/0004-6361:20041198
- Freytag and Höfner (2023) Freytag B, Höfner S (2023) Global 3D radiation-hydrodynamical models of AGB stars with dust-driven winds. A&A 669:A155. https://doi.org/10.1051/0004-6361/202244992. arXiv:2301.11836 [astro-ph.SR]
- Fry et al. (2020) Fry BJ, Fields BD, Ellis JR (2020) Magnetic Imprisonment of Dusty Pinballs by a Supernova Remnant. ApJ 894(2):109. https://doi.org/10.3847/1538-4357/ab86bf. arXiv:1801.06859 [astro-ph.HE]
- Fryer et al. (2018) Fryer CL, Andrews S, Even W, Heger A, Safi-Harb S (2018) Parameterizing the Supernova Engine and Its Effect on Remnants and Basic Yields. ApJ 856(1):63. https://doi.org/10.3847/1538-4357/aaaf6f. arXiv:1712.03415 [astro-ph.HE]
- Gail et al. (2009) Gail HP, Zhukovska SV, Hoppe P, Trieloff M (2009) Stardust from Asymptotic Giant Branch Stars. ApJ 698:1136–1154. https://doi.org/10.1088/0004-637X/698/2/1136
- Gall et al. (2011) Gall C, Hjorth J, Andersen AC (2011) Production of dust by massive stars at high redshift. A&ARv 19:43. https://doi.org/10.1007/s00159-011-0043-7. arXiv:1108.0403 [astro-ph.CO]
- Galliano et al. (2018) Galliano F, Galametz M, Jones AP (2018) The Interstellar Dust Properties of Nearby Galaxies. ARA&A 56:673–713. https://doi.org/10.1146/annurev-astro-081817-051900. arXiv:1711.07434 [astro-ph.GA]
- Galliano et al. (2021) Galliano F, Nersesian A, Bianchi S, De Looze I, Roychowdhury S, Baes M, Casasola V, Cassará LP, Dobbels W, Fritz J, Galametz M, Jones AP, Madden SC, Mosenkov A, Xilouris EM, Ysard N (2021) A nearby galaxy perspective on dust evolution. Scaling relations and constraints on the dust build-up in galaxies with the DustPedia and DGS samples. A&A 649:A18. https://doi.org/10.1051/0004-6361/202039701. arXiv:2101.00456 [astro-ph.GA]
- Gehrz (1988) Gehrz RD (1988) The infrared temporal development of classical novae. ARA&A 26:377–412. https://doi.org/10.1146/annurev.aa.26.090188.002113
- Gehrz et al. (1998) Gehrz RD, Truran JW, Williams RE, Starrfield S (1998) Nucleosynthesis in Classical Novae and Its Contribution to the Interstellar Medium. PASP 110(743):3. https://doi.org/10.1086/316107
- Gerbrandt et al. (2015) Gerbrandt SAN, McConnachie AW, Irwin M (2015) The red extended structure of IC 10, the nearest blue compact galaxy. MNRAS 454(1):1000–1011. https://doi.org/10.1093/mnras/stv2029. arXiv:1509.05436 [astro-ph.GA]
- Ginolfi et al. (2017) Ginolfi M, Graziani L, Schneider R, Marassi S, Valiante R, Dell’Agli F, Ventura P, Hunt L (2017) Where does galactic dust come from? ArXiv e-prints arXiv:1707.05328
- Gomez et al. (2012) Gomez HL, Clark CJR, Nozawa T, Krause O, Gomez EL, Matsuura M, Barlow MJ, Besel MA, Dunne L, Gear WK, Hargrave P, Henning T, Ivison RJ, Sibthorpe B, Swinyard BM, Wesson R (2012) Dust in historical Galactic Type Ia supernova remnants with Herschel. Monthly Notices of the Royal Astronomical Society 420(4):3557. https://doi.org/10.1111/j.1365-2966.2011.20272.x
- Gordon et al. (2011) Gordon KD, Meixner M, Meade MR, Whitney B, Engelbracht C, Bot C, Boyer ML, Lawton B, Sewiło M, Babler B, Bernard JP, Bracker S, Block M, Blum R, Bolatto A, Bonanos A, Harris J, Hora JL, Indebetouw R, Misselt K, Reach W, Shiao B, Tielens X, Carlson L, Churchwell E, Clayton GC, Chen CHR, Cohen M, Fukui Y, Gorjian V, Hony S, Israel FP, Kawamura A, Kemper F, Leroy A, Li A, Madden S, Marble AR, McDonald I, Mizuno A, Mizuno N, Muller E, Oliveira JM, Olsen K, Onishi T, Paladini R, Paradis D, Points S, Robitaille T, Rubin D, Sandstrom K, Sato S, Shibai H, Simon JD, Smith LJ, Srinivasan S, Vijh U, Van Dyk S, van Loon JT, Zaritsky D (2011) Surveying the Agents of Galaxy Evolution in the Tidally Stripped, Low Metallicity Small Magellanic Cloud (SAGE-SMC). I. Overview. AJ 142(4):102. https://doi.org/10.1088/0004-6256/142/4/102. arXiv:1107.4313 [astro-ph.CO]
- Gottlieb et al. (2022) Gottlieb CA, Decin L, Richards AMS, De Ceuster F, Homan W, Wallström SHJ, Danilovich T, Millar TJ, Montargès M, Wong KT, McDonald I, Baudry A, Bolte J, Cannon E, De Beck E, de Koter A, El Mellah I, Etoka S, Gobrecht D, Gray M, Herpin F, Jeste M, Kervella P, Khouri T, Lagadec E, Maes S, Malfait J, Menten KM, Müller HSP, Pimpanuwat B, Plane JMC, Sahai R, Van de Sande M, Waters LBFM, Yates J, Zijlstra A (2022) ATOMIUM: ALMA tracing the origins of molecules in dust forming oxygen rich M-type stars. Motivation, sample, calibration, and initial results. A&A 660:A94. https://doi.org/10.1051/0004-6361/202140431. arXiv:2112.04399 [astro-ph.SR]
- Graziani et al. (2020) Graziani L, Schneider R, Ginolfi M, Hunt LK, Maio U, Glatzle M, Ciardi B (2020) The assembly of dusty galaxies at z 4: statistical properties. MNRAS 494(1):1071–1088. https://doi.org/10.1093/mnras/staa796. arXiv:1909.07388 [astro-ph.GA]
- Groenewegen and Sloan (2018) Groenewegen MAT, Sloan GC (2018) Luminosities and mass-loss rates of Local Group AGB stars and red supergiants. A&A 609:A114. https://doi.org/10.1051/0004-6361/201731089. arXiv:1711.07803 [astro-ph.SR]
- Groenewegen et al. (2011) Groenewegen MAT, Waelkens C, Barlow MJ, Kerschbaum F, Garcia-Lario P, Cernicharo J, Blommaert JADL, Bouwman J, Cohen M, Cox N, Decin L, Exter K, Gear WK, Gomez HL, Hargrave PC, Henning T, Hutsemékers D, Ivison RJ, Jorissen A, Krause O, Ladjal D, Leeks SJ, Lim TL, Matsuura M, Nazé Y, Olofsson G, Ottensamer R, Polehampton E, Posch T, Rauw G, Royer P, Sibthorpe B, Swinyard BM, Ueta T, Vamvatira-Nakou C, Vandenbussche B, van de Steene GC, van Eck S, van Hoof PAM, van Winckel H, Verdugo E, Wesson R (2011) MESS (Mass-loss of Evolved StarS), a Herschel key program. A&A 526:A162. https://doi.org/10.1051/0004-6361/201015829. arXiv:1012.2701 [astro-ph.SR]
- Hasegawa and Herbst (1993) Hasegawa TI, Herbst E (1993) New gas-grain chemical models of quiscent dense interstellar clouds: the effects of H2 tunnelling reactions and cosmic ray induced desorption. MNRAS 261:83–102. https://doi.org/10.1093/mnras/261.1.83
- Hasegawa et al. (1992) Hasegawa TI, Herbst E, Leung CM (1992) Models of Gas-Grain Chemistry in Dense Interstellar Clouds with Complex Organic Molecules. ApJS 82:167. https://doi.org/10.1086/191713
- Hirashita (1999) Hirashita H (1999) Global Law for the Dust-to-Gas Ratio of Spiral Galaxies. ApJ 510(2):L99–L102. https://doi.org/10.1086/311806. arXiv:astro-ph/9811170 [astro-ph]
- Hirashita (2013) Hirashita H (2013) Dust Processing in the Interstellar Medium. In: Proceedings of The Life Cycle of Dust in the Universe: Observations. p 27. https://doi.org/10.22323/1.207.0027
- Hirashita and Kuo (2011) Hirashita H, Kuo TM (2011) Effects of grain size distribution on the interstellar dust mass growth. MNRAS 416(2):1340–1353. https://doi.org/10.1111/j.1365-2966.2011.19131.x. arXiv:1105.4930 [astro-ph.CO]
- Hirashita et al. (2015) Hirashita H, Nozawa T, Villaume A, Srinivasan S (2015) Dust processing in elliptical galaxies. MNRAS 454(2):1620–1633. https://doi.org/10.1093/mnras/stv2095. arXiv:1509.03978 [astro-ph.GA]
- Höfner and Olofsson (2018) Höfner S, Olofsson H (2018) Mass loss of stars on the asymptotic giant branch. Mechanisms, models and measurements. A&ARv 26(1):1. https://doi.org/10.1007/s00159-017-0106-5
- Höfner et al. (2003) Höfner S, Gautschy-Loidl R, Aringer B, Jørgensen UG (2003) Dynamic model atmospheres of AGB stars. III. Effects of frequency-dependent radiative transfer. A&A 399:589–601. https://doi.org/10.1051/0004-6361:20021757
- Höfner et al. (2016) Höfner S, Bladh S, Aringer B, Ahuja R (2016) Dynamic atmospheres and winds of cool luminous giants. I. Al2O3 and silicate dust in the close vicinity of M-type AGB stars. A&A 594:A108. https://doi.org/10.1051/0004-6361/201628424. arXiv:1605.09730 [astro-ph.SR]
- Hu et al. (2019) Hu CY, Zhukovska S, Somerville RS, Naab T (2019) Thermal and non-thermal dust sputtering in hydrodynamical simulations of the multiphase interstellar medium. MNRAS 487(3):3252–3269. https://doi.org/10.1093/mnras/stz1481. arXiv:1902.01368 [astro-ph.GA]
- Inami et al. (2022) Inami H, Algera HSB, Schouws S, Sommovigo L, Bouwens R, Smit R, Stefanon M, Bowler RAA, Endsley R, Ferrara A, Oesch P, Stark D, Aravena M, Barrufet L, da Cunha E, Dayal P, De Looze I, Fudamoto Y, Gonzalez V, Graziani L, Hodge JA, Hygate APS, Nanayakkara T, Pallottini A, Riechers DA, Schneider R, Topping M, van der Werf P (2022) The ALMA REBELS Survey: dust continuum detections at z ¿ 6.5. MNRAS 515(3):3126–3143. https://doi.org/10.1093/mnras/stac1779. arXiv:2203.15136 [astro-ph.GA]
- Inayoshi et al. (2020) Inayoshi K, Visbal E, Haiman Z (2020) The Assembly of the First Massive Black Holes. ARA&A 58:27–97. https://doi.org/10.1146/annurev-astro-120419-014455. arXiv:1911.05791 [astro-ph.GA]
- Indebetouw et al. (2014) Indebetouw R, Matsuura M, Dwek E, Zanardo G, Barlow MJ, Baes M, Bouchet P, Burrows DN, Chevalier R, Clayton GC, Fransson C, Gaensler B, Kirshner R, Lakićević M, Long KS, Lundqvist P, Martí-Vidal I, Marcaide J, McCray R, Meixner M, Ng CY, Park S, Sonneborn G, Staveley-Smith L, Vlahakis C, van Loon J (2014) Dust Production and Particle Acceleration in Supernova 1987A Revealed with ALMA. ApJ 782(1):L2. https://doi.org/10.1088/2041-8205/782/1/L2. arXiv:1312.4086 [astro-ph.SR]
- Jenkins (2009) Jenkins EB (2009) A Unified Representation of Gas-Phase Element Depletions in the Interstellar Medium. ApJ 700(2):1299–1348. https://doi.org/10.1088/0004-637X/700/2/1299. arXiv:0905.3173 [astro-ph.GA]
- Jenkins and Wallerstein (2017) Jenkins EB, Wallerstein G (2017) Interstellar Gas-phase Element Depletions in the Small Magellanic Cloud: A Guide to Correcting for Dust in QSO Absorption Line Systems. ApJ 838(2):85. https://doi.org/10.3847/1538-4357/aa64d4. arXiv:1705.02675 [astro-ph.GA]
- Jermyn et al. (2018) Jermyn AS, Steinhardt CL, Tout CA (2018) The cosmic microwave background and the stellar initial mass function. MNRAS 480(3):4265–4272. https://doi.org/10.1093/mnras/sty2123. arXiv:1809.03502 [astro-ph.GA]
- Jones et al. (1996) Jones AP, Tielens AGGM, Hollenbach DJ (1996) Grain Shattering in Shocks: The Interstellar Grain Size Distribution. ApJ 469:740. https://doi.org/10.1086/177823
- Jones et al. (2013) Jones AP, Fanciullo L, Köhler M, Verstraete L, Guillet V, Bocchio M, Ysard N (2013) The evolution of amorphous hydrocarbons in the ISM: dust modelling from a new vantage point. A&A 558:A62. https://doi.org/10.1051/0004-6361/201321686. arXiv:1411.6293
- Jones et al. (2017) Jones OC, Woods PM, Kemper F, Kraemer KE, Sloan GC, Srinivasan S, Oliveira JM, van Loon JT, Boyer ML, Sargent BA, McDonald I, Meixner M, Zijlstra AA, Ruffle PME, Lagadec E, Pauly T, Sewiło M, Clayton GC, Volk K (2017) The SAGE-Spec Spitzer Legacy program: the life-cycle of dust and gas in the Large Magellanic Cloud. Point source classification - III. MNRAS 470(3):3250–3282. https://doi.org/10.1093/mnras/stx1101. arXiv:1705.02709 [astro-ph.SR]
- Jones et al. (2018) Jones OC, Maclay MT, Boyer ML, Meixner M, McDonald I, Meskhidze H (2018) Near-infrared Stellar Populations in the Metal-poor, Dwarf Irregular Galaxies Sextans A and Leo A. ApJ 854(2):117. https://doi.org/10.3847/1538-4357/aaa542. arXiv:1712.06594 [astro-ph.GA]
- Karakas et al. (2002) Karakas AI, Lattanzio JC, Pols OR (2002) Parameterising the Third Dredge-up in Asymptotic Giant Branch Stars. PASA 19(4):515–526. https://doi.org/10.1071/AS02013. arXiv:astro-ph/0210058 [astro-ph]
- Kilpatrick and Foley (2018) Kilpatrick CD, Foley RJ (2018) The dusty progenitor star of the Type II supernova 2017eaw. MNRAS 481(2):2536–2547. https://doi.org/10.1093/mnras/sty2435. arXiv:1806.00348 [astro-ph.SR]
- Kirchschlager et al. (2019) Kirchschlager F, Schmidt FD, Barlow MJ, Fogerty EL, Bevan A, Priestley FD (2019) Dust survival rates in clumps passing through the Cas A reverse shock – I. Results for a range of clump densities. MNRAS 489(4):4465–4496. https://doi.org/10.1093/mnras/stz2399. arXiv:1908.10875 [astro-ph.SR]
- Kirchschlager et al. (2020) Kirchschlager F, Barlow MJ, Schmidt FD (2020) Silicate Grain Growth due to Ion Trapping in Oxygen-rich Supernova Remnants like Cassiopeia A. ApJ 893(1):70. https://doi.org/10.3847/1538-4357/ab7db8. arXiv:2003.03380 [astro-ph.SR]
- Kirchschlager et al. (2022) Kirchschlager F, Mattsson L, Gent FA (2022) Supernova induced processing of interstellar dust: impact of interstellar medium gas density and gas turbulence. MNRAS 509(3):3218–3234. https://doi.org/10.1093/mnras/stab3059. arXiv:2109.01175 [astro-ph.GA]
- Kirchschlager et al. (2023) Kirchschlager F, Schmidt FD, Barlow MJ, De Looze I, Sartorio NS (2023) Dust survival rates in clumps passing through the Cas A reverse shock - II. The impact of magnetic fields. MNRAS 520(4):5042–5064. https://doi.org/10.1093/mnras/stad290. arXiv:2210.06763 [astro-ph.SR]
- Köhler et al. (2015) Köhler M, Ysard N, Jones AP (2015) Dust evolution in the transition towards the denser ISM: impact on dust temperature, opacity, and spectral index. A&A 579:A15. https://doi.org/10.1051/0004-6361/201525646. arXiv:1506.01533
- Kollatschny and Zetzl (2013) Kollatschny W, Zetzl M (2013) Accretion disk wind as explanation for the broad-line region structure in NGC 5548. A&A 551:L6. https://doi.org/10.1051/0004-6361/201220923. arXiv:1301.7704 [astro-ph.CO]
- Kozasa and Hasegawa (1987) Kozasa T, Hasegawa H (1987) Grain Formation through Nucleation Process in Astrophysical Environments. II —Nucleation and Grain Growth Accompanied by Chemical Reaction—. Progress of Theoretical Physics 77(6):1402–1410. https://doi.org/10.1143/PTP.77.1402
- Kozasa et al. (1989) Kozasa T, Hasegawa H, Nomoto K (1989) Formation of Dust Grains in the Ejecta of SN 1987A. ApJ 344:325. https://doi.org/10.1086/167801
- Kozasa et al. (1991) Kozasa T, Hasegawa H, Nomoto K (1991) Formation of dust grains in the ejecta of SN 1987A. II. A&A 249:474
- Kozasa et al. (2009) Kozasa T, Nozawa T, Tominaga N, Umeda H, Maeda K, Nomoto K (2009) Dust in Supernovae: Formation and Evolution. In: Henning T, Grün E, Steinacker J (eds) Cosmic Dust - Near and Far. ASP Conference Series, vol 414. Astronomical Society of the Pacific, p 43. arXiv:0903.0217 [astro-ph.GA]
- Laming and Temim (2020) Laming JM, Temim T (2020) Element Abundances in the Unshocked Ejecta of Cassiopeia A. ApJ 904(2):115. https://doi.org/10.3847/1538-4357/abc1e5. arXiv:2010.07718 [astro-ph.HE]
- Laporte et al. (2017) Laporte N, Ellis RS, Boone F, Bauer FE, Quénard D, Roberts-Borsani GW, Pelló R, Pérez-Fournon I, Streblyanska A (2017) Dust in the Reionization Era: ALMA Observations of a z = 8.38 Gravitationally Lensed Galaxy. ApJ 837(2):L21. https://doi.org/10.3847/2041-8213/aa62aa. arXiv:1703.02039 [astro-ph.GA]
- Larsson et al. (2016) Larsson J, Fransson C, Spyromilio J, Leibundgut B, Challis P, Chevalier RA, France K, Jerkstrand A, Kirshner RP, Lundqvist P, Matsuura M, McCray R, Smith N, Sollerman J, Garnavich P, Heng K, Lawrence S, Mattila S, Migotto K, Sonneborn G, Taddia F, Wheeler JC (2016) Three-dimensional Distribution of Ejecta in Supernova 1987A at 10,000 Days. ApJ 833(2):147. https://doi.org/10.3847/1538-4357/833/2/147. arXiv:1609.04413 [astro-ph.HE]
- Lau et al. (2020) Lau RM, Eldridge JJ, Hankins MJ, Lamberts A, Sakon I, Williams PM (2020) Revisiting the Impact of Dust Production from Carbon-rich Wolf-Rayet Binaries. ApJ 898(1):74. https://doi.org/10.3847/1538-4357/ab9cb5. arXiv:2006.08695 [astro-ph.SR]
- Lau et al. (2021) Lau RM, Hankins MJ, Kasliwal MM, Bond HE, De K, Jencson JE, Moffat AFJ, Smith N, Williams PM (2021) Revealing Efficient Dust Formation at Low Metallicity in Extragalactic Carbon-rich Wolf-Rayet Binaries. ApJ 909(2):113. https://doi.org/10.3847/1538-4357/abd8cd. arXiv:2011.09732 [astro-ph.GA]
- Lau et al. (2022) Lau RM, Hankins MJ, Han Y, Argyriou I, Corcoran MF, Eldridge JJ, Endo I, Fox OD, Garcia Marin M, Gull TR, Jones OC, Hamaguchi K, Lamberts A, Law DR, Madura T, Marchenko SV, Matsuhara H, Moffat AFJ, Morris MR, Morris PW, Onaka T, Ressler ME, Richardson ND, Russell CMP, Sanchez-Bermudez J, Smith N, Soulain A, Stevens IR, Tuthill P, Weigelt G, Williams PM, Yamaguchi R (2022) Nested dust shells around the Wolf-Rayet binary WR 140 observed with JWST. Nature Astron 6:1308–1316. https://doi.org/10.1038/s41550-022-01812-x. arXiv:2210.06452 [astro-ph.SR]
- Lazzati and Heger (2016) Lazzati D, Heger A (2016) The Interplay between Chemistry and Nucleation in the Formation of Carbonaceous Dust in Supernova Ejecta. ApJ 817(2):134. https://doi.org/10.3847/0004-637X/817/2/134. arXiv:1512.03453 [astro-ph.SR]
- Levesque et al. (2005) Levesque EM, Massey P, Olsen KAG, Plez B, Josselin E, Maeder A, Meynet G (2005) The Effective Temperature Scale of Galactic Red Supergiants: Cool, but Not As Cool As We Thought. ApJ 628(2):973–985. https://doi.org/10.1086/430901. arXiv:astro-ph/0504337 [astro-ph]
- Levesque et al. (2006) Levesque EM, Massey P, Olsen KAG, Plez B, Meynet G, Maeder A (2006) The Effective Temperatures and Physical Properties of Magellanic Cloud Red Supergiants: The Effects of Metallicity. ApJ 645(2):1102–1117. https://doi.org/10.1086/504417. arXiv:astro-ph/0603596 [astro-ph]
- Li et al. (2019) Li Q, Narayanan D, Davé R (2019) The dust-to-gas and dust-to-metal ratio in galaxies from z = 0 to 6. MNRAS 490(1):1425–1436. https://doi.org/10.1093/mnras/stz2684. arXiv:1906.09277 [astro-ph.GA]
- Limongi and Chieffi (2018) Limongi M, Chieffi A (2018) Presupernova Evolution and Explosive Nucleosynthesis of Rotating Massive Stars in the Metallicity Range -3 [Fe/H] 0. ApJS 237(1):13. https://doi.org/10.3847/1538-4365/aacb24. arXiv:1805.09640 [astro-ph.SR]
- Madden et al. (2013) Madden SC, Rémy-Ruyer A, Galametz M, Cormier D, Lebouteiller V, Galliano F, Hony S, Bendo GJ, Smith MWL, Pohlen M, Roussel H, Sauvage M, Wu R, Sturm E, Poglitsch A, Contursi A, Doublier V, Baes M, Barlow MJ, Boselli A, Boquien M, Carlson LR, Ciesla L, Cooray A, Cortese L, de Looze I, Irwin JA, Isaak K, Kamenetzky J, Karczewski OŁ, Lu N, MacHattie JA, O’Halloran B, Parkin TJ, Rangwala N, Schirm MRP, Schulz B, Spinoglio L, Vaccari M, Wilson CD, Wozniak H (2013) An Overview of the Dwarf Galaxy Survey. PASP 125(928):600. https://doi.org/10.1086/671138. arXiv:1305.2628 [astro-ph.GA]
- Maiolino et al. (2006) Maiolino R, Nagao T, Marconi A, Schneider R, Bianchi S, Pedani M, Pipino A, Matteucci F, Cox P, Caselli P (2006) Metals and dust in high redshift AGNs. Mem. Soc. Astron. Ital. 77:643. https://doi.org/10.48550/arXiv.astro-ph/0603261. arXiv:astro-ph/0603261 [astro-ph]
- Maiolino et al. (2023) Maiolino R, Scholtz J, Curtis-Lake E, Carniani S, Baker W, de Graaff A, Tacchella S, Übler H, D’Eugenio F, Witstok J, Curti M, Arribas S, Bunker AJ, Charlot S, Chevallard J, Eisenstein DJ, Egami E, Ji Z, Jones GC, Lyu J, Rawle T, Robertson B, Rujopakarn W, Perna M, Sun F, Venturi G, Williams CC, Willott C (2023) JADES. The diverse population of infant Black Holes at : merging, tiny, poor, but mighty. arXiv e-prints https://doi.org/10.48550/arXiv.2308.01230. arXiv:2308.01230 [astro-ph.GA]
- Mancini et al. (2015) Mancini M, Schneider R, Graziani L, Valiante R, Dayal P, Maio U, Ciardi B, Hunt LK (2015) The dust mass in normal star-forming galaxies. MNRAS 451:L70–L74. https://doi.org/10.1093/mnrasl/slv070. arXiv:1505.01841
- Marassi et al. (2014) Marassi S, Chiaki G, Schneider R, Limongi M, Omukai K, Nozawa T, Chieffi A, Yoshida N (2014) The Origin of the Most Iron-poor Star. ApJ 794:100. https://doi.org/10.1088/0004-637X/794/2/100. arXiv:1409.4424 [astro-ph.SR]
- Marassi et al. (2015) Marassi S, Schneider R, Limongi M, Chieffi A, Bocchio M, Bianchi S (2015) The metal and dust yields of the first massive stars. MNRAS 454:4250–4266. https://doi.org/10.1093/mnras/stv2267. arXiv:1509.08923
- Marassi et al. (2019) Marassi S, Schneider R, Limongi M, Chieffi A, Graziani L, Bianchi S (2019) Supernova dust yields: the role of metallicity, rotation, and fallback. MNRAS 484(2):2587–2604. https://doi.org/10.1093/mnras/sty3323. arXiv:1812.00009 [astro-ph.SR]
- Marigo et al. (2013) Marigo P, Bressan A, Nanni A, Girardi L, Pumo ML (2013) Evolution of thermally pulsing asymptotic giant branch stars – I. The COLIBRI code. MNRAS 434(1):488–526. https://doi.org/10.1093/mnras/stt1034. arXiv:1305.4485 [astro-ph.SR]
- Martínez-González et al. (2019) Martínez-González S, Wünsch R, Silich S, Tenorio-Tagle G, Palouš J, Ferrara A (2019) Supernovae within Pre-existing Wind-blown Bubbles: Dust Injection versus Ambient Dust Destruction. ApJ 887(2):198. https://doi.org/10.3847/1538-4357/ab571b. arXiv:1911.05079 [astro-ph.GA]
- Massey (2003) Massey P (2003) Massive stars in the local group: implications for stellar evolution and star formation. ARA&A 41:15–56. https://doi.org/10.1146/annurev.astro.41.071601.170033
- Massey et al. (2005) Massey P, Plez B, Levesque EM, Olsen KaG, Clayton GC, Josselin E (2005) The Reddening of Red Supergiants: When Smoke Gets in Your Eyes. ApJ 634(2):1286. https://doi.org/10.1086/497065
- Massey et al. (2009) Massey P, Silva DR, Levesque EM, Plez B, Olsen KAG, Clayton GC, Meynet G, Maeder A (2009) Red Supergiants in the Andromeda Galaxy (M31). ApJ 703(1):420–440. https://doi.org/10.1088/0004-637X/703/1/420. arXiv:0907.3767 [astro-ph.GA]
- Mathis et al. (1977) Mathis JS, Rumpl W, Nordsieck KH (1977) The size distribution of interstellar grains. ApJ 217:425–433. https://doi.org/10.1086/155591
- Matsuura et al. (2011) Matsuura M, Dwek E, Meixner M, Otsuka M, Babler B, Barlow MJ, Roman-Duval J, Engelbracht C, Sandstrom K, Lakićević M, van Loon JT, Sonneborn G, Clayton GC, Long KS, Lundqvist P, Nozawa T, Gordon KD, Hony S, Panuzzo P, Okumura K, Misselt KA, Montiel E, Sauvage M (2011) Herschel Detects a Massive Dust Reservoir in Supernova 1987A. Science 333(6047):1258. https://doi.org/10.1126/science.1205983. arXiv:1107.1477 [astro-ph.SR]
- Matsuura et al. (2013) Matsuura M, Woods PM, Owen PJ (2013) The global gas and dust budget of the Small Magellanic Cloud. MNRAS 429(3):2527–2536. https://doi.org/10.1093/mnras/sts521. arXiv:1212.1468 [astro-ph.GA]
- Matsuura et al. (2015) Matsuura M, Dwek E, Barlow MJ, Babler B, Baes M, Meixner M, Cernicharo J, Clayton GC, Dunne L, Fransson C, Fritz J, Gear W, Gomez HL, Groenewegen MAT, Indebetouw R, Ivison RJ, Jerkstrand A, Lebouteiller V, Lim TL, Lundqvist P, Pearson CP, Roman-Duval J, Royer P, Staveley-Smith L, Swinyard BM, van Hoof PAM, van Loon JT, Verstappen J, Wesson R, Zanardo G, Blommaert JADL, Decin L, Reach WT, Sonneborn G, Van de Steene GC, Yates JA (2015) A Stubbornly Large Mass of Cold Dust in the Ejecta of Supernova 1987A. ApJ 800(1):50. https://doi.org/10.1088/0004-637X/800/1/50. arXiv:1411.7381 [astro-ph.SR]
- Matthews et al. (2020) Matthews JH, Knigge C, Higginbottom N, Long KS, Sim SA, Mangham SW, Parkinson EJ, Hewitt HA (2020) Stratified disc wind models for the AGN broad-line region: ultraviolet, optical, and X-ray properties. MNRAS 492(4):5540–5560. https://doi.org/10.1093/mnras/staa136. arXiv:2001.03625 [astro-ph.GA]
- Mattsson and Andersen (2012) Mattsson L, Andersen AC (2012) On the dust abundance gradients in late-type galaxies - II. Analytical models as evidence for massive interstellar dust growth in SINGS galaxies. MNRAS 423:38–48. https://doi.org/10.1111/j.1365-2966.2012.20574.x. arXiv:1201.3374
- Mattsson et al. (2010) Mattsson L, Wahlin R, Höfner S (2010) Dust driven mass loss from carbon stars as a function of stellar parameters . I. A grid of solar-metallicity wind models. A&A 509:A14. https://doi.org/10.1051/0004-6361/200912084. arXiv:0909.1513 [astro-ph.SR]
- Mauron and Huggins (2006) Mauron N, Huggins PJ (2006) Imaging the circumstellar envelopes of AGB stars. A&A 452(1):257–268. https://doi.org/10.1051/0004-6361:20054739. arXiv:astro-ph/0602623 [astro-ph]
- McKee (1989) McKee C (1989) Dust Destruction in the Interstellar Medium. In: Allamandola LJ, Tielens AGGM (eds) Interstellar Dust. IAU Symposium, vol 135. p 431
- McKinnon et al. (2017) McKinnon R, Torrey P, Vogelsberger M, Hayward CC, Marinacci F (2017) Simulating the dust content of galaxies: successes and failures. MNRAS 468:1505–1521. https://doi.org/10.1093/mnras/stx467. arXiv:1606.02714
- Meixner et al. (2006) Meixner M, Gordon KD, Indebetouw R, Hora JL, Whitney B, Blum R, Reach W, Bernard JP, Meade M, Babler B, Engelbracht CW, For BQ, Misselt K, Vijh U, Leitherer C, Cohen M, Churchwell EB, Boulanger F, Frogel JA, Fukui Y, Gallagher J, Gorjian V, Harris J, Kelly D, Kawamura A, Kim S, Latter WB, Madden S, Markwick-Kemper C, Mizuno A, Mizuno N, Mould J, Nota A, Oey MS, Olsen K, Onishi T, Paladini R, Panagia N, Perez-Gonzalez P, Shibai H, Sato S, Smith L, Staveley-Smith L, Tielens AGGM, Ueta T, van Dyk S, Volk K, Werner M, Zaritsky D (2006) Spitzer Survey of the Large Magellanic Cloud: Surveying the Agents of a Galaxy’s Evolution (SAGE). I. Overview and Initial Results. AJ 132(6):2268–2288. https://doi.org/10.1086/508185. arXiv:astro-ph/0606356 [astro-ph]
- Meynet and Maeder (2003) Meynet G, Maeder A (2003) Stellar evolution with rotation. X. Wolf-Rayet star populations at solar metallicity. A&A 404:975–990. https://doi.org/10.1051/0004-6361:20030512. arXiv:astro-ph/0304069 [astro-ph]
- Micelotta et al. (2016) Micelotta ER, Dwek E, Slavin JD (2016) Dust destruction by the reverse shock in the Cassiopeia A supernova remnant. A&A 590:A65. https://doi.org/10.1051/0004-6361/201527350. arXiv:1602.02754
- Micelotta et al. (2018) Micelotta ER, Matsuura M, Sarangi A (2018) Dust in Supernovae and Supernova Remnants II: Processing and Survival. Space Sci. Rev. 214(2):53. https://doi.org/10.1007/s11214-018-0484-7
- Montargès et al. (2023) Montargès M, Cannon E, de Koter A, Khouri T, Lagadec E, Kervella P, Decin L, McDonald I, Homan W, Waters LBFM, Sahai R, Gottlieb CA, Malfait J, Maes S, Pimpanuwat B, Jeste M, Danilovich T, De Ceuster F, Van de Sande M, Gobrecht D, Wallström SHJ, Wong KT, El Mellah I, Bolte J, Herpin F, Richards AMS, Baudry A, Etoka S, Gray MD, Millar TJ, Menten KM, Müller HSP, Plane JMC, Yates J, Zijlstra A (2023) The VLT/SPHERE view of the ATOMIUM cool evolved star sample. I. Overview: Sample characterization through polarization analysis. A&A 671:A96. https://doi.org/10.1051/0004-6361/202245398. arXiv:2301.02081 [astro-ph.SR]
- Nanni et al. (2013) Nanni A, Bressan A, Marigo P, Girardi L (2013) Evolution of thermally pulsing asymptotic giant branch stars - II. Dust production at varying metallicity. MNRAS 434:2390–2417. https://doi.org/10.1093/mnras/stt1175. arXiv:1306.6183 [astro-ph.SR]
- Nanni et al. (2014) Nanni A, Bressan A, Marigo P, Girardi L (2014) Evolution of thermally pulsing asymptotic giant branch stars - III. Dust production at supersolar metallicities. MNRAS 438(3):2328–2340. https://doi.org/10.1093/mnras/stt2348. arXiv:1312.0875 [astro-ph.SR]
- Nanni et al. (2015) Nanni A, Bressan A, Marigo P, Girardi L, Javadi A, van Loon JT (2015) Dust Production from Sub-Solar to Super-Solar Metallicity in Thermally Pulsing Asymptotic Giant Branch Stars. In: Kerschbaum F, Wing RF, Hron J (eds) Why Galaxies Care about AGB Stars III: A Closer Look in Space and Time. Astronomical Society of the Pacific Conference Series, vol 497. p 357. arXiv:1411.3314 [astro-ph.SR]
- Nanni et al. (2016) Nanni A, Marigo P, Groenewegen MAT, Aringer B, Girardi L, Pastorelli G, Bressan A, Bladh S (2016) Constraining dust properties in circumstellar envelopes of C-stars in the Small Magellanic Cloud: optical constants and grain size of carbon dust. MNRAS 462(2):1215–1237. https://doi.org/10.1093/mnras/stw1681. arXiv:1606.09285 [astro-ph.SR]
- Nanni et al. (2018) Nanni A, Marigo P, Girardi L, Rubele S, Bressan A, Groenewegen MAT, Pastorelli G, Aringer B (2018) Estimating the dust production rate of carbon stars in the Small Magellanic Cloud. MNRAS 473(4):5492–5513. https://doi.org/10.1093/mnras/stx2641. arXiv:1710.02591 [astro-ph.SR]
- Nanni et al. (2019) Nanni A, Groenewegen MAT, Aringer B, Rubele S, Bressan A, van Loon JT, Goldman SR, Boyer ML (2019) The mass-loss, expansion velocities, and dust production rates of carbon stars in the Magellanic Clouds. MNRAS 487(1):502–521. https://doi.org/10.1093/mnras/stz1255. arXiv:1904.06702 [astro-ph.SR]
- Nanni et al. (2020) Nanni A, Burgarella D, Theulé P, Côté B, Hirashita H (2020) The gas, metal, and dust evolution in low-metallicity local and high-redshift galaxies. A&A 641:A168. https://doi.org/10.1051/0004-6361/202037833. arXiv:2006.15146 [astro-ph.GA]
- Nath et al. (2008) Nath BB, Laskar T, Shull JM (2008) Dust Sputtering by Reverse Shocks in Supernova Remnants. ApJ 682(2):1055–1064. https://doi.org/10.1086/589224. arXiv:0804.3472 [astro-ph]
- Nehmé et al. (2019) Nehmé C, Kassounian S, Sauvage M (2019) An automated approach for photometer and dust mass calculation of the Crab nebula. Exp Astron 48(1):1–24. https://doi.org/10.1007/s10686-019-09631-1
- Nenkova et al. (2008) Nenkova M, Sirocky MM, Nikutta R, Ivezić Ž, Elitzur M (2008) AGN Dusty Tori. II. Observational Implications of Clumpiness. ApJ 685(1):160–180. https://doi.org/10.1086/590483. arXiv:0806.0512 [astro-ph]
- Niculescu-Duvaz et al. (2021) Niculescu-Duvaz M, Barlow MJ, Bevan A, Milisavljevic D, De Looze I (2021) The dust mass in Cassiopeia A from infrared and optical line flux differences. MNRAS 504(2):2133–2145. https://doi.org/10.1093/mnras/stab932. arXiv:2103.12705 [astro-ph.GA]
- Niculescu-Duvaz et al. (2022) Niculescu-Duvaz M, Barlow MJ, Bevan A, Wesson R, Milisavljevic D, De Looze I, Clayton GC, Krafton K, Matsuura M, Brady R (2022) Dust masses for a large sample of core-collapse supernovae from optical emission line asymmetries: dust formation on 30-year time-scales. MNRAS 515(3):4302–4343. https://doi.org/10.1093/mnras/stac1626. arXiv:2204.14179 [astro-ph.SR]
- Nozawa and Kozasa (2013) Nozawa T, Kozasa T (2013) Formulation of Non-steady-state Dust Formation Process in Astrophysical Environments. ApJ 776(1):24. https://doi.org/10.1088/0004-637X/776/1/24. arXiv:1308.1873 [astro-ph.SR]
- Nozawa et al. (2003) Nozawa T, Kozasa T, Umeda H, Maeda K, Nomoto K (2003) Dust in the Early Universe: Dust Formation in the Ejecta of Population III Supernovae. ApJ 598(2):785–803. https://doi.org/10.1086/379011. arXiv:astro-ph/0307108 [astro-ph]
- Nozawa et al. (2006) Nozawa T, Kozasa T, Habe A (2006) Dust destruction in the high-velocity shocks driven by supernovae in the early universe. ApJ 648:435
- Nozawa et al. (2007) Nozawa T, Kozasa T, Habe A, Dwek E, Umeda H, Tominaga N, Maeda K, Nomoto K (2007) Evolution of Dust in Primordial Supernova Remnants: Can Dust Grains Formed in the Ejecta Survive and Be Injected into the Early Interstellar Medium? ApJ 666:955–966. https://doi.org/10.1086/520621. arXiv:0706.0383
- Nozawa et al. (2008) Nozawa T, Kozasa T, Tominaga N, Sakon I, Tanaka M, Suzuki T, Nomoto K, Maeda K, Umeda H, Limongi M, Onaka T (2008) Early Formation of Dust in the Ejecta of Type Ib SN 2006jc and Temperature and Mass of the Dust. ApJ 684(2):1343–1350. https://doi.org/10.1086/589961. arXiv:0801.2015 [astro-ph]
- Nozawa et al. (2010) Nozawa T, Kozasa T, Tominaga N, Maeda K, Umeda H, Nomoto K, Krause O (2010) Formation and Evolution of Dust in Type IIb Supernovae with Application to the Cassiopeia A Supernova Remnant. ApJ 713(1):356–373. https://doi.org/10.1088/0004-637X/713/1/356. arXiv:0909.4145 [astro-ph.SR]
- Nozawa et al. (2011) Nozawa T, Maeda K, Kozasa T, Tanaka M, Nomoto K, Umeda H (2011) Formation of dust in the ejecta of type Ia supernovae. ApJ 736(1):45. https://doi.org/10.1088/0004-637X/736/1/45
- Nugis and Lamers (2000) Nugis T, Lamers HJGLM (2000) Mass-loss rates of Wolf-Rayet stars as a function of stellar parameters. A&A 360:227
- Omukai et al. (2005) Omukai K, Tsuribe T, Schneider R, Ferrara A (2005) Thermal and Fragmentation Properties of Star-forming Clouds in Low-Metallicity Environments. ApJ 626(2):627–643. https://doi.org/10.1086/429955. arXiv:astro-ph/0503010 [astro-ph]
- Ostriker and McKee (1988) Ostriker JP, McKee CF (1988) Astrophysical blastwaves. Rev Mod Phys 60(1):1–68. https://doi.org/10.1103/RevModPhys.60.1
- Otsuka et al. (2010) Otsuka M, van Loon JT, Long KS, Meixner M, Matsuura M, Reach WT, Roman-Duval J, Gordon K, Sauvage M, Hony S, Misselt K, Engelbracht C, Panuzzo P, Okumura K, Woods PM, Kemper F, Sloan GC (2010) Dust in the bright supernova remnant N49 in the LMC. A&A 518:L139. https://doi.org/10.1051/0004-6361/201014642. arXiv:1005.2787 [astro-ph.CO]
- Owen and Barlow (2015) Owen PJ, Barlow MJ (2015) The Dust and Gas Content of the Crab Nebula. ApJ 801(2):141. https://doi.org/10.1088/0004-637X/801/2/141. arXiv:1501.01510 [astro-ph.GA]
- Paquette and Nuth (2011) Paquette JA, Nuth I Joseph A (2011) The Lack of Chemical Equilibrium does not Preclude the use of Classical Nucleation Theory in Circumstellar Outflows. ApJ 737(1):L6. https://doi.org/10.1088/2041-8205/737/1/L6
- Pipino et al. (2011) Pipino A, Fan XL, Matteucci F, Calura F, Silva L, Granato G, Maiolino R (2011) The chemical evolution of elliptical galaxies with stellar and QSO dust production. A&A 525:A61. https://doi.org/10.1051/0004-6361/201014843. arXiv:1008.3875 [astro-ph.CO]
- Popping et al. (2017) Popping G, Somerville RS, Galametz M (2017) The dust content of galaxies from z = 0 to z = 9. MNRAS 471(3):3152–3185. https://doi.org/10.1093/mnras/stx1545. arXiv:1609.08622 [astro-ph.GA]
- Priestley et al. (2020) Priestley FD, Barlow MJ, De Looze I, Chawner H (2020) Dust masses and grain size distributions of a sample of Galactic pulsar wind nebulae. MNRAS 491(4):6020–6031. https://doi.org/10.1093/mnras/stz3434. arXiv:1912.02117 [astro-ph.GA]
- Priestley et al. (2022a) Priestley FD, Arias M, Barlow MJ, De Looze I (2022a) Dust destruction and survival in the Cassiopeia A reverse shock. MNRAS 509(3):3163–3171. https://doi.org/10.1093/mnras/stab3195. arXiv:2111.01151 [astro-ph.GA]
- Priestley et al. (2022b) Priestley FD, De Looze I, Barlow MJ (2022b) The impact of metallicity-dependent dust destruction on the dust-to-metals ratio in galaxies. MNRAS 509(1):L6–L10. https://doi.org/10.1093/mnrasl/slab114. arXiv:2110.06952 [astro-ph.GA]
- Raban et al. (2009) Raban D, Jaffe W, Röttgering H, Meisenheimer K, Tristram KRW (2009) Resolving the obscuring torus in NGC 1068 with the power of infrared interferometry: revealing the inner funnel of dust. MNRAS 394(3):1325–1337. https://doi.org/10.1111/j.1365-2966.2009.14439.x. arXiv:0901.1306 [astro-ph.GA]
- Raiteri et al. (1996) Raiteri CM, Villata M, Navarro JF (1996) Simulations of Galactic chemical evolution. I. O and Fe abundances in a simple collapse model. A&A 315:105–115
- Rauscher et al. (2002) Rauscher T, Heger A, Hoffman RD, Woosley SE (2002) Nucleosynthesis in Massive Stars with Improved Nuclear and Stellar Physics. ApJ 576(1):323–348. https://doi.org/10.1086/341728. arXiv:astro-ph/0112478 [astro-ph]
- Rémy-Ruyer et al. (2014) Rémy-Ruyer A, Madden SC, Galliano F, Galametz M, Takeuchi TT, Asano RS, Zhukovska S, Lebouteiller V, Cormier D, Jones A, Bocchio M, Baes M, Bendo GJ, Boquien M, Boselli A, DeLooze I, Doublier-Pritchard V, Hughes T, Karczewski OŁ, Spinoglio L (2014) Gas-to-dust mass ratios in local galaxies over a 2 dex metallicity range. A&A 563:A31. https://doi.org/10.1051/0004-6361/201322803. arXiv:1312.3442 [astro-ph.GA]
- Rho et al. (2018) Rho J, Gomez HL, Boogert A, Smith MWL, Lagage PO, Dowell D, Clark CJR, Peeters E, Cami J (2018) A dust twin of Cas A: cool dust and 21 m silicate dust feature in the supernova remnant G54.1+0.3. MNRAS 479(4):5101–5123. https://doi.org/10.1093/mnras/sty1713. arXiv:1707.08230 [astro-ph.GA]
- Rho et al. (2022) Rho J, Ravi A, Chastenet J, De Looze I, Hoang T, Dunne L, Jones A, Kirchschlager F, Matsuura M, Gomez H, Barlow M (2022) Far-IR polarization and dust properties in the supernova remnant Cas A using SOFIA HAWC+. Bull AAS 54(6). URL https://baas.aas.org/pub/2022n6i133p02
- Riebel et al. (2012) Riebel D, Srinivasan S, Sargent B, Meixner M (2012) The Mass-loss Return from Evolved Stars to the Large Magellanic Cloud. VI. Luminosities and Mass-loss Rates on Population Scales. ApJ 753(1):71. https://doi.org/10.1088/0004-637X/753/1/71. arXiv:1205.0280 [astro-ph.SR]
- Roman-Duval et al. (2017) Roman-Duval J, Bot C, Chastenet J, Gordon K (2017) Dust Abundance Variations in the Magellanic Clouds: Probing the Life-cycle of Metals with All-sky Surveys. ApJ 841:72. https://doi.org/10.3847/1538-4357/aa7067. arXiv:1705.03049
- Roman-Duval et al. (2021) Roman-Duval J, Jenkins EB, Tchernyshyov K, Williams B, Clark CJR, Gordon KD, Meixner M, Hagen L, Peek J, Sandstrom K, Werk J, Yanchulova Merica-Jones P (2021) METAL: The Metal Evolution, Transport, and Abundance in the Large Magellanic Cloud Hubble Program. II. Variations of Interstellar Depletions and Dust-to-gas Ratio within the LMC. ApJ 910(2):95. https://doi.org/10.3847/1538-4357/abdeb6. arXiv:2101.09399 [astro-ph.GA]
- Rouillé et al. (2014) Rouillé G, Jäger C, Krasnokutski SA, Krebsz M, Henning T (2014) Cold condensation of dust in the ISM. Faraday Discuss 168:449–460. https://doi.org/10.1039/C4FD00010B. arXiv:1502.00388 [astro-ph.GA]
- Rouillé et al. (2020) Rouillé G, Jäger C, Henning T (2020) Separate Silicate and Carbonaceous Solids Formed from Mixed Atomic and Molecular Species Diffusing in Neon Ice. ApJ 892(2):96. https://doi.org/10.3847/1538-4357/ab7a11. arXiv:2002.10728 [astro-ph.GA]
- Rowlands et al. (2014) Rowlands K, Gomez HL, Dunne L, Aragón-Salamanca A, Dye S, Maddox S, da Cunha E, van der Werf P (2014) The dust budget crisis in high-redshift submillimetre galaxies. MNRAS 441(2):1040–1058. https://doi.org/10.1093/mnras/stu605. arXiv:1403.2995 [astro-ph.GA]
- Saintonge et al. (2018) Saintonge A, Wilson CD, Xiao T, Lin L, Hwang HS, Tosaki T, Bureau M, Cigan PJ, Clark CJR, Clements DL, De Looze I, Dharmawardena T, Gao Y, Gear WK, Greenslade J, Lamperti I, Lee JC, Li C, Michałowski MJ, Mok A, Pan HA, Sansom AE, Sargent M, Smith MWL, Williams T, Yang C, Zhu M, Accurso G, Barmby P, Brinks E, Bourne N, Brown T, Chung A, Chung EJ, Cibinel A, Coppin K, Davies J, Davis TA, Eales S, Fanciullo L, Fang T, Gao Y, Glass DHW, Gomez HL, Greve T, He J, Ho LC, Huang F, Jeong H, Jiang X, Jiao Q, Kemper F, Kim JH, Kim M, Kim T, Ko J, Kong X, Lacaille K, Lacey CG, Lee B, Lee JH, Lee WK, Masters K, Oh SH, Papadopoulos P, Park C, Park SJ, Parsons H, Rowlands K, Scicluna P, Scudder JM, Sethuram R, Serjeant S, Shao Y, Sheen YK, Shi Y, Shim H, Smith CMA, Spekkens K, Tsai AL, Verma A, Urquhart S, Violino G, Viti S, Wake D, Wang J, Wouterloot J, Yang Y, Yim K, Yuan F, Zheng Z (2018) JINGLE, a JCMT legacy survey of dust and gas for galaxy evolution studies - I. Survey overview and first results. MNRAS 481(3):3497–3519. https://doi.org/10.1093/mnras/sty2499. arXiv:1809.07336 [astro-ph.GA]
- Sarangi and Cherchneff (2013) Sarangi A, Cherchneff I (2013) The Chemically Controlled Synthesis of Dust in Type II-P Supernovae. ApJ 776:107. https://doi.org/10.1088/0004-637X/776/2/107. arXiv:1309.5887 [astro-ph.SR]
- Sarangi and Cherchneff (2015) Sarangi A, Cherchneff I (2015) Condensation of dust in the ejecta of Type II-P supernovae. A&A 575:A95. https://doi.org/10.1051/0004-6361/201424969. arXiv:1412.5522 [astro-ph.SR]
- Sarangi et al. (2018) Sarangi A, Matsuura M, Micelotta ER (2018) Dust in Supernovae and Supernova Remnants I: Formation Scenarios. Space Sci. Rev. 214(3):63. https://doi.org/10.1007/s11214-018-0492-7
- Sarangi et al. (2019) Sarangi A, Dwek E, Kazanas D (2019) Dust Formation in AGN Winds. ApJ 885(2):126. https://doi.org/10.3847/1538-4357/ab46a9. arXiv:1909.10426 [astro-ph.GA]
- Savage and Sembach (1996) Savage BD, Sembach KR (1996) Interstellar Abundances from Absorption-Line Observations with the Hubble Space Telescope. ARA&A 34:279–330. https://doi.org/10.1146/annurev.astro.34.1.279
- Schneider and Omukai (2010) Schneider R, Omukai K (2010) Metals, dust and the cosmic microwave background: fragmentation of high-redshift star-forming clouds. MNRAS 402(1):429–435. https://doi.org/10.1111/j.1365-2966.2009.15891.x. arXiv:0910.3665 [astro-ph.CO]
- Schneider et al. (2004) Schneider R, Ferrara A, Salvaterra R (2004) Dust formation in very massive primordial supernovae. MNRAS 351(4):1379–1386. https://doi.org/10.1111/j.1365-2966.2004.07876.x. arXiv:astro-ph/0307087 [astro-ph]
- Schneider et al. (2012) Schneider R, Omukai K, Bianchi S, Valiante R (2012) The first low-mass stars: critical metallicity or dust-to-gas ratio? MNRAS 419(2):1566–1575. https://doi.org/10.1111/j.1365-2966.2011.19818.x. arXiv:1109.2900 [astro-ph.CO]
- Schneider et al. (2016) Schneider R, Hunt L, Valiante R (2016) The dust content of the most metal-poor star-forming galaxies. MNRAS 457(2):1842–1850. https://doi.org/10.1093/mnras/stw114. arXiv:1601.01686 [astro-ph.GA]
- Seab (1987) Seab CG (1987) Grain destruction, formation, and evolution. In: Hollenbach DJ, Thronson HA Jr (eds) Interstellar Processes. Astrophysics and Space Science Library, vol 134. D. Reidel, Dordrecht, pp 491–512. https://doi.org/10.1007/978-94-009-3861-8˙18
- Shahbandeh et al. (2023) Shahbandeh M, Sarangi A, Temim T, Szalai T, Fox OD, Tinyanont S, Dwek E, Dessart L, Filippenko AV, Brink TG, Foley RJ, Jencson J, Pierel J, Zsíros S, Rest A, Zheng W, Andrews J, Clayton GC, De K, Engesser M, Gezari S, Gomez S, Gonzaga S, Johansson J, Kasliwal M, Lau R, De Looze I, Marston A, Milisavljevic D, O’Steen R, Siebert M, Skrutskie M, Smith N, Strolger L, Van Dyk SD, Wang Q, Williams B, Williams R, Xiao L, Yang Y (2023) JWST observations of dust reservoirs in type IIP supernovae 2004et and 2017eaw. MNRAS 523(4):6048–6060. https://doi.org/10.1093/mnras/stad1681. arXiv:2301.10778 [astro-ph.HE]
- Sibbons et al. (2015) Sibbons LF, Ryan SG, Irwin M, Napiwotzki R (2015) The AGB population in IC 1613 using JHK photometry. A&A 573:A84. https://doi.org/10.1051/0004-6361/201423982. arXiv:1409.5071 [astro-ph.GA]
- Silvia et al. (2010) Silvia DW, Smith BD, Shull JM (2010) Numerical Simulations of Supernova Dust Destruction. I. Cloud-crushing and Post-processed Grain Sputtering. ApJ 715:1575–1590. https://doi.org/10.1088/0004-637X/715/2/1575. arXiv:1001.4793
- Silvia et al. (2012) Silvia DW, Smith BD, Shull JM (2012) Numerical Simulations of Supernova Dust Destruction. II. Metal-enriched Ejecta Knots. ApJ 748:12. https://doi.org/10.1088/0004-637X/748/1/12. arXiv:1111.0302
- Slavin et al. (2015) Slavin JD, Dwek E, Jones AP (2015) Destruction of Interstellar Dust in Evolving Supernova Remnant Shock Waves. ApJ 803:7. https://doi.org/10.1088/0004-637X/803/1/7. arXiv:1502.00929
- Slavin et al. (2020) Slavin JD, Dwek E, Mac Low MM, Hill AS (2020) The Dynamics, Destruction, and Survival of Supernova-formed Dust Grains. ApJ 902(2):135. https://doi.org/10.3847/1538-4357/abb5a4. arXiv:2009.01895 [astro-ph.HE]
- Sluder et al. (2018) Sluder A, Milosavljević M, Montgomery MH (2018) Molecular nucleation theory of dust formation in core-collapse supernovae applied to SN 1987A. MNRAS 480(4):5580–5624. https://doi.org/10.1093/mnras/sty2060. arXiv:1612.09013 [astro-ph.SR]
- Smartt (2009) Smartt SJ (2009) Progenitors of Core-Collapse Supernovae. ARA&A 47(1):63–106. https://doi.org/10.1146/annurev-astro-082708-101737. arXiv:0908.0700 [astro-ph.SR]
- Smartt (2015) Smartt SJ (2015) Observational Constraints on the Progenitors of Core-Collapse Supernovae: The Case for Missing High-Mass Stars. PASA 32:e016. https://doi.org/10.1017/pasa.2015.17. arXiv:1504.02635 [astro-ph.SR]
- Smith (2013) Smith N (2013) The Crab nebula and the class of Type IIn-P supernovae caused by sub-energetic electron-capture explosions. MNRAS 434(1):102–113. https://doi.org/10.1093/mnras/stt1004. arXiv:1304.0689 [astro-ph.HE]
- Srinivasan et al. (2016) Srinivasan S, Boyer ML, Kemper F, Meixner M, Sargent BA, Riebel D (2016) The evolved-star dust budget of the Small Magellanic Cloud: the critical role of a few key players. MNRAS 457(3):2814–2838. https://doi.org/10.1093/mnras/stw155. arXiv:1601.04710 [astro-ph.SR]
- Starrfield et al. (2016) Starrfield S, Iliadis C, Hix WR (2016) The Thermonuclear Runaway and the Classical Nova Outburst. PASP 128(963):051001. https://doi.org/10.1088/1538-3873/128/963/051001. arXiv:1605.04294 [astro-ph.SR]
- Steinhardt et al. (2022) Steinhardt CL, Sneppen A, Hensley H, Jermyn AS, Mostafa B, Weaver JR, Brammer G, Clark TH, Davidzon I, Diaconu AC, Mobasher B, Rusakov V, Toft S (2022) Implications of a Temperature-dependent Initial Mass Function. III. Mass Growth and Quiescence. ApJ 934(1):22. https://doi.org/10.3847/1538-4357/ac7642. arXiv:2206.01750 [astro-ph.GA]
- Tamura et al. (2019) Tamura Y, Mawatari K, Hashimoto T, Inoue AK, Zackrisson E, Christensen L, Binggeli C, Matsuda Y, Matsuo H, Takeuchi TT, Asano RS, Sunaga K, Shimizu I, Okamoto T, Yoshida N, Lee MM, Shibuya T, Taniguchi Y, Umehata H, Hatsukade B, Kohno K, Ota K (2019) Detection of the Far-infrared [O III] and Dust Emission in a Galaxy at Redshift 8.312: Early Metal Enrichment in the Heart of the Reionization Era. ApJ 874(1):27. https://doi.org/10.3847/1538-4357/ab0374. arXiv:1806.04132 [astro-ph.GA]
- Tchernyshyov et al. (2015) Tchernyshyov K, Meixner M, Seale J, Fox A, Friedman SD, Dwek E, Galliano F (2015) Elemental Depletions in the Magellanic Clouds and the Evolution of Depletions with Metallicity. ApJ 811(2):78. https://doi.org/10.1088/0004-637X/811/2/78. arXiv:1503.08852 [astro-ph.GA]
- Temim and Dwek (2013) Temim T, Dwek E (2013) The Importance of Physical Models for Deriving Dust Masses and Grain Size Distributions in Supernova Ejecta. I. Radiatively Heated Dust in the Crab Nebula. ApJ 774(1):8. https://doi.org/10.1088/0004-637X/774/1/8. arXiv:1302.5452 [astro-ph.GA]
- Temim et al. (2017) Temim T, Dwek E, Arendt RG, Borkowski KJ, Reynolds SP, Slane P, Gelfand JD, Raymond JC (2017) A Massive Shell of Supernova-formed Dust in SNR G54.1+0.3. ApJ 836(1):129. https://doi.org/10.3847/1538-4357/836/1/129. arXiv:1701.01117 [astro-ph.GA]
- Tielens et al. (1994) Tielens AGGM, McKee CF, Seab CG, Hollenbach DJ (1994) The Physics of Grain-Grain Collisions and Gas-Grain Sputtering in Interstellar Shocks. ApJ 431:321. https://doi.org/10.1086/174488
- Todini and Ferrara (2001) Todini P, Ferrara A (2001) Dust formation in primordial Type II supernovae. MNRAS 325(2):726–736. https://doi.org/10.1046/j.1365-8711.2001.04486.x. arXiv:astro-ph/0009176 [astro-ph]
- Tosi et al. (2023) Tosi S, Kamath D, Dell’Agli F, Van Winckel H, Ventura P, Marchetti T, Marini E, Tailo M (2023) A study of carbon-rich post-AGB stars in the Milky Way to understand the production of carbonaceous dust from evolved stars. A&A 673:A41. https://doi.org/10.1051/0004-6361/202245563. arXiv:2302.13677 [astro-ph.SR]
- Tristram et al. (2014) Tristram KRW, Burtscher L, Jaffe W, Meisenheimer K, Hönig SF, Kishimoto M, Schartmann M, Weigelt G (2014) The dusty torus in the Circinus galaxy: a dense disk and the torus funnel. A&A 563:A82. https://doi.org/10.1051/0004-6361/201322698. arXiv:1312.4534 [astro-ph.GA]
- Truelove and McKee (1999) Truelove JK, McKee CF (1999) Evolution of Nonradiative Supernova Remnants. ApJS 120(2):299–326. https://doi.org/10.1086/313176
- Tsai and Mathews (1995) Tsai JC, Mathews WG (1995) Interstellar Grains in Elliptical Galaxies: Grain Evolution. ApJ 448:84. https://doi.org/10.1086/175943. arXiv:astro-ph/9502053 [astro-ph]
- Valiante et al. (2009) Valiante R, Schneider R, Bianchi S, Andersen AC (2009) Stellar sources of dust in the high-redshift Universe. MNRAS 397:1661–1671. https://doi.org/10.1111/j.1365-2966.2009.15076.x. arXiv:0905.1691
- Valiante et al. (2012) Valiante R, Schneider R, Maiolino R, Salvadori S, Bianchi S (2012) Quasar feedback in the early Universe: the case of SDSS J1148+5251. MNRAS 427:L60–L64. https://doi.org/10.1111/j.1745-3933.2012.01345.x. arXiv:1205.3488
- Valiante et al. (2014) Valiante R, Schneider R, Salvadori S, Gallerani S (2014) High-redshift quasars host galaxies: is there a stellar mass crisis? MNRAS 444:2442–2455. https://doi.org/10.1093/mnras/stu1613. arXiv:1409.2873
- van Loon et al. (2005) van Loon JT, Cioni MRL, Zijlstra AA, Loup C (2005) An empirical formula for the mass-loss rates of dust-enshrouded red supergiants and oxygen-rich Asymptotic Giant Branch stars. A&A 438(1):273–289. https://doi.org/10.1051/0004-6361:20042555. arXiv:astro-ph/0504379 [astro-ph]
- Velilla-Prieto et al. (2023) Velilla-Prieto L, Fonfría JP, Agúndez M, Castro-Carrizo A, Guélin M, Quintana-Lacaci G, Cherchneff I, Joblin C, McCarthy MC, Martín-Gago JA, Cernicharo J (2023) Atmospheric molecular blobs shape up circumstellar envelopes of AGB stars. Nature 617(7962):696–700. https://doi.org/10.1038/s41586-023-05917-9
- Venemans et al. (2018) Venemans BP, Decarli R, Walter F, Bañados E, Bertoldi F, Fan X, Farina EP, Mazzucchelli C, Riechers D, Rix HW, Wang R, Yang Y (2018) Dust Emission in an Accretion-rate-limited Sample of z 6 Quasars. ApJ 866(2):159. https://doi.org/10.3847/1538-4357/aadf35. arXiv:1809.01662 [astro-ph.GA]
- Ventura et al. (1998) Ventura P, Zeppieri A, Mazzitelli I, D’Antona F (1998) Full spectrum of turbulence convective mixing: I. theoretical main sequences and turn-off for . A&A 334:953–968
- Ventura et al. (2012a) Ventura P, di Criscienzo M, Schneider R, Carini R, Valiante R, D’Antona F, Gallerani S, Maiolino R, Tornambé A (2012a) Dust formation around AGB and SAGB stars: a trend with metallicity? MNRAS 424:2345–2357. https://doi.org/10.1111/j.1365-2966.2012.21403.x. arXiv:1205.6216 [astro-ph.SR]
- Ventura et al. (2012b) Ventura P, di Criscienzo M, Schneider R, Carini R, Valiante R, D’Antona F, Gallerani S, Maiolino R, Tornambé A (2012b) The transition from carbon dust to silicate production in low-metallicity asymptotic giant branch and super-asymptotic giant branch stars. MNRAS 420:1442–1456. https://doi.org/10.1111/j.1365-2966.2011.20129.x
- Ventura et al. (2014) Ventura P, Dell’Agli F, Schneider R, Di Criscienzo M, Rossi C, La Franca F, Gallerani S, Valiante R (2014) Dust from asymptotic giant branch stars: relevant factors and modelling uncertainties. MNRAS 439(1):977–989. https://doi.org/10.1093/mnras/stu028. arXiv:1401.1332 [astro-ph.SR]
- Ventura et al. (2018) Ventura P, Karakas A, Dell’Agli F, García-Hernández DA, Guzman-Ramirez L (2018) Gas and dust from solar metallicity AGB stars. MNRAS 475(2):2282–2305. https://doi.org/10.1093/mnras/stx3338. arXiv:1712.08582 [astro-ph.SR]
- Vogelsberger et al. (2019) Vogelsberger M, McKinnon R, O’Neil S, Marinacci F, Torrey P, Kannan R (2019) Dust in and around galaxies: dust in cluster environments and its impact on gas cooling. MNRAS 487(4):4870–4883. https://doi.org/10.1093/mnras/stz1644. arXiv:1811.05477 [astro-ph.GA]
- Volonteri et al. (2021) Volonteri M, Habouzit M, Colpi M (2021) The origins of massive black holes. Nature Rev Phys 3(11):732–743. https://doi.org/10.1038/s42254-021-00364-9. arXiv:2110.10175 [astro-ph.GA]
- Walmswell and Eldridge (2012) Walmswell JJ, Eldridge JJ (2012) Circumstellar dust as a solution to the red supergiant supernova progenitor problem. MNRAS 419(3):2054–2062. https://doi.org/10.1111/j.1365-2966.2011.19860.x. arXiv:1109.4637 [astro-ph.SR]
- Wang et al. (2021) Wang F, Yang J, Fan X, Hennawi JF, Barth AJ, Banados E, Bian F, Boutsia K, Connor T, Davies FB, Decarli R, Eilers AC, Farina EP, Green R, Jiang L, Li JT, Mazzucchelli C, Nanni R, Schindler JT, Venemans B, Walter F, Wu XB, Yue M (2021) A Luminous Quasar at Redshift 7.642. ApJ 907(1):L1. https://doi.org/10.3847/2041-8213/abd8c6. arXiv:2101.03179 [astro-ph.GA]
- Wang et al. (2008) Wang R, Carilli CL, Wagg J, Bertoldi F, Walter F, Menten KM, Omont A, Cox P, Strauss MA, Fan X, Jiang L, Schneider DP (2008) Thermal Emission from Warm Dust in the Most Distant Quasars. ApJ 687(2):848–858. https://doi.org/10.1086/591076. arXiv:0806.3022 [astro-ph]
- Weingartner and Draine (1999) Weingartner JC, Draine BT (1999) Interstellar Depletion onto Very Small Dust Grains. ApJ 517(1):292–298. https://doi.org/10.1086/307197. arXiv:astro-ph/9812469 [astro-ph]
- Wesson and Bevan (2021) Wesson R, Bevan A (2021) Observational Limits on the Early-time Dust Mass in SN 1987A. ApJ 923(2):148. https://doi.org/10.3847/1538-4357/ac2eb8. arXiv:2111.06896 [astro-ph.SR]
- Wesson et al. (2015) Wesson R, Barlow MJ, Matsuura M, Ercolano B (2015) The timing and location of dust formation in the remnant of SN 1987A. MNRAS 446(2):2089–2101. https://doi.org/10.1093/mnras/stu2250. arXiv:1410.7386 [astro-ph.SR]
- Wesson et al. (2023) Wesson R, Bevan AM, Barlow MJ, De Looze I, Matsuura M, Clayton G, Andrews J (2023) Evidence for late-time dust formation in the ejecta of supernova SN 1995N from emission-line asymmetries. MNRAS 525(4):4928–4941. https://doi.org/10.1093/mnras/stad2505. arXiv:2308.09028 [astro-ph.SR]
- Williams et al. (2013) Williams BJ, Borkowski KJ, Ghavamian P, Hewitt JW, Mao SA, Petre R, Reynolds SP, Blondin JM (2013) Azimuthal Density Variations around the Rim of Tycho’s Supernova Remnant. ApJ 770(2):129. https://doi.org/10.1088/0004-637X/770/2/129. arXiv:1305.0567 [astro-ph.HE]
- Witstok et al. (2023) Witstok J, Shivaei I, Smit R, Maiolino R, Carniani S, Curtis-Lake E, Ferruit P, Arribas S, Bunker AJ, Cameron AJ, Charlot S, Chevallard J, Curti M, de Graaff A, D’Eugenio F, Giardino G, Looser TJ, Rawle T, Rodríguez del Pino B, Willott C, Alberts S, Baker WM, Boyett K, Egami E, Eisenstein DJ, Endsley R, Hainline KN, Ji Z, Johnson BD, Kumari N, Lyu J, Nelson E, Perna M, Rieke M, Robertson BE, Sandles L, Saxena A, Scholtz J, Sun F, Tacchella S, Williams CC, Willmer CNA (2023) Carbonaceous dust grains seen in the first billion years of cosmic time. arXiv e-prints arXiv:2302.05468. https://doi.org/10.48550/arXiv.2302.05468. arXiv:2302.05468 [astro-ph.GA]
- Wooden et al. (1993) Wooden DH, Rank DM, Bregman JD, Witteborn FC, Tielens AGGM, Cohen M, Pinto PA, Axelrod TS (1993) Airborne Spectrophotometry of SN 1987A from 1.7 to 12.6 Microns: Time History of the Dust Continuum and Line Emission. ApJS 88:477. https://doi.org/10.1086/191830
- Woosley and Weaver (1995) Woosley SE, Weaver TA (1995) The Evolution and Explosion of Massive Stars. II. Explosive Hydrodynamics and Nucleosynthesis. ApJS 101:181. https://doi.org/10.1086/192237
- Ysard et al. (2015) Ysard N, Köhler M, Jones A, Miville-Deschênes MA, Abergel A, Fanciullo L (2015) Dust variations in the diffuse interstellar medium: constraints on Milky Way dust from Planck-HFI observations. A&A 577:A110. https://doi.org/10.1051/0004-6361/201425523. arXiv:1503.07435 [astro-ph.GA]
- Zavala et al. (2021) Zavala JA, Casey CM, Manning SM, Aravena M, Bethermin M, Caputi KI, Clements DL, Cunha Ed, Drew P, Finkelstein SL, Fujimoto S, Hayward C, Hodge J, Kartaltepe JS, Knudsen K, Koekemoer AM, Long AS, Magdis GE, Man AWS, Popping G, Sanders D, Scoville N, Sheth K, Staguhn J, Toft S, Treister E, Vieira JD, Yun MS (2021) The Evolution of the IR Luminosity Function and Dust-obscured Star Formation over the Past 13 Billion Years. ApJ 909(2):165. https://doi.org/10.3847/1538-4357/abdb27. arXiv:2101.04734 [astro-ph.GA]
- Zhukovska (2014) Zhukovska S (2014) Dust origin in late-type dwarf galaxies: ISM growth vs. type II supernovae. A&A 562:A76. https://doi.org/10.1051/0004-6361/201322989. arXiv:1401.1675
- Zhukovska et al. (2008) Zhukovska S, Gail HP, Trieloff M (2008) Evolution of interstellar dust and stardust in the solar neighbourhood. A&A 479(2):453–480. https://doi.org/10.1051/0004-6361:20077789. arXiv:0706.1155 [astro-ph]
- Zhukovska et al. (2016) Zhukovska S, Dobbs C, Jenkins EB, Klessen RS (2016) Modeling Dust Evolution in Galaxies with a Multiphase, Inhomogeneous ISM. ApJ 831:147. https://doi.org/10.3847/0004-637X/831/2/147. arXiv:1608.04781