The ALMA REBELS survey: obscured star formation in massive Lyman-break galaxies at – revealed by the IRX– and relations
Abstract
We investigate the degree of dust obscured star formation in 49 massive () Lyman-break galaxies (LBGs) at – observed as part of the ALMA Reionization Era Bright Emission Line Survey (REBELS) large program. By creating deep stacks of the photometric data and the REBELS ALMA measurements we determine the average rest-frame UV, optical and far-infrared (FIR) properties which reveal a significant fraction (–) of obscured star formation, consistent with previous studies. From measurements of the rest-frame UV slope, we find that the brightest LBGs at these redshifts show bluer () colours than expected from an extrapolation of the colour-magnitude relation found at fainter magnitudes. Assuming a modified blackbody spectral-energy distribution (SED) in the FIR (with dust temperature of and ), we find that the REBELS sources are in agreement with the local “Calzetti-like” starburst Infrared-excess (IRX)- relation. By reanalysing the data available for 108 galaxies at – from the ALPINE ALMA large program using a consistent methodology and assumed FIR SED, we show that from –, massive galaxies selected in the rest-frame UV have no appreciable evolution in their derived – relation. When comparing the – relation derived from the combined ALPINE and REBELS sample to relations established at , we find a deficit in the IRX, indicating that at the proportion of obscured star formation is lower by a factor of at a given a . Our – results are in good agreement with the high-redshift predictions of simulations and semi-analytic models for galaxies with similar stellar masses and SFRs.
keywords:
galaxies: high-redshift – galaxies: evolution – ISM: dust, extinction1 Introduction
The onset of dust creation represents a milestone in the history of the Universe, as it relies on the adequate enrichment of the galaxy with metals, formation of sufficient dust particles in high-redshift supernova and inter-stellar medium (ISM) properties conducive to the survival (and growth) of dust (e.g. Draine, 2003; Mancini et al., 2016; Gall & Hjorth, 2018; Leśniewska & Michałowski, 2019; Graziani et al., 2020; Dayal et al., 2022; Di Cesare et al., 2023). The presence of dust within galaxies can be detected through the reddening of the rest-frame UV and optical light in addition to emission in the mid and far-infrared (FIR). The measurement of the rest-frame FIR modified blackbody emission provides a direct signal of the presence of dust, whereas changes in the rest-frame UV colours can be attributed to other properties of the galaxy such as older ages and an increased metallicity. The majority of the highest-redshift galaxies found within deep optical to near-infrared (NIR) surveys have been shown to have blue rest-frame UV slopes (parameterised as , ), leading to the inference of young ages and low dust content (Dunlop et al., 2012; Bouwens et al., 2014). In the past decade however, the direct detection of dust continuum emission in individual or small samples of galaxies (e.g. Tamura et al., 2019; Wong et al., 2022; Hygate et al., 2023; Hashimoto et al., 2023) has revealed the presence of dust within galaxies less than 800 Myr after the Big Bang.
Observations of star-forming galaxies in the rest-frame FIR have demonstrated the key importance of considering dust obscured star-formation in galaxy evolution, with more than half of ongoing star formation being obscured at cosmic noon (; see review by Madau & Dickinson, 2014). There is evidence that obscured star formation continues to be important, and potentially dominates the total cosmic SFR density (CSFRD) in the range , from measurements based on rest-frame UV selected samples (e.g. Novak et al. 2017; Khusanova et al. 2021) and highly dust-obscured galaxies including serendipitous objects (e.g. Gruppioni et al., 2020; Talia et al., 2021; Loiacono et al., 2021), as well as deep ALMA and radio surveys (e.g. Zavala et al., 2021; van der Vlugt et al., 2022). Recent results extending these measurements to from Barrufet et al. (2023) have shown that dust obscured star-formation contributes at least 10 percent of the cosmic star-formation rate density, showing that it remains significant even into the Epoch of Reionization. These results have revealed a strong stellar mass dependence of the obscuration (e.g. Pannella et al., 2009, 2015; Bouwens et al., 2016; Whitaker et al., 2017), with Dunlop et al. (2017) demonstrating that at the fraction of obscured SFR rises from at up to 0.99 at , an effect which appears to extend to (although with a lower normalisation; Algera et al., 2023b). Direct detections of the dust continuum emission from galaxies at have been made in galaxies selected from galaxies representing a wide range of intrinsic rest-frame UV luminosities for example fainter sources from lensing fields (e.g. Watson et al., 2015; Laporte et al., 2017; Tamura et al., 2019; Bakx et al., 2021; Hashimoto et al., 2023) and brighter galaxies from wide-area ground-based follow-up (e.g. Bowler et al. 2018, 2022; Schouws et al. 2022; Inami et al. 2022; Witstok et al. 2022). The obscured fraction derived from these works depends on the assumed FIR spectral-energy distribution (e.g. typically the dust temperature; and the emissivity index; ), however in general these detections reveal a significant fraction – of obscured star-formation at for galaxies of (Dayal et al., 2022; Algera et al., 2023b).
The attenuation curve, which dictates how an intrinsic spectrum is reduced in the rest-frame UV and optical as a function of wavelength for a given optical depth, depends on the detailed properties of the dust grains and their geometric distribution (see Salim & Narayanan, 2020 for a review). To directly measure the attenuation curve requires a handle on the intrinsic stellar spectra before the effect of dust, a technique that has been successfully employed at – (e.g. Cullen et al., 2018; Shivaei et al., 2020b). An alternative method is to compare the rest-frame UV slope, , to the ratio of the FIR to UV luminosity (infrared-excess ) as the steepness of the attenuation (or extinction) curve changes the relation between IRX and to maintain energy balance. The so called “–” diagram for local starburst galaxies shows a strong correlation presented originally in Meurer et al. (1999) and then further refined in Calzetti et al. (2000). Whether this canonical Calzetti-relation holds at higher redshifts () has been the topic of debate over the past decade. An alternative to the Calzetti-like attenuation curve is the steeper relation that has been found for the Small Magellanic Cloud (SMC). Note that the SMC relation is an extinction as opposed to an attenuation curve, and there is an ongoing discussion on whether it is expected that observations of galaxies will be consistent with an SMC extinction curve when the likely complex geometry of dust is taken into account (e.g. see discussion in Cullen et al. (2018). In this case, the same column density of dust can provide an increased reddening effect in the rest-frame UV and hence a deficit from the Calzetti-like relation. Initial observations of – galaxies with ALMA suggested such a deficit was found (e.g. Capak et al., 2015; Barisic et al., 2017), however other studies (Bowler et al., 2018, 2022; Schouws et al., 2022) found results consistent with the Calzetti-like –. Note that the discrepancy between these studies is reduced if we consider that the first works typically assumed dust temperatures of –, while later works tended to use higher temperatures (). However the observation of several galaxies at that lie below the SMC prediction is still present with higher temperatures as shown by Faisst et al., 2017. Furthermore, individual sources at have been found to show significant scatter both above and below a Calzetti-like relation (Smit et al., 2018; Hashimoto et al., 2019; Bakx et al., 2020), while fainter (and likely lower mass) sources appear to show an upper limit that is even below the prediction of an SMC-like extinction curve (Fujimoto et al., 2016; Bouwens et al., 2016).
One key uncertainty in the measurement of the – and – relations at increasingly high redshifts is that even at there are very few individual detections of dust continuum emission from galaxies at (e.g. Dunlop et al., 2017; Bouwens et al., 2020). Because of this many studies at rely on stacking analyses of large numbers of individually undetected galaxies within rest-frame FIR survey data (e.g. from SCUBA-2; Koprowski et al., 2018) or alternatively small samples of often inhomogeneously detected samples from multiple follow-up programs with ALMA. In addition to the reliance on stacking or small samples, there are several systematic uncertainties that have precluded a deeper understanding of the – relation at high redshift. The first is the uncertain FIR Spectral-energy distribution (SED) in the galaxies of interest, as the majority of early studies rely on measurements in the rest-frame FIR at typically one frequency. The derived FIR luminosity is strongly dependent on the assumed SED (; see discussion in e.g. Behrens et al., 2018; Liang et al., 2019; Sommovigo et al., 2020) and where individual dust temperature measurements have been made a wide variation has been found in the derived – (Witstok et al., 2023). Second, the position of a galaxy with respect to the – relation depends sensitively on the geometry of the dust and stars, as has been shown in theoretical works (e.g. Popping et al., 2017; Narayanan et al., 2018; Ferrara et al., 2022; Pallottini et al., 2022; Vijayan et al., 2023). Early resolved observations have shown that there appears to be an anti-correlation between the position of the rest-frame UV and FIR emission, suggesting a complex geometry that could impact the observed – (Faisst et al., 2017; Carniani et al., 2017; Bowler et al., 2018; Inami et al., 2022; Hashimoto et al., 2023; Tamura et al., 2023).
The result of these studies is an uncertain picture of how the commonly observed rest-frame UV emission in LBGs is connected to any obscured star formation at (see Hodge & da Cunha, 2020 for a recent summary). To make progress in understanding obscured star formation in LBGs what is required is a statistical survey of homogeneously selected galaxies with deep observations probing the dust continuum. In this work we utilise a comprehensive survey of 49 rare, massive () galaxies at – observed as part of the ALMA REBELS large program (Bouwens et al., 2022). The majority of these sources were selected from wide-area, ground-based data over and they probe bright rest-frame UV magnitudes and hence the bright-end of the rest-frame UV luminosity function at this epoch (e.g. Bowler et al. 2017; Harikane et al. 2022; Varadaraj et al. 2023). We also perform a consistent analysis of the ALMA ALPINE large program (Le Fèvre et al., 2020; Béthermin et al., 2020; Faisst et al., 2020b) to provide a measurement of the evolving – and – relations from to using the most comprehensive homogeneous samples of galaxies observed with ALMA. REBELS provides a unique sample of galaxies with direct dust detections (or strong upper limits) to constrain the – and – relation within the Epoch of Reionization (EoR). This work builds upon the previous observational REBELS papers from Inami et al. (2022), Algera et al. (2023b), and Barrufet et al. (2023) and theoretical analyses tailored specifically to describe the REBELS observations from Dayal et al. (2022), Sommovigo et al. (2022a) and Ferrara et al. (2022).
The structure of this paper is as follows. In Section 2 we describe our sample from REBELS and ALPINE, presenting the ALMA observations in addition to the archival optical and NIR data that we utilize. We present the methods and results in Section 3, in particular the stacking analysis and SED fitting. In Section 4 we present the resulting colour-magnitude relation, physical properties from SED fitting and the – relation. In Section 5 we discuss our results and present a new derivation of the – relation from –, and we compare our ALPINE + REBELS results to the predictions from simulations in Section 6. We end with our conclusions in Section 7. Throughout this work we present magnitudes in the AB system (Oke & Gunn, 1983). The standard concordance cosmology (Planck Collaboration et al., 2020) is assumed, with , and .
2 Data
In this work we combine rest-frame UV, optical and FIR measurements to understand the dust properties of – galaxies. The rest-frame UV and optical information is provided by deep degree-scale extragalactic survey observations that have the required wavelength coverage from multiple photometric bands to select these galaxies via the redshifted Lyman break. The rest-frame FIR measurements come from targeted ALMA programs to follow-up these bright sources and provide a direct detection or upper limit on the dust-continuum emission.
2.1 REBELS
The REBELS survey is a Cycle 7 ALMA large program that observed 40 LBGs with the primary goal to measure the [CII] or [OIII] emission line. The sources were found within the ground-based Cosmological Evolution Survey (COSMOS; Scoville et al., 2007) and the XMM-Newton Large Scale Structure (XMM-LSS; Pierre et al., 2004) surveys, with the addition of two sources from HST surveys (REBELS-16 and REBELS-40). We also include 9 sources that were observed as part of the REBELS pilot programs as presented in Smit et al. (2018) and Schouws et al. (2022), resulting in a final sample containing 49 galaxies. The primary selection criterion was that the source redshift lay securely at as determined by three independent SED fitting codes. The galaxies are bright in the rest-frame UV, with absolute magnitudes (measured at Å in the rest-frame) in the range . REBELS observed each source using between two and six spectral tunings to cover the frequency range of likely FIR line emission given the photometric redshift probability distribution. As presented in Bouwens et al. (2022), Inami et al. (2022), Schouws et al. (2023, in prep), and van Leeuwen et al. (2023, in prep), 25 galaxies have been spectroscopically confirmed via the [CII] line (with no [OIII] confirmations to-date). In addition, these observations simultaneously allowed a measurement of the dust-continuum emission, with 18 sources detected in the continuum at by Inami et al. (2022). The [CII] line (if detected) was masked in the continuum images. The typical continuum depth of the Band 6 or 7 data (approximately and depending on exact line scan frequencies) was – with a beam of – full width at half maximum (FWHM).
2.2 ALPINE
The ALPINE survey is an ALMA large program awarded in Cycle 5 that aimed at detecting the [CII] line and dust continuum emission in 118 galaxies at – (Le Fèvre et al., 2020; Béthermin et al., 2020). The sources were selected from a large red-optical spectroscopic survey of “normal” star-forming galaxies within the COSMOS and Extended-Chandra Deep Field South (ECDFS) fields. The resulting sample consisted of 67 sources with spectroscopic redshifts from Lyman emission or rest-frame UV absorption features between – and 51 objects at – (Faisst et al., 2020a). Both Lyman-break selection and narrow-band selections were utilized (with more narrow-band sources in the sub-sample), leading to a relatively high average rest-frame EW of Ly of –Å (Cassata et al., 2020). In comparison to REBELS, where none of the sources had spectroscopic redshifts prior to the ALMA program, this leads to a different selection function for galaxies, which we discuss further in Section 5. As presented in Fudamoto et al. (2020b), 23 galaxies were detected at significance in the dust continuum in the original ALPINE survey (8 sources at ). Several sources have been further followed-up in multiple bands (e.g. HZ4 and HZ6; see Faisst et al., 2020b). The typical depth of the ALPINE Band 7 data (–) was for the () samples, with an average beam of FWHM (Béthermin et al., 2020).
2.3 Optical and near-infrared imaging
To measure the rest-frame UV slopes of the REBELS and ALPINE galaxies, in addition to physical properties such as stellar mass, we exploited the wealth of available optical and NIR imaging data. The details of the photometry for the REBELS sample is presented in Bouwens et al. (2022) and Stefanon et al. (in prep), however we briefly describe the relevant data here. In the COSMOS (XMM-LSS) field we used the UltraVISTA (VIDEO) survey from VISTA which provided imaging in the NIR -bands (McCracken et al., 2012; Jarvis et al., 2013). A subset of (fainter) galaxies were additionally located within a sub-region of the XMM-LSS field that has deeper observations in the from the UK Infrared Deep Sky Survey (Lawrence et al., 2007) Ultra-Deep Survey (UDS). Spitzer/Infrared Array Camera (IRAC) photometry was extracted from the deep mosaics presented in Stefanon et al. (in prep.), in particular from the Spitzer Extended Deep Survey (SEDS; Ashby et al., 2013) and the Spitzer Matching Survey of the UltraVISTA Ultra-deep Stripes (SMUVS; Ashby et al., 2018). Photometry was extracted using diameter apertures ( for IRAC) on images where the neighbouring sources had been subtracted using MOPHONGO (Labbé et al., 2015). The aperture flux was corrected to total according to the MOPHONGO model for the galaxy. As several of the very bright () REBELS sources were resolved in the ground-based data (Bowler et al., 2017), this step was important in deriving accurate absolute magnitudes and physical properties. Errors on the photometry were derived from empty aperture measurements on the data.
For the ALPINE sample we used the photometry provided in the COSMOS2020 catalogue (Weaver et al., 2022) which provided point-spread function (PSF) matched flux measurements for the full suite of optical and NIR filters available in the field. In comparison to the COSMOS2015 catalogue that was utilised in the original ALPINE papers (as presented in Faisst et al. 2020a), the COSMOS2020 catalogue has deeper data in a range of filters. Particularly for this work, the optical (from Subaru) and near-infrared (from UltraVISTA DR4) data are up to 1 magnitude deeper, providing significantly improved measurements of the rest-frame UV slope and derived stellar masses. We used the ‘Classic’ catalogue that provides photometry measured in diameter apertures. In the COSMOS2020 catalogue this aperture photometry is corrected to a total flux by a constant factor determined from the Source Extractor MAG_AUTO. From the full ALPINE catalogue of 118 sources, ten sources lie within the ECDFS. To provide a sample with uniform photometry from the COSMOS2020 catalogue, we excluded these ten sources from further analysis, leaving a final ALPINE sample of 108 galaxies.
3 Methods
The primary goal of this work is to measure the rest-frame UV and FIR properties of the 49 bright – LBGs observed as part of the REBELS survey. We also include for comparison a consistent analysis of the ALPINE sample in the COSMOS field, to provide a base-line reaching down to . We measure the properties of individual sources from both surveys, but also perform a stacking analysis to derive average properties within bins of and . Due to the relatively low fraction of sources that are directly detected in the dust continuum (0.43 for REBELS, 0.19 for ALPINE), stacking is a key tool to understand the dust continuum properties of galaxies within this sample. Here we describe the key methods used in this work. Where possible we used identical approaches for the REBELS and ALPINE analysis to provide a direct comparison between galaxies spanning to .
3.1 Stacking analysis
The ALPINE and REBELS samples span a range of redshifts leading to different rest-frame features being observed in our available optical and NIR data. We therefore separate our sample into two redshift bins in ALPINE and three within REBELS. The two ALPINE bins correspond to – and –, which are the two main redshift groupings within the sample. All ALPINE sources were observed in the same ALMA band (Band 7). In REBELS we split the sample into three bins, by increasing redshift as detailed below. We excluded the HST selected sources REBELS-16 and REBELS-40 from the stacks as they have different rest-frame optical and NIR filters available. The first bin included galaxies at – (20 galaxies), with the second bin included galaxies in the range – (20 galaxies). This separation at was chosen as it is the point at which the Lyman break starts to move into the VISTA -band and is also when the H+[OIII] rest-frame optical lines move from the to the band. The 40 sources within these two bins had observations in ALMA Band 6. The third and final REBELS bin included the seven galaxies that have . Four of these sources have ALMA Band 7 observations that were designed to target the [OIII] line. These sources have photometric redshifts in the range –, however none have been spectroscopically confirmed to-date. Due to the wide range of photometric redshifts in this bin, and the differing ALMA measurement bands, we do not create a stack from this sub-sample. However, we present their individual – properties for comparison with our stacks. We further choose to split the sample using as this provided the greatest dynamic range in the derivation of the – and – relation, while also not suffering from biases (as the and values have significant statistical errors, scatter between bins can lead to biases; see e.g. McLure et al. 2018). The bins we used for REBELS are shown in Table 1. We split the sub-samples by () at () to provide roughly equal sources with the brighter/fainter absolute magnitude bins. For ALPINE we split by for both redshift bins, and in addition we separate into two stellar mass bins to take into account the wider range of values within the sample. The ALPINE bins are detailed in Table 3. By restricting the and ranges slightly, we result in a final ALPINE sample of 54 galaxies within the bin and 32 within the bin.
We performed weighted mean stacking of the ALMA continuum data in the specified bins in the image plane. Our results are unchanged if we instead use a median stacking procedure. Due to the majority of sources in the REBELS and ALPINE samples being undetected in the ALMA data we stack at the position of the observed rest-frame UV. We note that this could cause an underestimate of the peak ALMA flux if there exists significant offsets between the rest-frame UV and FIR emission (e.g. as simulated in Bowler et al., 2018). Given the large beam of the REBELS and ALPINE observations, and the relatively small absolute offsets found for these samples (e.g. Le Fèvre et al., 2020; Inami et al., 2022, we expect the effect to be small. Indeed, as described in Section 3.4, only the most massive ALPINE stack shows evidence for extended emission, which we attribute partially to offsets between the rest-frame UV and FIR positions. We take this into account in the flux measurement by using a Gaussian fit to the stack.
Foreground sources were masked based on a map of objects derived from PyBDSF (Mohan & Rafferty, 2015), excluding pixels within a radius of ″ from the rest-frame UV centroid of the galaxy. The majority of sources did not have any neighbours at the depth of the ALMA imaging. Errors on the stacked flux measurements were determined by remaking each stack using bootstrap resampling with replacement. To determine the mean optical and NIR photometric measurements we averaged the fluxes from the REBELS and COSMOS2020 catalogues (Section 2.3). We also experimented with stacking the images themselves, however we concluded that it was not possible to improve on the flux stacking results, due to close neighbours contaminating the flux measurements. This contamination was taken into account in our catalogue creation, with nearby sources being subtracted prior to aperture photometry (see Section 2.3). For ALPINE we use the COSMOS2020 ‘Classic’ aperture photometry measurements where basic subtraction of neighbours is performed. We visually checked the ALPINE sources in the COSMOS optical and NIR imaging, but found that they are all sufficiently isolated for the catalogue fluxes to be robust.
3.2 SED fitting
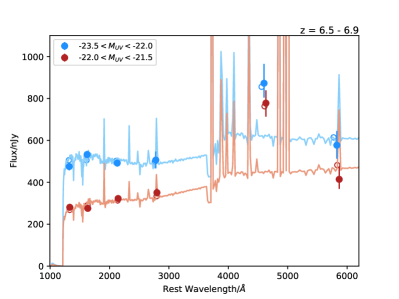
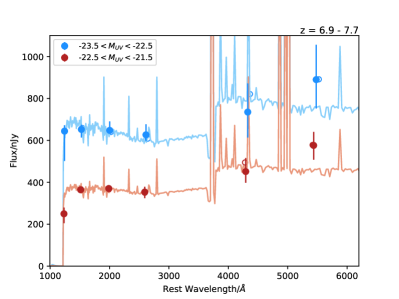
We fit the photometric data for the individual REBELS and ALPINE sources (and the derived stacks) using BAGPIPES (Carnall et al., 2018) to provide a best-fitting model with which to measure the rest-frame UV slope. The fitting also provides physical properties for the stacks, which we include in particular for measuring the – relation. We fix the redshift to the spectroscopic redshift when available (28 sources in REBELS, all of the sources in ALPINE), and for the stacked photometry we fix the redshift to the average redshift. We found that using a luminosity-weighted redshift instead of an average had no effect on our results, as the difference was . We include bands above the Lyman-break reaching to the filter, beyond which the resolution and depth decreases dramatically. We also exclude bands that contain the Lyman-break in the fitting of the stacked photometry, as the small differences in break position within the band lead to tensions within the fitting. Hence for REBELS, we fit to the bands for the – sub-sample stack, and to the bands for the stack. The resulting photometry and best-fitting SED models for the REBELS stacks are shown in Fig. 1. For ALPINE, we fit to the bands for the stack, and to the bands for the stack. A delayed- model was assumed () in which the timescale of the decline was allowed to vary in the range and the age from up to the age of the Universe at that redshift. The metallicity was fixed to , and the Calzetti et al. (2000) dust law was assumed with the attenuation in the -band constrained to the range . We allowed the nebular ionization parameter to vary in the range . Uniform priors were assumed for all of the fitted parameters. These parameters resulted in acceptable fits to the REBELS sources as seen in Fig. 1, with no evidence for truncation of the resulting corner plots. Assuming a different SFH (e.g. constant or ) or metallicity only marginally affected the by at most and the derived values by . Note that assuming a non-parametric SFH for the REBEL sample as presented in Topping et al. (2022) can increase the derived stellar masses by on average and in some cases . To provide a closer comparison to previous literature measurements of the – we primarily consider the values derived with standard parametric SFHs, however we note where relevant how our results would change with an assumed alternate SFH. For the ALPINE sample, Faisst et al. (2020b) found that the -value derived depended on the assumed dust law in the fitting. We also recover this trend in our sample, with the dervied -slopes being redder by around when fitting with an SMC dust law in comparison to a Calzetti law.

| bin | N | IRX | ||||||
|---|---|---|---|---|---|---|---|---|
| 6.5 < z < 6.9 | 7 | 6.76 | ||||||
| 6.5 < z < 6.9 | 13 | 6.67 | ||||||
| 6.9 < z < 7.7 | 6 | 7.11 | ||||||
| 6.9 < z < 7.7 | 14 | 7.26 |
3.3 Rest-frame UV luminosity and slope determination
The monochromatic rest-frame UV luminosity was derived at Å using a top-hat filter of width Å applied to the best-fitting SED model from BAGPIPES for both the REBELS and ALPINE stacked photometry. We note that the aperture photometry for both the REBELS catalogue and COSMOS2020 have been corrected to a total flux accounting for the full extent of the galaxy, and hence the derived can be considered a total absolute magnitude. We found a systematic offset brightwards of between the ALPINE absolute magnitudes presented in Faisst et al. (2020b) and those found in our analysis, with some sources having considerable offsets reaching . Further inspection reveals this to be due to the improved photometry between the COSMOS2015 and COSMOS2020 catalogues. The rest-frame UV slope is historically defined from a series of windows in the continuum from –Å (Calzetti et al., 1994). Different methods for measuring from the available photometric data in high-redshift galaxies have been extensively discussed, including the fitting of a power law or a power law with a Lyman-break to the photometry directly or to the fit SED model (e.g. Dunlop et al., 2012; Rogers et al., 2013). In this work we measure from the best-fitting SED model derived from BAGPIPES (see Section 3.2), excluding regions that are outside of the Calzetti windows, to avoid strong absorption or emission features. Errors were derived using a bootstrap analysis, where we restacked the photometry and re-fit using BAGPIPES. Comparing the derived values to those presented in the original ALPINE analysis (Faisst et al., 2020b), with find on average a very mild bias to bluer slopes by in our analysis, when comparing results obtained by fitting assuming the same dust attenuation law. The scatter between individual objects can be large (up to ), but is within the errors of the derived values.
3.4 Rest-frame FIR luminosity derivation
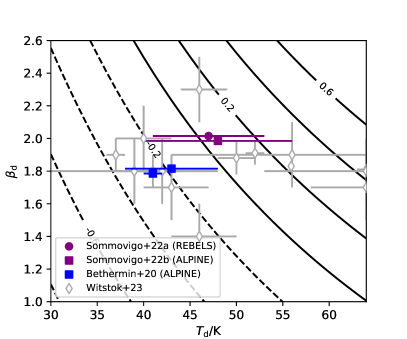
Using PyBDSF (Mohan & Rafferty, 2015) we measured both the peak flux and flux derived from a Gaussian fit for the individual sources and the stacked ALMA data. We found that our stacked results were consistent with being unresolved for (i.e. the full REBELS sample and low-mass sub-sample of ALPINE). We define an unresolved source if the measured major and minor axes from PyBDSF are consistent with the beam size within the error (again derived within PyBDSF). Hence we used the peak flux measure in these cases. For the ALPINE sample at we instead used the Gaussian flux measurement, as the derived sizes from PyBDSF were significantly resolved. From the single data-point in the observed mm-regime from ALMA in Band 6 for ALPINE and Band 6 or 7 for REBELS we determined the total FIR luminosity by assuming a modified blackbody SED. We corrected for the effect of the Cosmic Microwave Background following da Cunha et al. (2013), which results in an increase in the by 10 percent for the REBELS sample. While some sources within the two surveys have been observed in multiple ALMA bands (Algera et al., 2023a), we choose here to provide a uniform measure of from the single main band that is available for the full REBELS + ALPINE samples. For the analysis presented in this work we assumed a single fixed dust temperature of , with an opacity fixed to (consistent with that recently measured by Witstok et al., 2023). This dust temperature was derived by the model of Sommovigo et al. (2022a) and was used by Inami et al. (2022). When showing the – relation we illustrate with an arrow the uncertainty introduced by this assumption. We keep the dust temperature constant between the ALPINE and REBELS analysis, following the analysis presented in Sommovigo et al. (2022a, b) who found that the dust temperatures between the samples were consistent at despite the different redshifts. This finding was not expected given that other studies have found a redshift evolution in , however the exact form of the relation is still under debate especially at (e.g. Sommovigo et al., 2022a; Witstok et al., 2023; Jones & Stanway, 2023. For example the trend found by Schreiber et al. (2018) up to would predict a change of around between the redshifts of the ALPINE and REBELS results. As we discuss further in Section 4.4 even this small temperature difference can have an appreciable effect on the derived IRX and hence – and – relations. The dust temperature constraints that exist for the individual ALPINE (Faisst et al., 2017) and REBELS (Witstok et al., 2022; Algera et al., 2023a) galaxies are consistent with our chosen within the (substantial) errors, and show best-fit values from to . Due to the lack of measurements for the vast majority of our sample, we are unable to account for this in our analysis and leave it to a future work.
4 Results
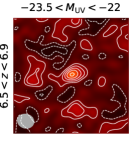
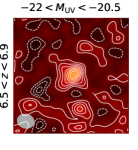
In Fig. 1 we present the stacked photometry and best-fitting SED model for the REBELS sample, split into the two main redshift (and further two bins) as shown in Table 1. The results of stacking the ALMA data in these bins are shown in Fig. 2. We find a significant (–) detection in the fainter -bin for both the and the stacks. In the brighter stacks we find marginal detections in the dust continuum, at and for the and the stack respectively. The fluxes we derive are consistent with that found in the independent analysis of the REBELS sample by Algera et al. (2023b), who used a Monte Carlo stacking analysis to measure a correlation of with stellar mass. From these ALMA detections we then proceeded to compute the and combine this with the rest-frame UV information (, rest-frame UV slope) and the stellar mass as derived from BAGPIPES as detailed below.
4.1 Physical properties
The splitting of the bright REBELS sample into two redshift bins separated at allows us to provide high-S/N stacks of the rest-frame UV and optical emission where the strong H + [OIII] lines sit within a single or band. As shown in Fig. 1 we find that the REBELS sources are blue in the rest-frame UV, as probed by the bands, with strong – colours evident. As we move to we see a change in the IRAC colour indicative of H+[OIII] moving into the -band. The derived SED fitting parameters from this photometry including stellar mass and age are presented in Table 2. As expected from the individually results for REBELS presented in Bouwens et al. (2022), the galaxies are massive, with , and moderate ages of the order of –. The derived dust attenuation is relatively low, as expected from the fact that the sample is rest-frame UV selected and shows blue slopes (see Section 4.2). Our most significantly FIR detected stack has the reddest and strongest . We measure the unobscured SFR from the rest-frame UV emission using the luminosity at 1500Å and the conversion of Madau & Dickinson (2014) for a constant SFR in the previous 100 Myr and a fixed metallicity of . The SFR from the FIR was derived using the conversion based on the same assumptions on the SFH from Madau & Dickinson (2014), which provides an identical calibration to that used in the previous REBELS work by Algera et al., 2023b. Both calibrations were adjusted to a Chabrier (2003) initial mass function (IMF). The total SFR measured as the sum of these two components () is in good agreement with that derived from the SED fitting.
| bin | bin | Age | |||||||
|---|---|---|---|---|---|---|---|---|---|
| /Myr | /mag | ||||||||
| 6.5 < z < 6.9 | |||||||||
| 6.5 < z < 6.9 | |||||||||
| 6.9 < z < 7.7 | |||||||||
| 6.9 < z < 7.7 |
4.2 Colour-magnitude relation at
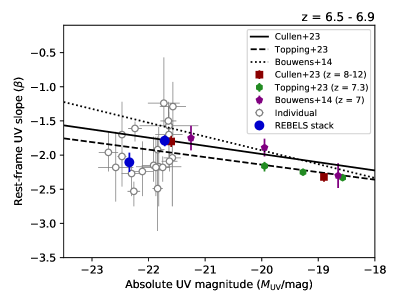
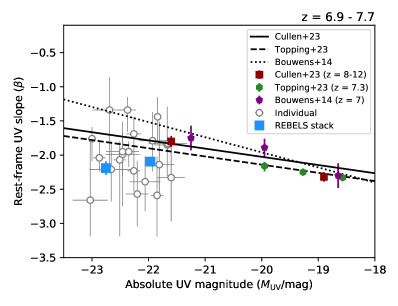
In Fig. 3 we present the rest-frame UV slopes of the REBELS sources, and the stacks, in comparison to colour-magnitude relations from recent literature measurements. The REBELS sample allows us to measure the colour-magnitude relation up to , which is considerably brighter than the typical galaxies found and studied previously using HST or JWST data that are typically dominated by sources at . We find that the REBELS galaxies show a range of rest-frame UV slopes, with , with many measured -slopes dominated by large errors (). Reassuringly, our values derived from the stacked photometry follow the distribution of individual values. We compare our results to the extrapolated relations from fainter sources derived at using HST data by Bouwens et al. (2014), and the two recent JWST results by Topping et al. (2023) at and by Cullen et al. (2023) at – (here we use the redshift evolution applied to the slope found Rogers et al., 2014). These studies computed by fitting a power law the available photometry probing the rest-frame UV. At we find good agreement with these relations in our fainter bin, however we see that our brighter stack has a significantly bluer -slope than expected from the extrapolated colour-magnitude relations from previous studies at fainter magnitudes. At the offset bluewards from the colour-magnitude relations is between – depending on the study. Looking at the slightly higher redshift bin at we find an offset to bluer values by in both the brighter and fainter stack. Our results support a flattening, and potentially even a turn-over, of the colour-magnitude relationship at , with these galaxies showing a mean colour of in contrast to the predicted colour of to from the relations extrapolated from fainter LBGs. As we discuss further in Section 5, this turn over can be explained by the effect of scatter in the obscuration when considering sources that have a steeply declining number density.
In the measurement of the colour-magnitude relationship we must consider any effect of sample selection and -measurement bias in the results we obtain. It is possible that we could be missing redder galaxies due to the requirement that the sources show good high-redshift fits and poorer quality fits to (typically redder) low-redshift galaxy contaminants. As shown in Fig. 3 we are able to measure -values as red as for the sources in our sample, even at the faint end, whereas we do not find significant numbers of the brightest sources to be as red (even though the increased S/N should make bright, red, sources easier to identify than similarly red, fainter sources). The REBELS sample selection is not only based on the rest-frame UV bands but also includes the and bands in the SED fitting. The Spitzer/IRAC colour aids in the selection of robust galaxies due to the specific colours produced by the rest-frame optical nebular emission lines in the and bands (Smit et al., 2015). Using these filters could be biasing our sample towards bluer slopes by potentially selecting young galaxies with stronger nebular emission. We discount this however, as the distribution of the of the REBELS sample is in excellent agreement with samples that are selected only based on a strong Lyman break (see figure 18 of Bouwens et al., 2022). In fact, because these colours are challenging to reproduce by low-redshift galaxy contaminants it can aid in the recovery of good high-redshift galaxy fits to sources with redder rest-frame UV slopes (e.g. in Endsley et al., 2021; see Stefanon in prep. for individual SED fits). Hence we conclude that our measurements of the rest-frame UV slope of the REBELS LBGs are unlikely to be significantly biased, with the caveat that we only select sources that are bright in the rest-frame UV, and hence will be incomplete to the most obscured galaxies (with the extreme situation being fully ‘UV-dark’ galaxies as found in e.g. Fudamoto et al., 2021).
4.3 – relation at from REBELS

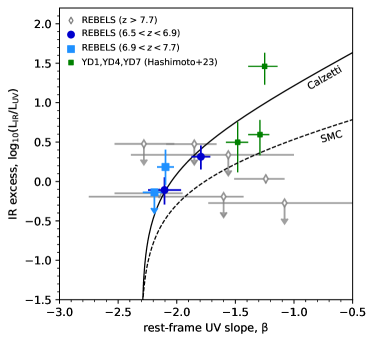
In Fig. 4 we present the – relation derived from the REBELS sample in the redshift range . We also show the derived values for individual sources, of which there are 18 detections at from Inami et al. (2022). These results (both individual galaxies and for the stacks) were computed with the assumption of a modified blackbody FIR SED, with an assumed dust temperature of and (Section 3.4). The individual results show a large scatter horizontally on the plot as a result of the large errors in individual measurements of the rest-frame UV slope. We find that the majority of this range in observed rest-frame UV slopes in the sample can be explained with statistical scatter, with the intrinsic variation as a function of derived to be of the order of – for REBELS (see Table 1). Rather the scatter can be explained simply due to the large errors on the individual measurements, which we have demonstrated via a simple simulation assuming the sample is drawn from a constant input with the same measurement errors. With our assumed rest-frame FIR SED, based on the work of Sommovigo et al. (2022a), we do not confirm any sources significantly below the SMC-like – relation as found by previous high-redshift studies (e.g. Barisic et al. 2017; Faisst et al. 2017; Smit et al. 2018; note that these works assumed a lower –). Although at the depths of our observations, 31 of the 49 sources in REBELS are undetected in the dust continuum and hence the IRX values represent upper limits. We see one source that is significantly in excess of the others, with . This is the unusually FIR bright object REBELS-25 that is discussed further in Hygate et al. (2023). This source is included in our stacks, however our results are unchanged if it is removed. These data are shown in comparison to the expected relation for a Calzetti et al. (2000) dust attenuation and SMC dust extinction law, assuming an intrinsic -slope, . This intrinsic slope is consistent with that found in detailed SED fitting of comparable mass sources at (McLure et al., 2018) and similar to that found in simulations of galaxies at (e.g. Cullen et al., 2018 found ). We present a fit to the – relation, and fits from previous works at higher redshift, that include a steeper intrinsic in Section 4.4. We find no strong correlation between the offset from a Calzetti-like relation and , , or spatial offset between the rest-frame UV and FIR flux (from Inami et al. 2022). There is a weak trend that the FIR brightest galaxies tend to be above the relation, such as REBELS-25 (as has been seen for ULIRGS; see discussion below).
Turning to the stacked results, we present four individual points corresponding to the two different redshift and bins. For the sub-sample we see that the brighter and fainter stack shows significantly different rest-frame UV slopes, with the brighter stack () appearing bluer, while simultaneously being fainter in the FIR. The brighter stack also shows a lower ALMA detected flux, and hence a lower IRX both from a higher and a reduced . The same trend is seen for the galaxies in the sub-sample, however here as both stacks are blue in the rest-frame UV (and the brighter stack is undetected in the FIR), we have a reduced dynamic range in . Overall, we find, somewhat counter-intuitively to the consensus colour-magnitude relation (Section 4.2 and Fig. 3), that the rest-frame UV brightest galaxies in REBELS are bluer than the sources at slightly fainter magnitudes. As expected by the canonical – relation, we find the bluer sources show a reduced IRX, and this is driven primarily due to a reduced (although as we have previously described, note that galaxy age, dust SED and star-dust geometry can alter the expected relation; e.g. Popping et al., 2017).
4.3.1 Comparison to previous studies at
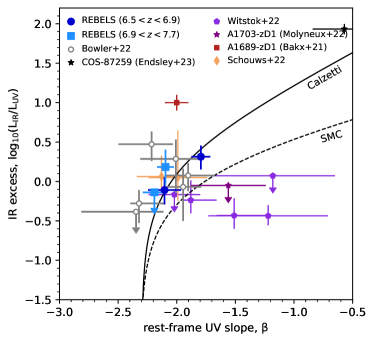
In Fig. 5 we compare our REBELS results with those from previous studies at . We find that our stacked results are in good agreement with the previous measurements derived from luminous LBGs in Schouws et al. (2022) and Bowler et al. (2022). There are a handful of sources with redder rest-frame UV slopes and low IRX-values found within the study of Witstok et al. (2022), although we note that the measured -slopes are relatively uncertain in these cases. Molyneux et al. (2022) found a red rest-frame UV slope and an upper limit on the dust continuum emission in the galaxy A1703-zD1. These studies all assumed a dust temperature of and – and hence we expect no appreciable offset to the results of this work due to differences in the chosen rest-frame FIR SED. As shown in Fig. 8 and further discussed in Section 4.4, although the dust temperature in these cases is higher than we assume in this work, the lower compensates almost exactly. We additionally show two galaxies where there is a confirmed ALMA detection and robust rest-frame UV slope determination. The recent study of the lensed galaxy A1689-zD1 from Bakx et al. (2021) found an IRX value that is in excess of he majority of the other points and the canonical Calzetti-like relation. The of this source was derived with the observed best-fitting dust temperature of , with a fixed . If a higher dust temperature was assumed (to make the FIR analysis consistent with this work, and the other studies shown in this plot) this would increase the IRX by (Fig. 8) resulting in an even greater excess. To show this source on the – relation we take the rest-frame UV colour derived by Watson et al. (2015). Knudsen et al. (2017) argue that A1689-zD1 could be a massive starburst due to the observed [CII] deficit, large (given the stellar mass) and disturbed morphology. The fact that A1689-zD1, as well as REBELS-25 in Fig. 4, appear in the upper left region of the – diagram could be due to a spatial offset between the regions emitting in the rest-frame UV and FIR. The FIR emission in this case would be dominated by optically thick emission, while the rest-frame UV colour is measured from unobscured stars leading to an unusually blue colour for the observed IRX (as seen in ULIRGS; Casey et al. (2014), and predicted in theoretical works e.g. Popping et al., 2017; Behrens et al., 2018; Liang et al., 2019; Sommovigo et al., 2020; Ferrara et al., 2022). We also show the galaxy COS-87259 from Endsley et al. (2023) that was found within the COSMOS field using an LBG selection, but has been confirmed to be a highly star forming and dust obscured radio-loud AGN at . This source is very red, but it has a high derived IRX placing it slightly above the prediction of a Calzetti-like – relation.
4.3.2 Individual REBELS galaxies at
In Fig. 6 we show the – results we derive for the seven galaxies in REBELS that have photometric redshifts at . These galaxies were not included in our stacking analysis due to four sources having Band 7 observations, and the relatively uncertain photometric redshifts derived for these sources at the very high-redshift end of the REBELS sample. We compare to the Hashimoto et al. (2023) work that spectroscopically confirmed a group of galaxies (nicknamed RIOJA) at , with three of the components showing detections in the rest-frame FIR from ALMA. Other sources have been observed with ALMA (e.g. MACS0416_Y1 at and MACS0416-JD at ; Hashimoto et al., 2018; Bakx et al., 2020) however these other objects do not have published rest-frame UV slopes. Two of the REBELS sources at are detected in the dust continuum (REBELS-4 and REBELS-37; also called XMM-355 and UVISTA-1212 respectively in Bowler et al., 2020), while the other five are not. REBELS-4 is in good agreement with our stacked results at slightly lower redshift, however REBELS-37 shows a redder rest-frame UV colour and deficit in IRX from both the Calzetti and SMC relations shown. We note that the -slope value is more uncertain at these redshifts, due to the few bands () available for fitting, and the broader uncertainty in photometric redshift leading to a degeneracy between redshift and slope. Excluding REBELS-37, we find good agreement within the (large) errors with our stacks, although we note that the majority are upper limits on the dust continuum.
4.4 – from from ALPINE and REBELS
To provide a consistent comparison to the results from REBELS, we performed the same analysis on the ALPINE sample in the COSMOS field (see Section 2). We present the ALPINE results compared to the individual object measurements in Fig. 11 with the values presented in Table 3. As the ALPINE sample is both larger and has a broader range of measured stellar masses, we additionally binned in . In our computation of the and hence IRX for the two samples we assumed the same rest-frame FIR SED, with a dust temperature of and emissivity of following the work of Sommovigo et al. (2022a, b) (see Section 3.4). We compare the ALPINE results with those from REBELS in Fig. 7. As was found for the REBELS sources, the brighter rest-frame UV stacks have lower IRX and appear bluer. We also see a strong dependence on stellar mass, with the galaxies at showing considerably redder colours with and a higher IRX by . We note here that due to the selection methodology of the initial ALPINE sample, a larger fraction of the sources in the bin were selected to be Lyman- emitters. Taking a rest-frame EW of Å as the separation between LBGs and LAEs, 8 (30) percent of the sub-sample are LAEs in comparison to 38 (57) percent of the sub-sample. As LAEs have in general been found to show lower dust attenuation (e.g. Schaerer et al., 2015) this could explain the small offset we see between these two redshift bins.
As we discuss further in the next section, we find consistent results between the derived – relation between the REBELS and ALPINE samples in our analysis, when we use the same modified blackbody SED fitting analysis and measurement procedure. The data appears to agree with the local starburst relation of Calzetti et al. (2000), with no evidence from our stacked results for a deficit in the relation that could be consistent with SMC-like dust, given our assumptions on FIR SED.
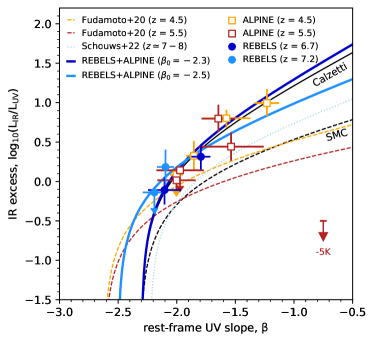
By combining the results from the two surveys we are able to measure the – relationship across a wide redshift range from – from the largest sample of galaxies available with deep ALMA follow-up. Taking the stacked detections for ALPINE and REBELS, we fit the slope of the – relation with a given intrinsic rest-frame UV slope, , according to the formalism presented in McLure et al. (2018) as:
| (1) |
In this formalism, the Calzetti (SMC)-like relation has a slope of and the 1.71 pre-factor is a constant set by the bolometric correction between the total rest-frame UV emission available to heat the dust and that characterised by . The pre-factor can change if we break the assumption of a dust screen, however for this analysis we keep it constant. For our combined ALPINE and REBELS results we find a best-fitting slope of when assuming or a shallower slope of the – relation of when assuming . The intrinsic rest-frame UV slope of our sample is not known, however from BAGPIPES SED fitting analysis we find it to be between and and hence present the results of both fits. As can be seen in Fig. 7, both assumptions provide a good description of the data over a broad range in measured rest-frame UV slope. Our results are in general in excess of the previously derived – relations at (e.g. from Fudamoto et al., 2020b; Schouws et al., 2022).
4.4.1 Comparison to previous results from the ALPINE survey
Our conclusions on the – relation at – are different to those found in the previous ALPINE analysis presented in Fudamoto et al. (2020b), particularly at where we find a higher IRX by around when comparing stacks across the same range. The later studies of Burgarella et al. (2022) and Boquien et al. (2022) found similar conclusions to the Fudamoto et al. (2020b) study with further analysis of subsets of the ALPINE sample. Fudamoto et al. (2020b) present stacked – relations using bins in and , finding the results to be consistent. In the following discussion we compare to the binning results of Fudamoto et al. (2020b) as this has been shown to be the least biased estimator of – (e.g. McLure et al., 2018). This provides the most natural comparison as our points are already stacked in , however we additionally stack in bins. Hence in the following discussion we combined our bins at a given . This leads to points that lie mid-way between the two bins per bin, as expected. To identify the cause of this offset we first directly compared the derived -slopes, values and ALMA fluxes for individual objects. We find that our rest-frame UV slopes are on average bluer than those derived in ALPINE by , with around half of this difference attributed to the dust law that we assume in the SED fitting (we assume Calzetti, whereas in Faisst et al., 2020b took the average between results with an SMC and Calzetti dust law). The values are found to be offset slightly brighter (0.1 mag) in our analysis, which used the COSMOS2020 catalogue instead of the COSMOS2015 data analysed in Faisst et al. (2020b), however this has a negligible effect on the derived IRX. For the 20 percent of the ALPINE sample that have dust continuum detections we find good agreement between our raw flux measurements. Both our study and that of Fudamoto et al. (2020b) take into account the fact that the dust continuum emission may be extended in the higher mass () stacks by using a Gaussian fit to the ALMA data. On closer inspection, the extension found in these stacked images is due to both an intrinsic extension (i.e. higher mass sources have an extended dust distribution) and an artificial extension introduced in the stacking process due to offsets between the rest-frame UV and FIR centroid. In the binning analysis, we determine the slopes from SED fitting to the stacked optical/NIR photometry, while Fudamoto et al., 2020b take the median in each bin. However despite the different method, when comparing the same bins in we find only a difference between the resulting -slopes ( for the lower mass bin at ), and of the difference can be accounted for by the different assumed dust law in the fitting (Section 3).
Assuming that the fluxes in the stacks are consistent, the main difference is in the FIR SED assumed in the derivation of the . Fudamoto et al. (2020b) used a scaling factor to compute that was derived from an empirical FIR template created by stacking Herschel data in the COSMOS field. An expanded sample of photometrically selected galaxies over a similar redshift to the ALPINE sample was used in the creation of this template (Béthermin et al., 2020), and it can be approximated with a modified blackbody with a fixed of temperature and at – and – respectively. While only – lower than that assumed in this work, the difference is enough to account for a difference in the resulting IRX given the same input flux measurement. We mark this offset as an arrow in Fig. 7. This is illustrated in Fig. 8, where we show the offset in IRX expected for changes in and . This difference, and the slightly bluer rest-frame UV slopes we find, can account for of the observed difference between our analysis of ALPINE and that presented previously in Fudamoto et al. (2020b). As can be seen in Fig. 11, the ALPINE sample consisted of 80 percent upper limits on the dust continuum emission and hence the exact stacking process could contribute to the remaining difference. Despite not knowing exactly the dust SED for the ALPINE and REBELS samples, we have shown that the two samples have consistent IRX relations when the ALMA measurements are fit with the same modified blackbody assumptions. If the ALPINE sample does indeed show a lower dust temperature to that of REBELS (as expected from the -redshift relation in e.g. Schreiber et al., 2018), then we would recover a lower – relation for the ALPINE dataset by .
5 Discussion
This work presents a consistent analysis of the two most substantial ALMA surveys measuring the dust continuum emission from LBGs. We have computed the – relation at from REBELS, and compare this to a consistent analysis of the and samples from ALPINE. These surveys targeted galaxies with stellar masses of and hence probe the high-mass end of the known galaxy distribution at these redshifts. Even before considering the results from the ALMA observations themselves, we find that the REBELS galaxies are surprisingly blue in the rest-frame UV as compared to the predicted colour of galaxies from the extrapolated colour-magnitude relation found for fainter sources (Fig. 3). Despite being some of the most massive galaxies known at , the REBELS sources show a flatting, or a potential turnover, in the colour-magnitude relation for galaxies at . As discussed in Section 4.2, we do not think this behaviour is due to our sample selection in part due to the fact that predominantly blue -slopes are found even in the most luminous (and hence highest S/N) galaxies where redder slopes would be robustly measured. Following the arguments presented in e.g. Bowler et al., 2015, 2020 amongst other studies (e.g. Salim & Lee, 2012), when considering galaxies found at the bright-end of the rest-frame UV luminosity function (UVLF), the effect of scatter must be considered. If we consider an underlying stellar mass function (SMF) with an exponential cut-off above the characteristic mass, and estimate from this the expected UVLF, given the scatter between and the , we expect to see a shallower decline in the number density to brighter galaxies. Because of the steepness of the SMF, galaxies that are found to be bright in the rest-frame UV are necessarily the sources that have low dust attenuation. Galaxies of the same stellar mass, but with a higher than average attenuation would instead be scattered fainter on the UVLF and be lost within the large population of fainter sources. The majority of the REBELS sources were selected from wide-area ground-based data and they represent a very rare population of galaxies that sit brightward of the knee of the UVLF. Hence from the arguments detailed above, we would expect them to show a relatively low dust obscuration given their stellar mass (e.g. as found in Algera et al., 2023b), and hence a lower IRX and bluer . An additional factor that could contribute to the unexpectedly blue colours we observe for the REBELS sources is a geometric offset between the dust and stars within the galaxy (e.g. as predicted by Popping et al., 2017). The UV variability model of Shen et al. (2023) predicts that the rest-frame UV brightest galaxies should be blue, due to their young ages and clearance of dust in the star-burst phase. A clumpy morphology with an offset between the observed young stars stars and dust, leading to relatively unobscured regions, has already been observed in higher-resolution ALMA observations of REBELS galaxies in Bowler et al. (2022) supporting this hypothesis.
5.1 Implications for the dust attenuation curve at
We find that the – relation derived from a stacking analysis of the ALPINE and REBELS samples are consistent with a Calzetti-like relationship as found at , with our assumed rest-frame FIR SED for both samples. We find no evidence that the sources on average lie below the relation, which could indicate a different attenuation law such as an SMC-like relation (discounting the effect of geometry which tends to make the observed attenuation law appear shallower even in the case of a steeper extinction law). As shown in Fig 7, our results differ from those found using the ALPINE dataset by Fudamoto et al. (2020b), who found a deficit in IRX for a given rest-frame UV slope and concluded that an SMC-like attenuation curve was preferred. As discussed in Section 4, the difference between our results and those of Fudamoto et al. (2020b) is primarily due to the assumed rest-frame FIR SED (with this work using a higher dust temperature by ), with a minor effect of our analysis deriving bluer rest-frame UV slopes from the stacked photometry (). The best-fit relation presented in Fudamoto et al. (2020b) assumed an intrinsic (fits were also presented for redder ) and showed a tentative evolution in the normalisation, such that the IRX is decreasing at a given -slope from to . We instead find little evolution in the – relation from to from our analysis. This relies on our assumption that the FIR SED (and intrinsic rest-frame UV slope) remains approximately constant between the samples and redshift ranges, as found by Sommovigo et al. (2022a, b) which motivated the and emissivity coefficient used in this work for the ALPINE and REBELS datasets. If instead the dust temperature differs between the two samples at above and below , then we would conclude that the REBELS sources lie above the ALPINE galaxies on the – plane by approximately . This would potentially indicate a different selection function between the surveys (e.g. we already know that ALPINE targeted more Lyman- emitters than REBELS; see Section 5.3).
Our results are also higher (particularly at redder ) than the best-fit derived by Schouws et al. (2022) (assuming an intrinsic , at ). However the stacked results from that work are consistent within the errors with our findings from REBELS (see Fig. 5). In the range of stellar mass between –, galaxies in both REBELS and ALPINE appear blue () and the obscured fraction is – (Table 2). For the higher mass galaxies found within ALPINE (as REBELS contains very few galaxies at assuming a parametric SFH; although see Topping et al., 2022) we find redder slopes () and obscured fractions approaching 0.9. Comparing our results to studies that targeted lower mass galaxies there is some evidence for a difference in IRX with galaxy luminosity (or stellar mass). For example the stacking analysis of Bouwens et al. (2016) and Bouwens et al. (2020) derived from the deep ALMA data covering the Hubble Ultra Deep Field showed only upper limits over the broad redshift range –. Bouwens et al. (2020) also found evidence for an SMC-like attenuation curve at , while a Calzetti like curve was preferred at higher masses. These results are consistent with our analysis, which supports a Calzetti-like attenuation curve for from –. Our find that there is a lack of evolution in the attenuation curve from local starburst galaxies up to could suggest that the conditions required to form Calzetti-like dust are present already 800 Myr after the Big Bang. As shown by various theoretical studies however, taking the observed – relation as evidence for a particular dust attenuation curve can be problematic due to the myriad of other factors that can influence the observed relation (e.g. Popping et al., 2017; Narayanan et al., 2018). The fact that we do not see a significant excess above the Calzetti relation further suggests that on average the REBELS and ALPINE galaxies are not dominated by significant optically thick regions contributing to the , that would boost the measured IRX values (e.g. as seen in the case of ULIRGs; Casey et al., 2014).
5.1.1 Evidence for a high gas-phase metallicity?
Further insight into the origin of our results for massive galaxies can be gained from the works of Shivaei et al. (2020a); Shivaei et al. (2020b) who found that the dust attenuation curve correlated most strongly with gas-phase metallicity from a detailed study of sources at –. They found that at a Calzetti-like attenuation curve was consistent with the data, with a steeper attenuation curve found for lower metallicity sources. Qualitatively our results agree with these studies, although the difference in methodology makes it non trivial to compare quantitatively. In particular, Shivaei et al. (2020b) remove sources with very strong emission line strengths ([OIII] Å) that we inferred to be present in the majority of the REBELS sources (Bouwens et al., 2022). In addition, they compute the IR luminosity using a template from Rieke et al. (2009) for the more massive sources in their sample. These templates are stated to be equivalent to a greybody curve with – and –, which as shown in Fig. 8 would give lower values of the IRX by –. With these caveats in mind, these previous results would suggest that the ALPINE and REBELS galaxies with show an increased gas-phase metallicity compared to lower mass sources, that then leads to the observed Calzetti-like dust attenuation curve. If we take the mass-metallicity relation derived by Sanders et al. (2021) at , we would predict a metallicity for this sample of . We also obtain a comparable estimate of the metallicity using the fundamental mass-metallicity relation (FMR) from Curti et al. (2020) assumming a total SFR (Table 2). Recent results from early JWST analysis for lower mass galaxies have revealed similar FMRs as at (Nakajima et al., 2023) as well as evidence for a deficit from the FMR in galaxies at (Curti et al., 2023). If this deficit is found to hold for galaxies at , this would imply a lower metallicity by for galaxies in our sample given their . Regardless of which of these metallicity calibrations we consider, the derived values of average metallicity quantitatively disagree with the results of Shivaei et al. (2020b) that would predict that these sources should show an SMC-like dust attenuation curve at . Despite this, our results are qualitatively in agreement with a picture where the ALPINE and REBELS sources have higher metallicities than lower-mass/fainter sources at the same redshifts, and hence a Calzetti-like dust attenuation law remains the preferred fit even up to . With upcoming NIRSpec observations we will be able to directly determine the extension of the FMR relation at to higher masses, and test whether the sources that show significant dust detections are metal rich in comparison to lower mass () galaxies.
5.2 The IRX– relation at -
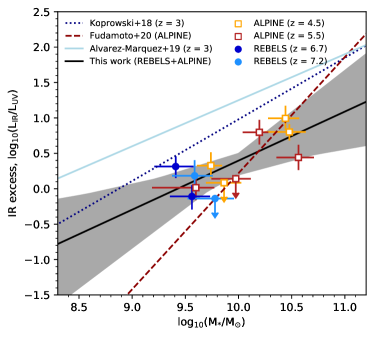
In principle the – relation provides a more fundamental physical relationship than the – plane, where the latter can be affected by large errors on the rest-frame UV slope measurement and geometric effects (e.g. see Faisst et al., 2017; Liang et al., 2019; Sommovigo et al., 2020; Ferrara et al., 2022). The stellar mass represents an integral of all past star-formation activity in the galaxy, and hence is expected at least qualitatively to be correlated with the production of dust (e.g. via stellar dust production and the overall metal enrichment of the ISM; Dayal et al., 2022). Dunlop et al. (2017) showed that stellar mass is a strong predictor of a FIR detection (and thus ; see also McLure et al., 2018; Bouwens et al., 2020). Up to there has been in general a good agreement between previous studies of the – relation, with the results found to be approximately consistent to the local relation (e.g. McLure et al., 2018; Koprowski et al., 2018; Álvarez-Márquez et al., 2019; although see Reddy et al., 2018). At higher redshift, Fudamoto et al. (2020a) found a steeper slope of the – relation at – implying a reduced obscured SFR fraction and total SFR than the relations recovered at lower redshifts (at when the relations cross), a trend that was also recovered in the ALPINE sample (Fudamoto et al., 2020b). In Fig. 9 we show the measured – points from our stacking analysis of the ALPINE and REBELS samples. We find an offset in the measurements from the results of Koprowski et al. (2018) and Álvarez-Márquez et al. (2019). These studies use empirical templates in their derivation of the FIR luminosity, with the best-fitting templates used in Koprowski et al. (2018) showing a temperature of . Given the observed relation of with redshift, and the lack of information on the FIR SED at and observed changes in the FIR SED with physical properties (e.g. , SFR; Álvarez-Márquez et al., 2019), it is not trivial to compare IRX values over the redshift range – and be fully confident of the exact offsets between studies. Nevertheless, we recover an offset of between – dex when comparing our results to those at , depending on the lower redshift relation assumed. Fitting these data points we derive the following – relation:
| (2) |
While the derived slope is only weakly constrained due to the small dynamic range in stellar mass that we probe with the ALPINE and REBELS samples, it is consistent with the relations. Further analysis of galaxies at will be required to confirm if the slope does steepen at . Due to the strong dependence of obscuration however, these measurements are extremely challenging and must rely on stacking (for example the ASPECS program only found 18 ALMA detections from a sample of 1362 galaxies at –, with the highest redshift being at ; Bouwens et al., 2020). Regardless of the exact form of the relation, the offset we observe in the derived IRX for a given shows that between and – the degree of obscured star formation has dropped by a factor of –. This is despite the sources showing good agreement with the galaxy “main-sequence” (Topping et al., 2022; Algera et al., 2023b) and hence they do not show a deficit in total SFR. This finding is consistent with previous results that have derived a lower obscured fraction as a function of at (Fudamoto et al., 2020b; Gruppioni et al., 2020; Algera et al., 2023b), however we do not recover the steepness of these relations. We note that recent results on the dust obscuration as a function of stellar mass from Shapley et al. (2023) using the Balmer decrement measured with JWST have not found evidence for evolution in the degree of dust obscuration between –, in contrast to our results. One explanation for these differing conclusions is that there is an evolution in the relation between continuum (as we measure in this work using the rest-frame UV slope) and the nebular reddening (as measured by Shapley et al., 2023). Future rest-frame FIR observations of samples of massive galaxies, such as those selected via upcoming wide-area NIR imaging observations from Euclid and Roman, will be required to confirm if the reduction in dust obscured star-formation continues to even higher redshifts.
5.3 Caveats
A key assumption in this work is that of a fixed dust SED with a dust temperature of and . These parameters were utilized within the REBELS survey as the fiducial rest-frame FIR SED and were derived by Sommovigo et al. (2022a). The dust temperature at remains uncertain, and recent results have suggested that it may vary between galaxies from – (e.g. Hashimoto et al. 2019; Bakx et al. 2020; Algera et al. 2023a). For the emissivity index, Witstok et al. (2023) found a best-fitting value of , consistent with our assumed model. These results would suggest that a different dust temperature would be required for each source. However, given the large errors for individual sources, and the lack of these measurements for the full sample, this analysis is unfeasible at this time.
Another important caveat is that the ALPINE and REBELS samples were selected in different ways, and for example the sample from ALPINE includes a larger fraction of Lyman- emitters than REBELS. The REBELS survey has no confirmed Lyman- emission stronger than Å (Endsley et al., 2022), while in the bin of ALPINE 57 percent of the sources have Å. This comparison is complicated by the impact of the neutral IGM as we approach , however as galaxies selected as Lyman- emitters have been shown to have lower dust content than LBGs (e.g. Schaerer et al., 2015; Matthee et al., 2017) this difference could cause a bias to lower IRX values in the ALPINE sample. There is also evidence at lower redshifts that the dust attenuation curve varies between galaxies of the same stellar mass (e.g. Salim & Boquien, 2019; see the review by Salim & Narayanan, 2020). Using a subset of the ALPINE sample, Boquien et al. (2022) derived a range of best-fitting attenuation curves also suggesting that the attenuation law varies significantly between individual galaxies. Narayanan et al. (2018) have predicted using a simulation that the variation in attenuation curves between galaxies decreases with increasing redshift, however further observations are needed to understand the properties of dust within high-redshift galaxies.
Another factor to consider, with reference to our inferences about stellar mass dependence, is that we assumed a certain parametric star-formation history in computing these parameters. Topping et al. (2022) has shown that these measurement may underestimate the mass by on average . This would cause an increased deficit (up to around , given the best-fit relation) in the – relation to previous studies, however care must be taken to compare similar methodologies in determining . Future observations of the REBELS galaxies with JWST (e.g. through program PID1626, PI Stefanon) will constrain the SFH and hence stellar masses with greater accuracy.
Finally, we consider the potential effects of sample incompleteness. Due to the rest-frame UV based Lyman-break selection (or Lyman- selection for some ALPINE sources), our samples will be incomplete to any highly obscured sources. Such sources have been identified with ALMA, for example the ‘UV-dark’ galaxies found serendipitiously via their [CII] emission only – from the central (rest-UV bright) REBELS source in Fudamoto et al. (2021). It is challenging to place these types of galaxies on the – or – relation as their rest-frame UV and optical are undetected, however it is likely that they are extremely red and massive (–) and with a high IRX. Further study is needed to understand this population of extremely obscured galaxies at .
6 Comparison to models
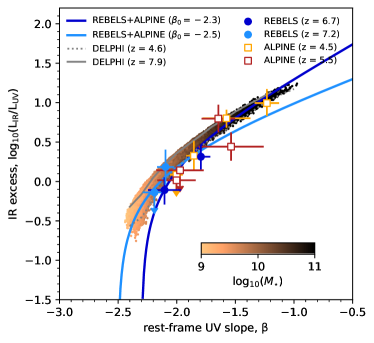
The attenuation curve and the – relation have been the subject of many theoretical and simulation analyses (e.g. see recent review by Salim & Narayanan, 2020). Here we discuss the handful of results that focus specifically on predictions for the high-redshift Universe. In a work that was based on the REBELS sample, Dayal et al. (2022) provided the first theoretical comparison to the dust properties of the REBELS galaxies. Using the semi-analytic model (SAM) DELPHI, they were able to match the observed dust masses while also reconciling the intrinsic UV luminosity function with the observed (attenuated) luminosity function at . Ferrara et al. (2022) further identified that some REBELS sources show inconsistencies between the rest-frame UV properties () and FIR emission, suggestive of spatially offset regions within the galaxies. We recover this result in the form of sources that lie above the typical Calzetti-like – relation - showing bluer than expected colours for their measured . While Ferrara et al. (2022) argue that this makes the – relation difficult to utilize for these galaxies, in this work we have found that on average there is a correlation in the – plane for galaxies in the REBELS sample (that is consistent with a Calzetti-like relation). In Fig. 10 we present the most recent analysis of dust emission from the DELPHI SAM in comparison to our derived – results from REBELS and ALPINE. We took the output of the model presented in Mauerhofer & Dayal (2023) and computed the rest-frame UV slope using an identical method to that used on the ALPINE and REBELS stacks, by fitting a power law to the resulting predicted SED. Sources were extracted that had , and nebular continuum emission is included in the modelling of the SED. As is evident from the figure, comparing the DELPHI model of Mauerhofer & Dayal (2023) to the results of this work we find a good agreement with the model predictions. The predicted change in IRX and with increasing stellar mass matches very well with what we find in the data, with the observed galaxies in ALPINE at lying on top of the model predictions for this mass range. Furthermore, the bluest values are comparable to those found in the data for galaxies at , and the lack of evolution we see between – is also recovered in DELPHI. As shown in Fig. 10, the SAM predicts that the – should increase with redshift, due to the increased optical depth within compact galaxies at the highest redshifts. While there are assumptions made in the computation of the – in both the models (e.g. through escape fraction of UV photons, dust heating etc.) and in the observations (with the systematic uncertainties in the determination), it is reassuring that the general trends are present in this basic comparison.
Turning now to works that consider hydrodynamical simulations, Narayanan et al. (2018) used the MAFUSA model to predict the attenuation law at . They found a relatively grey attenuation curve, with the scatter between different galaxies becoming reduced at higher redshift due to more consistent stellar ages between sources and an increase in complexity in the star-dust geometry. The predicted curve is very close to that of the Calzetti et al. (2000) curve, however with a prominent 2175Å bump. Vijayan et al. (2023) used the FLARES simulation to investigate the expected dust attenuation curve for galaxies at –, with a particular focus on examining the effect of star-dust geometry. For galaxies with a similar SFR to the REBELS and ALPINE sources, they find a dust law with a similar slope to that of the Calzetti et al. (2000) relation, despite the input of an SMC-like extinction law to their simulations. In FLARES, galaxies with a higher SFR show a larger degree of clumpiness, which in turn leads to a larger range in over the galaxy surface and hence a greyer attenuation curve when integrated across the source. The zoom-in cosmological SERRA simulations presented in Pallottini et al. (2022) produces galaxies at that are in excess of the majority of observations at high redshift (and in excess of the Calzetti-relation). Pallottini et al. (2022) attribute the differences to first, the uncertain FIR SED and hence systemic errors in the derived from observations (they suggest that a higher dust temperature should be assumed, exceeding ), and second, to potential inaccuracies in the feedback prescription in the modelling and an insufficient spatial resolution to fully resolve the molecular clouds where the majority of the FIR luminosity is produced. Finally, Liang et al. (2019) used the cosmological simulation MassiveFIRE to model the – relation of – galaxies. They found a relation similar to that found locally in the Calzetti-relation (although as a Milky Way dust attenuation curve was input, this is perhaps not surprising) Liang et al. (2019) directly predict the – values for the galaxies in their simulations, finding objects that are blue () and occupy the lower left region of the diagram. They conclude the scatter around the relation is dominated by different intrinsic slopes. In conclusion, in general these models predict a dust attenuation law that is similar to the local Calzetti et al. (2000) relationship for galaxies at with similar stellar masses and SFRs to the REBELS sample. When the models have predicted the – relation this has been in agreement, or in excess of, what we observe for our combined ALPINE and REBELS samples (Liang et al., 2019; Pallottini et al., 2022; Mauerhofer & Dayal, 2023). We therefore conclude that current models and observational constraints from this work favour a distribution in the – plane that is consistent with predictions for a Calzetti-like dust attenuation law at –, with no evidence for a deficit from the local relation towards what would be predicted by a screen of SMC-like dust.
7 Conclusions
In this study we present an analysis of the ALMA large program REBELS, which provided observations of the dust continuum emission for a sample of 49 galaxies at –. We also perform a consistent analysis of the ALPINE large program that targeted galaxies in the redshift range of –, to provide a key comparison to the REBELS results and investigate any evolution in the dust emission properties with redshift. The main conclusions of this work are as follows:
-
•
When compared to the expected colour from the extrapolated colour-magnitude relation for fainter galaxies, the REBELS sources are bluer than expected by up to – (depending on the extrapolated relation). These results point to a flattening, or potential turnover, of the colour magnitude relation bright-ward of , that can be understand as a consequence of scatter on an underlying steep galaxy stellar mass function. In this scenario, the REBELS galaxies represent the sub-set of sources at a given that have low dust attenuation and hence have bright rest-frame UV magnitudes and a blue colour.
-
•
When stacking the REBELS sources in the ALMA Band 6 data we find detections at significance for all but the highest redshift and brightest bins. We derive the and IRX for the sample from these results, assuming a modified blackbody curve with a dust temperature of and as derived in the model of Sommovigo et al. (2022a). The – relation we derive for the REBELS sample with this assumed FIR SED is as expected for a Calzetti-like attenuation law (with an intrinsic rest-frame UV slope of ). In comparison to other studies at , we find no strong evidence for a systematic deviation below this relation, although large scatter is found between individual sources.
-
•
By assuming the same FIR SED for stacks of the ALPINE data (as motivated by the study of Sommovigo et al., 2022b), we find that the – results at and produce values that are consistent with our REBELS findings. We therefore find negligible evolution in the – relation from –, and conclude that there is little evidence for a deficit in the – relation at as compared to the local starburst results of e.g. Calzetti et al. (2000). Comparisons to previous studies at again highlight that the assumed FIR SED has a dramatic affect on the derived and care must be taken in comparing different studies.
-
•
We compute the – relation from our combined ALPINE and REBELS samples, finding a similar slope to previous analyses at , but with a offset to lower IRX at a given for our assumed FIR SED. These results corroborate previous findings (e.g. Schouws et al., 2022; Algera et al., 2023b) that show that for a given stellar mass, the proportion of obscured star-formation is reduced at by a factor of .
-
•
In comparison to models of dust attenuation in galaxies, we find that in general a Calzetti-like attenuation curve is predicted. In simulations that compute the – relation we find that the results are in good agreement with our combined ALPINE and REBELS analysis, with few studies predicting very low ‘SMC-like’ relations. In a detailed comparison to the predictions of the DELPHI SAM, we find very good agreement between this model and our observations over the stellar mass range of –. These results indicate that despite complexities and caveats in both the modelling and observation of high-redshift galaxies, qualitatively (and quantitively for the DELPHI model) there is good agreement between the predicted and measured trends of rest-frame UV colour, dust attenuated star-formation and stellar mass at –.
To understand the origin of the effects seen in this work and others, a more detailed view on the measured properties of galaxies (such as more precise , and gas-phase metallicity) are required. Cycle 1 JWST observations of 12 of the REBELS sample are being obtained as part of the General Observer program PID1626 (PI Stefanon). This program will target the sources with the NIRSpec Integral Field Unit, providing gas-phase properties from the rest-frame optical emission lines for this unique sample. The data will also provide refined (and resolved) rest-frame UV slope and measurements. For the ALPINE survey, Cycle 2 observations have been approved for a subset of the most massive 18 galaxies for NIRSpec IFU from GO program 3045 (PI Faisst). The results of these programs, coupled with ongoing additional follow-up with ALMA to determine the dust temperature (via additional bands) and spatial distribution of the gas, dust and stars (via higher spatial resolution ALMA observations), will provide additional insights into the evolution of the – and – relations at –.
Acknowledgements
RAAB acknowledges support from an STFC Ernest Rutherford Fellowship [grant number ST/T003596/1]. RJB acknowledges support from NWO grants 600.065.140.11N211 (vrijcompetitie) and TOP grant TOP1.16.057. RS acknowledges support from an STFC Ernest Rutherford Fellowship [grant number ST/S004831/1]. YF acknowledge support from NAOJ ALMA Scientific Research Grant number 2020-16B. YF further acknowledges support from support from JSPS KAKENHI Grant Number JP23K13149. MA acknowledges support from FONDECYT grant 1211951, ANID+PCI+REDES 190194 and ANID BASAL project FB210003. FC acknowledges support from a UKRI Frontier Research Guarantee Grant [grant reference EP/X021025/1]. JSD acknowledges the support of the Royal Society through a Royal Society University Research Professorship. This work was supported by NAOJ ALMA Scientific Research Grant Code 2021-19A (HI and HSBA). HI acknowledges support from JSPS KAKENHI Grant Number JP19K23462. IDL and MP acknowledge support from ERC starting grant 851622 DustOrigin. MS acknowledges support from the ERC Consolidator Grant 101088789 (SFEER), from the CIDEGENT/2021/059 grant, and from project PID2019-109592GB-I00/AEI/10.13039/501100011033 from the Spanish Ministerio de Ciencia e Innovación - Agencia Estatal de Investigación. JH acknowledges support of the ERC Consolidator Grant 101088676 (VOYAJ) and the VIDI research programme with project number 639.042.611, which is (partly) financed by the Netherlands Organisation for Scientific Research (NWO). EdC gratefully acknowledges the Australian Research Council as the recipient of a Future Fellowship (project FT150100079) and the ARC Centre of Excellence for All Sky Astrophysics in 3 Dimensions (ASTRO 3D; project CE170100013). This paper makes use of the following ALMA data: ADS/JAO.ALMA#2019.1.01634.L, ADS/JAO.ALMA#2017.1.01217.S, ADS/JAO.ALMA#2017.1.00604.S, ADS/JAO.ALMA#2018.1.00236.S, ADS/JAO.ALMA#2018.1.00085.S ADS/JAO.ALMA#2018.A.00022.S. ALMA is a partnership of ESO (representing its member states), NSF (USA) and NINS (Japan), together with NRC (Canada), MOST and ASIAA (Taiwan), and KASI (Republic of Korea), in cooperation with the Republic of Chile. The Joint ALMA Observatory is operated by ESO, AUI/NRAO and NAOJ. PD & VM acknowledge support from the NWO grant 016.VIDI.189.162 (“ODIN"). PD warmly acknowledges support from the European Commission’s and University of Groningen’s CO-FUND Rosalind Franklin program.
Data Availability
The REBELS and ALPINE datasets used in this work have been publicly released, as have all of the optical and NIR imaging utilized. The COSMOS2020 catalogue is public (Weaver et al., 2022).
References
- Algera et al. (2023a) Algera H., et al., 2023a, arXiv e-prints, p. arXiv:2301.09659
- Algera et al. (2023b) Algera H. S. B., et al., 2023b, MNRAS, 518, 6142
- Álvarez-Márquez et al. (2019) Álvarez-Márquez J., Burgarella D., Buat V., Ilbert O., Pérez-González P. G., 2019, A&A, 630, A153
- Ashby et al. (2013) Ashby M. L. N., et al., 2013, ApJ, 769, 80
- Ashby et al. (2018) Ashby M. L. N., et al., 2018, ApJS, 237, 39
- Bakx et al. (2020) Bakx T. J. L. C., et al., 2020, MNRAS, 493, 4294
- Bakx et al. (2021) Bakx T. J. L. C., et al., 2021, MNRAS, 508, L58
- Barisic et al. (2017) Barisic I., et al., 2017, ApJ, 845, 41
- Barrufet et al. (2023) Barrufet L., et al., 2023, MNRAS, 522, 3926
- Behrens et al. (2018) Behrens C., Pallottini A., Ferrara A., Gallerani S., Vallini L., 2018, MNRAS, 477, 552
- Béthermin et al. (2020) Béthermin M., et al., 2020, A&A, 643, A2
- Boquien et al. (2022) Boquien M., et al., 2022, A&A, 663, A50
- Bouwens et al. (2014) Bouwens R. J., et al., 2014, ApJ, 793, 115
- Bouwens et al. (2016) Bouwens R. J., et al., 2016, ApJ, 833, 72
- Bouwens et al. (2020) Bouwens R., et al., 2020, ApJ, 902, 112
- Bouwens et al. (2022) Bouwens R. J., et al., 2022, ApJ, 931, 160
- Bowler et al. (2015) Bowler R. A. A., et al., 2015, MNRAS, 452, 1817
- Bowler et al. (2017) Bowler R. A. A., Dunlop J. S., McLure R. J., McLeod D. J., 2017, MNRAS, 466, 3612
- Bowler et al. (2018) Bowler R. A. A., Bourne N., Dunlop J. S., McLure R. J., McLeod D. J., 2018, MNRAS, 481, 1631
- Bowler et al. (2020) Bowler R. A. A., Jarvis M. J., Dunlop J. S., McLure R. J., McLeod D. J., Adams N. J., Milvang-Jensen B., McCracken H. J., 2020, MNRAS, 493, 2059
- Bowler et al. (2022) Bowler R. A. A., Cullen F., McLure R. J., Dunlop J. S., Avison A., 2022, MNRAS, 510, 5088
- Burgarella et al. (2022) Burgarella D., et al., 2022, A&A, 664, A73
- Calzetti et al. (1994) Calzetti D., Kinney A. L., Storchi-Bergmann T., 1994, ApJ, 429, 582
- Calzetti et al. (2000) Calzetti D., Armus L., Bohlin R. C., Kinney A. L., Koornneef J., Storchi-Bergmann T., 2000, ApJ, 533, 682
- Capak et al. (2015) Capak P. L., et al., 2015, Nature, 522, 455
- Carnall et al. (2018) Carnall A. C., McLure R. J., Dunlop J. S., Davé R., 2018, MNRAS, 480, 4379
- Carniani et al. (2017) Carniani S., et al., 2017, A&A, 605, A42
- Casey et al. (2014) Casey C. M., et al., 2014, ApJ, 796, 95
- Cassata et al. (2020) Cassata P., et al., 2020, A&A, 643, A6
- Chabrier (2003) Chabrier G., 2003, PASP, 115, 763
- Cullen et al. (2018) Cullen F., et al., 2018, MNRAS, 476, 3218
- Cullen et al. (2023) Cullen F., et al., 2023, MNRAS, 520, 14
- Curti et al. (2020) Curti M., Mannucci F., Cresci G., Maiolino R., 2020, MNRAS, 491, 944
- Curti et al. (2023) Curti M., et al., 2023, arXiv e-prints, p. arXiv:2304.08516
- Dayal et al. (2022) Dayal P., et al., 2022, MNRAS, 512, 989
- Di Cesare et al. (2023) Di Cesare C., Graziani L., Schneider R., Ginolfi M., Venditti A., Santini P., Hunt L. K., 2023, MNRAS, 519, 4632
- Draine (2003) Draine B. T., 2003, ARA&A, 41, 241
- Dunlop et al. (2012) Dunlop J. S., McLure R. J., Robertson B. E., Ellis R. S., Stark D. P., Cirasuolo M., de Ravel L., 2012, MNRAS, 420, 901
- Dunlop et al. (2017) Dunlop J. S., et al., 2017, MNRAS, 466, 861
- Endsley et al. (2021) Endsley R., Stark D. P., Chevallard J., Charlot S., 2021, MNRAS, 500, 5229
- Endsley et al. (2022) Endsley R., et al., 2022, MNRAS, 512, 4248
- Endsley et al. (2023) Endsley R., et al., 2023, MNRAS, 520, 4609
- Faisst et al. (2017) Faisst A. L., et al., 2017, ApJ, 847, 21
- Faisst et al. (2020a) Faisst A. L., et al., 2020a, ApJS, 247, 61
- Faisst et al. (2020b) Faisst A. L., Fudamoto Y., Oesch P. A., Scoville N., Riechers D. A., Pavesi R., Capak P., 2020b, MNRAS, 498, 4192
- Ferrara et al. (2022) Ferrara A., et al., 2022, MNRAS, 512, 58
- Fudamoto et al. (2020a) Fudamoto Y., et al., 2020a, MNRAS, 491, 4724
- Fudamoto et al. (2020b) Fudamoto Y., et al., 2020b, A&A, 643, A4
- Fudamoto et al. (2021) Fudamoto Y., et al., 2021, Nature, 597, 489
- Fujimoto et al. (2016) Fujimoto S., Ouchi M., Ono Y., Shibuya T., Ishigaki M., Nagai H., Momose R., 2016, ApJS, 222, 1
- Gall & Hjorth (2018) Gall C., Hjorth J., 2018, ApJ, 868, 62
- Graziani et al. (2020) Graziani L., Schneider R., Ginolfi M., Hunt L. K., Maio U., Glatzle M., Ciardi B., 2020, MNRAS, 494, 1071
- Gruppioni et al. (2020) Gruppioni C., et al., 2020, A&A, 643, A8
- Harikane et al. (2022) Harikane Y., et al., 2022, ApJS, 259, 20
- Hashimoto et al. (2018) Hashimoto T., et al., 2018, Nature, 557, 392
- Hashimoto et al. (2019) Hashimoto T., et al., 2019, PASJ, 71, 71
- Hashimoto et al. (2023) Hashimoto T., et al., 2023, arXiv e-prints, p. arXiv:2305.04741
- Hodge & da Cunha (2020) Hodge J. A., da Cunha E., 2020, Royal Society Open Science, 7, 200556
- Hygate et al. (2023) Hygate A. P. S., et al., 2023, MNRAS, 524, 1775
- Inami et al. (2022) Inami H., et al., 2022, MNRAS, 515, 3126
- Jarvis et al. (2013) Jarvis M. J., et al., 2013, MNRAS, 428, 1281
- Jones & Stanway (2023) Jones G. T., Stanway E. R., 2023, MNRAS, 525, 5720
- Khusanova et al. (2021) Khusanova Y., et al., 2021, A&A, 649, A152
- Knudsen et al. (2017) Knudsen K. K., Watson D., Frayer D., Christensen L., Gallazzi A., Michałowski M. J., Richard J., Zavala J., 2017, MNRAS, 466, 138
- Koprowski et al. (2018) Koprowski M. P., et al., 2018, MNRAS, 479, 4355
- Labbé et al. (2015) Labbé I., et al., 2015, ApJS, 221, 23
- Laporte et al. (2017) Laporte N., et al., 2017, ApJ, 837, L21
- Lawrence et al. (2007) Lawrence A., et al., 2007, MNRAS, 379, 1599
- Le Fèvre et al. (2020) Le Fèvre O., et al., 2020, A&A, 643, A1
- Leśniewska & Michałowski (2019) Leśniewska A., Michałowski M. J., 2019, A&A, 624, L13
- Liang et al. (2019) Liang L., et al., 2019, MNRAS, 489, 1397
- Loiacono et al. (2021) Loiacono F., et al., 2021, A&A, 646, A76
- Madau & Dickinson (2014) Madau P., Dickinson M., 2014, ARA&A, 52, 415
- Mancini et al. (2016) Mancini M., Schneider R., Graziani L., Valiante R., Dayal P., Maio U., Ciardi B., 2016, MNRAS, 462, 3130
- Matthee et al. (2017) Matthee J., et al., 2017, ApJ, 851, 145
- Mauerhofer & Dayal (2023) Mauerhofer V., Dayal P., 2023, arXiv e-prints, p. arXiv:2305.01681
- McCracken et al. (2012) McCracken H. J., et al., 2012, A&A, 544, A156
- McLure et al. (2018) McLure R. J., et al., 2018, MNRAS, 476, 3991
- Meurer et al. (1999) Meurer G. R., Heckman T. M., Calzetti D., 1999, ApJ, 521, 64
- Mohan & Rafferty (2015) Mohan N., Rafferty D., 2015, PyBDSF: Python Blob Detection and Source Finder, Astrophysics Source Code Library, record ascl:1502.007 (ascl:1502.007)
- Molyneux et al. (2022) Molyneux S. J., et al., 2022, MNRAS, 512, 535
- Nakajima et al. (2023) Nakajima K., Ouchi M., Isobe Y., Harikane Y., Zhang Y., Ono Y., Umeda H., Oguri M., 2023, arXiv e-prints, p. arXiv:2301.12825
- Narayanan et al. (2018) Narayanan D., Conroy C., Davé R., Johnson B. D., Popping G., 2018, ApJ, 869, 70
- Novak et al. (2017) Novak M., et al., 2017, A&A, 602, A5
- Oke & Gunn (1983) Oke J. B., Gunn J. E., 1983, ApJ, 266, 713
- Pallottini et al. (2022) Pallottini A., et al., 2022, MNRAS, 513, 5621
- Pannella et al. (2009) Pannella M., et al., 2009, ApJ, 698, L116
- Pannella et al. (2015) Pannella M., et al., 2015, ApJ, 807, 141
- Pierre et al. (2004) Pierre M., et al., 2004, J. Cosmology Astropart. Phys., 2004, 011
- Planck Collaboration et al. (2020) Planck Collaboration et al., 2020, A&A, 641, A6
- Popping et al. (2017) Popping G., Puglisi A., Norman C. A., 2017, MNRAS, 472, 2315
- Reddy et al. (2018) Reddy N. A., et al., 2018, ApJ, 853, 56
- Rieke et al. (2009) Rieke G. H., Alonso-Herrero A., Weiner B. J., Pérez-González P. G., Blaylock M., Donley J. L., Marcillac D., 2009, ApJ, 692, 556
- Rogers et al. (2013) Rogers A. B., McLure R. J., Dunlop J. S., 2013, MNRAS, 429, 2456
- Rogers et al. (2014) Rogers A. B., et al., 2014, MNRAS, 440, 3714
- Salim & Boquien (2019) Salim S., Boquien M., 2019, ApJ, 872, 23
- Salim & Lee (2012) Salim S., Lee J. C., 2012, ApJ, 758, 134
- Salim & Narayanan (2020) Salim S., Narayanan D., 2020, ARA&A, 58, 529
- Sanders et al. (2021) Sanders R. L., et al., 2021, ApJ, 914, 19
- Schaerer et al. (2015) Schaerer D., Boone F., Zamojski M., Staguhn J., Dessauges-Zavadsky M., Finkelstein S., Combes F., 2015, A&A, 574, A19
- Schouws et al. (2022) Schouws S., et al., 2022, ApJ, 928, 31
- Schreiber et al. (2018) Schreiber C., Elbaz D., Pannella M., Ciesla L., Wang T., Franco M., 2018, A&A, 609, A30
- Scoville et al. (2007) Scoville N., et al., 2007, ApJS, 172, 1
- Shapley et al. (2023) Shapley A. E., Sanders R. L., Reddy N. A., Topping M. W., Brammer G. B., 2023, arXiv e-prints, p. arXiv:2301.03241
- Shen et al. (2023) Shen X., Vogelsberger M., Boylan-Kolchin M., Tacchella S., Kannan R., 2023, MNRAS,
- Shivaei et al. (2020a) Shivaei I., et al., 2020a, ApJ, 899, 117
- Shivaei et al. (2020b) Shivaei I., Darvish B., Sattari Z., Chartab N., Mobasher B., Scoville N., Rieke G., 2020b, ApJ, 903, L28
- Smit et al. (2014) Smit R., et al., 2014, ApJ, 784, 58
- Smit et al. (2015) Smit R., et al., 2015, ApJ, 801, 122
- Smit et al. (2018) Smit R., et al., 2018, Nature, 553, 178
- Sommovigo et al. (2020) Sommovigo L., Ferrara A., Pallottini A., Carniani S., Gallerani S., Decataldo D., 2020, MNRAS, 497, 956
- Sommovigo et al. (2022a) Sommovigo L., et al., 2022a, MNRAS, 513, 3122
- Sommovigo et al. (2022b) Sommovigo L., et al., 2022b, MNRAS, 517, 5930
- Talia et al. (2021) Talia M., Cimatti A., Giulietti M., Zamorani G., Bethermin M., Faisst A., Le Fèvre O., Smolçić V., 2021, ApJ, 909, 23
- Tamura et al. (2019) Tamura Y., et al., 2019, ApJ, 874, 27
- Tamura et al. (2023) Tamura Y., et al., 2023, ApJ, 952, 9
- Topping et al. (2022) Topping M. W., et al., 2022, MNRAS, 516, 975
- Topping et al. (2023) Topping M. W., et al., 2023, arXiv e-prints, p. arXiv:2307.08835
- Varadaraj et al. (2023) Varadaraj R. G., Bowler R. A. A., Jarvis M. J., Adams N. J., Häußler B., 2023, MNRAS, 524, 4586
- Vijayan et al. (2023) Vijayan A. P., Thomas P. A., Lovell C. C., Wilkins S. M., Greve T. R., Irodotou D., Roper W. J., Seeyave L. T. C., 2023, arXiv e-prints, p. arXiv:2303.04177
- Watson et al. (2015) Watson D., Christensen L., Knudsen K. K., Richard J., Gallazzi A., Michałowski M. J., 2015, Nature, 519, 327
- Weaver et al. (2022) Weaver J. R., et al., 2022, ApJS, 258, 11
- Whitaker et al. (2017) Whitaker K. E., Pope A., Cybulski R., Casey C. M., Popping G., Yun M. S., 2017, ApJ, 850, 208
- Witstok et al. (2022) Witstok J., et al., 2022, MNRAS, 515, 1751
- Witstok et al. (2023) Witstok J., Jones G. C., Maiolino R., Smit R., Schneider R., 2023, MNRAS, 523, 3119
- Wong et al. (2022) Wong Y. H. V., et al., 2022, ApJ, 929, 161
- Zavala et al. (2021) Zavala J. A., et al., 2021, ApJ, 909, 165
- da Cunha et al. (2013) da Cunha E., et al., 2013, ApJ, 766, 13
- van der Vlugt et al. (2022) van der Vlugt D., Hodge J. A., Algera H. S. B., Smail I., Leslie S. K., Radcliffe J. F., Riechers D. A., Röttgering H., 2022, ApJ, 941, 10
Appendix A ALPINE analysis
We show the results of our analysis of the ALMA sample for the two redshift ranges centred on and in Fig. 11. The data are tabulated in Table 3. The individual points are plotted using the -values as derived by fitting to the best-fit SED by Faisst et al. (2020b) with some objects hitting the edge of parameter space, while the IRX value was recomputed in this work. The errors on the individual -slopes are smaller in ALPINE than in REBELS, due to the sources being in general brighter and having more photometric bands covering the rest-frame UV part of the SED. There are a larger fraction of non-detections in the dust continuum in ALPINE (80 percent; Fudamoto et al., 2020b) in comparison to REBELS (63 percent; Inami et al., 2022). From the bootstrap resampling used to derive errors on the stacked ALMA flux, we also find evidence for an increased scatter within the bins than found in the REBELS sample.
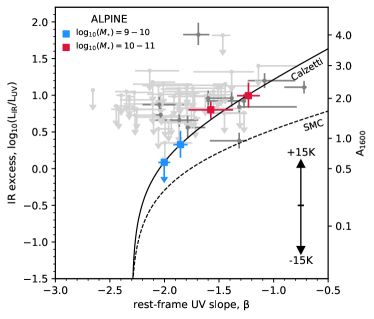
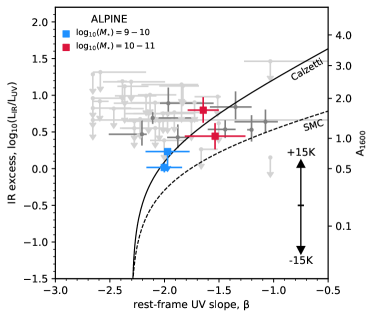
| Mass bin | bin | N | IRX | ||||||
|---|---|---|---|---|---|---|---|---|---|
| 9–10 | 7 | 4.53 | |||||||
| 9–10 | 34 | 4.52 | |||||||
| 10–11 | 7 | 4.52 | |||||||
| 10–11 | 6 | 4.52 | |||||||
| 9–10 | 5 | 5.43 | |||||||
| 9–10 | 18 | 5.57 | |||||||
| 10–11 | 5 | 5.47 | |||||||
| 10–11 | 4 | 5.57 |
Appendix B REBELS individual values
In Table 4 (continued in 5) we present the properties of the individual galaxies in the REBELS sample, as derived for our – and – analyses.
| ID | |||||||||
|---|---|---|---|---|---|---|---|---|---|
| REBELS-01 | 7.18* | ||||||||
| REBELS-02 | 6.64 | ||||||||
| REBELS-03 | 6.97* | ||||||||
| REBELS-04 | 8.57 | ||||||||
| REBELS-05 | 6.50* | ||||||||
| REBELS-06 | 6.80 | ||||||||
| REBELS-07 | 7.15 | ||||||||
| REBELS-08 | 6.75* | ||||||||
| REBELS-09 | 7.61 | ||||||||
| REBELS-10 | 7.42 | ||||||||
| REBELS-11 | 8.24 | ||||||||
| REBELS-12 | 7.35* | ||||||||
| REBELS-13 | 8.19 | ||||||||
| REBELS-14 | 7.08* | ||||||||
| REBELS-15 | 6.88* | ||||||||
| REBELS-16 | 6.70 | ||||||||
| REBELS-17 | 6.54* | ||||||||
| REBELS-18 | 7.68* | ||||||||
| REBELS-19 | 7.37* | ||||||||
| REBELS-20 | 7.12 | ||||||||
| REBELS-21 | 6.59 | ||||||||
| REBELS-22 | 7.48 | ||||||||
| REBELS-23 | 6.64* | ||||||||
| REBELS-24 | 8.35 | ||||||||
| REBELS-25 | 7.31* | ||||||||
| REBELS-26 | 6.60* | ||||||||
| REBELS-27 | 7.09* | ||||||||
| REBELS-28 | 6.94* | ||||||||
| REBELS-29 | 6.68* | ||||||||
| REBELS-30 | 6.98* | ||||||||
| REBELS-31 | 6.68 | ||||||||
| REBELS-32 | 6.73* | ||||||||
| REBELS-33 | 6.67 | ||||||||
| REBELS-34 | 6.63* | ||||||||
| REBELS-35 | 6.97 | ||||||||
| REBELS-36 | 7.68* | ||||||||
| REBELS-37 | 7.75 | ||||||||
| REBELS-38 | 6.58* | ||||||||
| REBELS-39 | 6.85* | ||||||||
| REBELS-40 | 7.37* |
| ID | |||||||||
|---|---|---|---|---|---|---|---|---|---|
| REBELS-P1 | 6.75* | ||||||||
| REBELS-P2 | 8.47 | ||||||||
| REBELS-P3 | 7.69 | ||||||||
| REBELS-P4 | 8.32 | ||||||||
| REBELS-P5 | 7.19 | ||||||||
| REBELS-P6 | 6.81* | ||||||||
| REBELS-P7 | 6.75* | ||||||||
| REBELS-P8 | 6.85* | ||||||||
| REBELS-P9 | 7.06* |
Affiliations
1Jodrell Bank Centre for Astrophysics, Department of Physics and Astronomy, School of Natural Sciences, The University of Manchester, Manchester, M13 9PL, UK
2Hiroshima Astrophysical Science Center, Hiroshima University, 1-3-1 Kagamiyama, Higashi-Hiroshima, Hiroshima 739-8526, Japan
3Scuola Normale Superiore, Piazza dei Cavalieri 7, I-56126 Pisa, Italy
4Astrophysics Research Institute, Liverpool John Moores University, 146 Brownlow Hill, Liverpool L3 5RF, UK
5National Astronomical Observatory of Japan, 2-21-1, Osawa, Mitaka, Tokyo 181-8588, Japan
6 Instituto de Estudios Astrofísicos, Facultad de Ingeniería y Ciencias, Universidad Diego Portales, Av. Ejército 441, Santiago, Chile
7Observatoire de Geneve, CH-1290 Versoix, Switzerland
8Leiden Observatory, Leiden University, NL-2300 RA Leiden, Netherlands
9International Centre for Radio Astronomy Research, University of Western Australia, 35 Stirling Hwy, Crawley 26WA 6009, Australia
10ARC Centre of Excellence for All Sky Astrophysics in 3 Dimensions (ASTRO 3D), Australia
11Institute for Astronomy, University of Edinburgh, Royal Observatory, Edinburgh, EH9 3HJ, UK
12Kapteyn Astronomical Institute , University of Groningen, NL-9700 AV Groningen, the Netherlands
13Sterrenkundig Observatorium, Ghent University, Krijgslaan 281 - S9, B-9000 Gent, Belgium
14Dept. of Physics & Astronomy, University College London, Gower Street, London WC1E 6BT, UK
15Waseda Research Institute for Science and Engineering, Faculty of Science and Engineering, Waseda University, 3-4-1 Okubo, Shinjuku, Tokyo 169-8555, Japan
16Departament d’Astronomia i Astrofısica, Universitat de Valencia, C. Dr. Moliner 50, E-46100 Burjassot, Valencia, Spain
17Dipartimento di Fisica, Sapienza, Universita di Roma, Piazzale Aldo Moro 5, I-00185 Roma, Italy
18Sapienza School for Advanced Studies, Viale Regina Elena 291, I-00161 Roma Italy
19INAF/Osservatorio Astronomico di Roma, via Frascati 33, I-00078 Monte Porzio Catone, Roma, Italy
20Istituto Nazionale di Fisica Nucleare, Sezione di Roma1, Piazzale Aldo Moro 2, I-00185 Roma Italy
21Centre for Astrophysics & Supercomputing, Swinburne University of Technology, PO Box 218, Hawthorn, VIC 3112, Australia
22Steward Observatory, University of Arizona, 933 N Cherry Ave, Tucson, AZ 85721, USA