[c,d]Z. Bardačová {NoHyper} ††footnotetext: Deceased.
Atmospheric muon suppression for Baikal-GVD cascade analysis
Abstract
Baikal-GVD (Gigaton Volume Detector) is a neutrino telescope installed at a depth of 1366 m in Lake Baikal. The expedition of 2023 brought the number of optical modules in the array up to 3492 (including experimental strings). These optical modules detect the Cherenkov radiation from secondary charged particles coming from the neutrino interactions. Neutrinos produce different kinds of topologically distinct light signatures. Charged current muon neutrino interactions create an elongated track in the water. Charged and neutral current interactions of other neutrino flavors yield hadronic and electromagnetic cascades. The background in the neutrino cascade channel arises mainly due to discrete stochastic energy losses produced along atmospheric muon tracks. In this paper, a developed algorithm for the cascade event selection is presented.
1 Introduction
Baikal-GVD (Gigaton Volume Detector) is a cubic kilometer scale neutrino observatory located in the southern part of Lake Baikal, Siberia. Currently (year 2023), its 3492 light sensors (optical modules - OMs, including experimental strings) detect the Cherenkov light that is produced by secondary charged particles originating from neutrinos interacting in the Baikal water. A three-dimensional array of OMs organized in so-called clusters is located at a depth of 1366m, about 3.6 km offshore [1]. The primary purpose of Baikal-GVD is to search for high-energy neutrinos that originate from the same cosmic particle accelerators, which produce very high energy cosmic rays. Moreover, the diffuse flux emitted collectively by unresolved astrophysical sources can be observed [2].
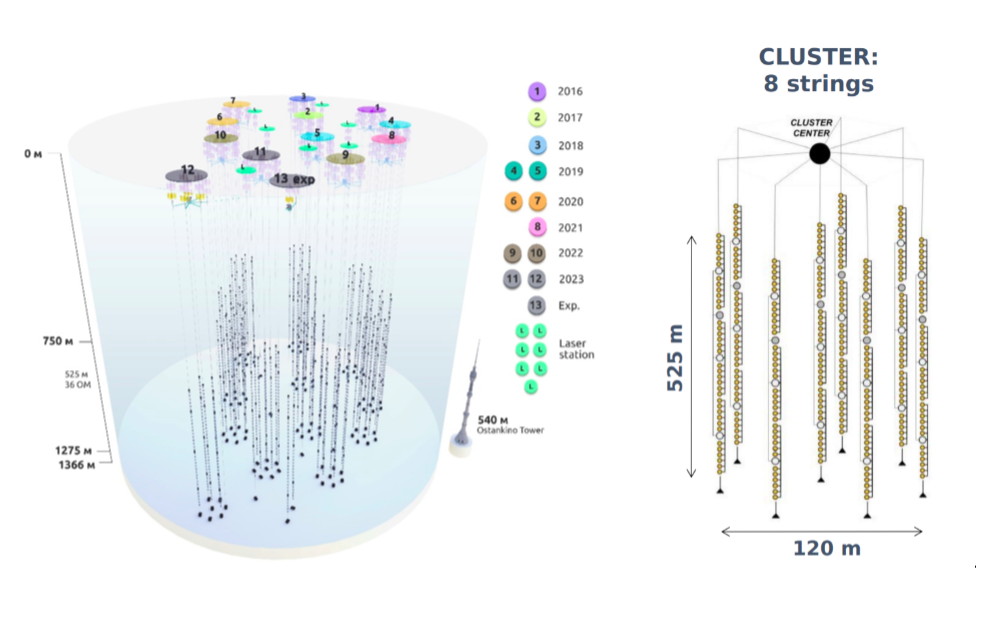
Thirty-six OMs are installed on each of the 96 vertical strings with the distance of 15 m between adjacent OMs, from 750 m to 1275 m below the surface. Most of the strings are arranged into independently operated clusters, while each cluster is composed of 8 strings. Each OM contains a 10-inch photo-multiplier tube (PMT) Hamamatsu R7081-100 housed in a 13-inch glass sphere. The schematic view of the Baikal-GVD detector is shown in Fig. 1.
Baikal-GVD primarily observes two topologically distinct classes of events: tracks and cascades. The charged current interaction of a muon neutrino () with matter results in an outgoing muon, which travels a long distance in water and leaves an elongated track signature. The cascade events arise from the interactions of all three neutrino flavours. The charged current (CC) electron neutrino () interaction and the neutral current (NC) electron, muon, and tau neutrino (, , ) interactions produce detectable cascade light signatures. In case of cascades most of the neutrino energy is deposited in a small volume, that results in a nearly spherical event. An advantage of the cascade channel over a track channel is that cascade events typically have allow for a better energy resolution, because the events can be fully contained inside the detector. However, it is more difficult in the case of cascades to reconstruct the initial direction of the neutrino.
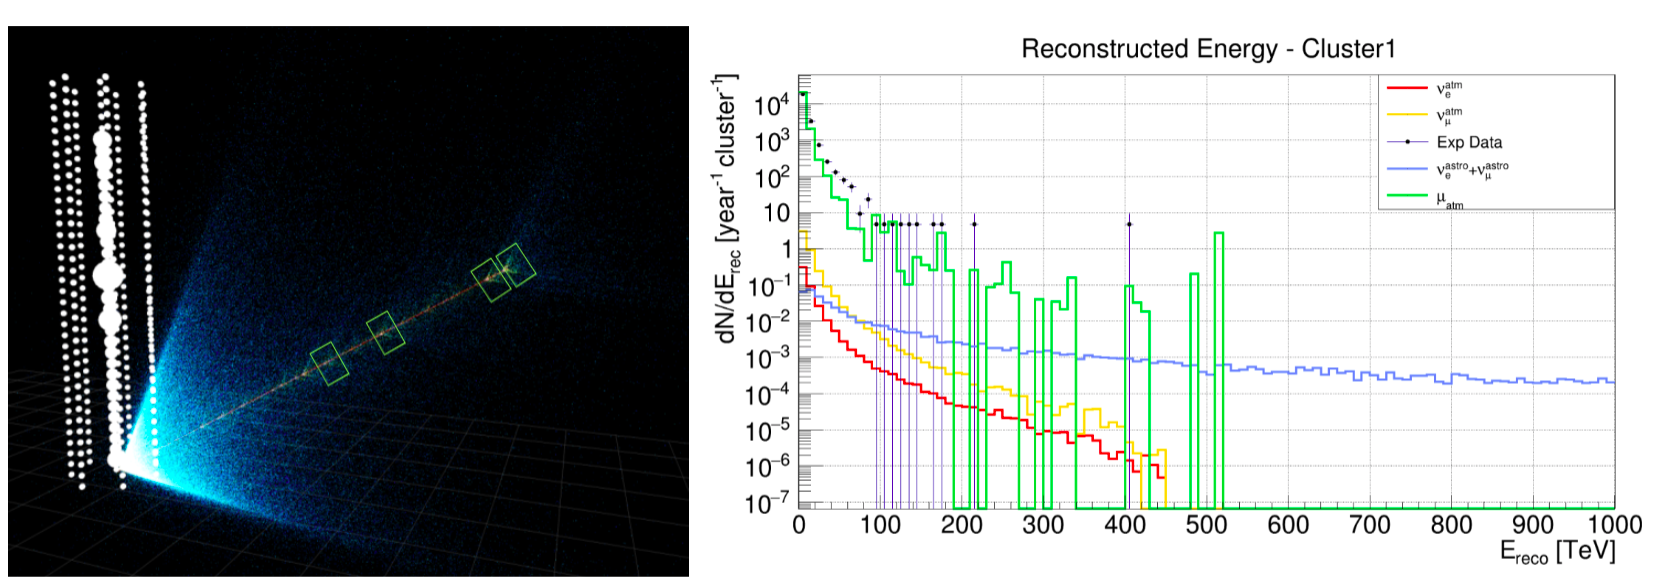
At the angles above the horizon, there is an overwhelming background of muons produced in air showers when cosmic rays enter the Earth’s atmosphere. Muons from the air showers come in bundles containing up to hundreds of muons. In the cascade channel, the main background originates from the discrete stochastic processes along the muon track as a result of bremsstrahlung, photonuclear processes or direct electron-positron pair production (see Fig. 2, left). Conventional rejection strategy for the atmospheric muon bundles is to select only events coming from the lower part of the detector (upgoing). However, the background cascade events may be wrongly reconstructed as upgoing, while they were truly downgoing muons. A search for the signal cascades is, therefore, challenging due to the high muon flux from the air showers.
In this work, developed and optimized techniques to separate the neutrino-induced cascades from the background (cascades from atmospheric muon bundles) are discussed. The main difference between signal and the background cascade is the presence of a muon track. The Cherenkov light from the muon track can change the cascade light signature and influence the cascade reconstruction variables. For development of the selection methods we used Monte Carlo (MC) simulations for the part of the 2019 season from April to June (5 cluster configuration). Each selection method provides an output variable, which are fed into a Boosted Decision Tree (BDT) [3]. The selection algorithm was optimized only with single-cluster data. Furthermore, the selected experimental neutrino cascade candidate was searched for among the multicluster events to find an indication of a muon track. Moreover, preliminary waveform analysis of that interesting event was performed.
2 Background Cascades
In this work, MC data sets for signal and background were generated for each cluster separately and used for development of the selection techniques. The arrangement of each cluster is set up to correspond to the average conditions during the initial phase of the 2019 season (between April 1 and June 30). During this interval, the optical activity (luminescence) of the lake is relatively low, and the noise rates fluctuate from 15 kHz (for the bottom OMs) to 50 kHz (for the OMs located at the uppermost sections) [4]. For comparison of the experimental data and MC samples we used runs from the same period with the effective livetime of 353 days (combined for all 5 clusters). Atmospheric and astrophysical neutrino events (only electron and muon) were considered as a signal. In the MC signal simulation dataset, neutrino energies range from 1 TeV to 400 TeV and from 1 TeV to 400 PeV for atmospheric and astrophysical neutrinos, respectively. The energy interval of cosmic ray protons in the background MC sample is from 240 GeV to 100 PeV. After MC simulations a reconstruction of the cascade energy and direction was used. A parallel package [5] has been used for the cascade reconstruction software. Fig. 2 (right) displays the event rate for the experimental data and MC datasets as a function of the reconstructed cascade energy. The cut applied on the events was that the horizontal distance of the reconstructed vertex position from the centre of the cluster can be no more than m. The rate of events is shown per cluster per one year. It can be observed that most of the reconstructed cascade-like events from the experimental data follow the MC background cascades from . According to the MC simulations the background cascades can also reach high energies. Note also that the event rate from downgoing is almost 4 orders of magnitude higher than the event rate from atmospheric neutrinos. Hence, the development of methods for the selection of neutrino cascades is essential.
3 Neutrino Cascade Selection Algorithm
Various selection methods for neutrino cascade events in the Baikal-GVD were implemented, tested, and optimized. Described technique for the selection analysis of signal and background cascades represents an additional step in the cascade selection algorithm [6]. The optimization was performed on the simulated data of background cascades from and signal cascades from and interactions. For the analysis we only took into account contained cascade-like events reconstructed as upgoing.
First, we developed the nTrackHits method that differentiates background and signal cascades by leveraging the existence of a muon track within the atmospheric muon bundle and its absence in the neutrino cascade events. The nTrackHits method selects hits with time residuals in the interval:
| (1) |
where is the OM hit time, , ns. The expected time , when the OM is supposed to detect a hit from the muon track is obtained from:
| (2) |
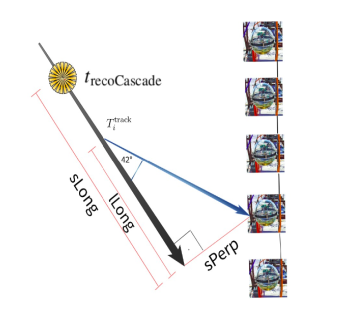
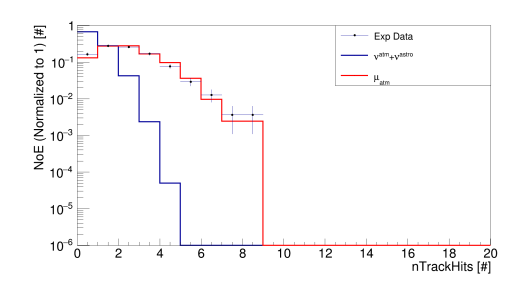
where is time of the reconstructed cascade, is the speed of light in water, and is the speed of light in vacuum (see Fig. 3 (left)). The track direction cannot be determined as the reconstructed cascade direction, because it can be misreconstructed due to track hits that were incidentally used in the reconstruction. Therefore, the nTrackHits is determined in each muon direction given by the iteration of the reconstructed cascade direction over azimuth and zenith angle in a cone with apex angle . The OM hit time dependence on the OM z position for the reconstructed background cascade from simulated MC event is displayed in Fig. 3 (right). Each color indicates a different origin of the hit. The nTrackHits method identifies the number of hits per event that fulfill the criteria for the muon track. Fig. 4 (left) displays the distribution of such nTrackHits for neutrino-induced cascade-like events (combined MC datasets and shown by blue line), background cascades (red line), and experimental data (black points). Signal cascades have also non-zero values of nTrackHits, which can be caused by mis-identified hits from the noise or cascade.
Another method, called BranchRatio, exploits the fact that for the background cascade events mis-reconstructed as upgoing, more OMs are hit located below the z coordinate of the reconstructed cascade position than above. This method results in the separation variable defined as .
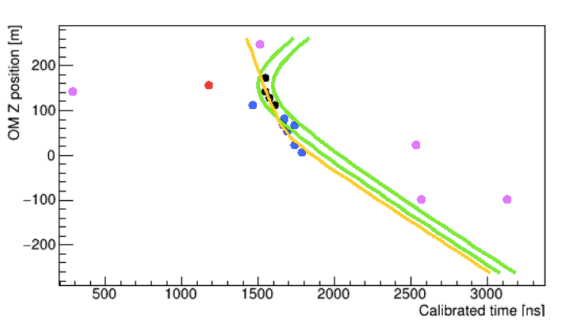
Neutrino cascades may also be separated from the background using the method referred to as QEarly inspired by the work of the ANTARESS collaboration [7]. The output of QEarly is the ratio of the overall charge of track hits and total charge of cascade hits (green band in Fig. 3 (right)), calculated as: , where is a constant that prevents QEarly from reaching infinity.
3.1 Multivariate Analysis
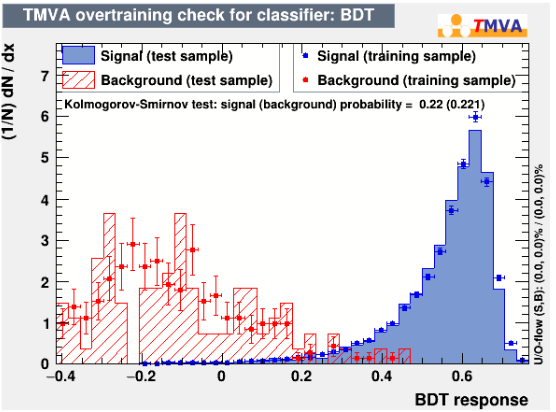
After the selection methods have been developed, five output variables from the cascade reconstruction of signal and background simulated datasets were chosen for the multivariate event classifier BDT within the TMVA package of the CERN ROOT framework [3]. Only cascades reconstructed as upgoing and contained were used in this BDT analysis. The five variables fed into the BDT are: nTrackHits, BranchRatio, QEarly, the Chi-Square after cascade position reconstruction, and the reconstructed zenith angle. The BDT response score is formed from the five variables given to the TMVA. The BDT response value for signal and background cascades is shown in Fig. 4 (right). The datasets used for the BDT training and testing have almost the same BDT response curves for both background and signal, however it can be clearly observed that in the case of background, statistics is the limiting factor. As a result of the BDT analysis relative importance of the individual variables is determined. The QEarly method has the highest separation power, while nTrackHits method is also able to separate between signal and background to a considerable extent.
Subsequently, the optimal cut on the BDT response score (0.48) was determined according to the maximal significance and applied to the experimental data. Signal efficiency is after applying the BDT cut and the background has been reduced to the magnitude on the order of 1 event per cluster per year. Additionaly to the BDT cut, we applied a 50 TeV cut on the reconstructed energy to search for the high-energy reconstructed cascade events in the experimental data. One well-reconstructed cascade-like event fulfills the criteria imposed on the BDT output value and reconstructed energy. The event was reconstructed with energy = 83.3 TeV as contained in Cluster 1 and upgoing direction with zenith angle = 70.9 . For further details on this event refer to Tab. 1.
| Cl | [TeV] | [] | [] | [m] | L | Q [p.e.] | nHits | nRecoHits | nTrackHits |
|---|---|---|---|---|---|---|---|---|---|
| 1 | 83.3 | 70.9 | 4.96 | 47.65 | 1.01 | 1665.01 | 106 | 44 | 1 |
3.2 Multicluster Search and Preliminary Waveform Comparison
For the abovementioned upgoing event, there are some indications that it can be possibly of the neutrino origin. However, a more complex analysis is required to confidently determine if that cascade-like event comes from the neutrino interaction. For that purpose, a search for this cascade event in the multicluster regime has been performed. A multicluster event is required to leave a signal in two or more clusters at once. This detection mode can be very useful as a veto for the background cascades produced along muon tracks. In addition to the detection of background cascade, a long-range muon track can also be detected in other clusters. Therefore, it is more likely that such event will be found in the multicluster data.
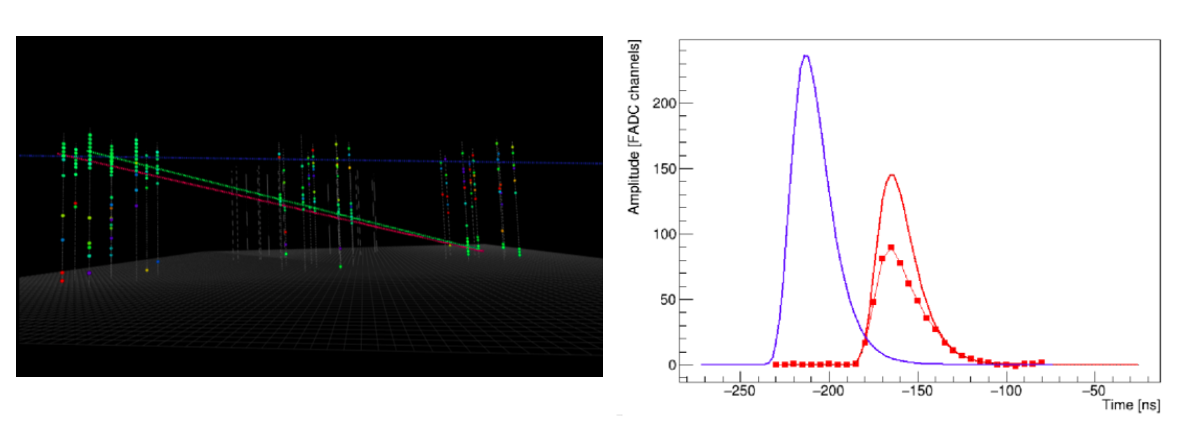
For example, a cascade-like event detected in 2019 on Cluster 5 was also found in multicluster data. This event was reconstructed as downgoing and it passed the standard reconstruction quality selection criteria. Indeed, Fig. 5 (left) shows that this event was also detected in two other clusters. It suggests that this cascade-like event comes from the background, and the corresponding muon was detected in two additional clusters. Subsequently, we tried to search for the muons independently reconstructed in the single-cluster track reconstruction mode [8]. For this event, two tracks were reconstructed as downgoing, one of them in Cluster2 and the second one in Cluster3. We conclude that this cascade-like event is most probably of background origin. This procedure was also preformed for the upgoing event described in Tab. 1, in which case the event was not found among multicluster events, suggesting that additional muon tracks are not present.
After that, the preliminary waveform analysis was performed. In this analysis the comparison of the expected waveforms of the pulses (i.e. time and amplitude) induced by the cascade or muon track with the real detected waveforms at the OMs was performed. The analytical formula for the real pulse waveform can be described by a Gumbel function, as follows:
| (3) |
where is a scaling amplitude factor, is the time when the pulse reaches maximum amplitude and is the width of Gumbel function. The expected amplitude for the hit coming from the cascade is obtained from the pre-calculated MC tables. The expected amplitude for a track hit from a TeV muon can be estimated according to the following function:
| (4) |
where is distance between the position of hit OM and point of light emission from the track (illustrated blue line in Fig. 3 (left)), m is the light absorption length in the deep lake water and is the relative sensitivity of the -th OM as a function of the angle between the OM vertical axis and incidence of the incoming light. The track direction is assumed to be the direction in which the most of track hits were obtained by nTrackHits method.
The waveform comparison was done for the upgoing event (Tab. 1). This is illustrated in Fig. 5 (right), where the waveform registered by one particular OM is compared to the cascade and track model predictions. No track hits are observed at the times. Hence, in accord with the multicluster analysis, the waveform procedure does not exhibit the presence of muon track for this upgoing event.
4 Conclusion
Several selection methods for the neutrino cascades have been developed. They were optimized with Monte Carlo simulations for season 2019. The corresponding background rejection variables were used for training and testing of a Boosted Decision Tree (BDT). The BDT was trained and tested with the contained upgoing neutrino and background cascades. Furthermore, experimental data from season 2019 were analyzed. In the search for the neutrino cascade candidates with higher energy in experimental data we applied cuts on the BDT output value and the reconstructed energy. One contained upgoing event was reconstructed with 83.3 TeV energy. Moreover, a multicluster analysis of that experimental event and a preliminary waveform comparison were performed. No muon counterparts were found in the multicluster data and the recorded PMT waveforms do not support a muon track origin of the event. Hence this event is likely a genuine neutrino event.
References
- [1] Baikal-GVD Collaboration: A.D. Avrorin et al., Deep-Underwater Cherenkov Detector in Lake Baikal, J.Exp.Theor.Phys. 134 (2022) 4, 399-416, doi:10.1134/S1063776122040148
- [2] Baikal-GVD Collaboration: V. A. Allakhverdyan et al., Diffuse neutrino flux measurements with the Baikal-GVD neutrino telescope, Phys.Rev.D 107 (2023) 4, 042005, doi: https://doi.org/10.1103/PhysRevD.107.042005
- [3] A. Hoecker et al., TMVA 4 - Toolkit for Multivariate Data Analysis with ROOT, Users Guide (2017). arXiv:physics/0703039
- [4] Baikal-GVD Collaboration, E. Eckerová, et al., Luminescence of Baikal Water as a Dynamic Background of the Baikal-GVD Neutrino Telescope 2021 JINST 16 C11011
- [5] O. Tange, GNU Parallel - The Command-Line Power Tool, The USENIX Magazine (2011), doi: 10.5281/zenodo.16303
- [6] Baikal-GVD Collaboration: Z. Bardačová et al., Selection techniques of neutrino-induced cascades in the Baikal-GVD neutrino telescope, PoS ECRS (2023) 098, doi: 10.22323/1.423.0098
- [7] ANTARES Collaboration: A. Albert et al., An algorithm for the reconstruction of neutrino-induced showers in the ANTARES neutrino telescope, arXiv:1708.03649 [astro-ph.IM], doi:10.3847/1538-3881/aa9709
- [8] Baikal-GVD Collaboration, Measuring muon tracks in Baikal-GVD using a fast reconstruction algorithm, Eur.Phys.J.C 81 11, 1025. 2021