Simulations of Nanocrystalline Iron Formation under High Shear Strain
Abstract
High-shear methods have long been used in experiments to refine grain structures in metals, yet the underlying mechanisms remain elusive. We demonstrate a refinement process using molecular dynamic simulations, wherein nanocrystalline structures are generated from initially perfect lattices under high-shear strain. The simulation cells undergo a highly disordered state, followed by recrystallization and grain coarsening, resulting in nanograins. We explore the dependence on parameters such as temperature, heat dissipation rate, shear strain rate, and carbon impurity concentration. Higher temperatures lead to the formation of larger and longer grains. The faster heat dissipation sample initially yields more small grains, but their number subsequently reduces, and is lower than the slower heat dissipation sample at approximately 1.5 strain. Slower strain rates do not promote nanograin formation. The presence of carbon impurities appears to have little effect on grain formation. This detailed analysis affords insight into the mechanisms that control the formation of nanograins under high-shear conditions.
I Introduction
Grain refinement can be achieved through various methods, including the use of chemical refiners or spray-forming techniques [1]. An attractive approach to accomplish grain refinement is through severe plastic deformation (SPD) techniques, such as accumulative roll bonding (ARB) and equal channel angular pressing (ECAP) [2]. High-shear methods, such as high-pressure torsion (HPT), can significantly alter the microstructure of metals. Numerous materials, including Al, Cu, and Mg alloys, have shown a reduction in grain size with increasing shear strain [3, 4, 5, 6, 7]. Yusuf et al. [7] observed a reduction in grain size with increasing shear strain for 316L stainless steel, which also correlates with an increase in Vickers microhardness. Despite numerous experimental studies attempting to elucidate the mechanisms of nanocrystal formation with increased shear strain, the results are inconclusive [8].
The leading theory for grain refinement suggests that dislocations are generated in the material due to shear strain. These dislocations accumulate and form subgrain boundaries. As the shear strain increases, dislocations are annihilated at these boundaries, leading to a rise in the misorientation angle between grains. Some of the formed dislocations are not absorbed and persist, forming low-angle grain boundaries (LAGBs), which perpetuates the grain refinement process [4, 8, 9, 10].
Other factors can also influence grain refinement, such as the number and distribution of precipitates within the material [11, 12, 13], as well as the presence of twinning deformation [14, 15]. Isik et al. [16] observed a grain subdivision and grain refinement through a deformation-induced martensitic phase transformation, from phase in Co-28Cr-6Mo alloy.
Numerous computational methods have been employed to explore the mechanism of grain refinement through plastic shearing. Finite element analysis (FEA) has been used to understand how the HPT process can modify the samples [17, 18, 19, 20]. FEA simulations greatly depend on the constitutive model used during the simulation [21]. As such, the physics of a given FEA system are largely defined by the constitutive model, which may not allow other physical mechanisms of grain refinement to exist within the simulation, which in turn affects the observable deformation modes. Nevertheless, numerous FEA studies have been conducted that draw conclusions on possible grain refinement mechanisms under shear strain. Wei et al. [22] investigated the mechanisms of grain refinement in single crystal Ni subjected to HPT, employing crystal plasticity finite element simulations. The results proposed the existence of two rotation modes that directly contributed to the formation of grain boundaries with high misorientations. Additionally, FEA simulations of high angle pressing (HAP) were conducted by Frydrych et al. [23] to explore the mechanism of grain refinement in an already nanocrystalline face-centered cubic (FCC) material. This study confirmed that initial grain orientation was a major indicator of their susceptibility to further refinement. The study showed that grains which had larger Taylor factors were more prone to refinement. A larger Taylor factor corresponds to greater plastic work done, when compared over the same range of slip [24]. The work of Frydrych [23] makes no further attempt to quantify the orientations, making it difficult to obtain exact lattice orientations that are more prone to refinement.
Molecular dynamics (MD) simulations have been employed to study microstructural evolution in metals subjected to SPD [25, 26, 27, 28, 29, 30, 31]. However, most of these studies start with simulation cells that are already in a nanocrystalline state, and therefore, do not explore the mechanisms by which a single crystal can transform into a nanocrystalline state. Interestingly, the work of Nikonov [31] used MD simulations to shear a perfect, single crystal simulation cell. However, the results were only used for shear stress vs. strain comparisons with a polycrystalline box, and no conclusions were reached about the single crystal shear. The work of Guan et al. [32] attempted to replicate the HPT process using an MD simulation of Aluminum. However, similar to the other MD investigations mentioned above, the initial box was already in a nanocrystalline state before the shearing took place, and thus, there was no investigation into the actual formation of nanocrystals.
The precise underlying processes responsible for the development of a nanocrystalline microstructure via HPT remains elusive. Despite the significant disparity between shear rates in simulations and experimental settings, we conducted molecular dynamics simulations on iron to gain insights into potential mechanisms through which shear could induce the formation of nanocrystalline structures. Additionally, we scrutinized the progression of microstructures to facilitate meaningful comparisons with experimental observations.
Iron is chosen as the material of the current study because of its diverse uses in domestic and industrial applications. Especially, in advanced fission and future fusion reactors [33, 34, 35], iron-based steels, such as ferritic/martensitic (FM) steels, are chosen as the structural material. FM steels have the same body-centred cubic (BCC) crystal structure as iron. It was shown experimentally that FM steels exhibited less neutron irradiation-induced swelling than austenitic steels with face-centred cubic (FCC) structure [36].
In the following, we first discuss our simulation methods. Then, we present our simulation results and discuss potential mechanisms underlying the observed phenomena. We also draw comparisons with experimental HPT studies.
II Simulation setup
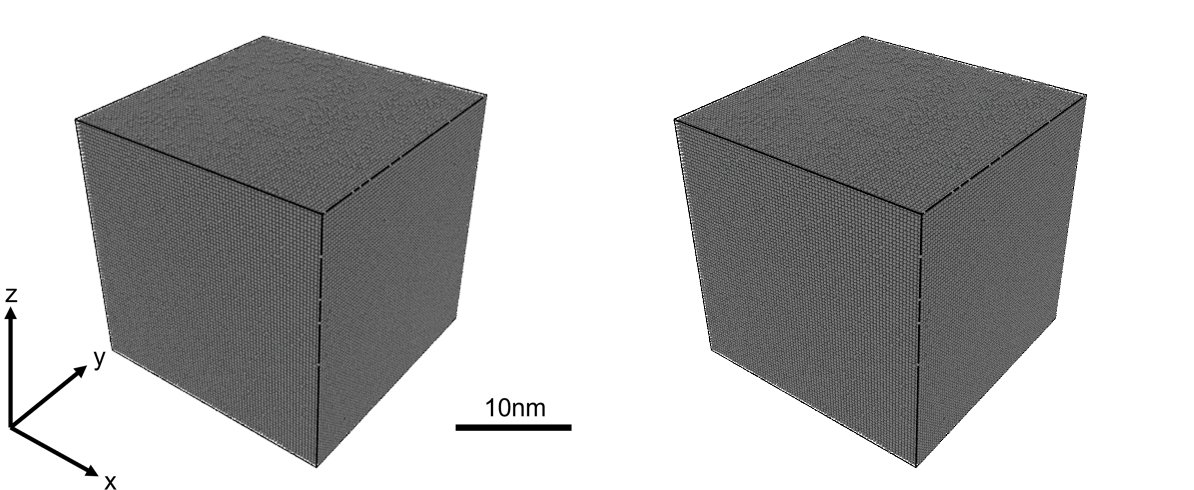
All MD simulations were carried out using LAMMPS [37]. Simulation cells were created using Atomsk [38]. We constructed perfect crystal simulation cells with unit cells, where each unit cell contains 2 atoms in BCC structure with a lattice parameter of 2.8665 Å, corresponding to Fe. Each simulation cell contains 1,024,000 atoms. The starting crystal orientations are x = [100], y = [010], and z = [001]. Periodic boundary conditions are applied in all three directions.
We also examined the effect of carbon impurities. We created simulation cells by adding 102 carbon atoms into those perfect cells at random positions. This corresponds to a carbon impurity content of 100 appm.
We adopted the interatomic potential for Fe developed by Ackland et al. [39], which has been widely used to investigate the microstructure evolution of iron [40, 41, 42, 43]. For Fe-C simulations, we used the Hepburn-Ackland FeC interatomic potential [44], which was developed based on the aforementioned Ackland Fe potential. It has been used in several studies concerned with the effect of carbon on the microstructural evolution of iron [45, 46, 47, 48].
The trajectory of a system of interacting atoms is governed by the Langevin equation of motion:
| (1) | |||||
| (2) |
where , , and are position, velocity, and force associated with atom . is the interatomic potential energy. is the mass of an atom. The temperature is controlled by the Langevin thermostat, where the damping parameter is related to the delta-correlated fluctuating force according to the fluctuation-dissipation theorem [49, 50], namely,
| (3) |
| (4) |
where and are Cartesian coordinates, and
| (5) |
The fluctuation and dissipation of atoms can be considered as a result of electron-phonon interaction, so describes the strength of electron-phonon coupling. We used the electron-phonon coupling parameter for Fe according to Mason et al. [51], such that eV fs Å-2. We denote this as . In some simulations, we used a damping parameter that is ten times larger, which is denoted as . If we do not explicitly mention the value of below, we are using .
Before applying any shear, the simulation cells are thermalised to particular temperatures. The cell volumes are also relaxed isotropically, so they attain stress-free conditions. This is done under isobaric conditions with zero hydrostatic stress.
Shear was imposed by continually deforming the simulation cell. The shear strain is applied on the xy plane with displacement in the x direction. This was done by imposing a cell tilt factor change, which is effectively an engineering strain. A total simulation time of 335 ps was used, with a maximum final shear strain of . This means the shear rate is approximately s-1. We also performed the same simulation with a 10 times longer simulation time, corresponding to a 10 times lower strain rate.
To avoid boundary self-interactions, we remap the simulation cell when the tilting is more than 0.5 of the cell length. The cell vector and the positions of atoms are remapped along the shearing direction, with the simulation cell going from a 0.5 to a -0.5 tilt. It is important to note that, due to the periodic boundary conditions, there is no change in the local atomic environment.
We used OVITO [52] for analysis. Grains are identified using the grain segmentation modifier. The minimum grain size was chosen as 50 atoms. We discuss the effect of using a different number of atoms as the minimum grain size in Appendix A3. Since this algorithm requires the crystal orientation of each atom, the polyhedral template matching (PTM) modifier [53] is adopted beforehand. PTM can determine the local crystal orientation of each atom in terms of a quaternion, where each quaternion can be projected into Rodrigues space [54]. Then, the orientation of each atom in this space can be visualised by mapping orientation to an RGB colouring scheme [55]. Dislocation lines are detected using the dislocation analysis (DXA) modifier [56].
III Results
We first present the results of our simulations exploring the influence of shear strain on initially perfect, single-crystalline iron. Next, we investigate the behaviour of samples under various conditions, including differing temperatures, damping parameters, strain rates, and the presence of carbon impurities.
III.1 Shear-induced nanocrystalline structure
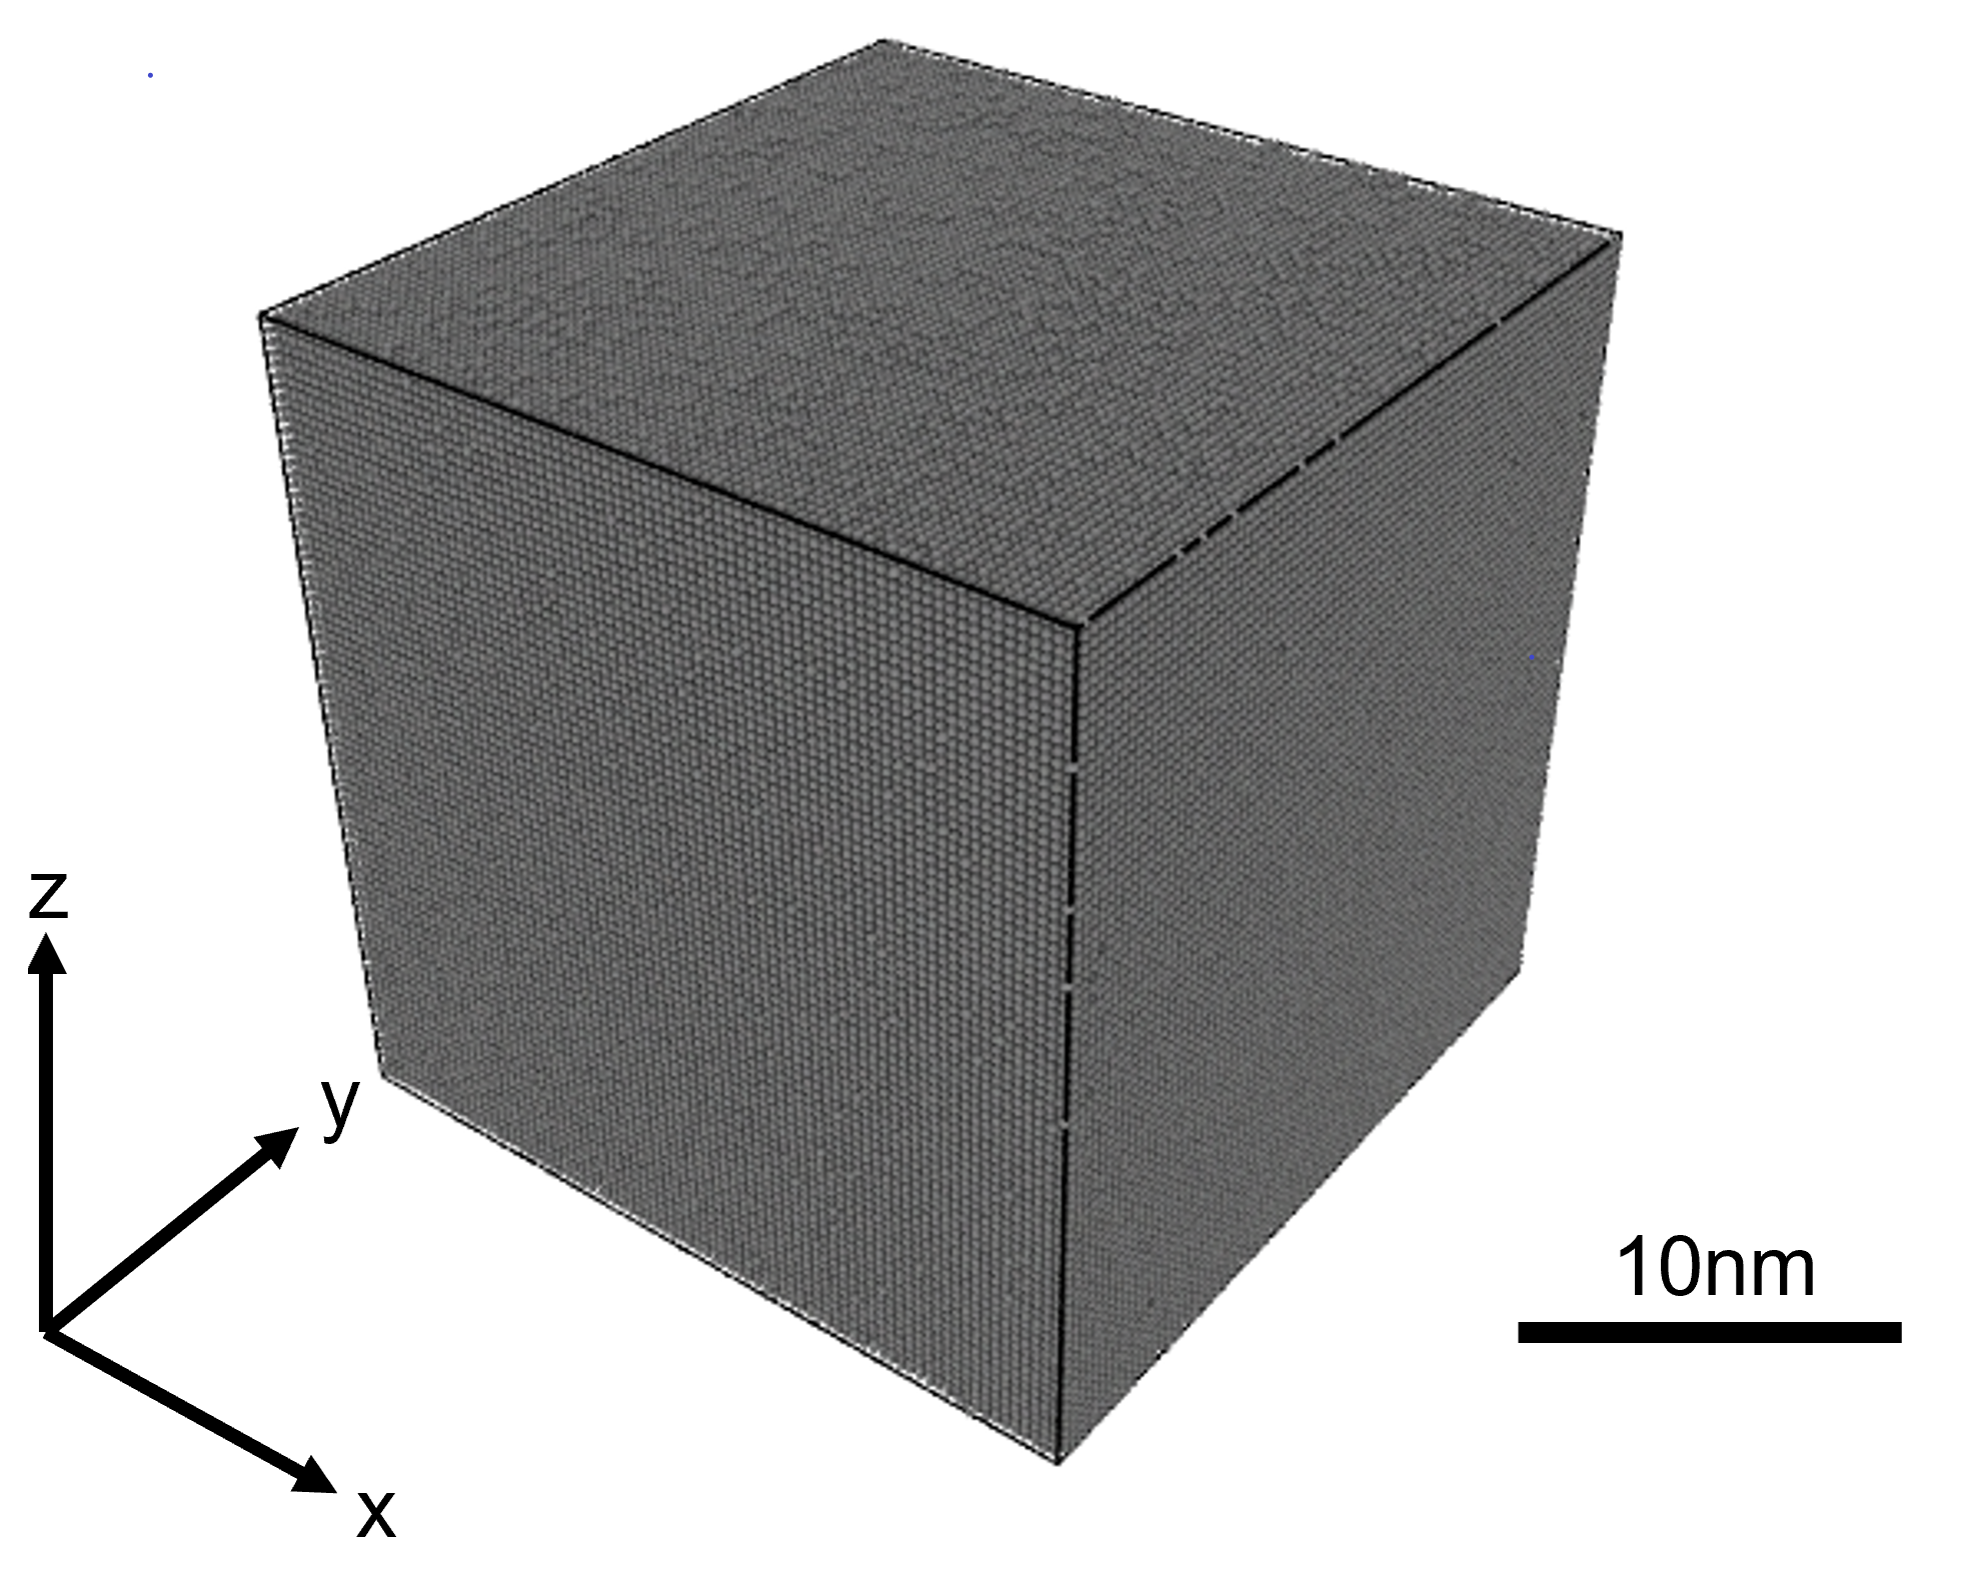
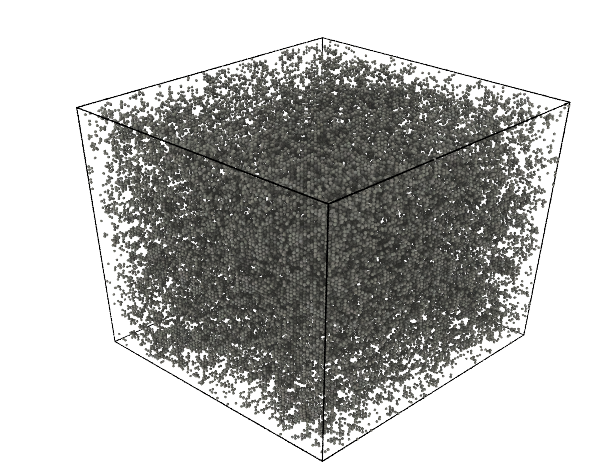
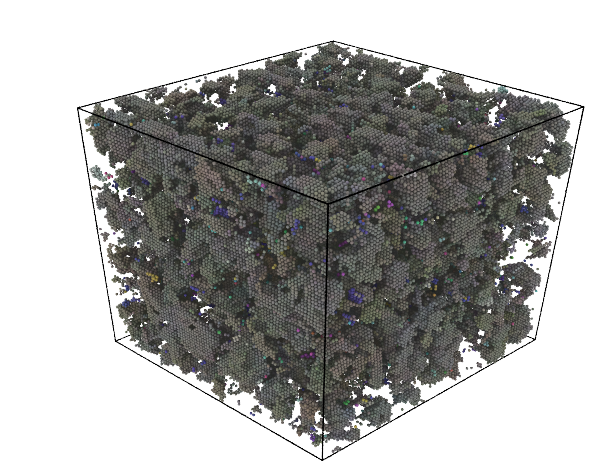
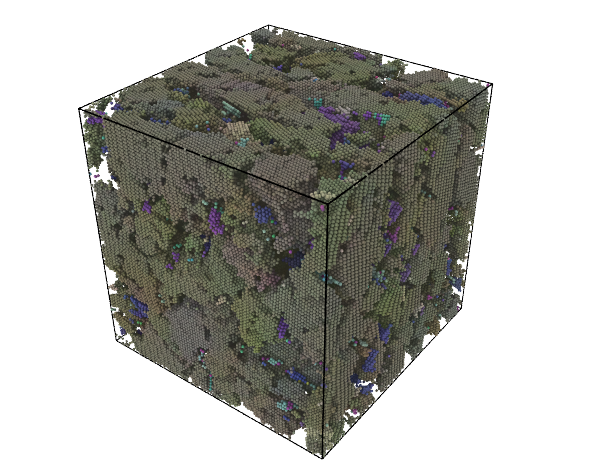
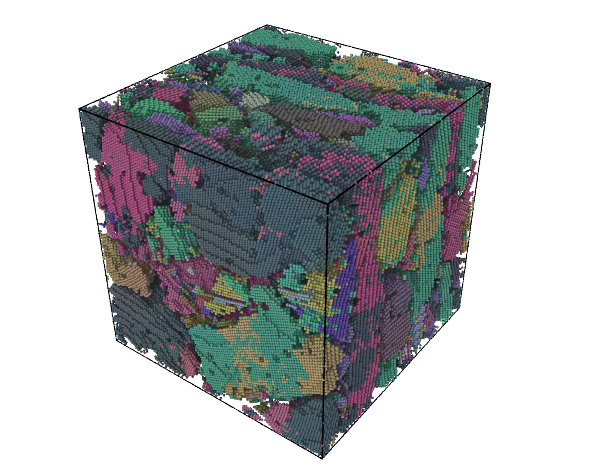
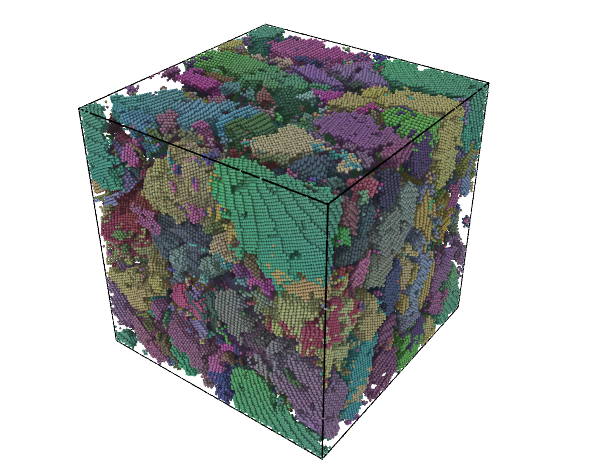
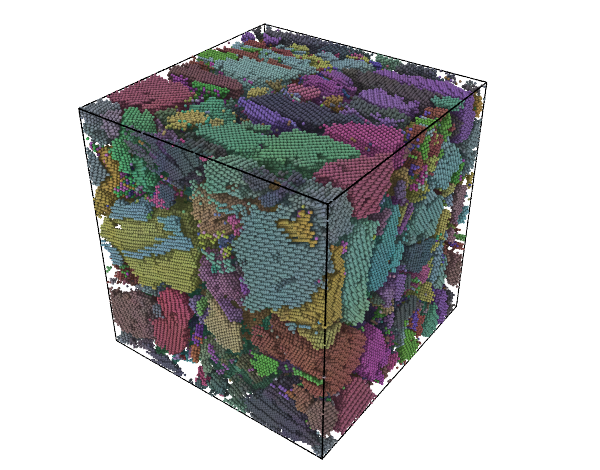
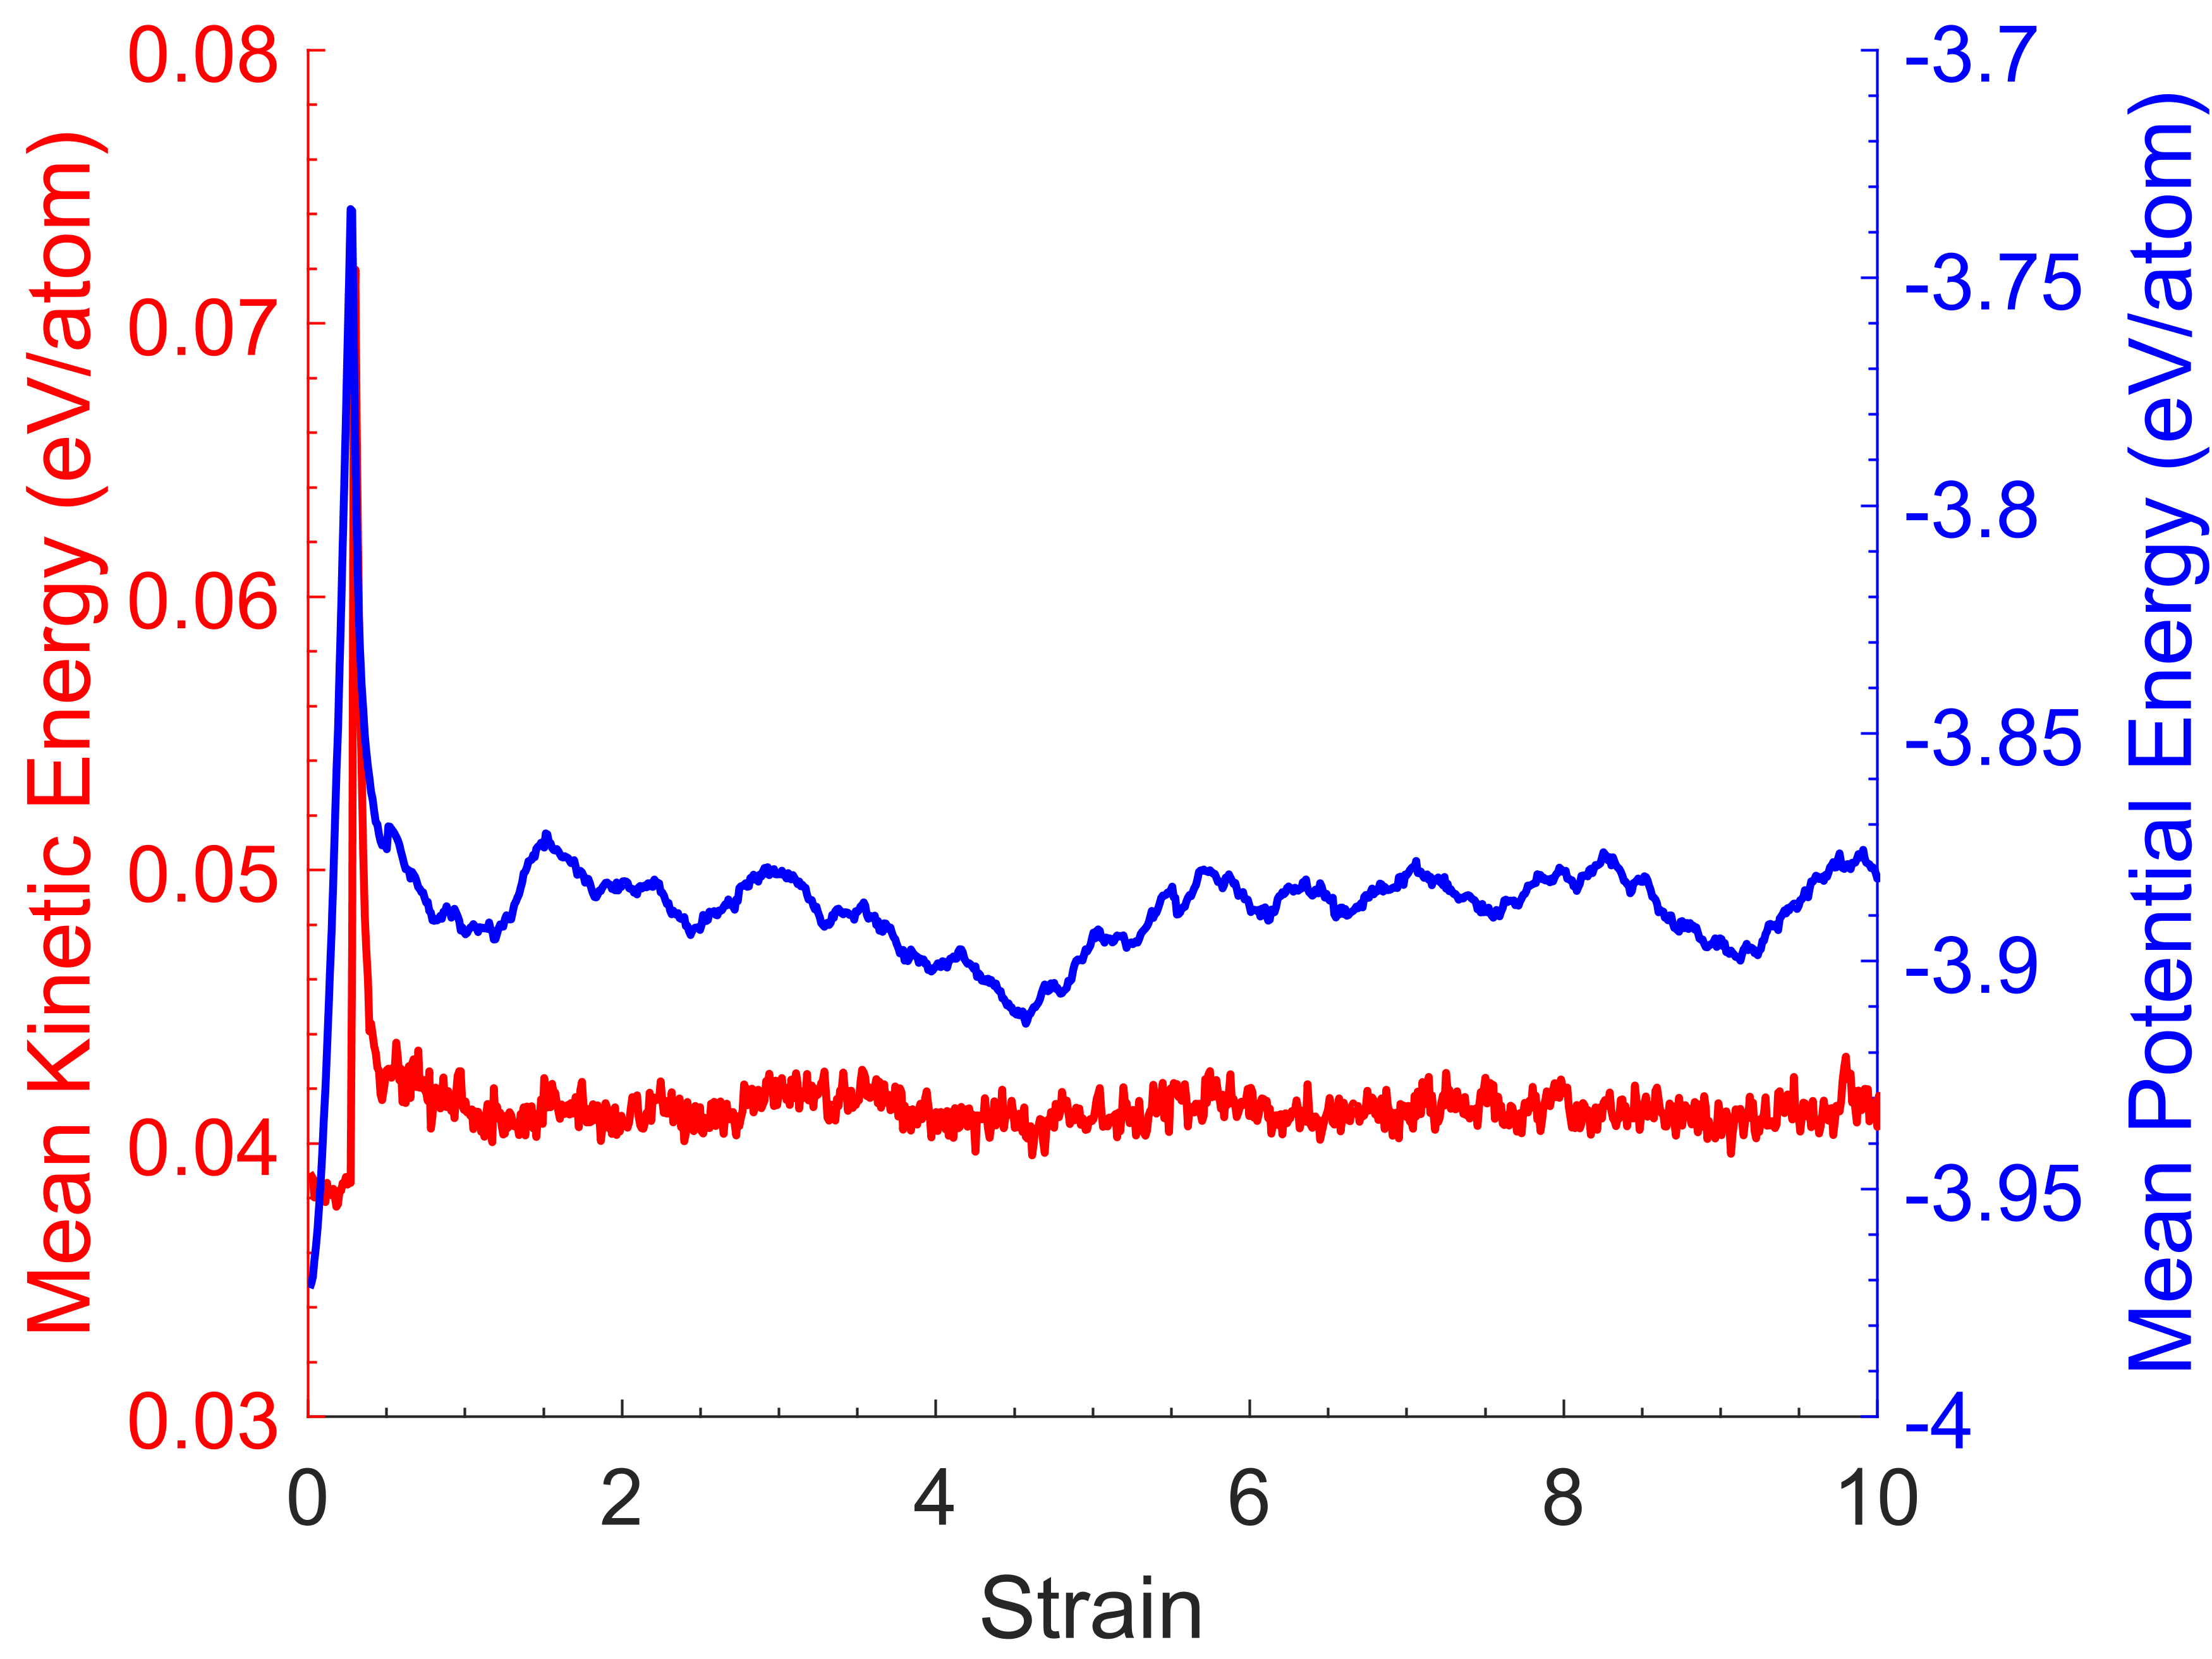
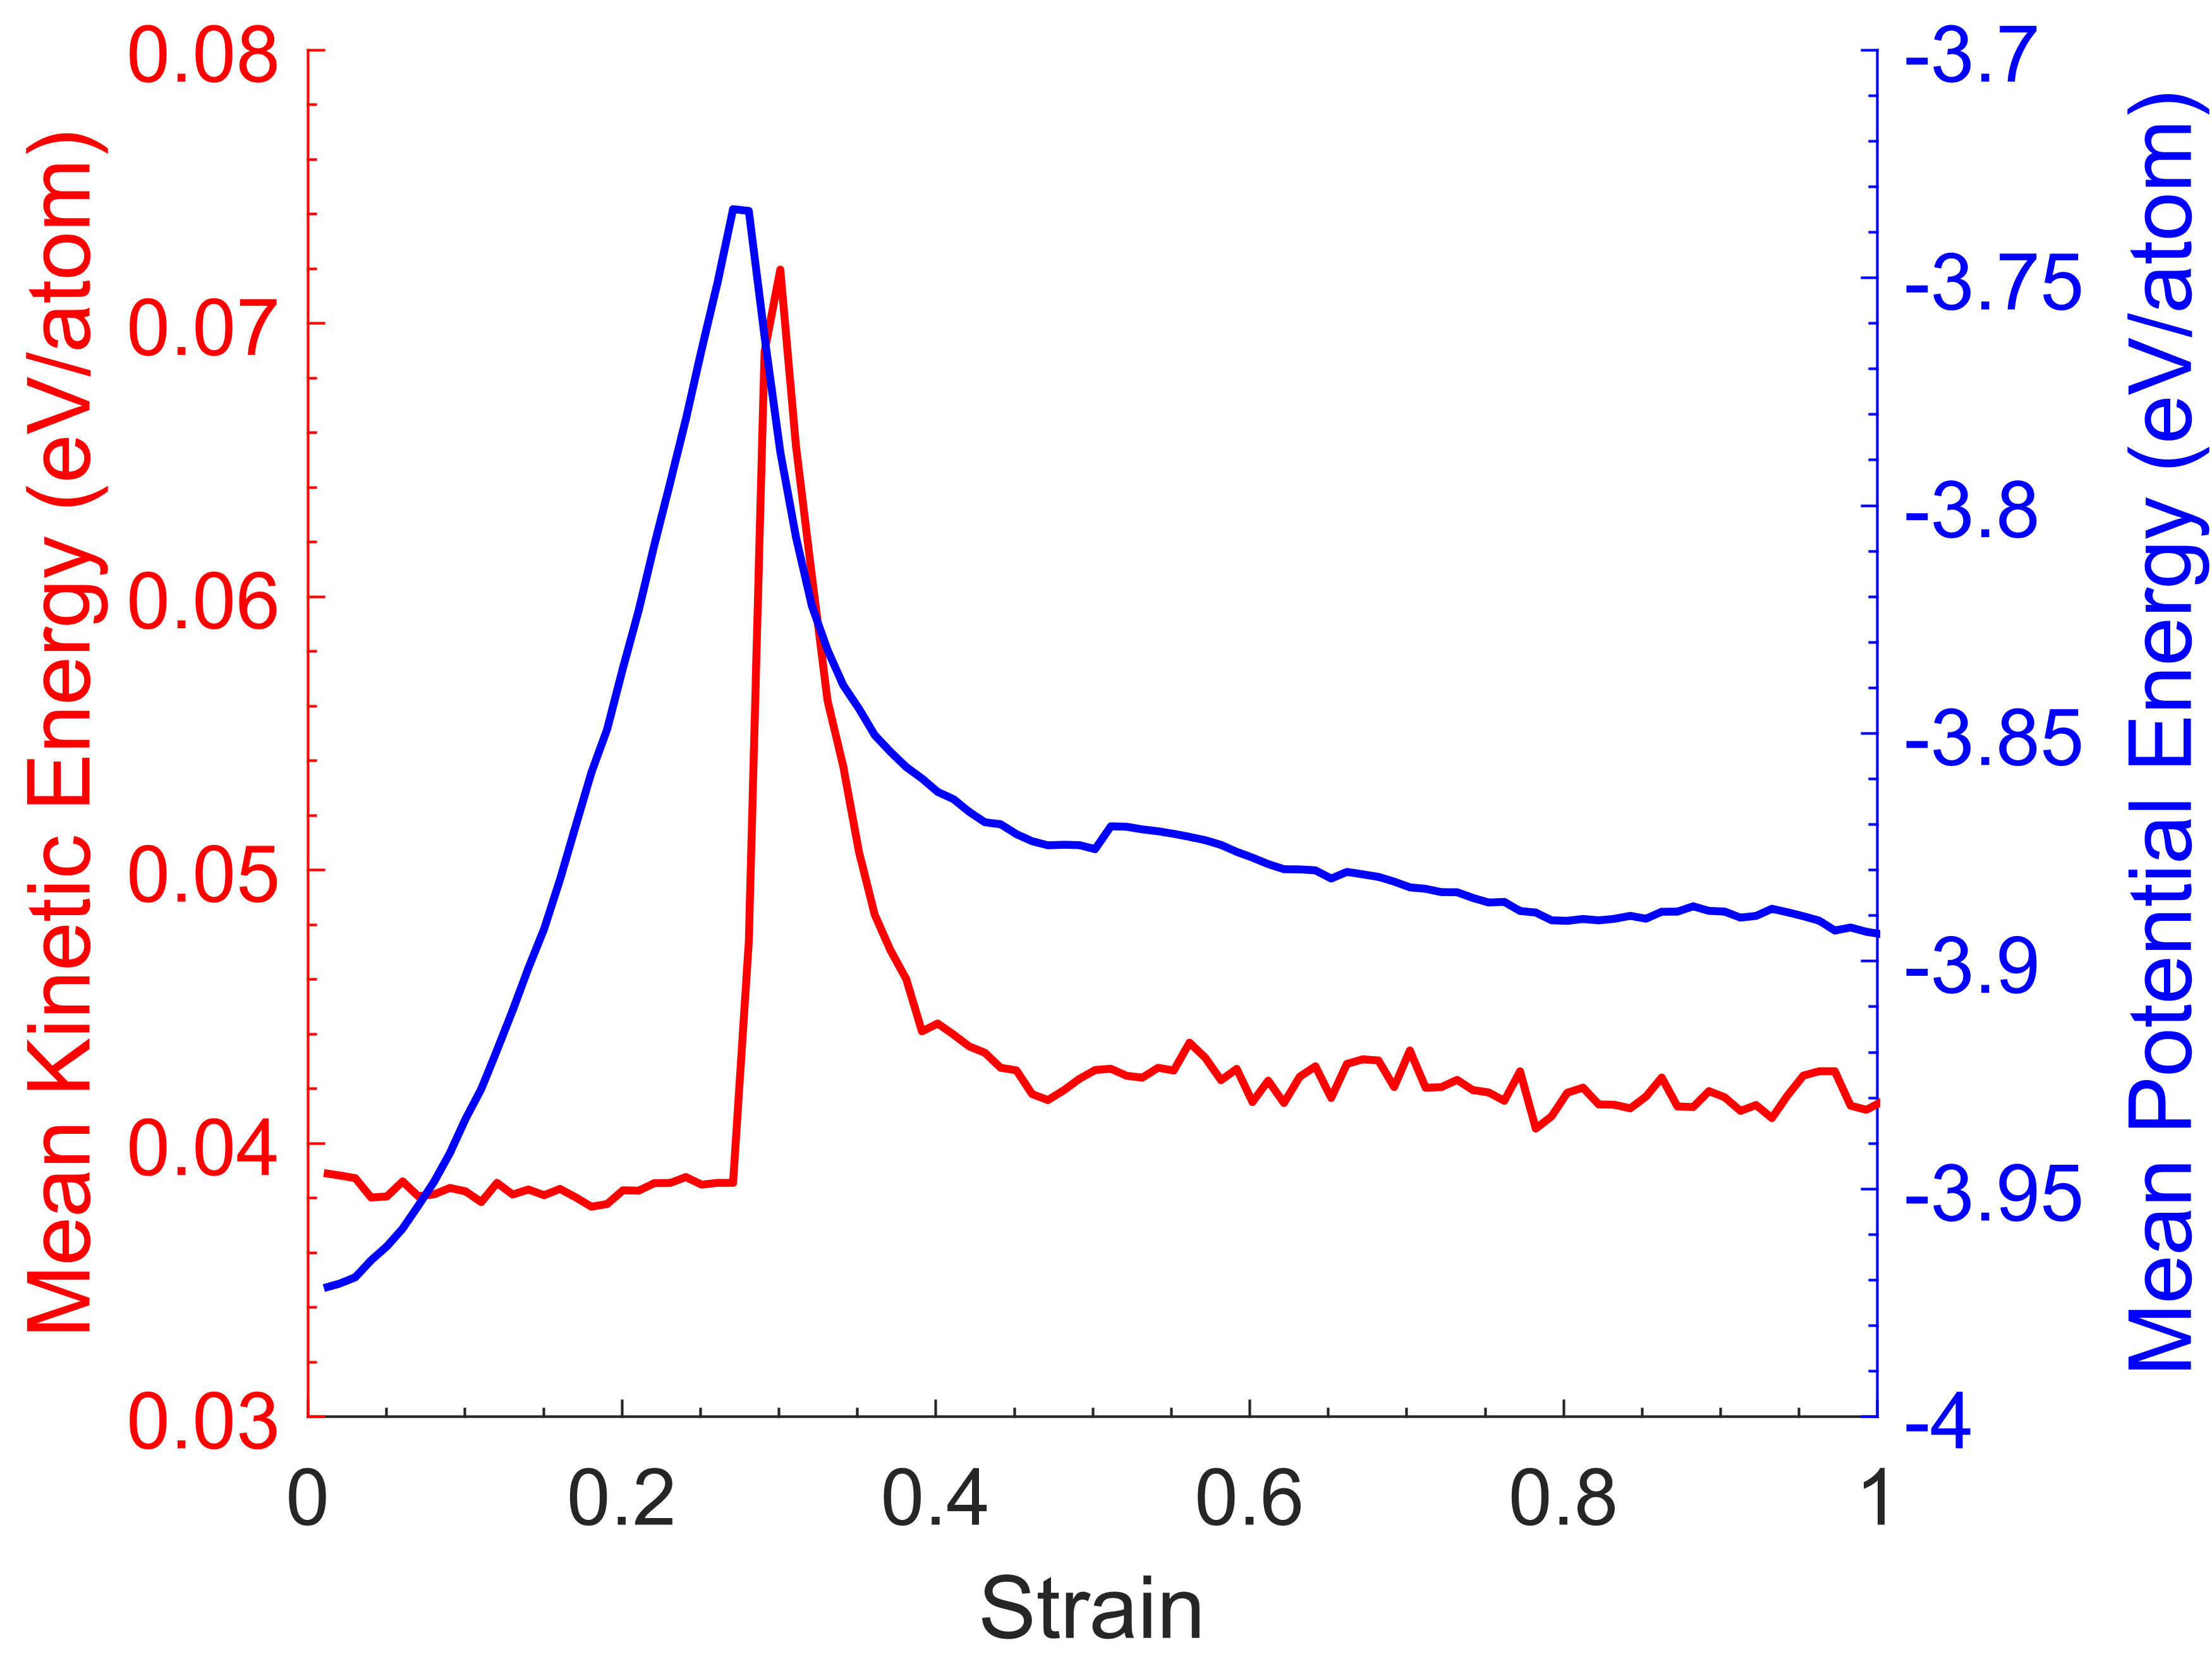
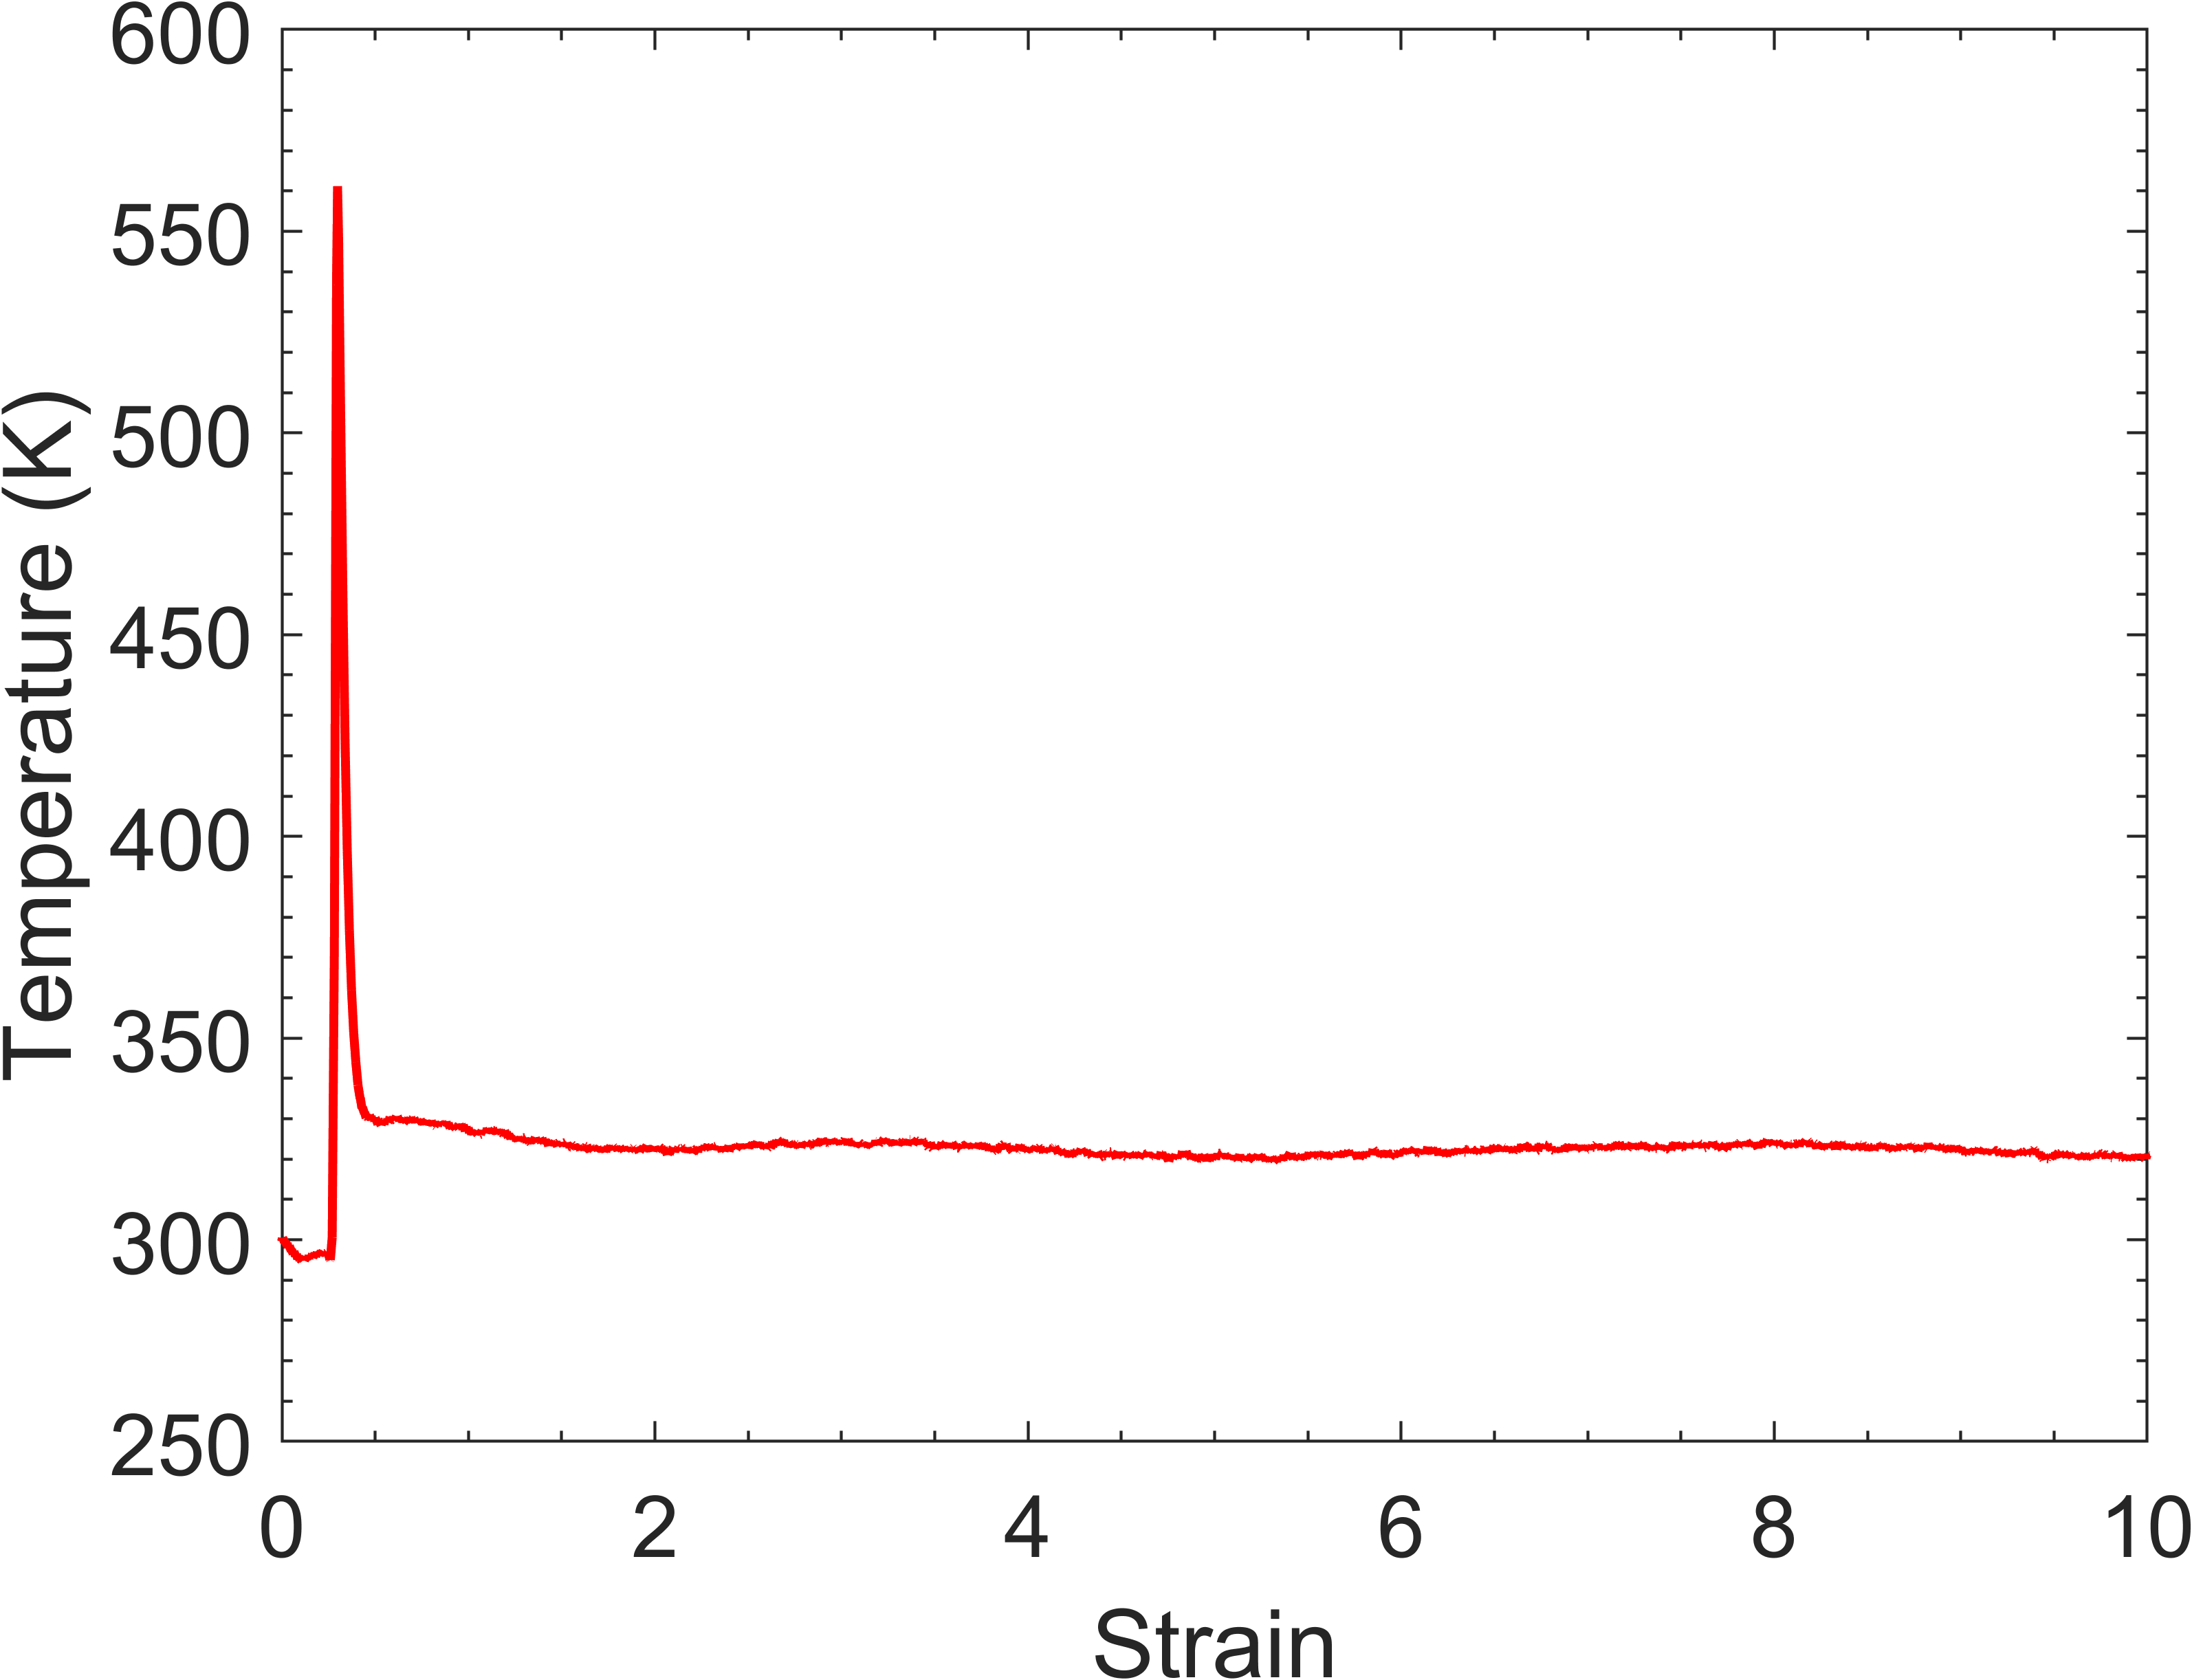
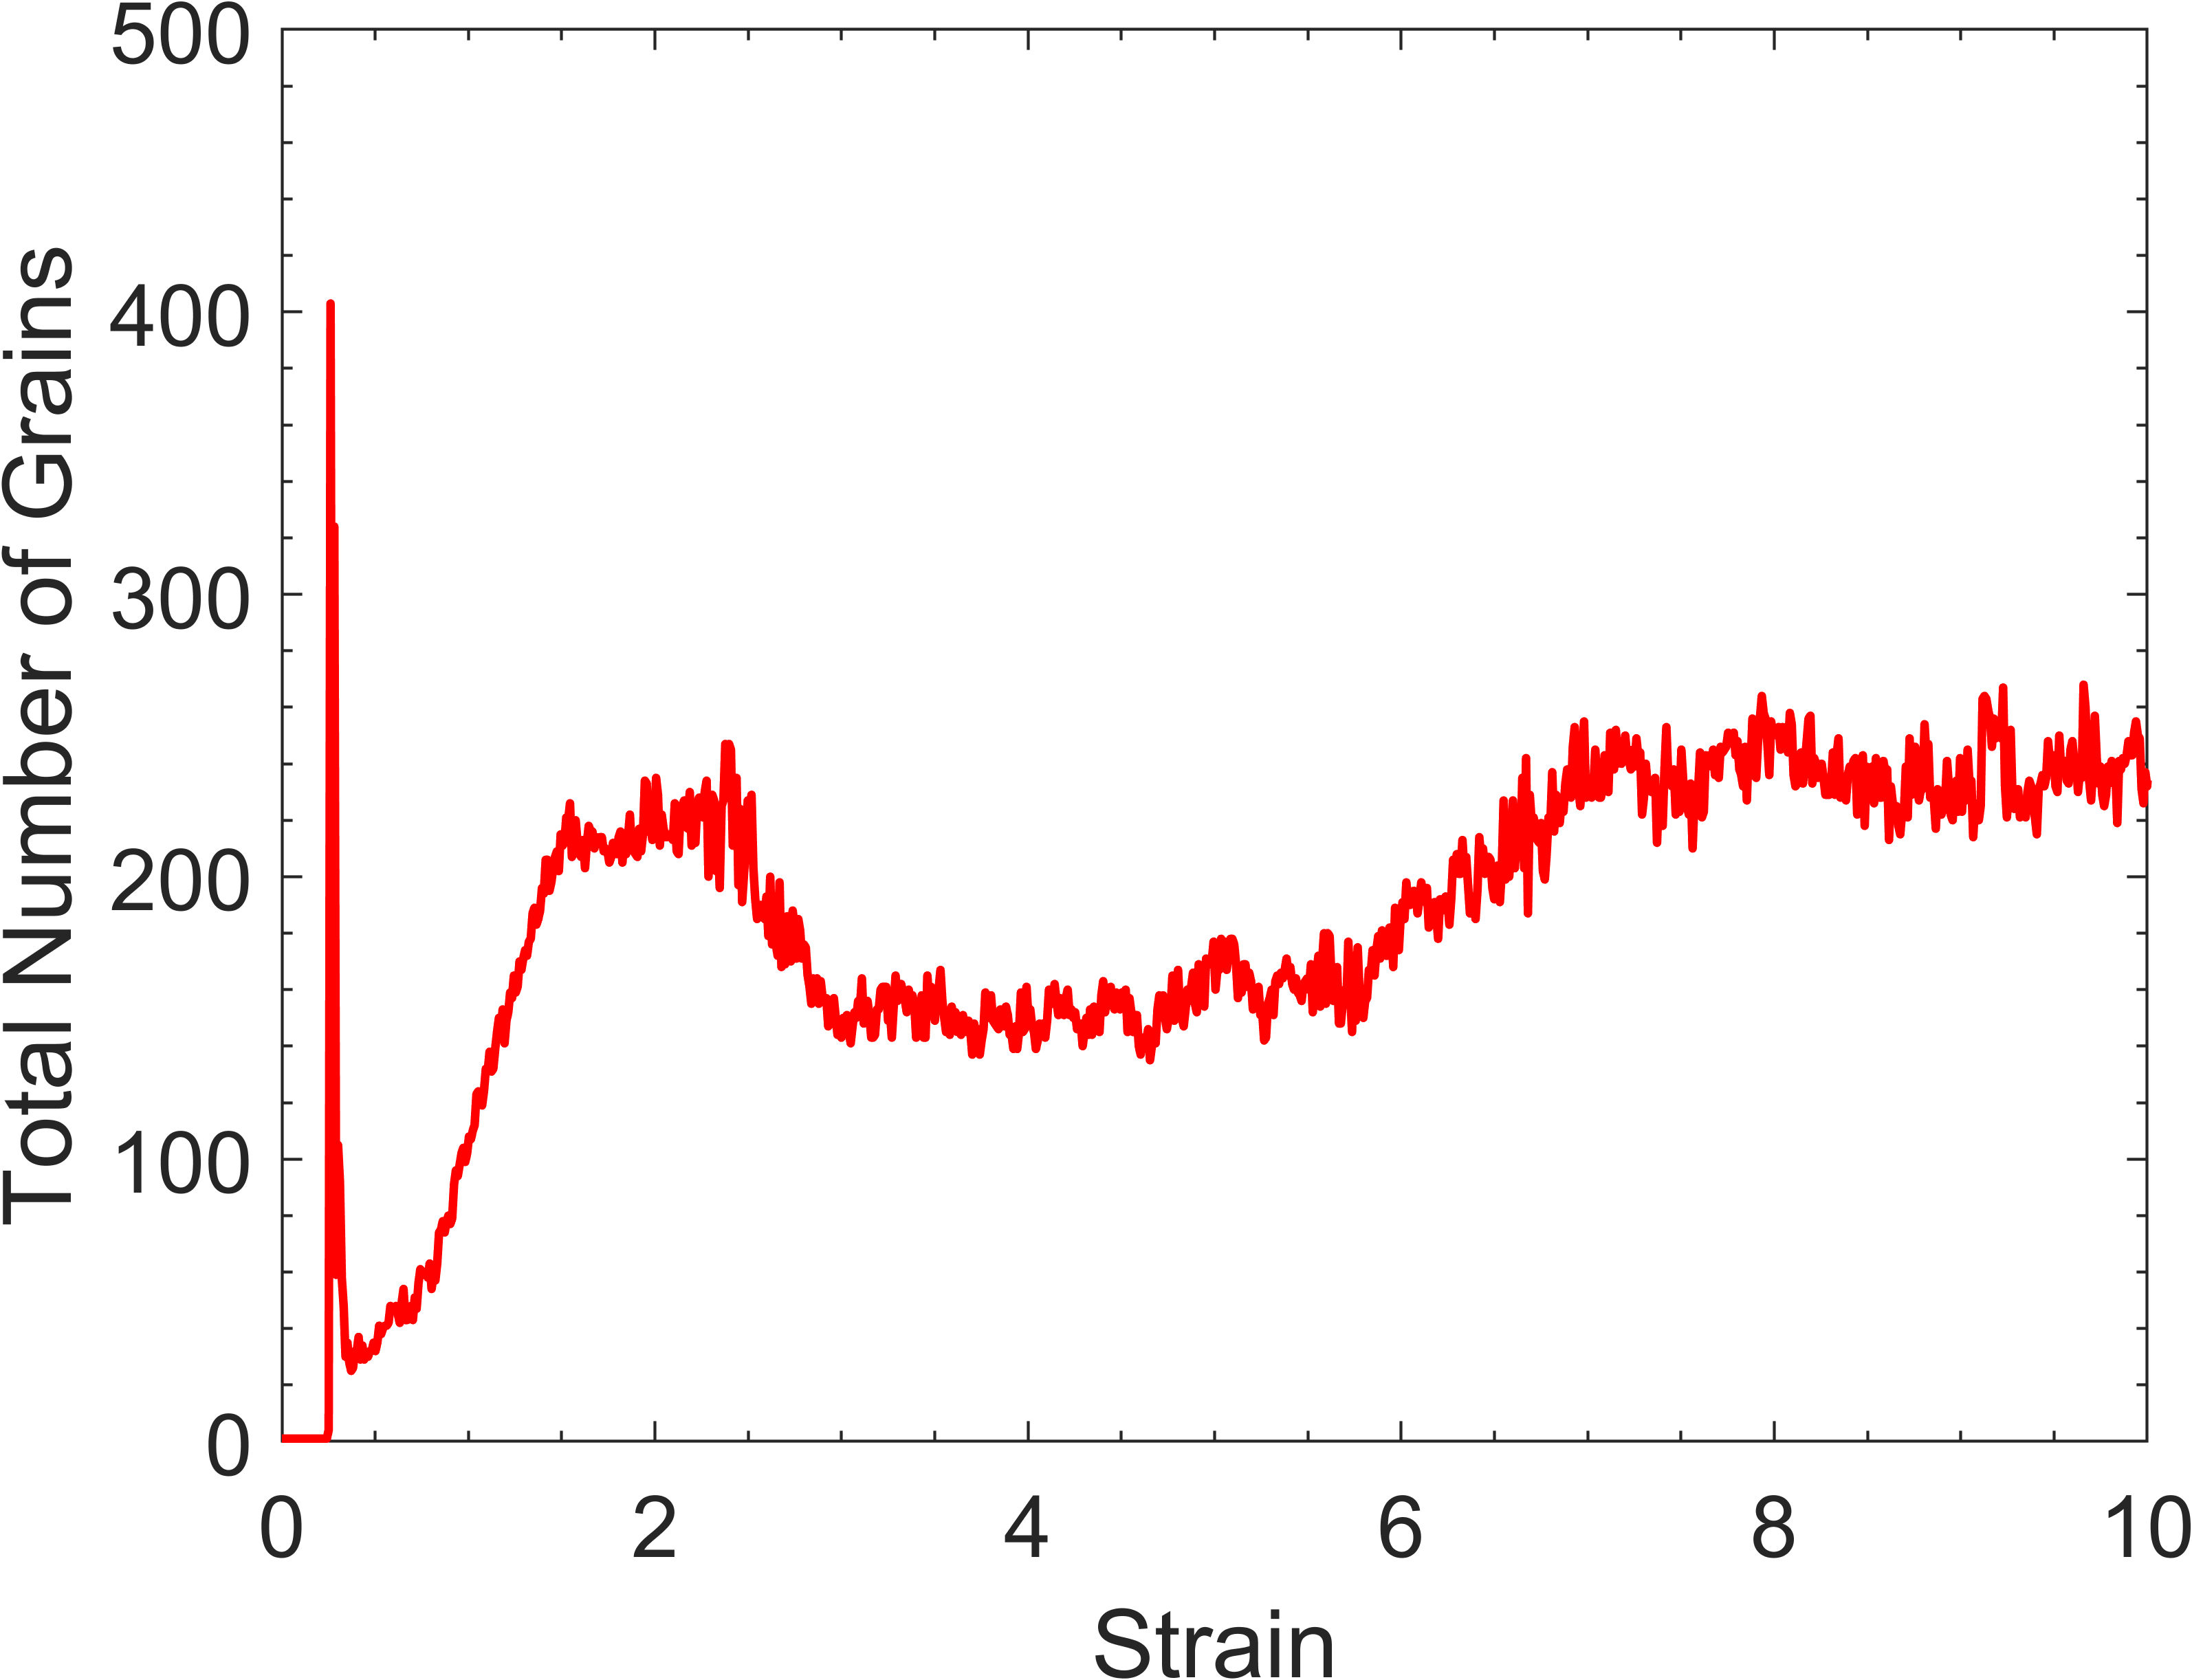
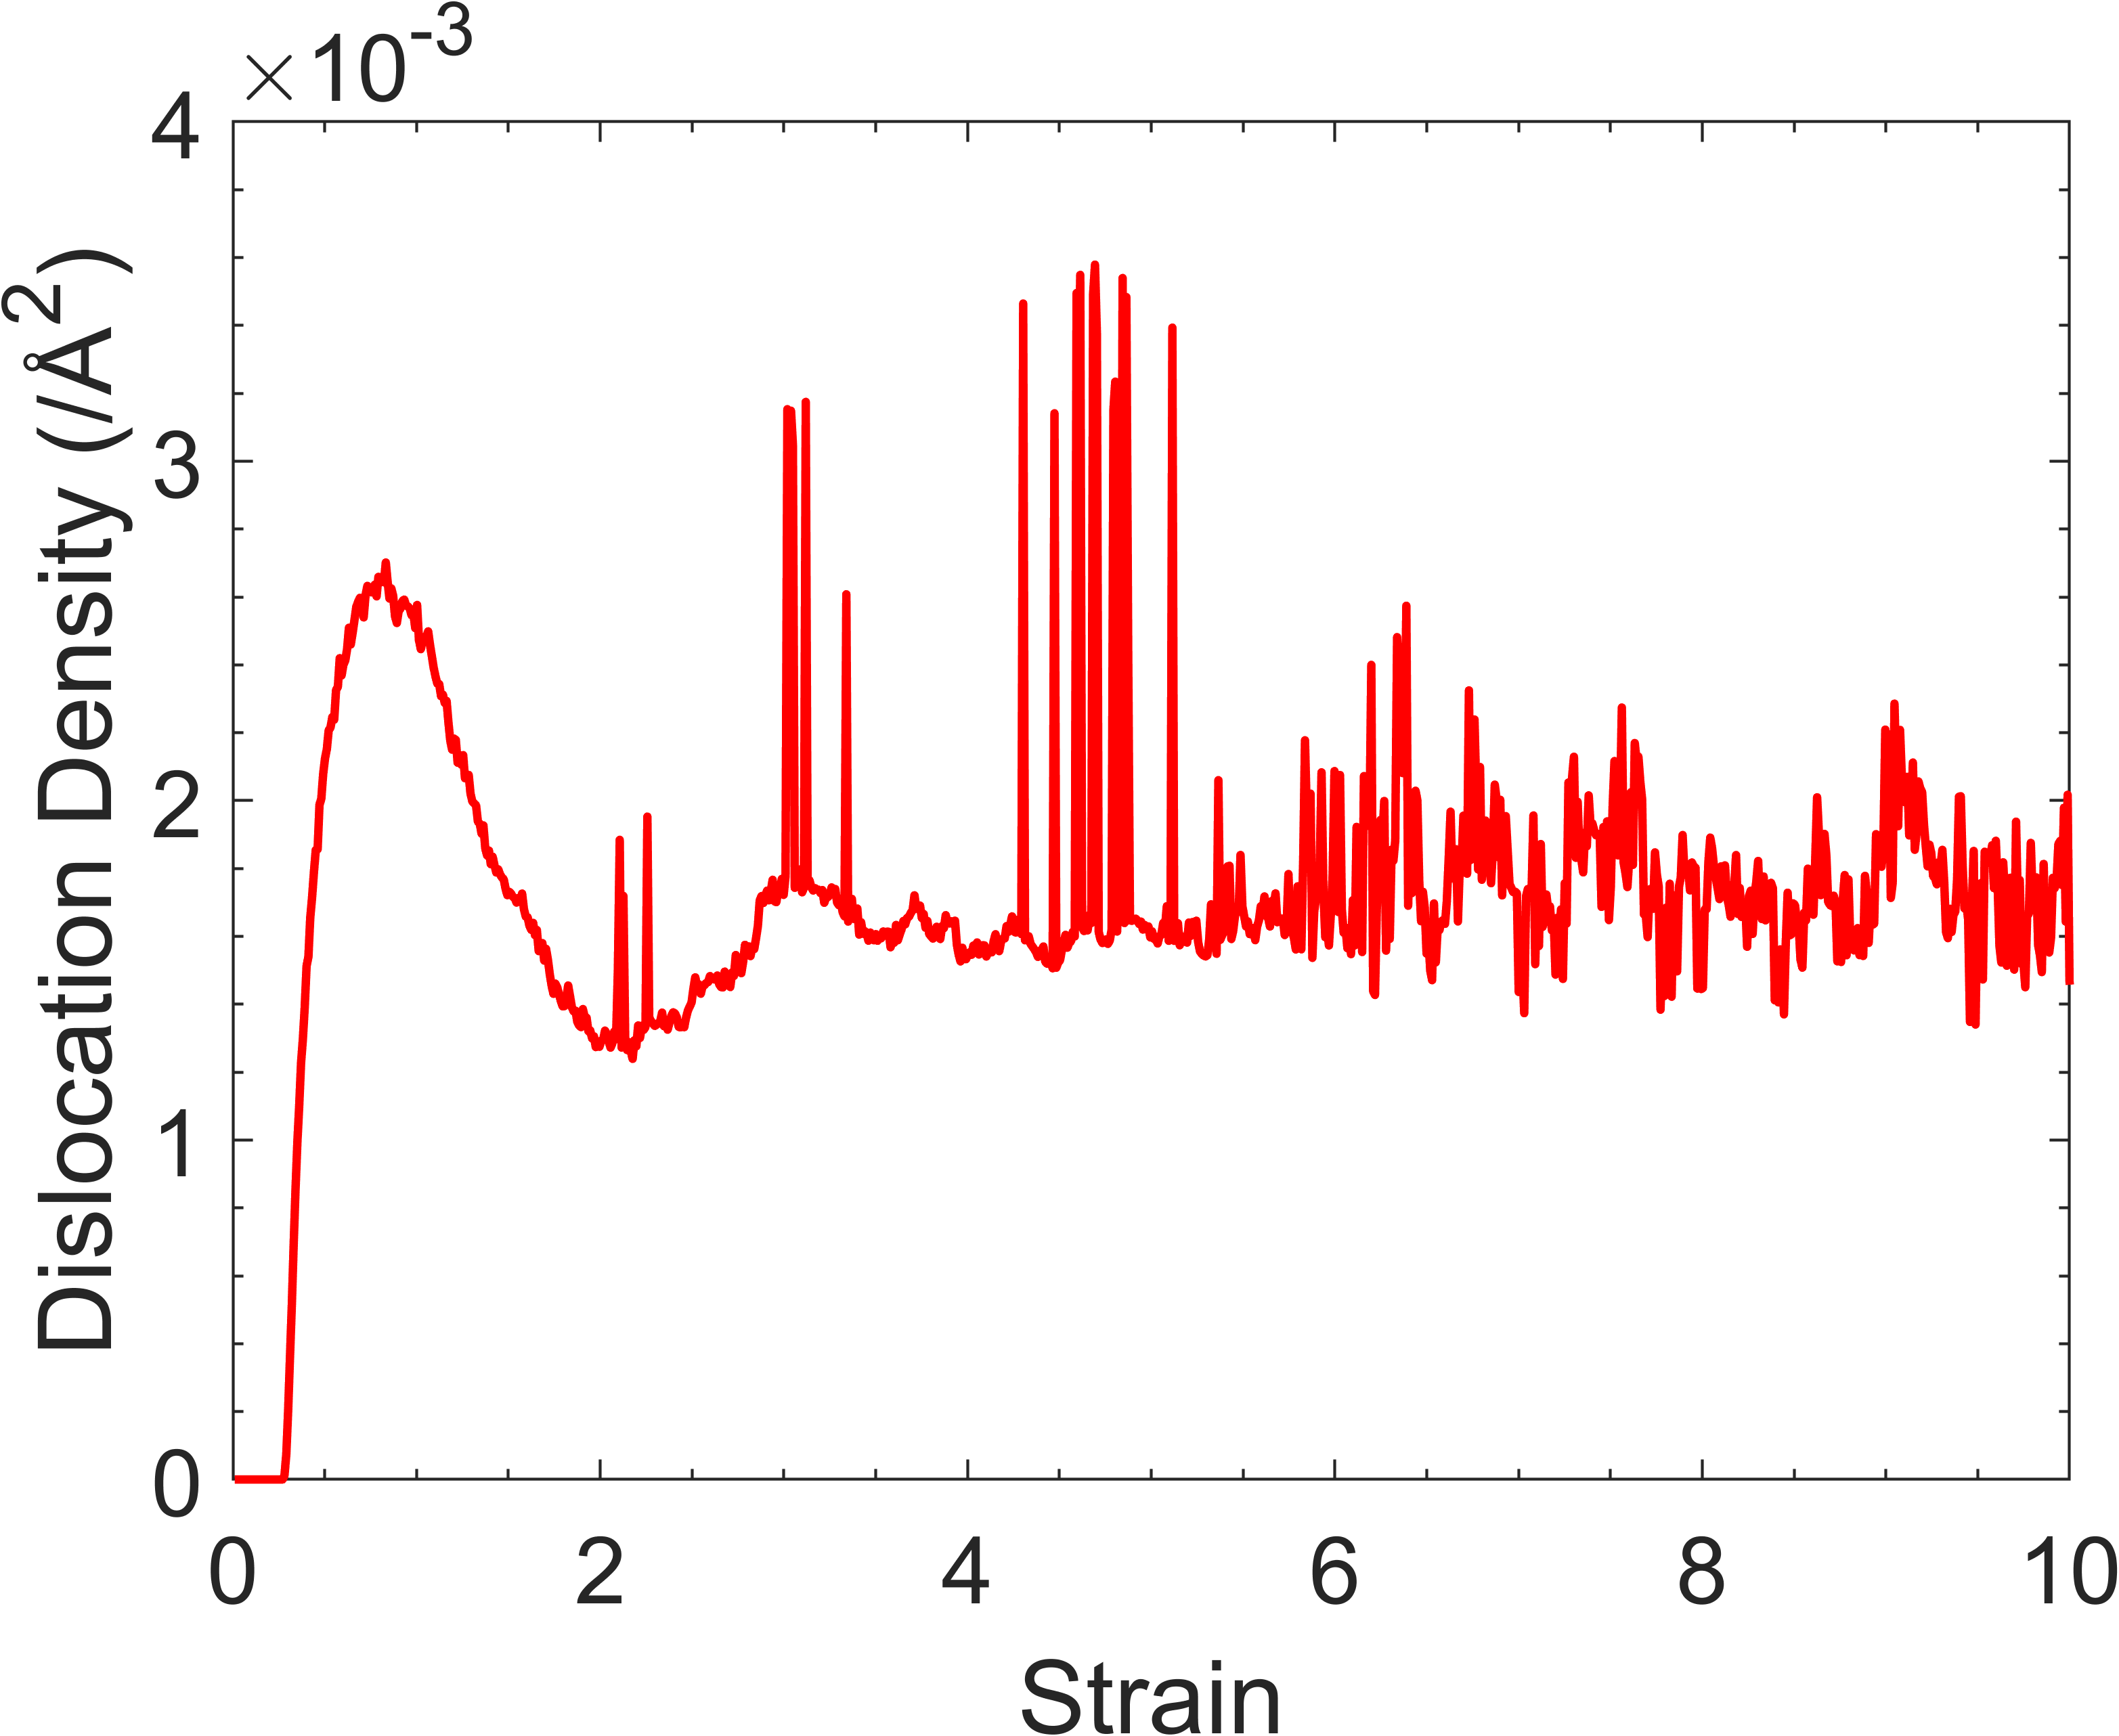
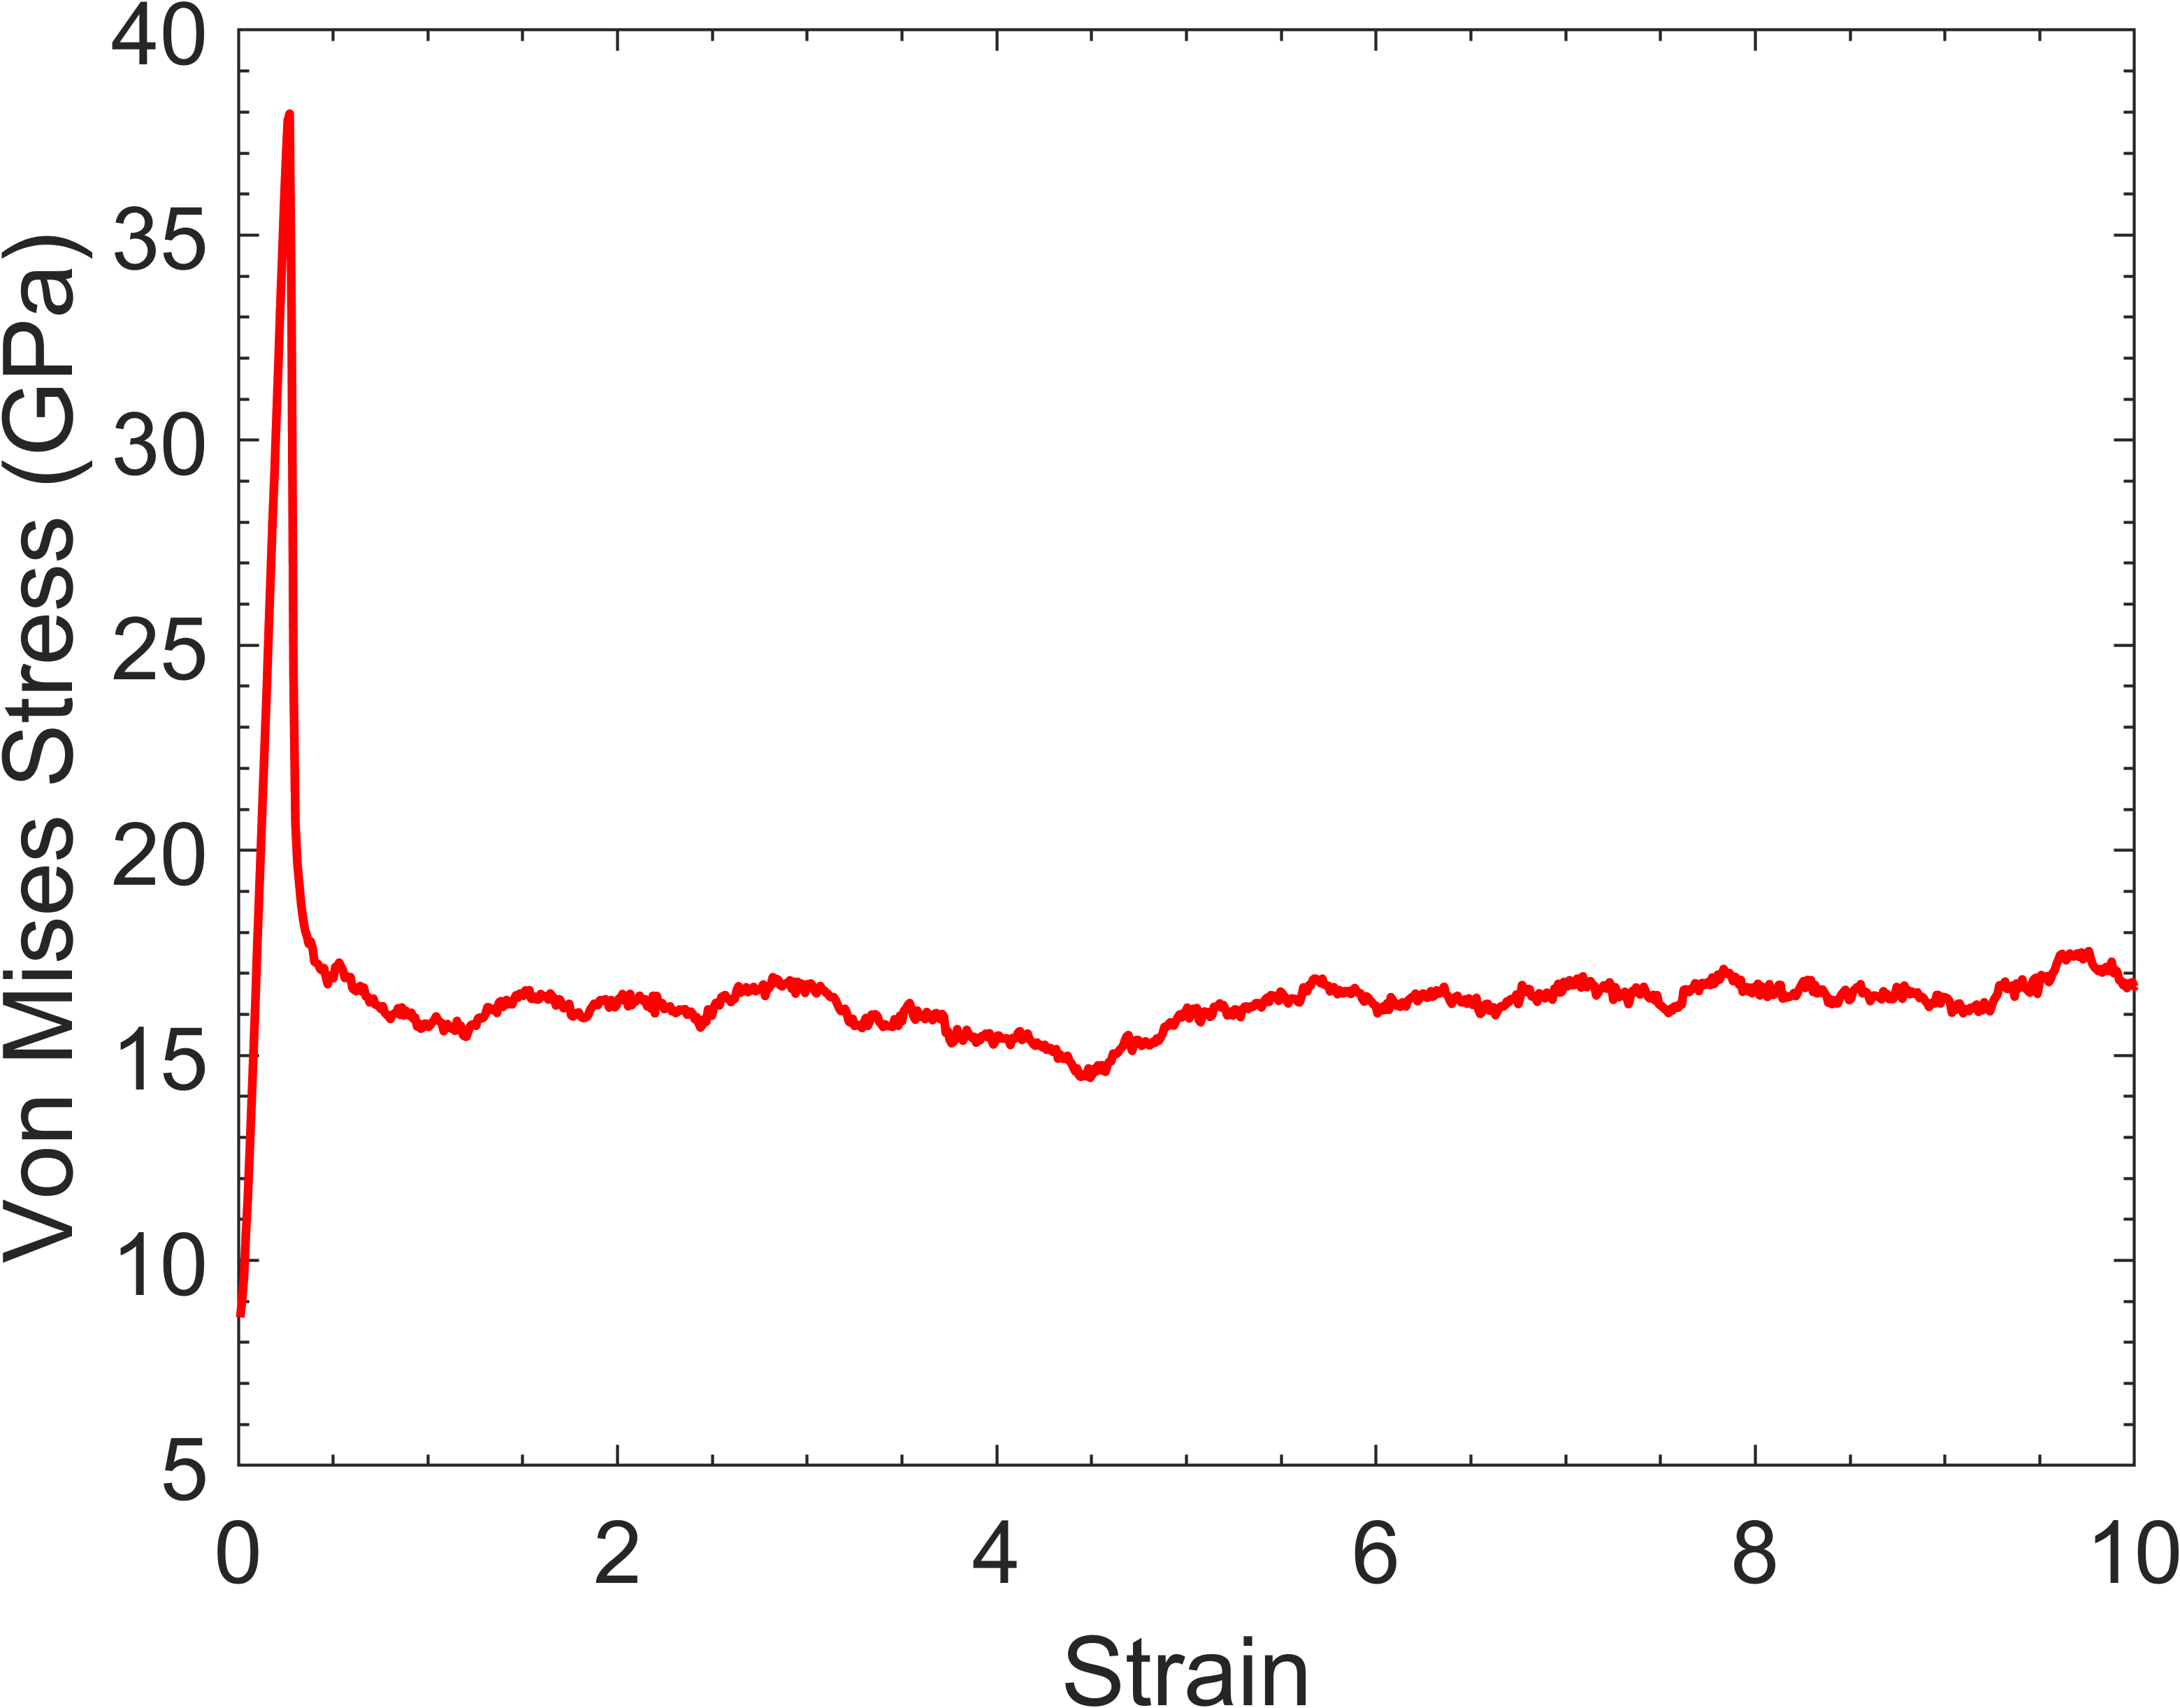
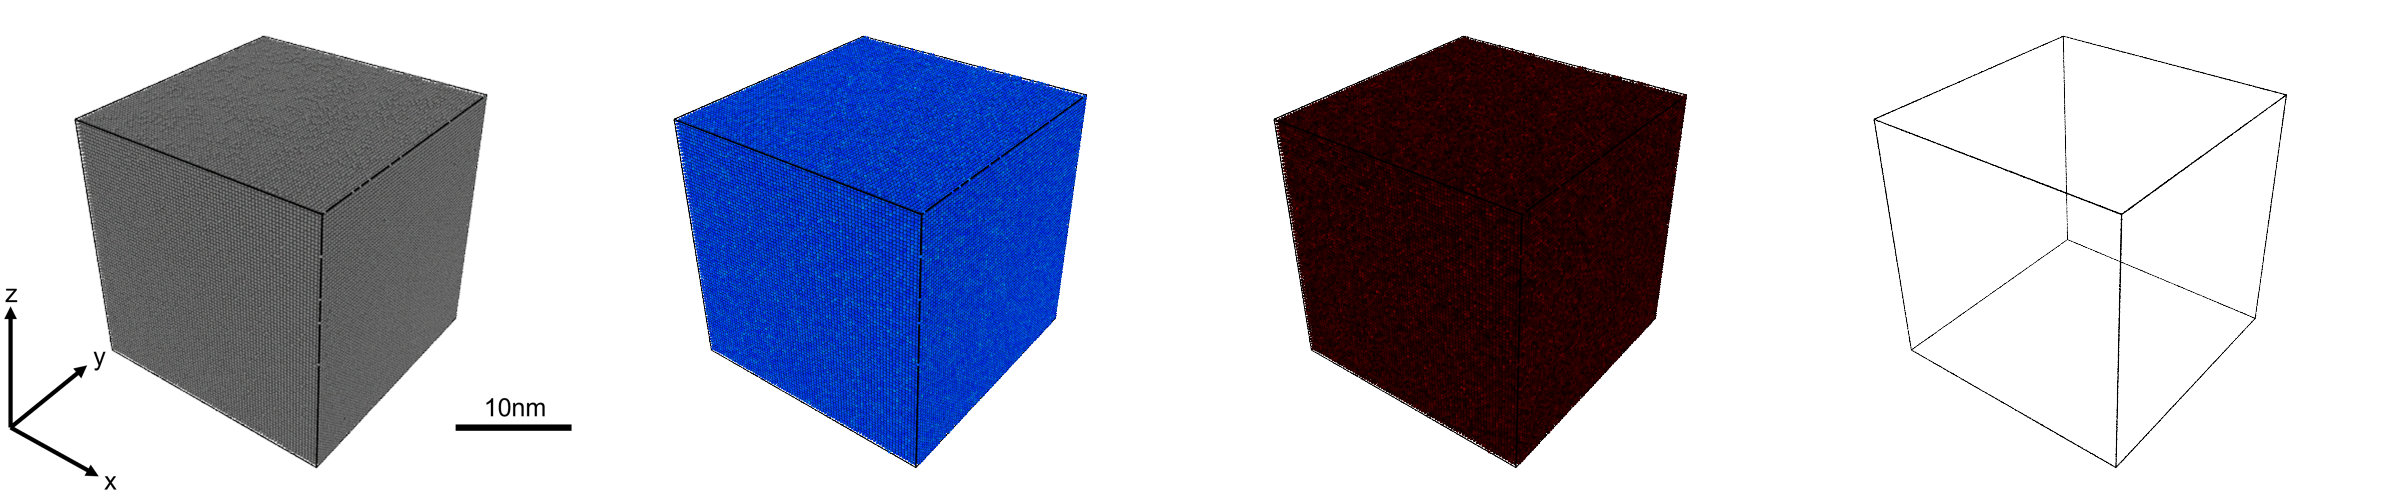
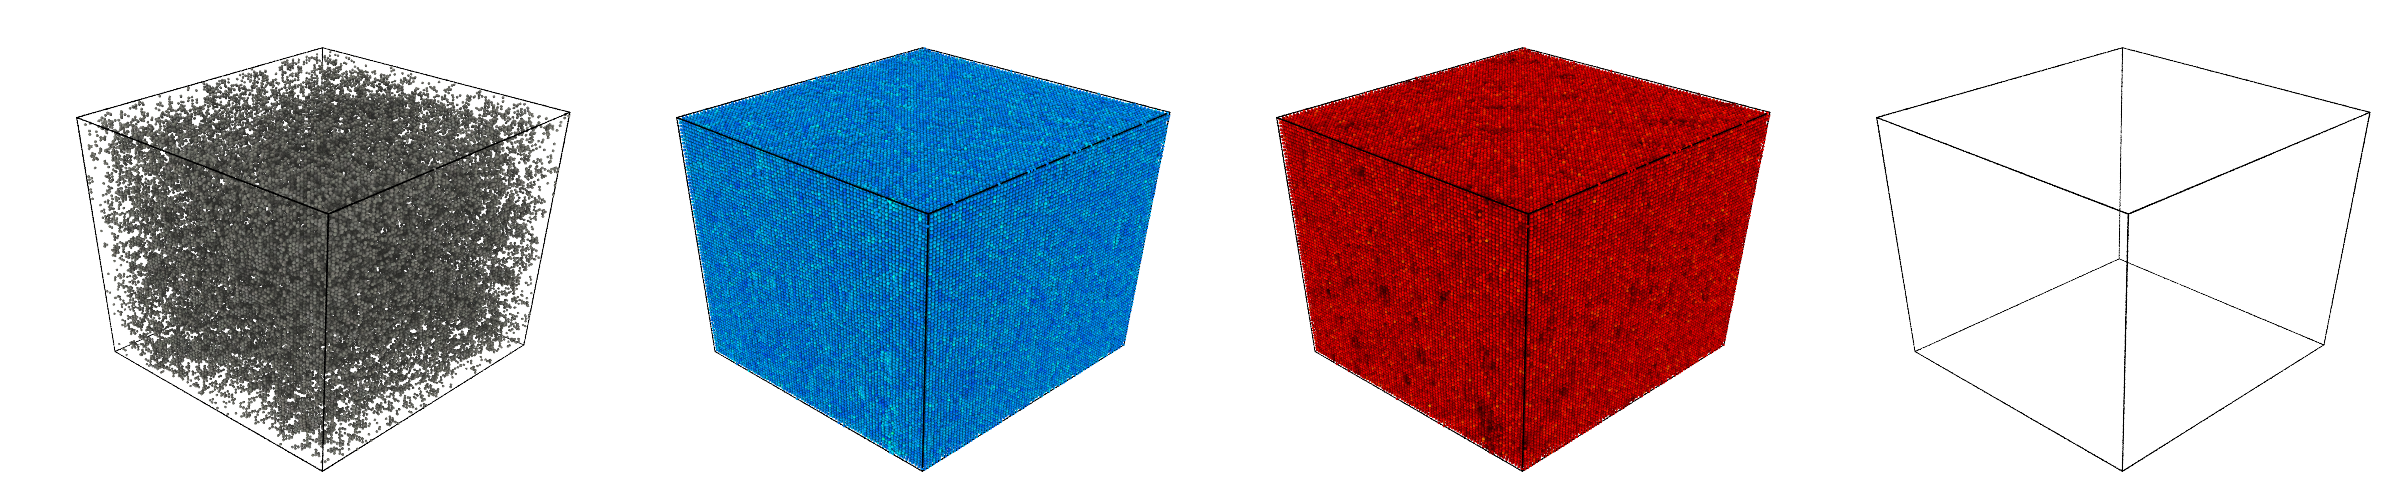
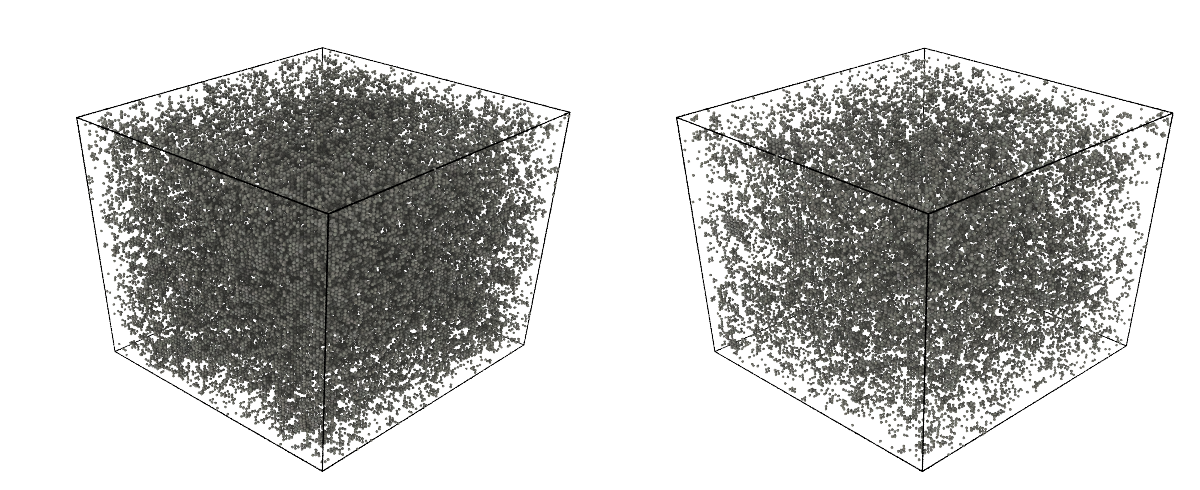
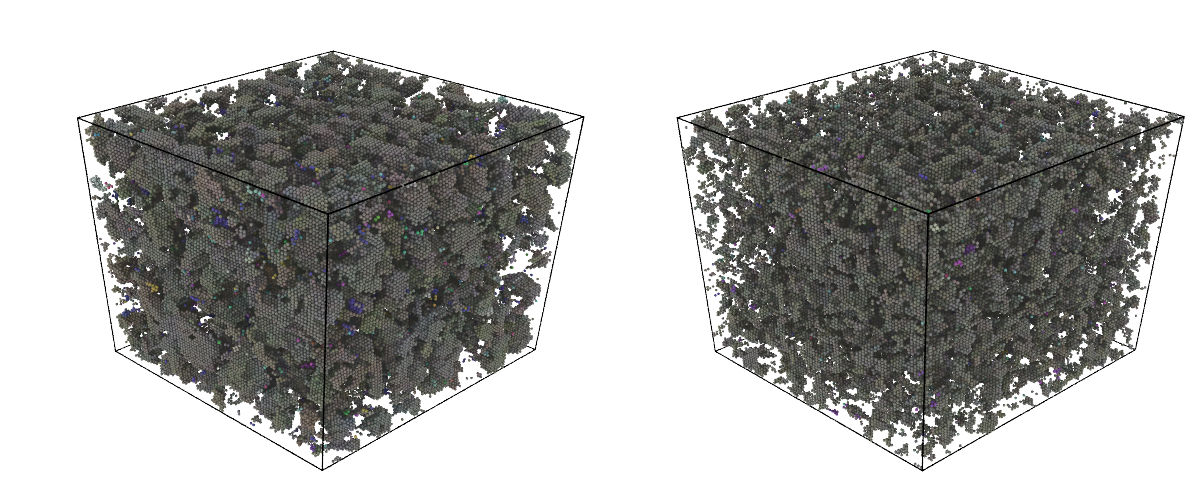
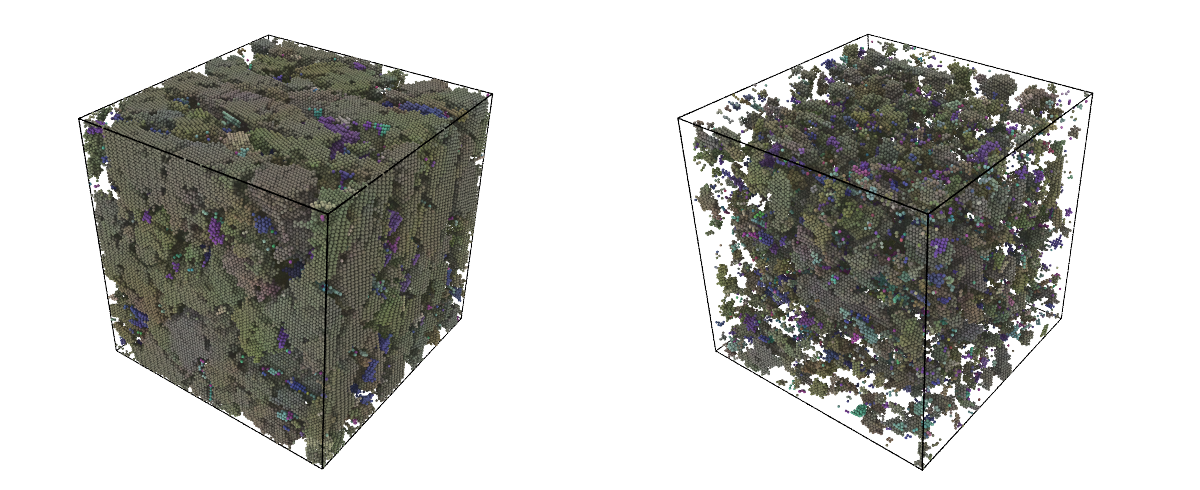
Figure 1 shows a key result of this work. Figure 1(a) to 1(g) show the simulation cell at different shear strain. The results reveal a process in which nanograins are formed due to shear strain in a real-space representation. This simulation was run for 335 ps, up to , at a constant strain rate, at a temperature of 300 K, and with a constant damping parameter . We will refer to this as the benchmark simulation. The colouring of each atom in Figure 1 is based on its crystal orientation. Only atoms detected as BCC structures are shown. Since a similar colour means a similar crystal orientation, one can clearly observe the formation of nanograins in real space. We are not aware of any similar simulations in the literature showing the formation of nanograins under high shear strain.
Figure 1(a) shows the initially perfect crystal simulation cell. It is subjected to a shear strain in the xy direction, which causes the crystal lattice to lose its BCC structure. At around 0.27 strain, there is a high level of atomic disorder, as shown in Figure 1(b). Most atoms deviate from the BCC structure. We can consider that atoms are now in a disordered state. Shortly after that, a recrystallization process begins, as shown in Figure 1(c), at around 0.3 strain. Many small grains are visible. Between Figure 1(c) and 1(d), grain formation clearly occurs, with the atomic crystal orientations still largely similar. By Figure 1(e), at , the atomic crystal orientations are largely dissimilar, with grains exhibiting distinct orientations. It appears that the grain refinement process continues between 4 and 7 strain, see Figure 1(f). Then, the grain number and sizes attain a dynamical quasi-steady state.
Grain growth has been observed for different metals in simulations [32, 57] and experiments [58]. These investigations typically focus on samples that already possess a grain structure before applying any strain or stress. A fundamental difference is that the current simulations start with a perfect crystal structure. Our results show that when shear strain is applied, atoms become highly disordered, followed by recrystallisation into a polycrystalline structure. However, such a mechanism does not always occur under different simulation conditions, as will be discussed below.
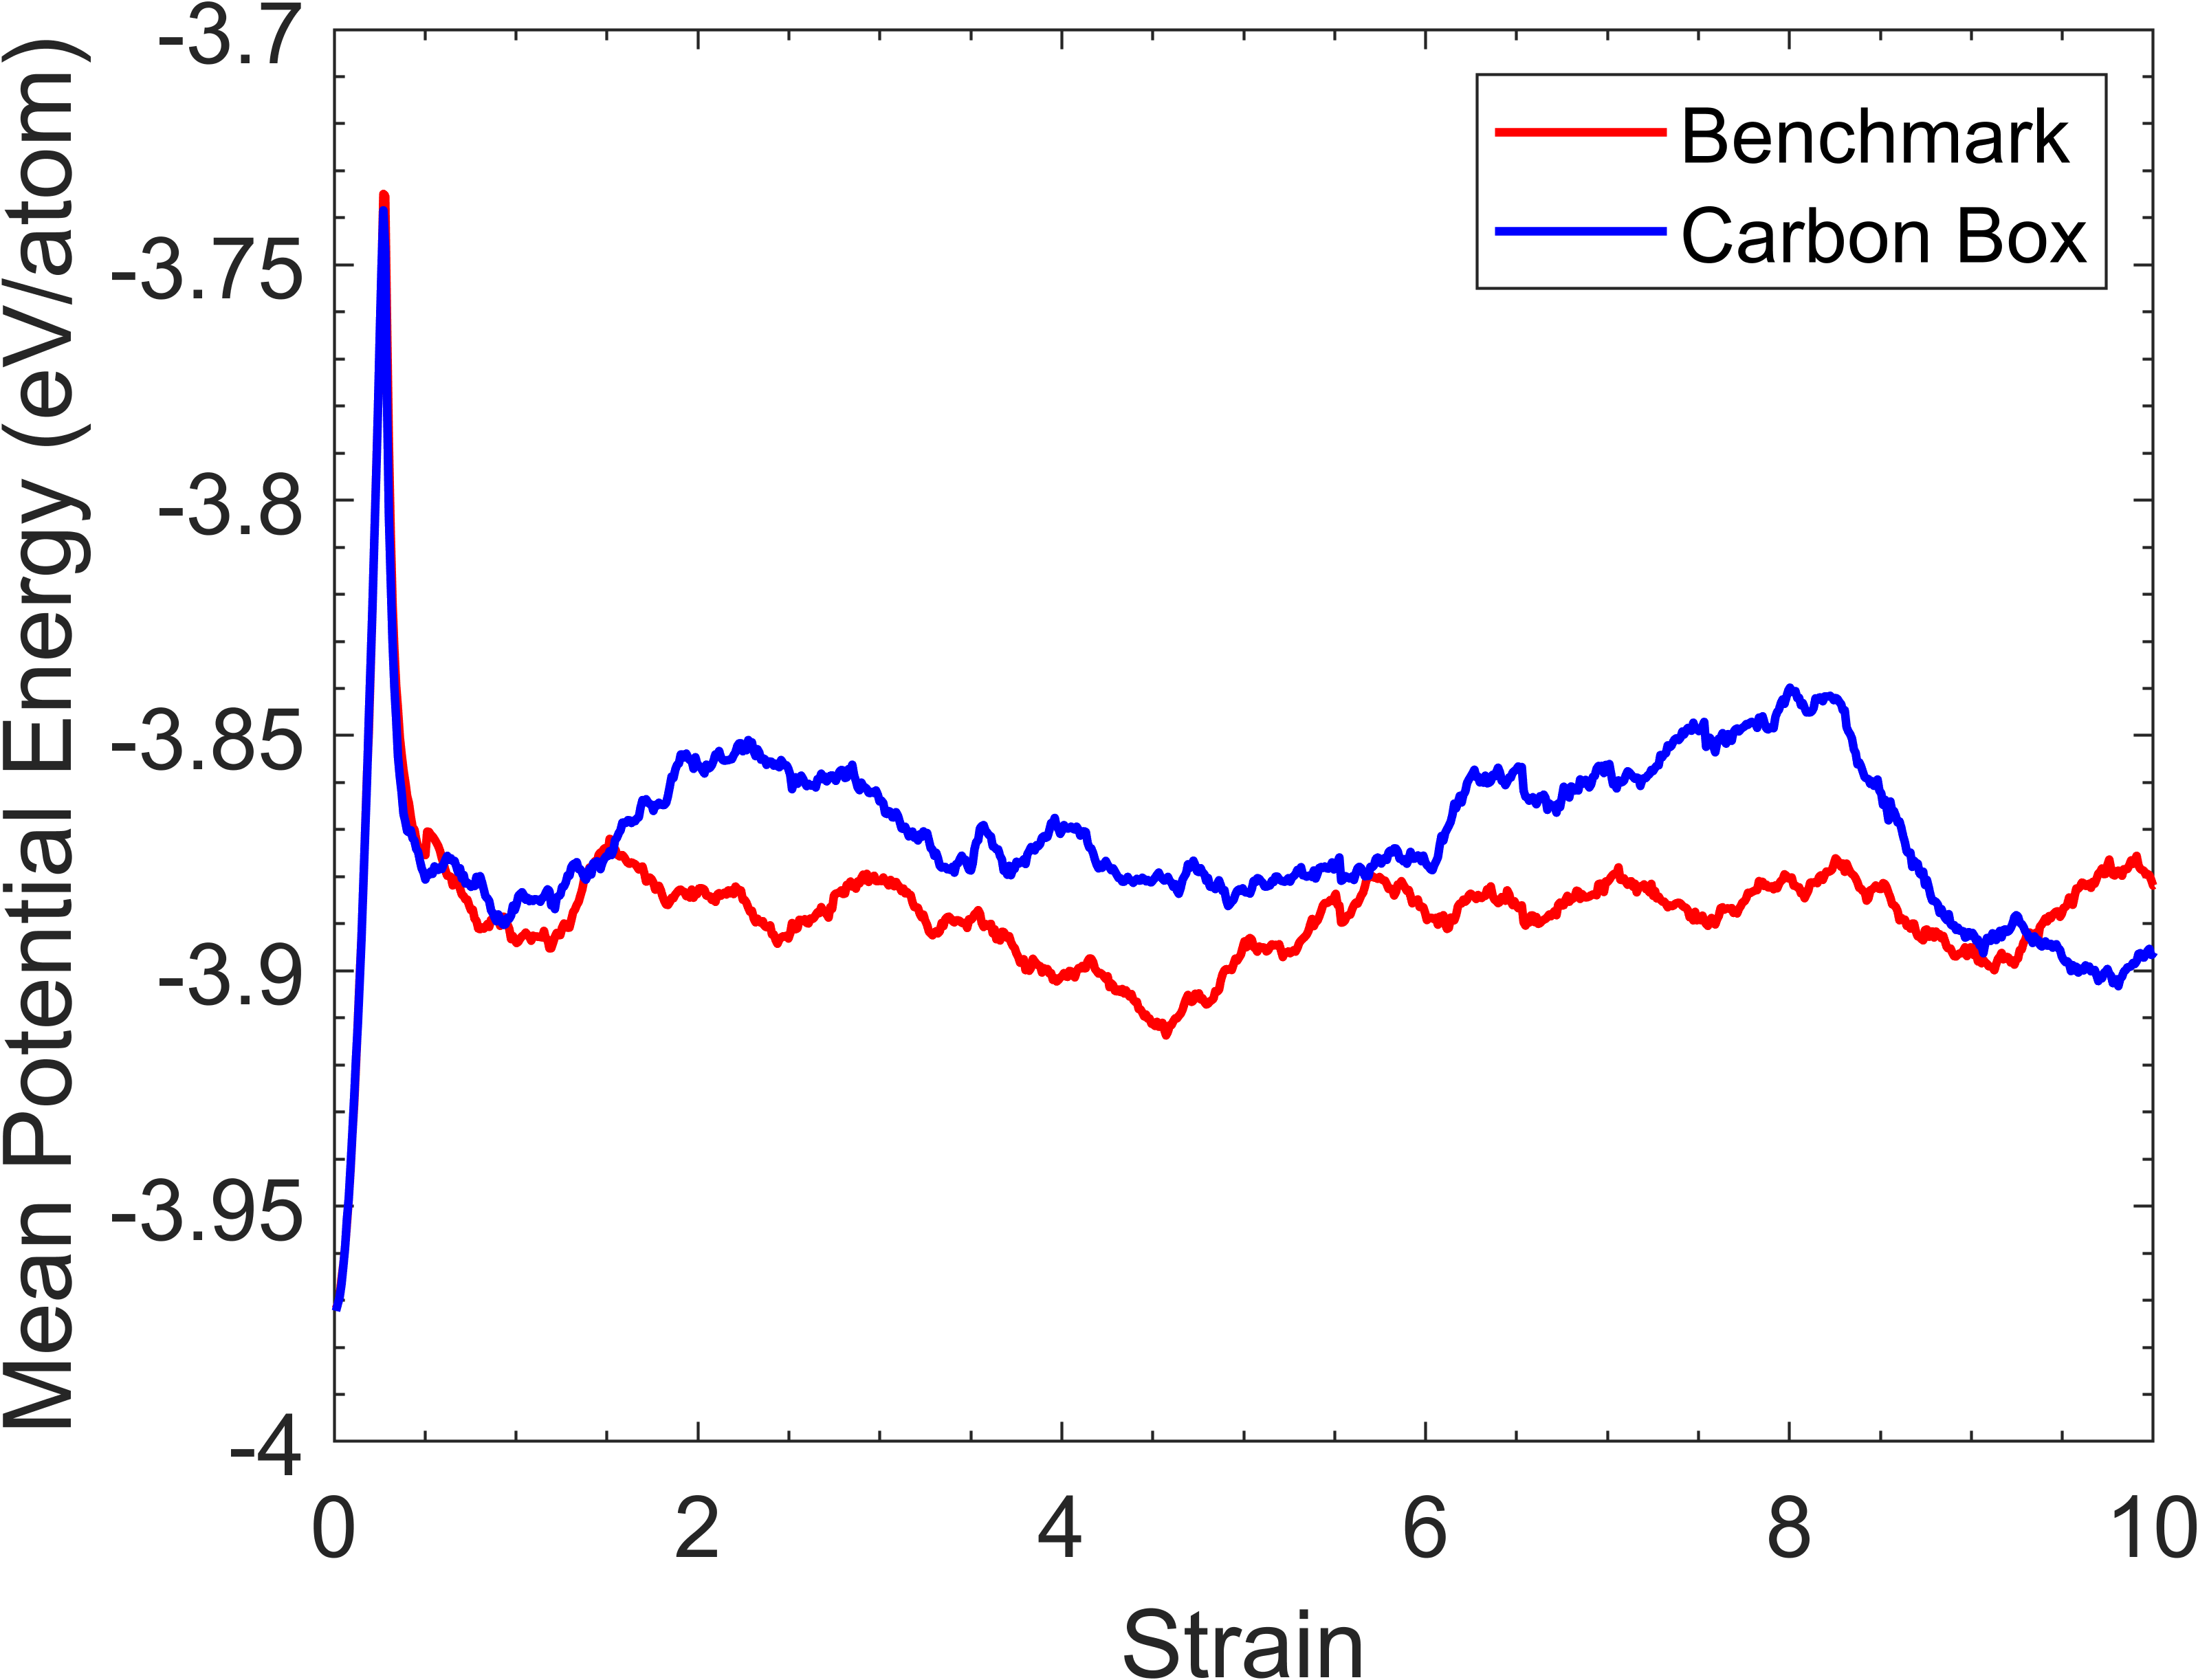
For a more detailed analysis, we can consider Figure 2 alongside Figure 1. Figure 2(a) shows the average atomic potential and kinetic energy as a function of shear strain. Figure 2(b) is an enlarged version that covers a range up to . When the shear strain is first applied, there is a gradual increase in the potential energy up to a value of around -3.73 eV/atom. The initial potential energy increment appears parabolic, suggesting a linear elastic response, as the elastic potential energy is proportional to . The maximum point of potential energy occurs at 0.27 strain, which is the point shown in Figure 1(b). The disordered state is a state of high potential energy.
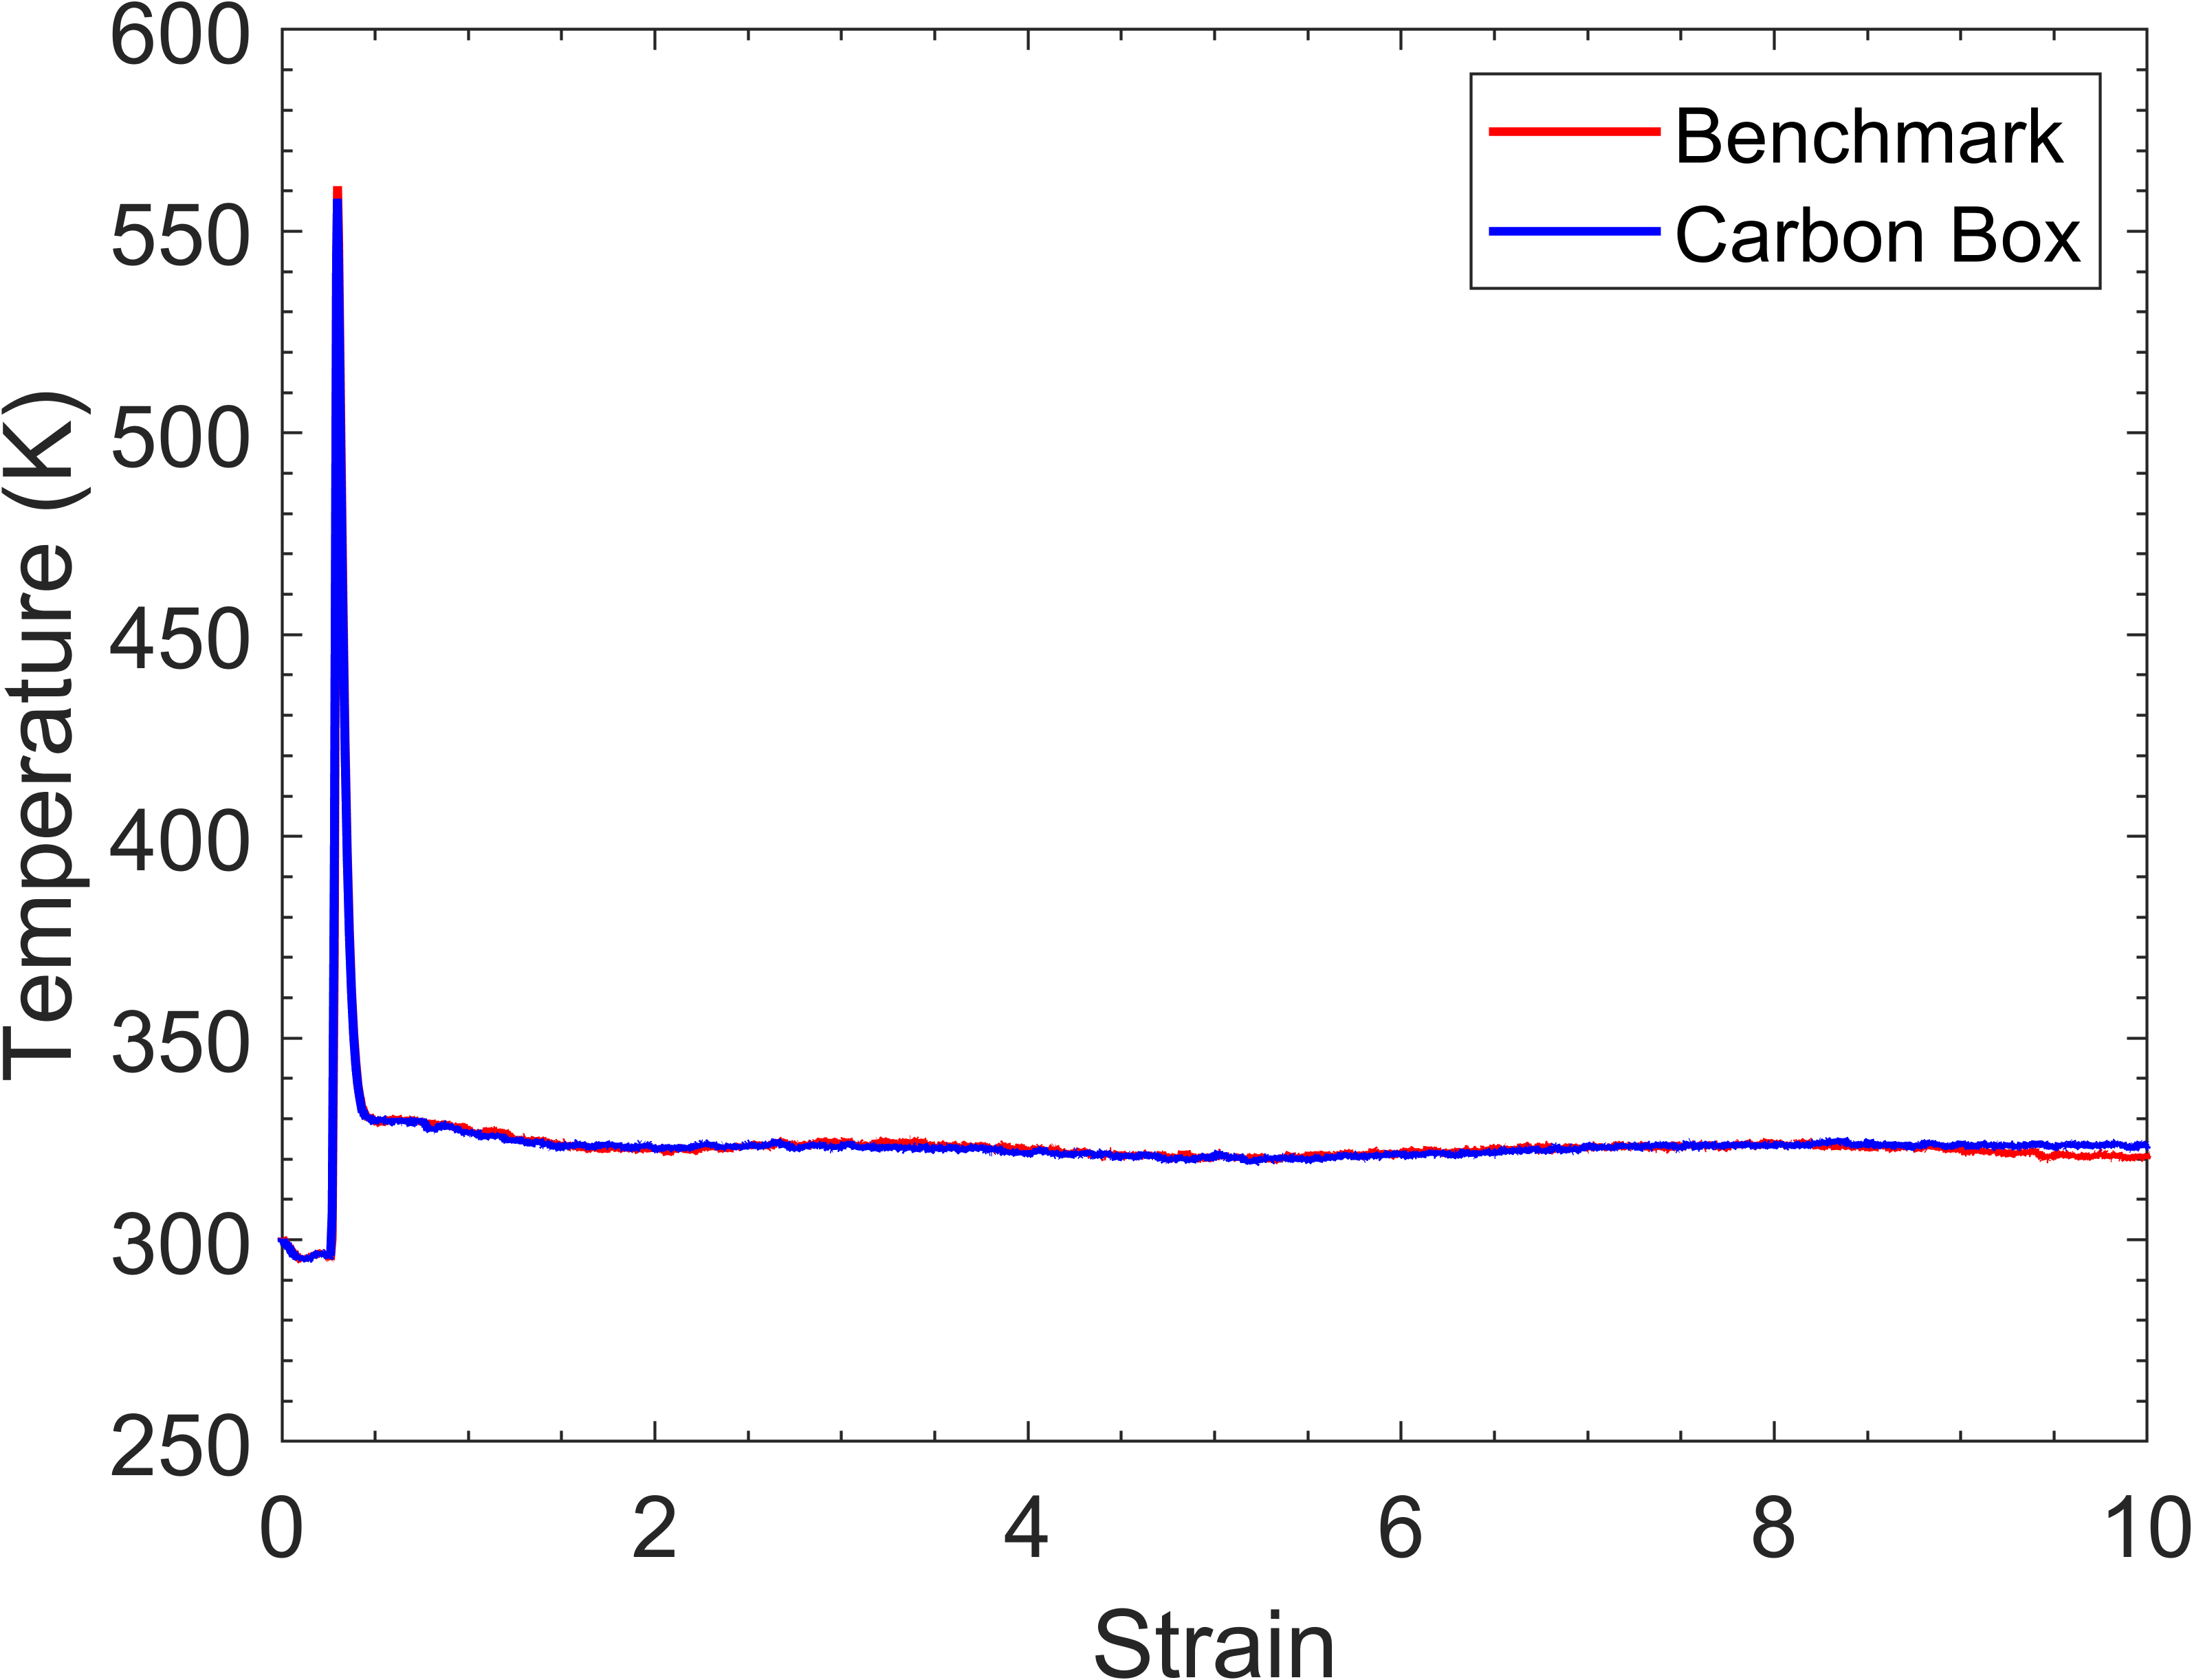
Then, the potential energy in the system gradually reduces to around -3.89 eV/atom and remains roughly at this value for the remaining shearing process. At 0.27 strain, where the potential energy reaches its peak, we also observe a rapid increase in the kinetic energy of the system, as shown in Figure 2(b), from a value of 0.039 eV/atom to 0.072 eV/atom, peaking at 0.3 strain. This increase is followed by a sharp decrease, reaching a value of around 0.042 eV/atom, at which the simulation plateaus for the continued shearing. Since the estimated system temperature is directly proportional to the kinetic energy, we observe a substantial increase in temperature at 0.27 strain, as shown in Figure 2(c). The maximum temperature reaches 560 K, which is far below 1,811 K, the melting temperature of iron.
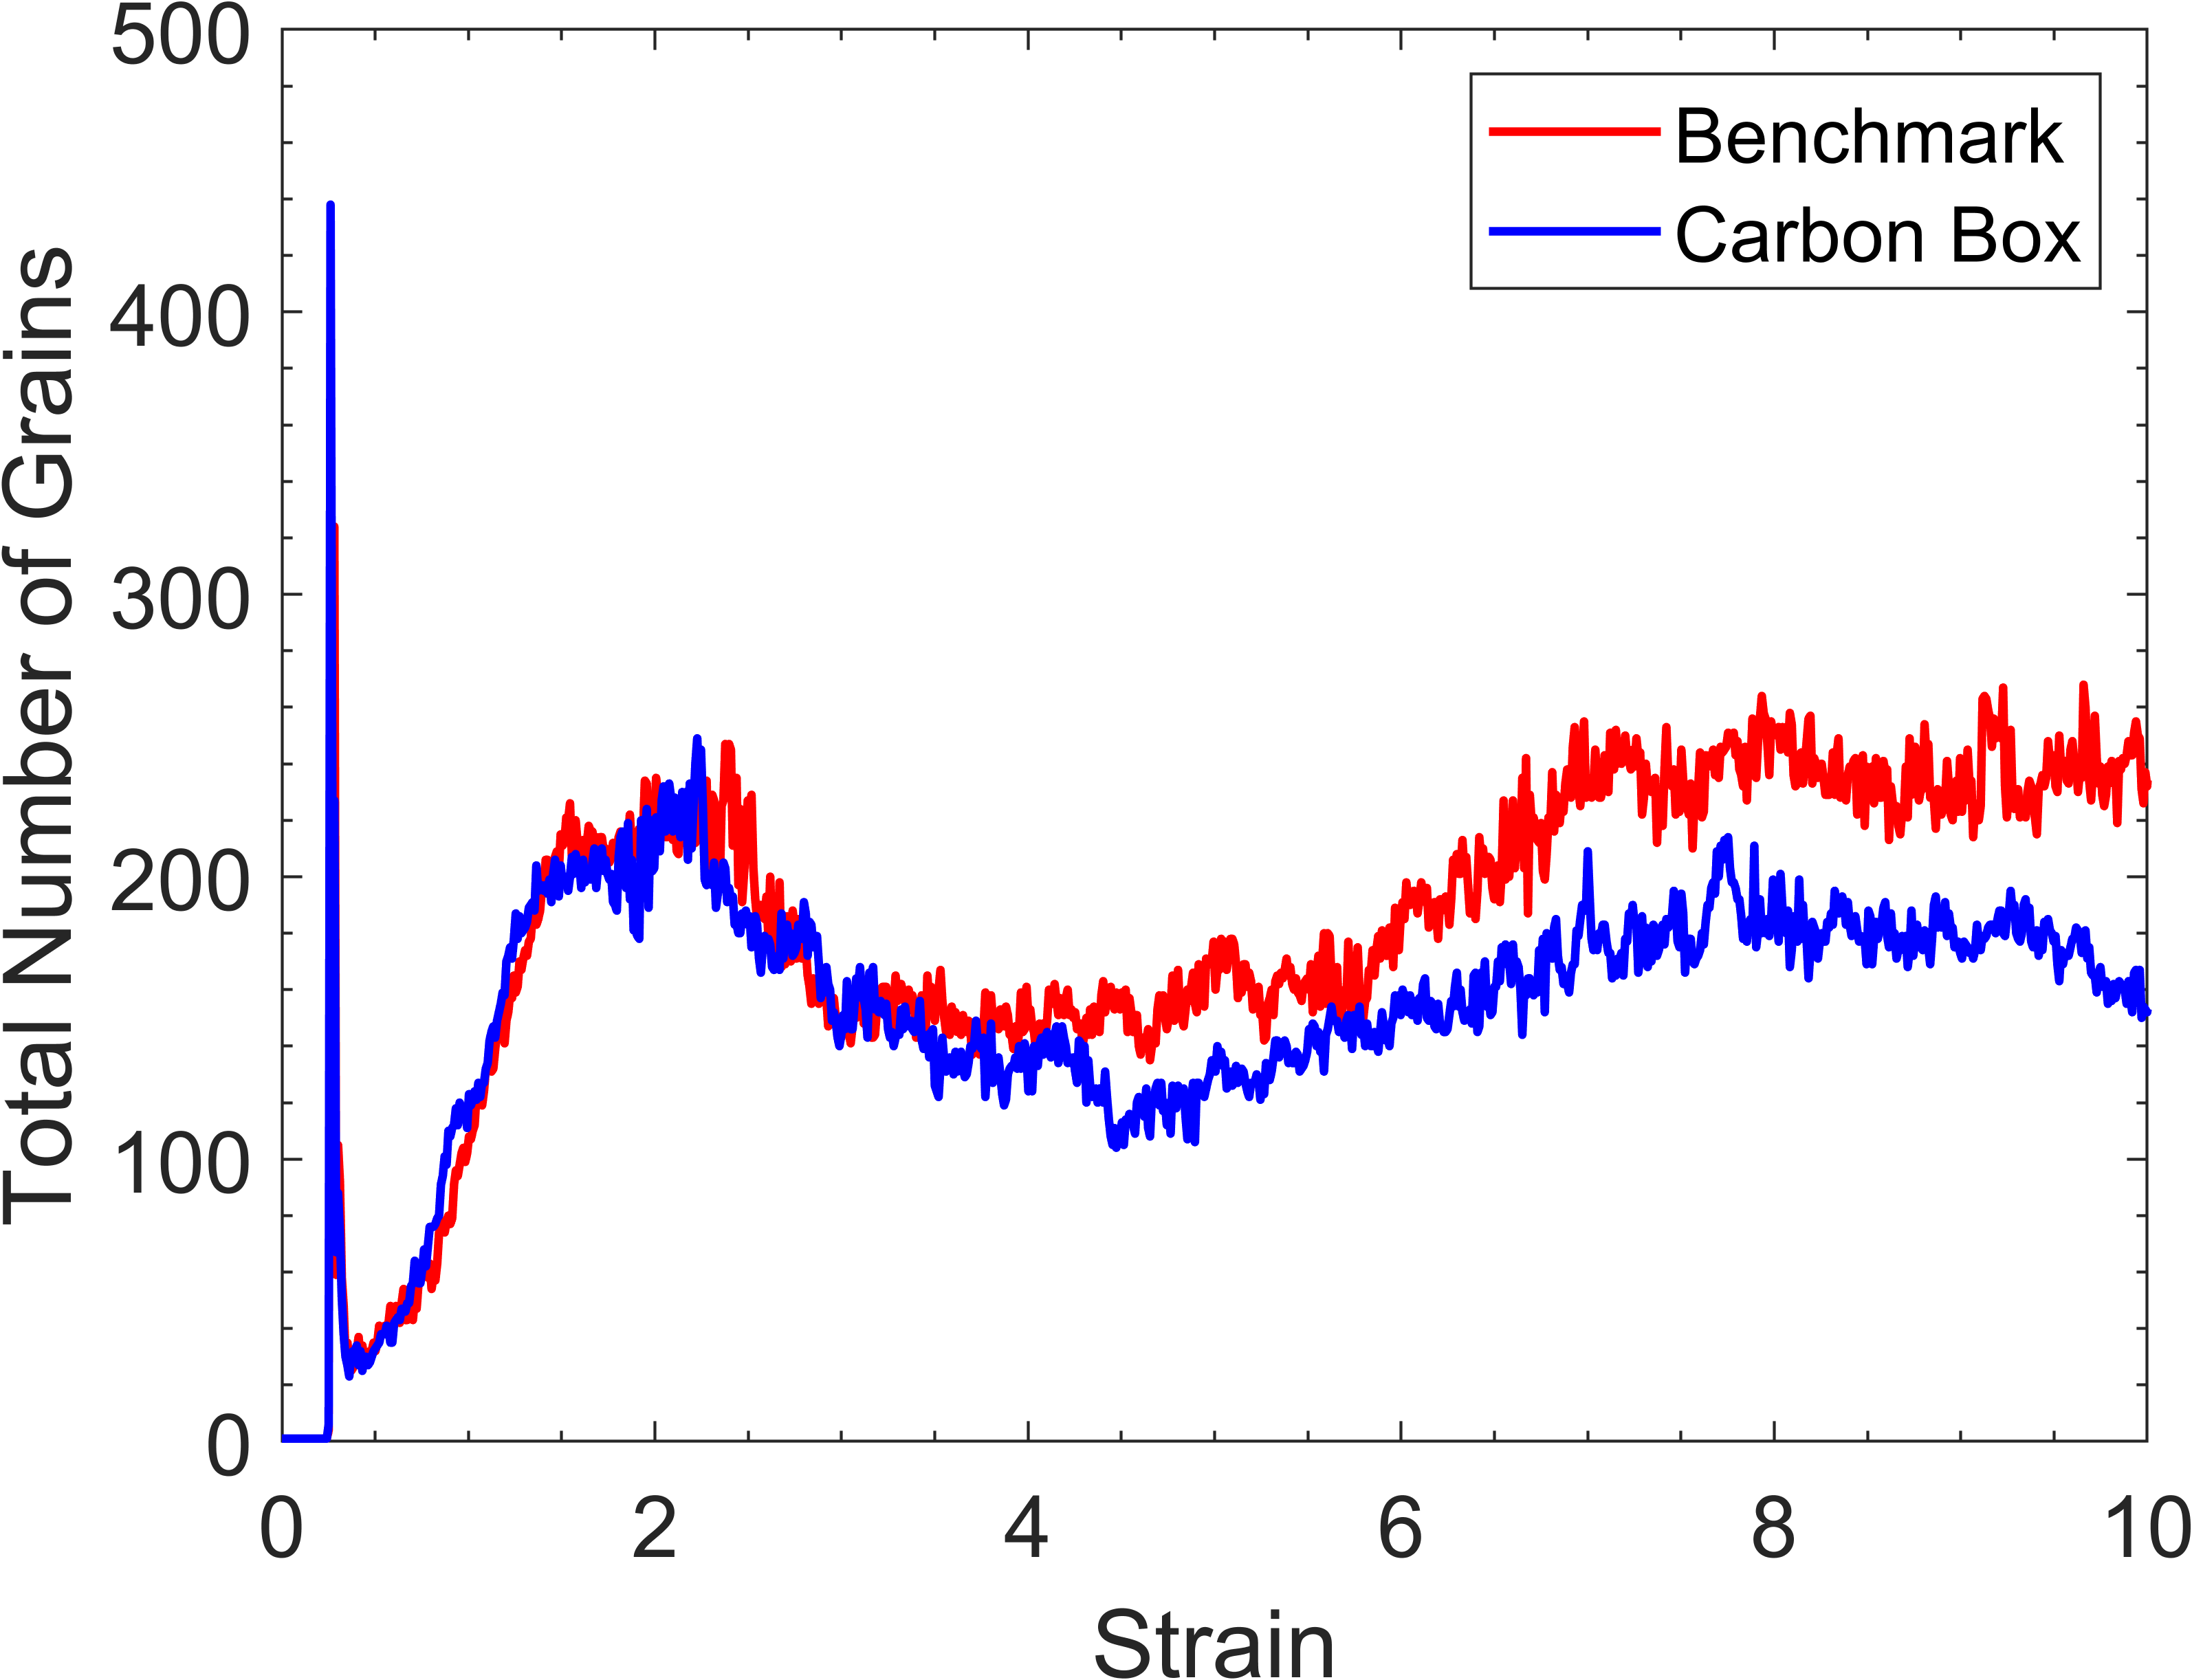
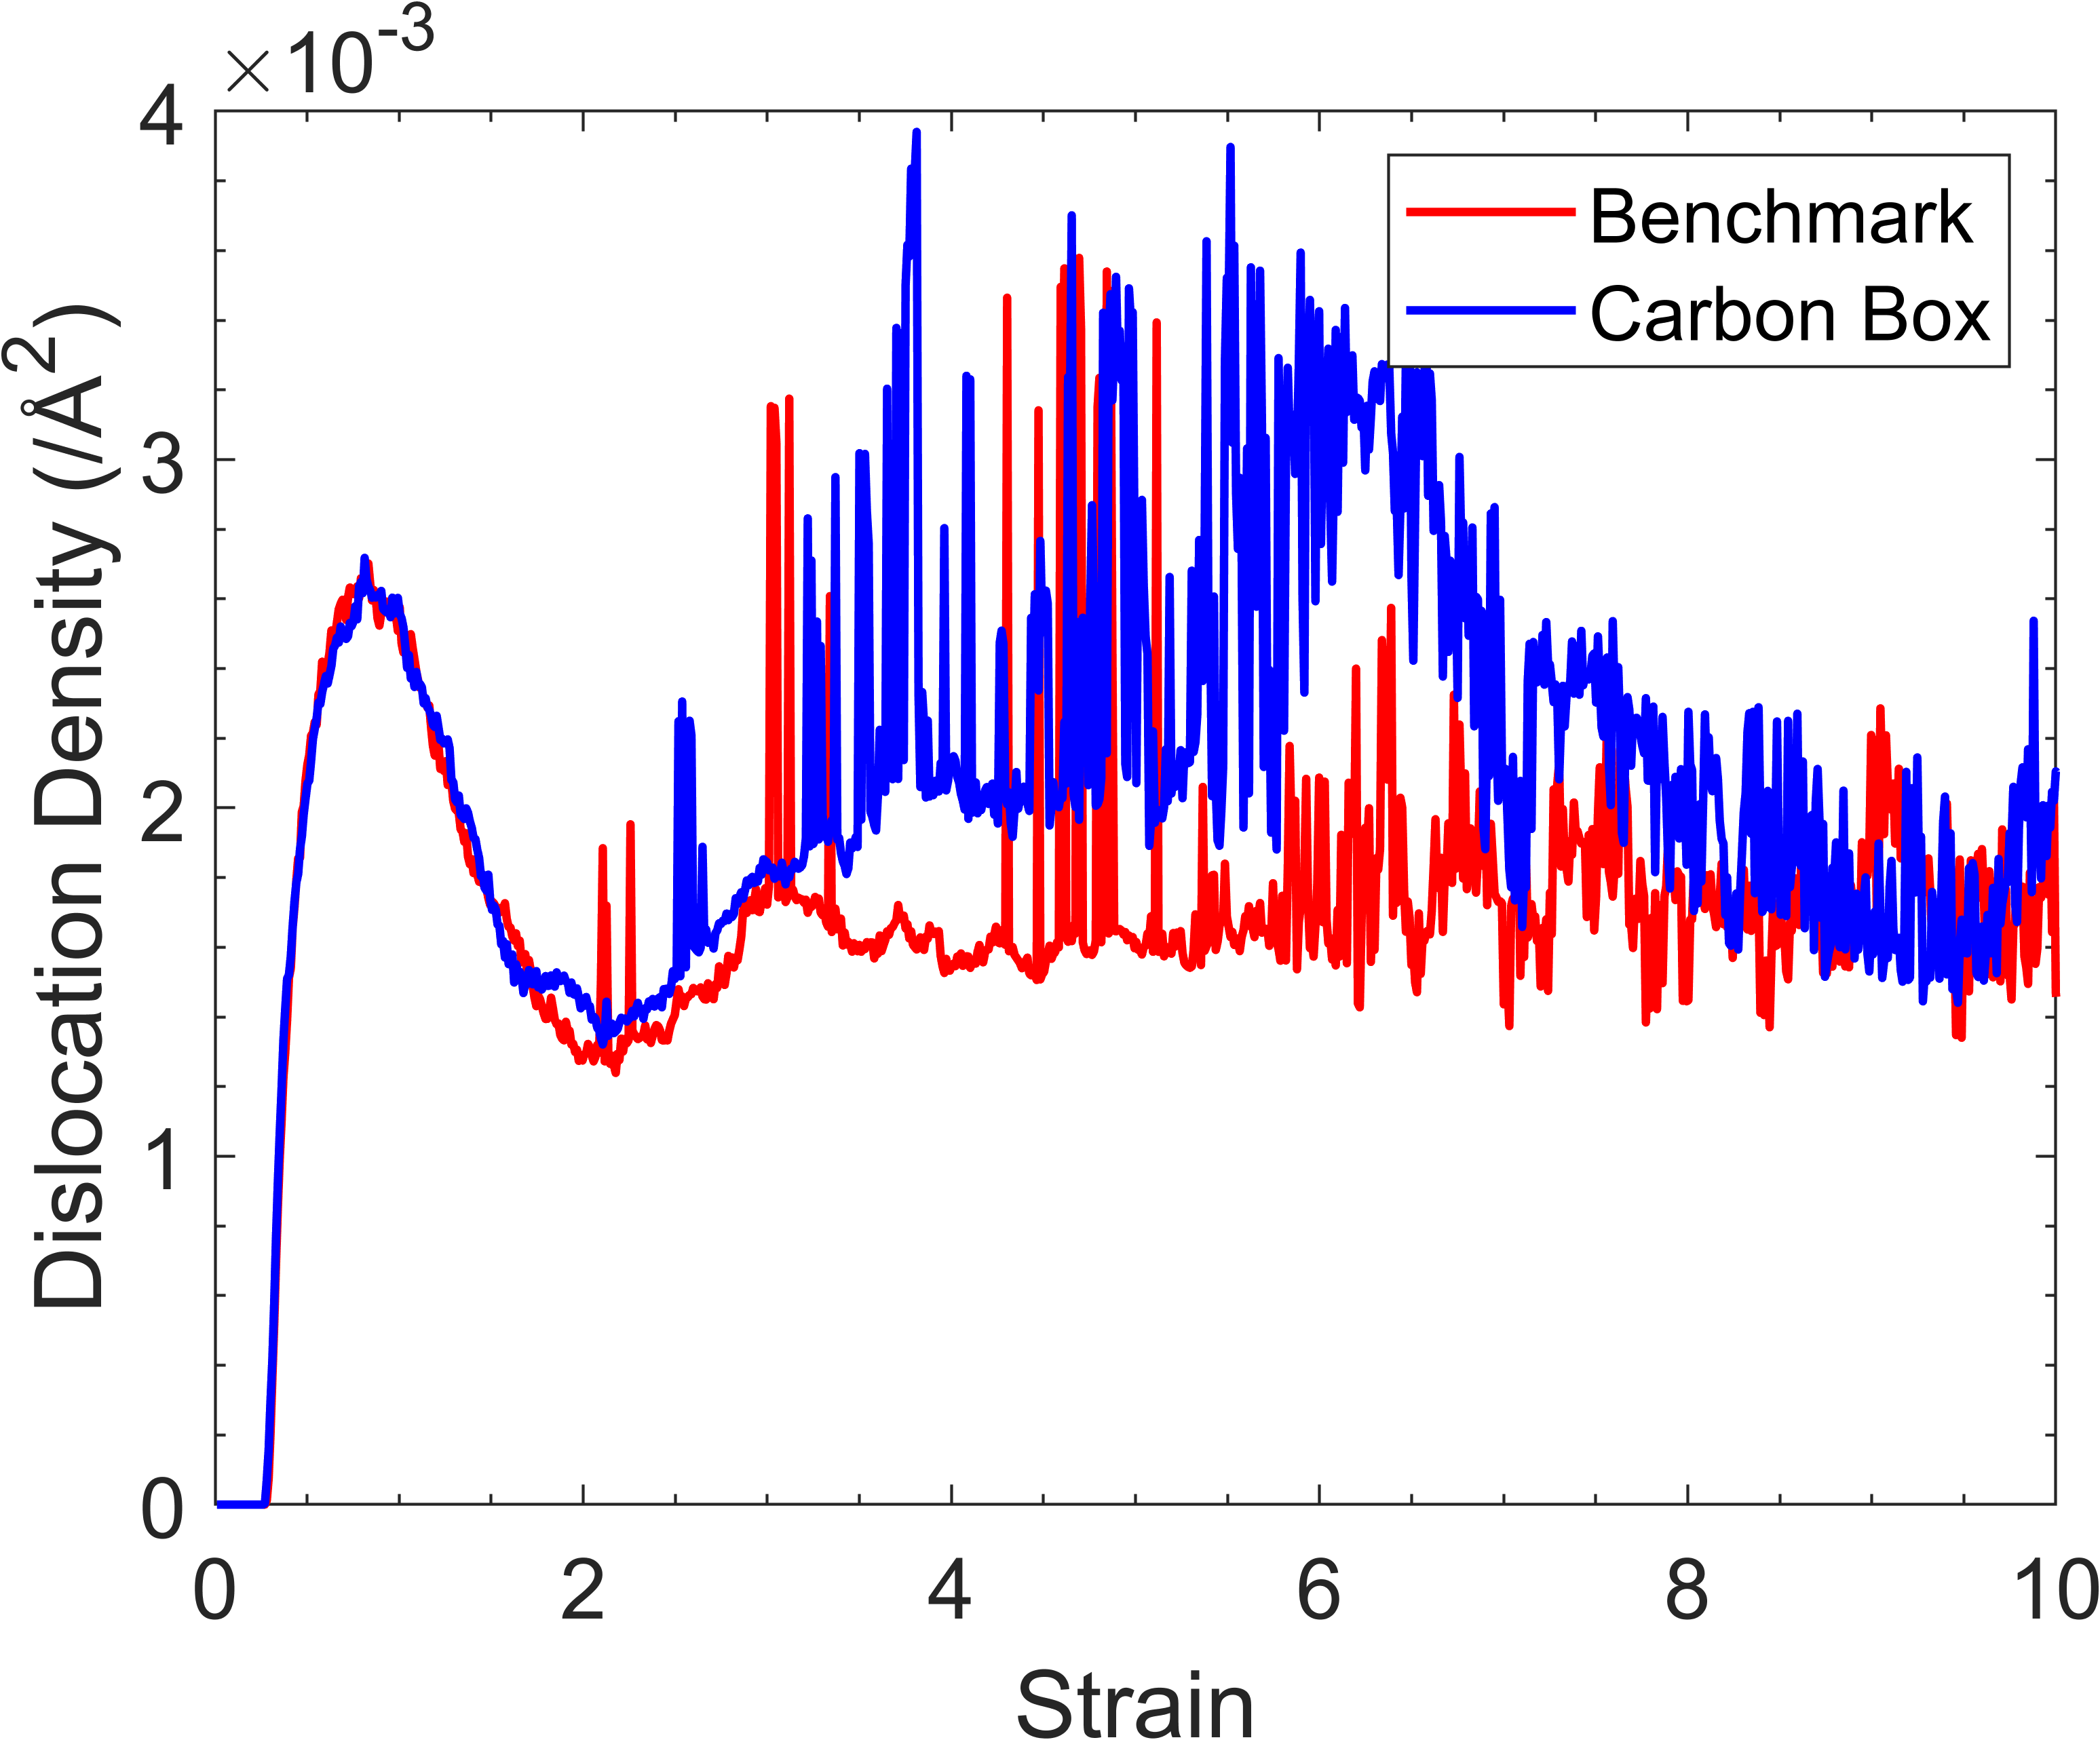
Figure 2(d) illustrates the number of grains detected by OVITO. The number of grains undergoes a sharp increase at and peaks at with approximately 400 grains. This corresponds to the highly disordered state, where OVITO identifies small pockets of BCC structure as individual grains within a volume of highly disordered atoms. After that, there is a rapid decrease in grain number, reaching a minimum of 25 grains at around 0.3 strain, coinciding with the decrease in potential energy. Following this, the number of grains once again rises to around 230 at . Then, there is a decrease to about 160 at . Another increase in grain count is observed after reaching , plateauing at a value of around 240 until the end of the simulation. In Figure 2(e), we also observe an increase in dislocation density starting at a strain value of 0.27. The dislocation density is given as the total line length divided by the volume of the simulation cell. Dislocation density rises to approximately Å2 at 0.82 strain, followed by a decrease to Å2 at around 2 strain. The dislocation density experiences a slight increase to Å2 at 3 strain and subsequently remains relatively constant during further shearing.
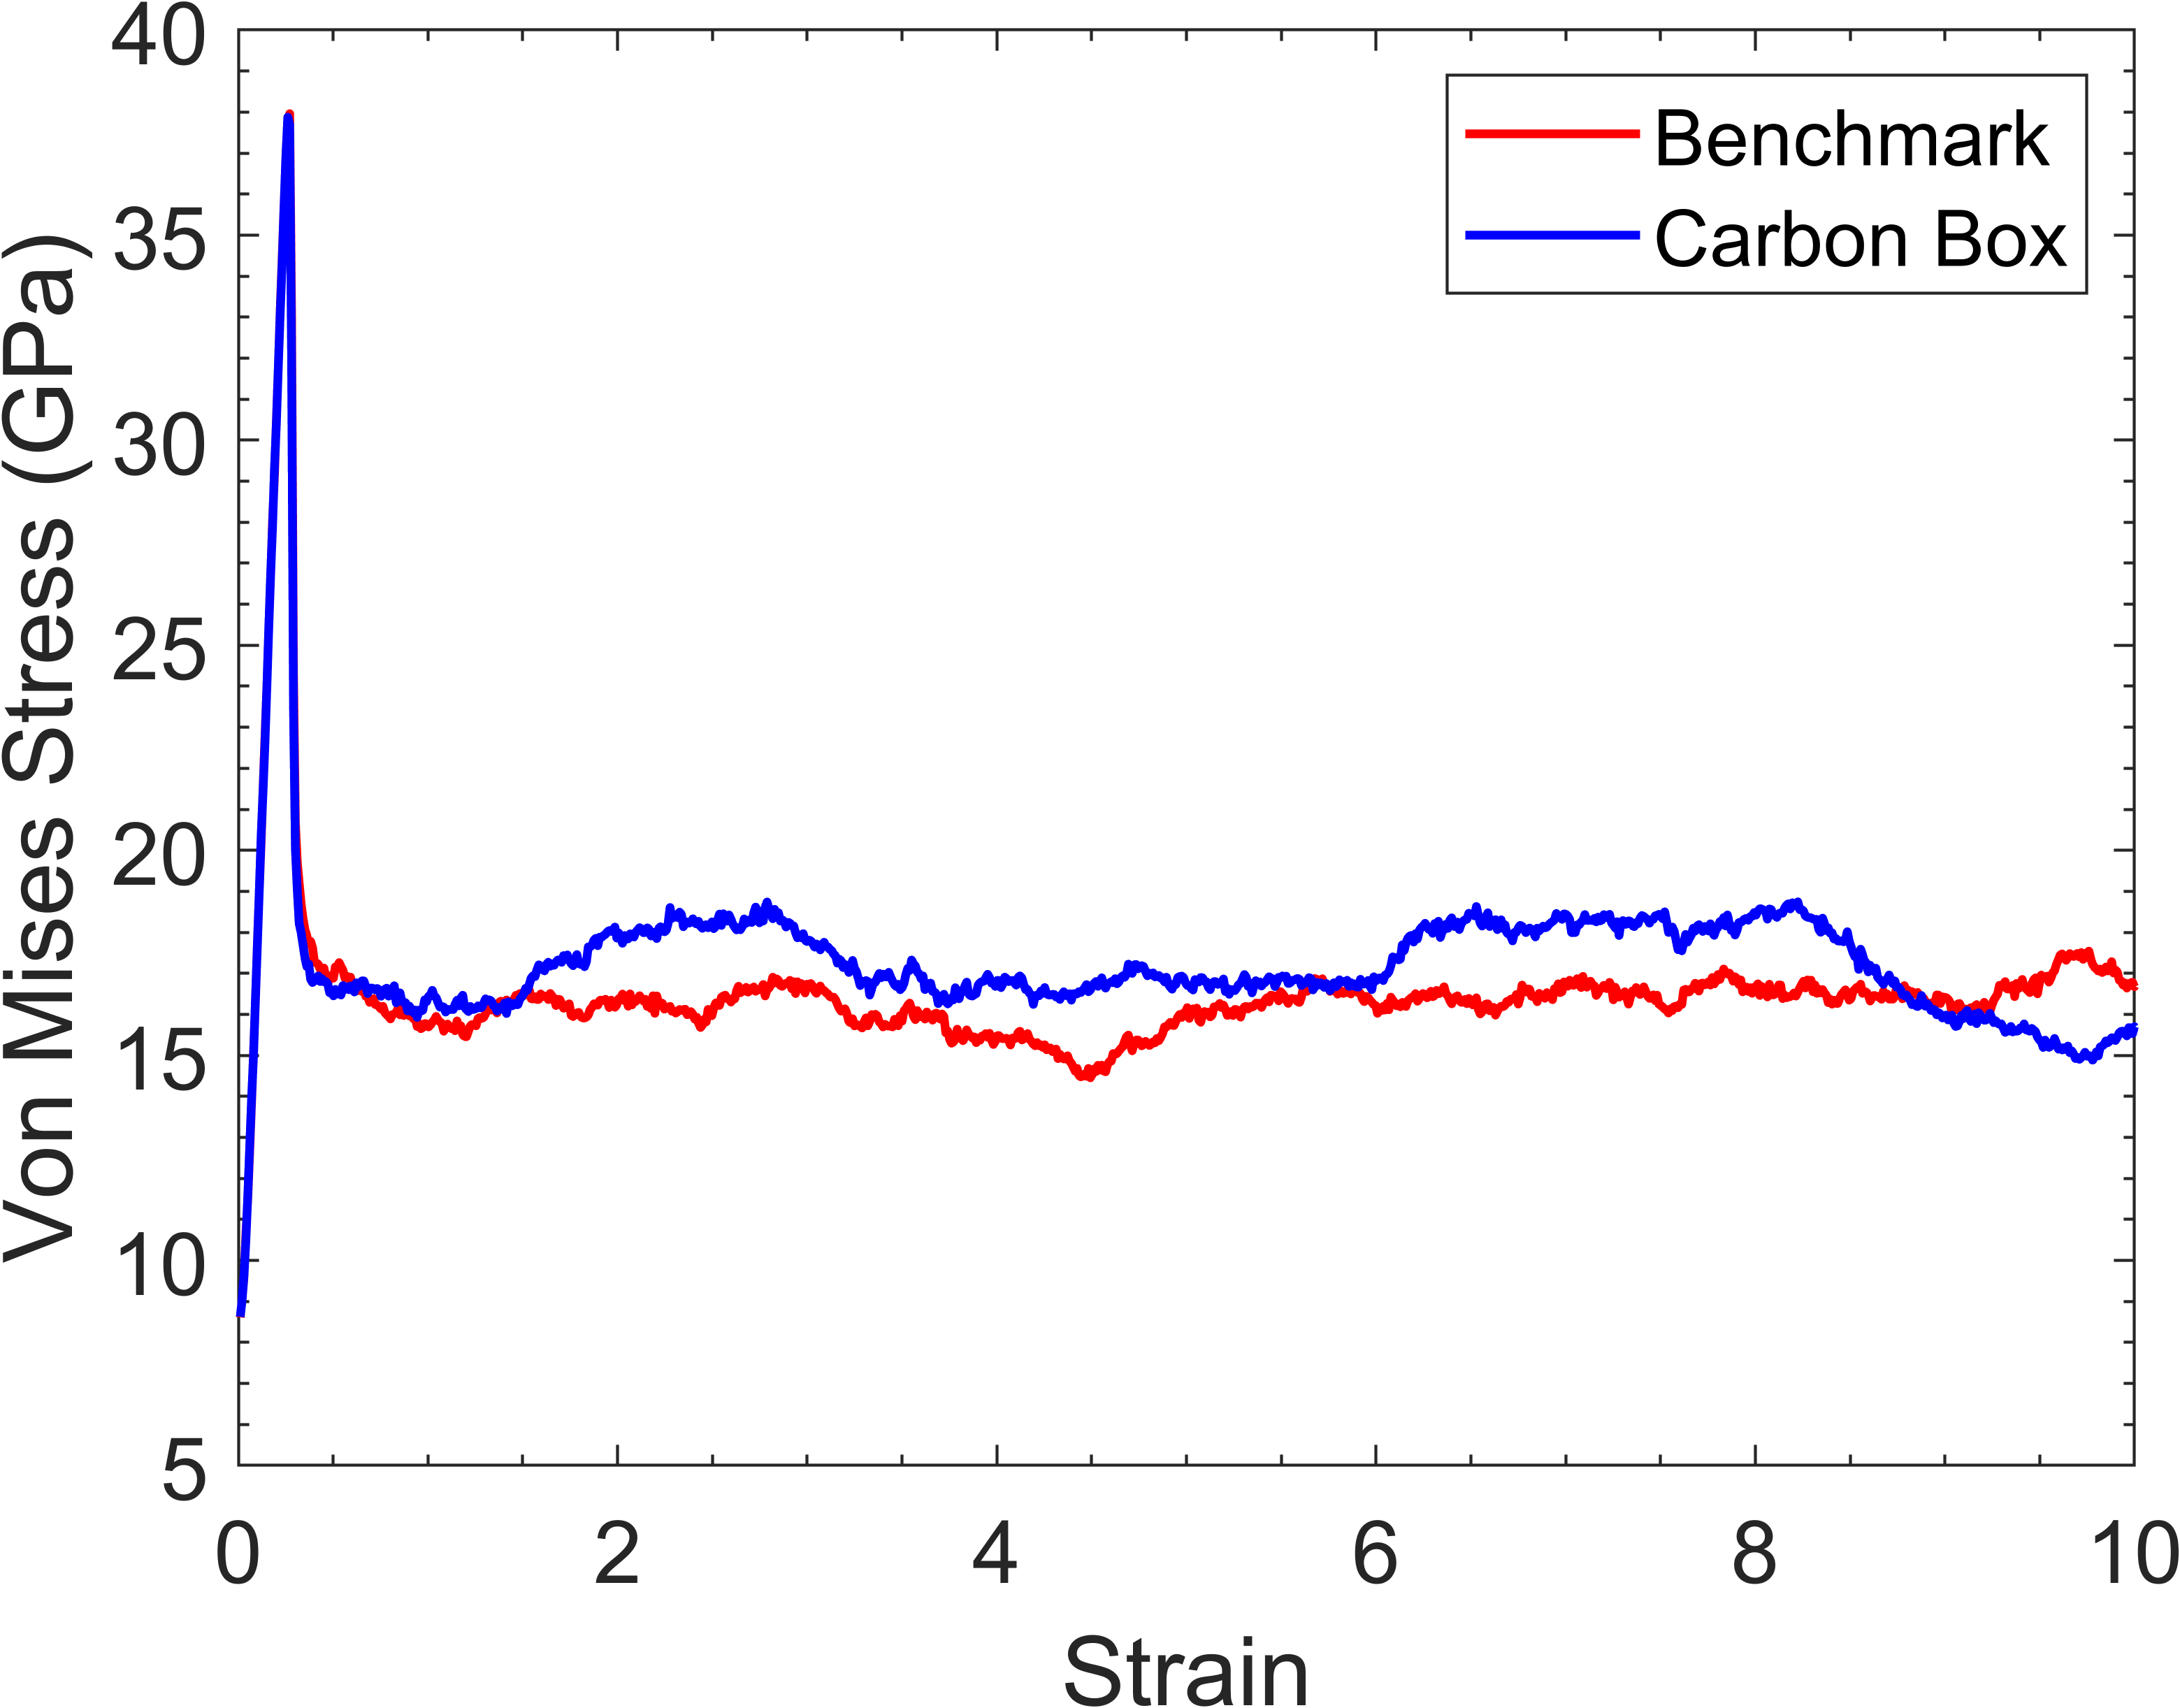
The average atomic von Mises stress, as shown in Figure 2(f), and the potential energy per atom are well correlated. There is an initial increase in von Mises stress, followed by a rapid decrease when the highly disordered state is formed at 0.27 strain. Nikonov [31] also found an increase in stress during the single crystal shearing of BCC iron. The same rapid increase, followed by a sharp decrease, was observed and attributed to lattice reorientation. It is noteworthy that the potential energy never decreases to its original value, as some excess energy, associated with dislocations and grain boundaries generated during deformation, is stored within the material [59].
As shown in Figure 1, the atoms become highly disordered, with peak disorder occurring at 0.27 strain, which corresponds to a maximum in the potential energy. This maximum is a threshold value after which the atoms within the lattice move and reorganise themselves, as made evident by the increase in kinetic energy in Figure 2(b), and the recrystallisation at 0.3 strain in Figure 1(c). The increasing shear strain causes a breaking of the symmetry in the crystal lattice that changes the potential energy landscape. Since atoms already have a high potential energy, triggered by thermal excitations, the unbalanced forces acting on atoms cause them to accelerate, triggering the onset of the disordered phase.
Subsequently, there is a surge in system temperature, as shown in Figure 2(c), which is due to the increase in atomic velocities. As our system is attached to a Langevin thermostat, the system temperature reduces back to the target temperature. Alongside the cool-down, the system undergoes a recrystallization, causing grain nucleation. The grains are tiny at around 0.3 strain, see Figure 1(c). The microstructure remains dominated by highly disoriented regions. Then, grain coarsening starts and continues, as observed in Figure 2(d). This is driven by the excess free energy of the disordered region manifesting as grain boundaries, which are known to possess excess free energy [60]. This excess free energy provides the driving force for atomic transport and subsequent grain growth [61].
In Fig 2(e), the dislocation density in the simulation cell increases and peaks at around 0.82 strain. Dislocations also possess excess free energy [60], which may contribute to grain growth. We note an important point regarding the DXA: LAGBs can be recognised as arrays of dislocations. Therefore, it is unclear if the detected dislocations are grain boundaries or dislocations within grains. There is a new approach that may resolve this situation. Ma et al. [62] suggested a new algorithm to calculate the shortest distance of any atom from the determined grain boundaries. By eliminating atoms close to the grain boundaries, one can estimate the dislocation line density inside grains. However, we have not adopted this method in our current work, because the definition of grains is somewhat ambiguous in such a highly disordered structure. Additional analysis is provided in Appendix A2.

Experimental studies have exhibited similar trends for nanocrystal formation. Studies on Fe-8% Al [63], TiAl [64], AZ91 Mg [65], and NiTi [66], all used some form of hot deformation to induce strain into the material, followed by quenching. These studies observed small, recrystallised grains compared to the original structure.
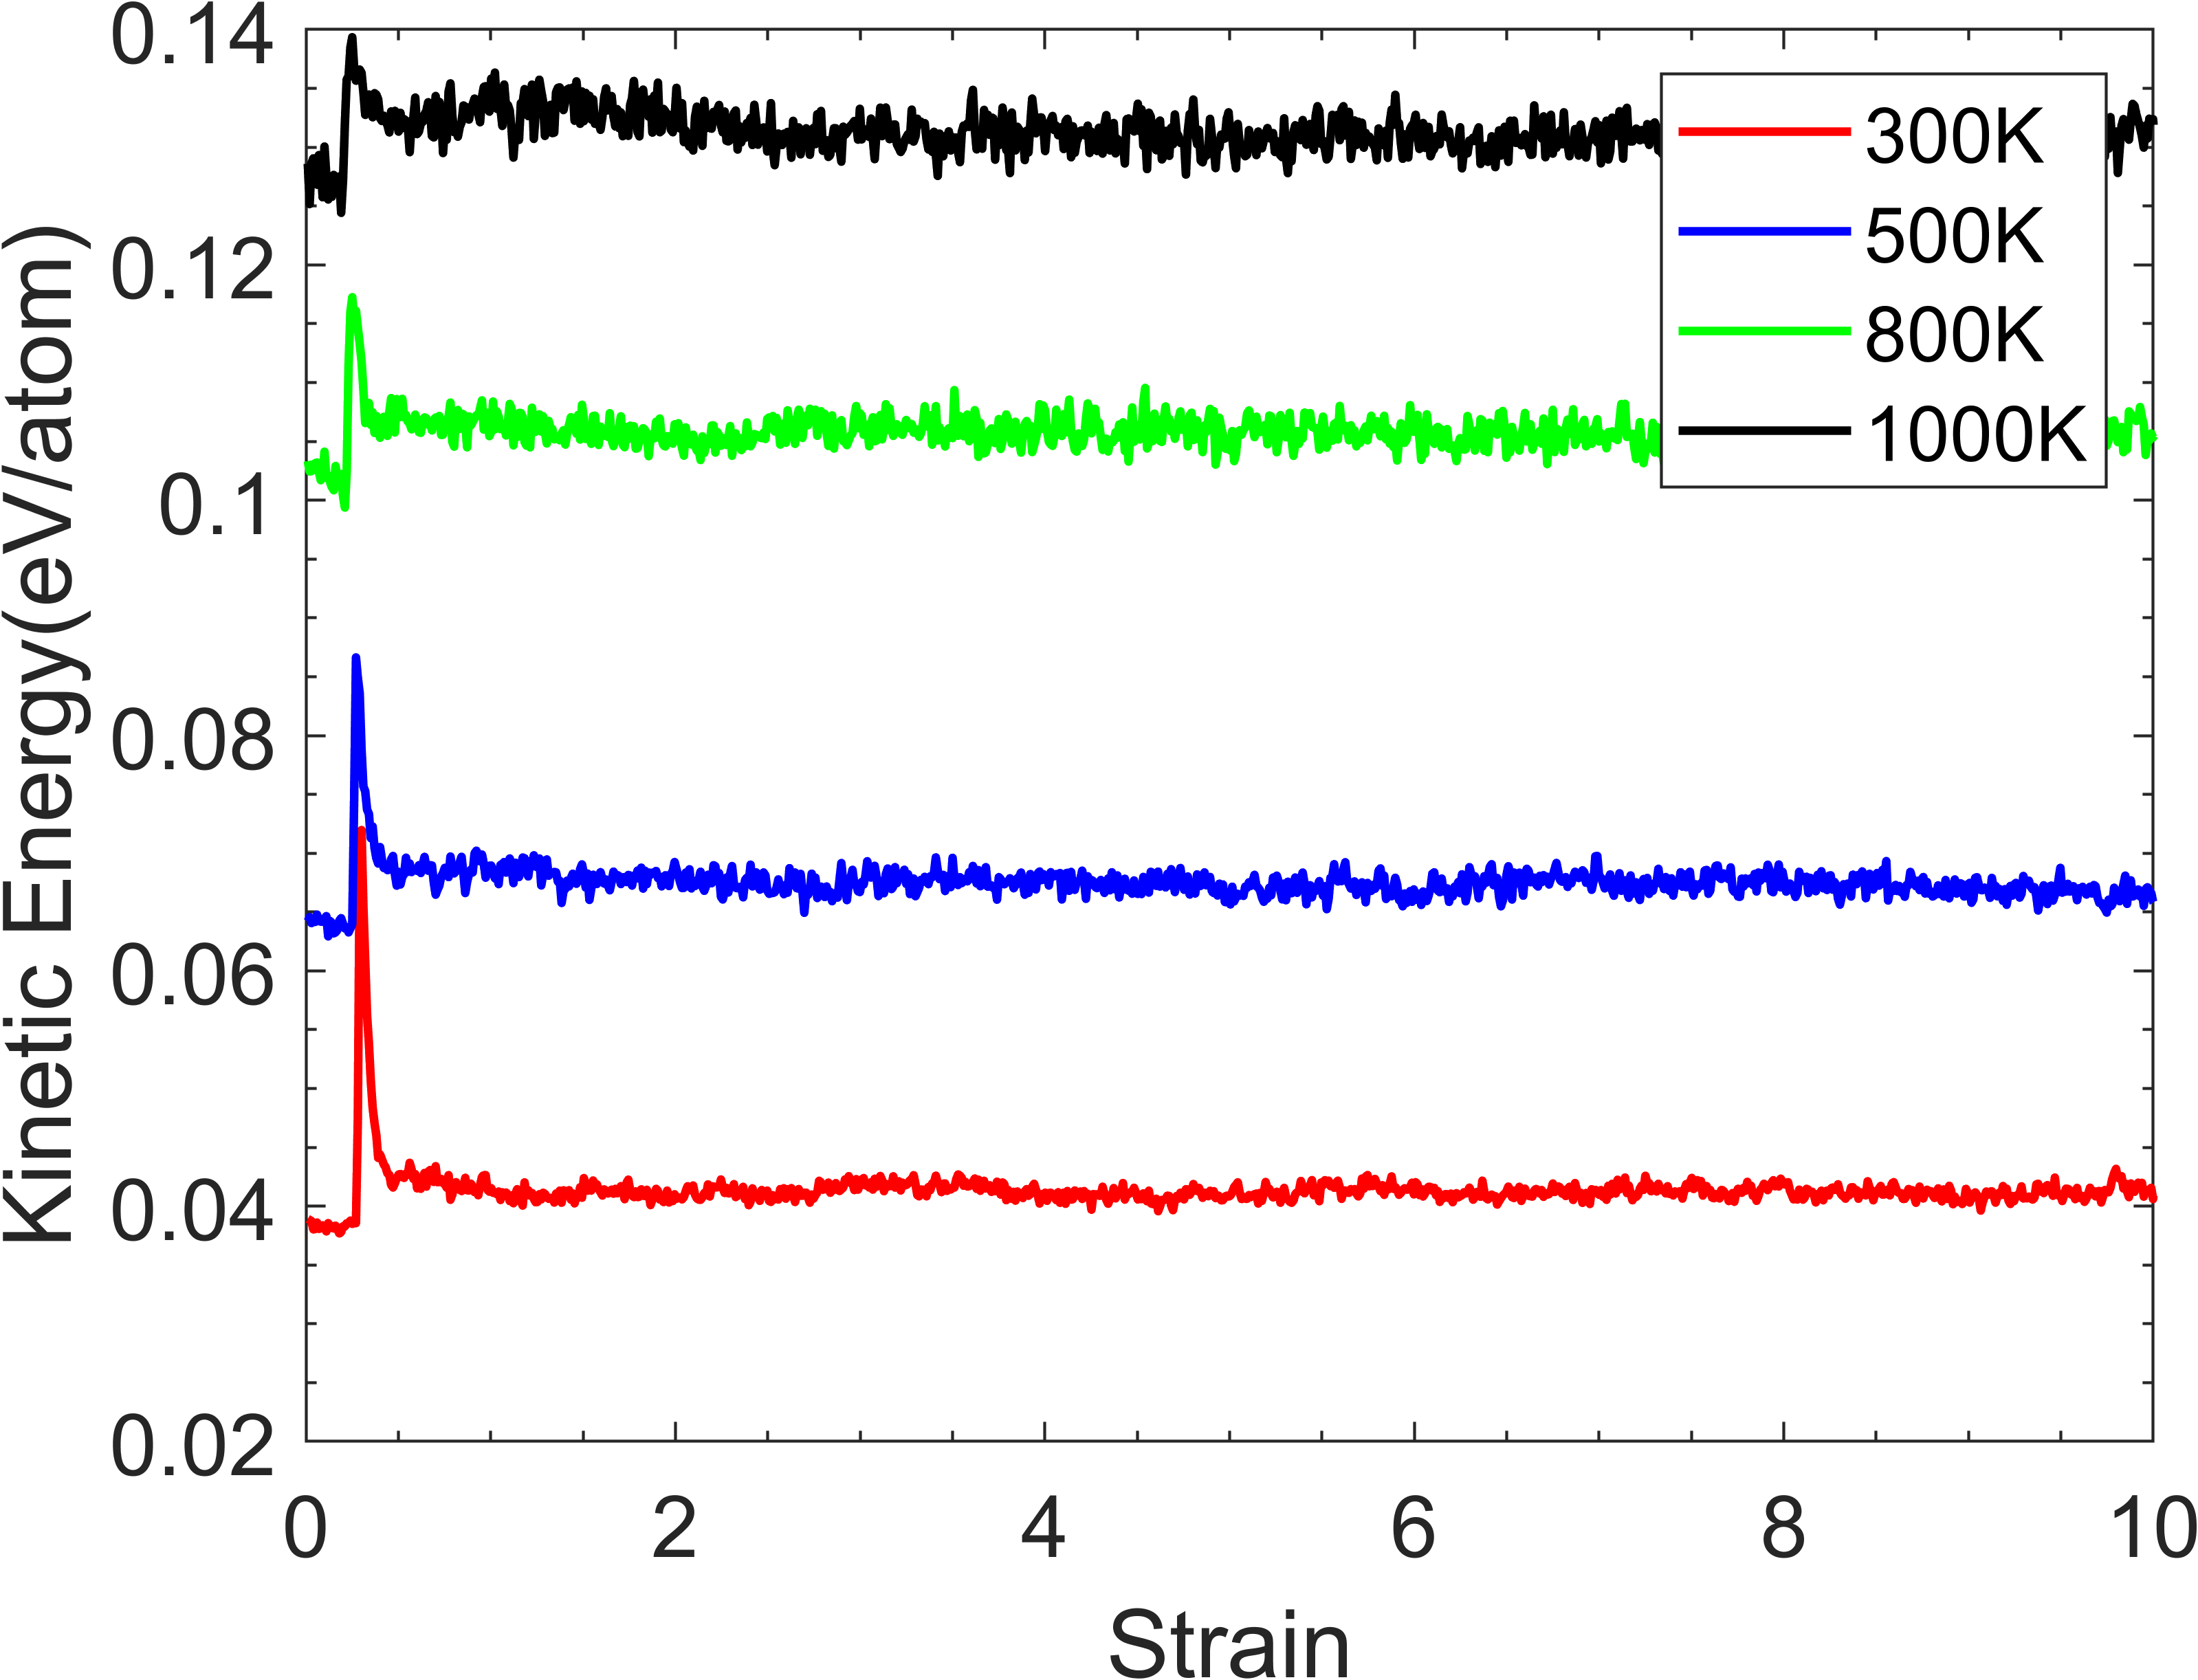
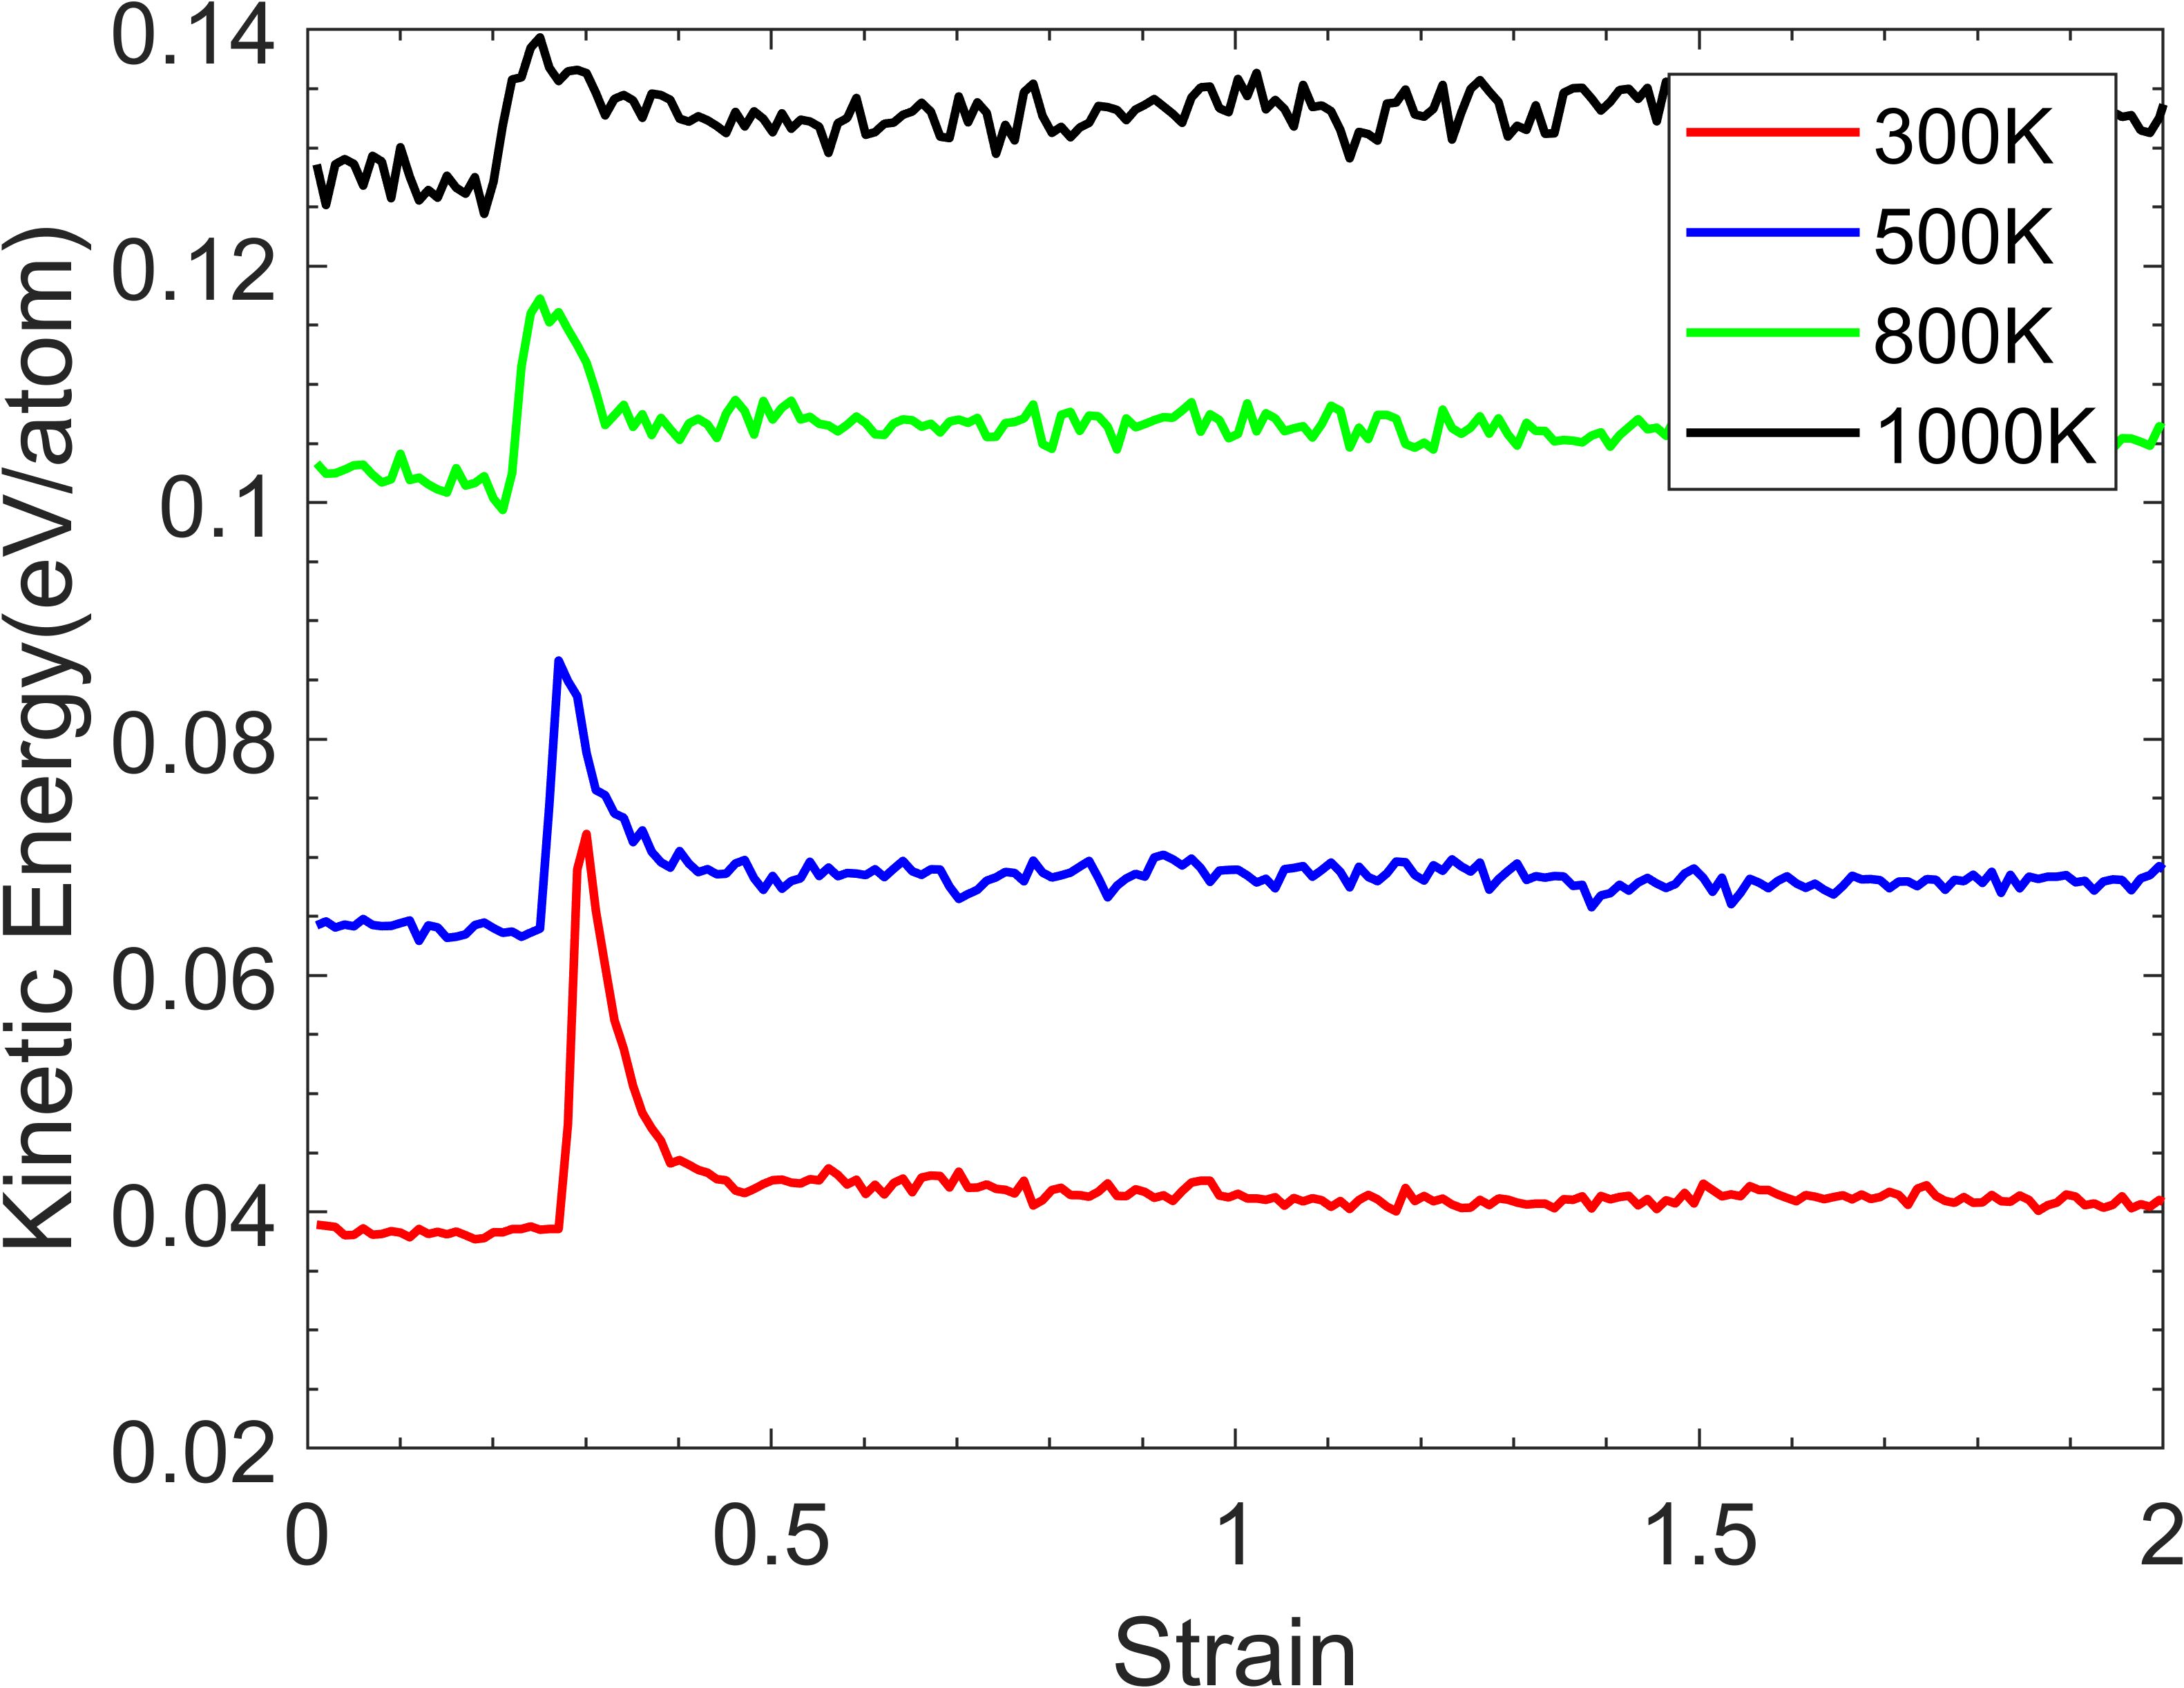
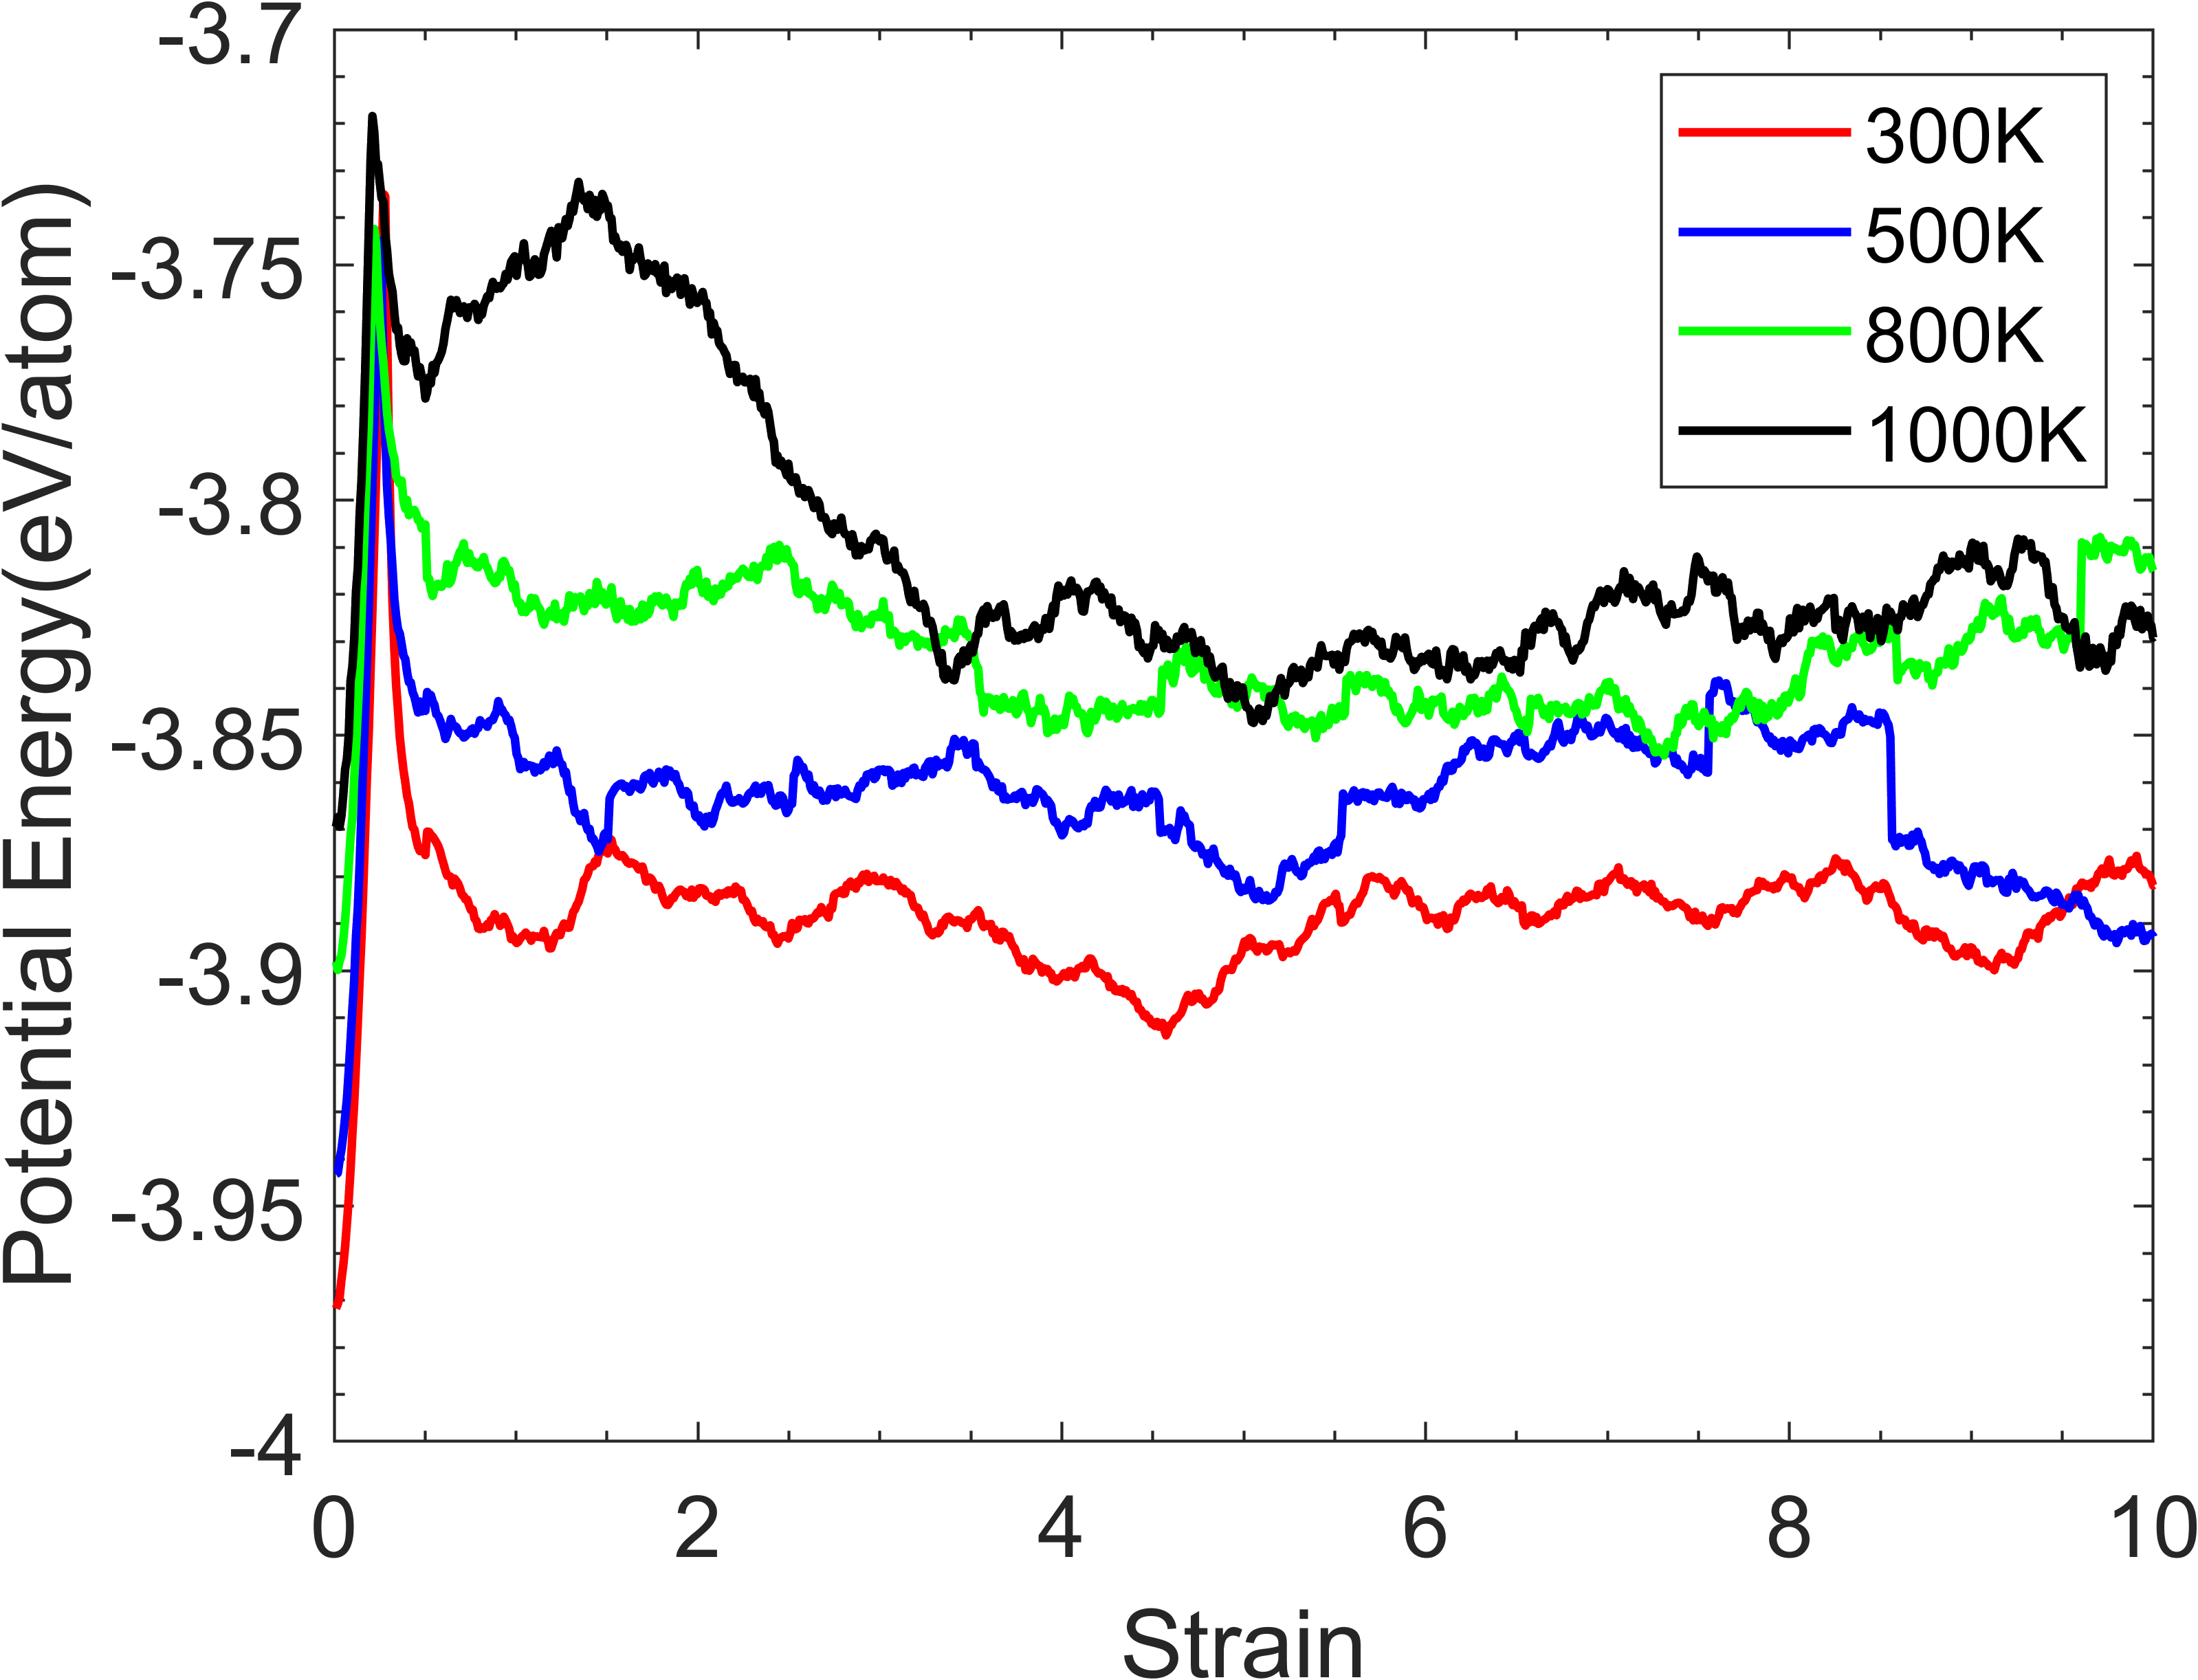
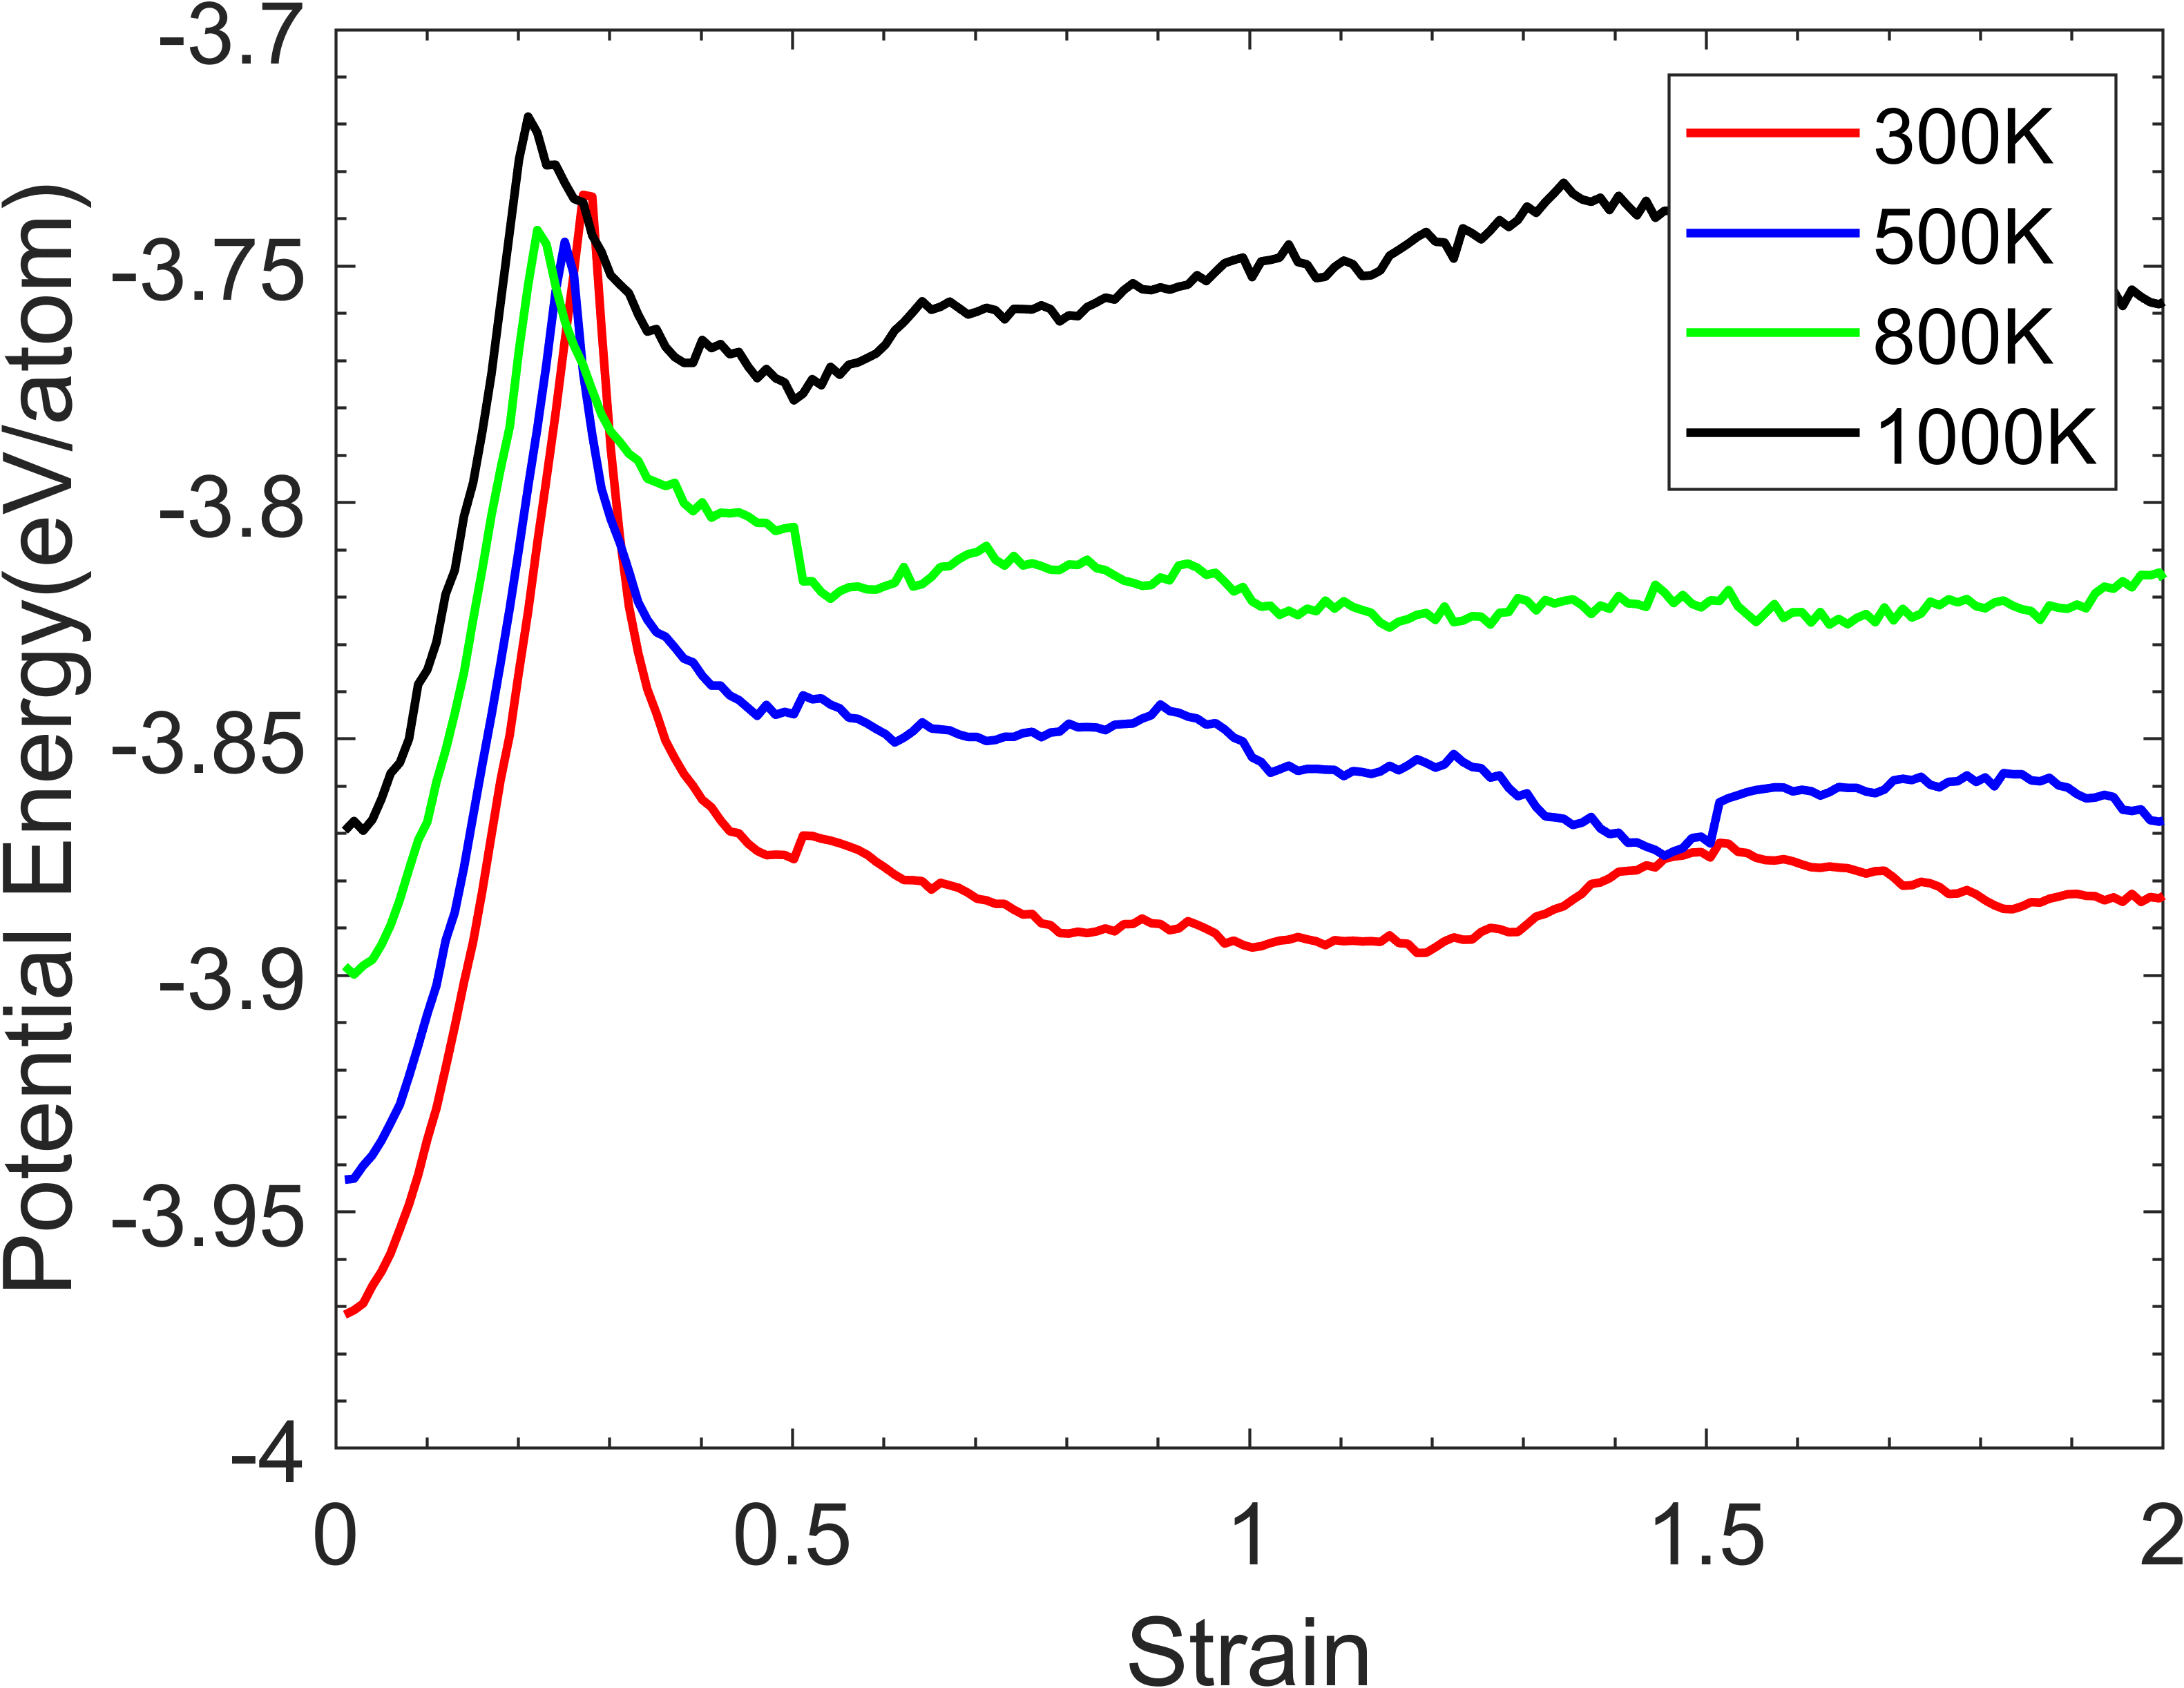

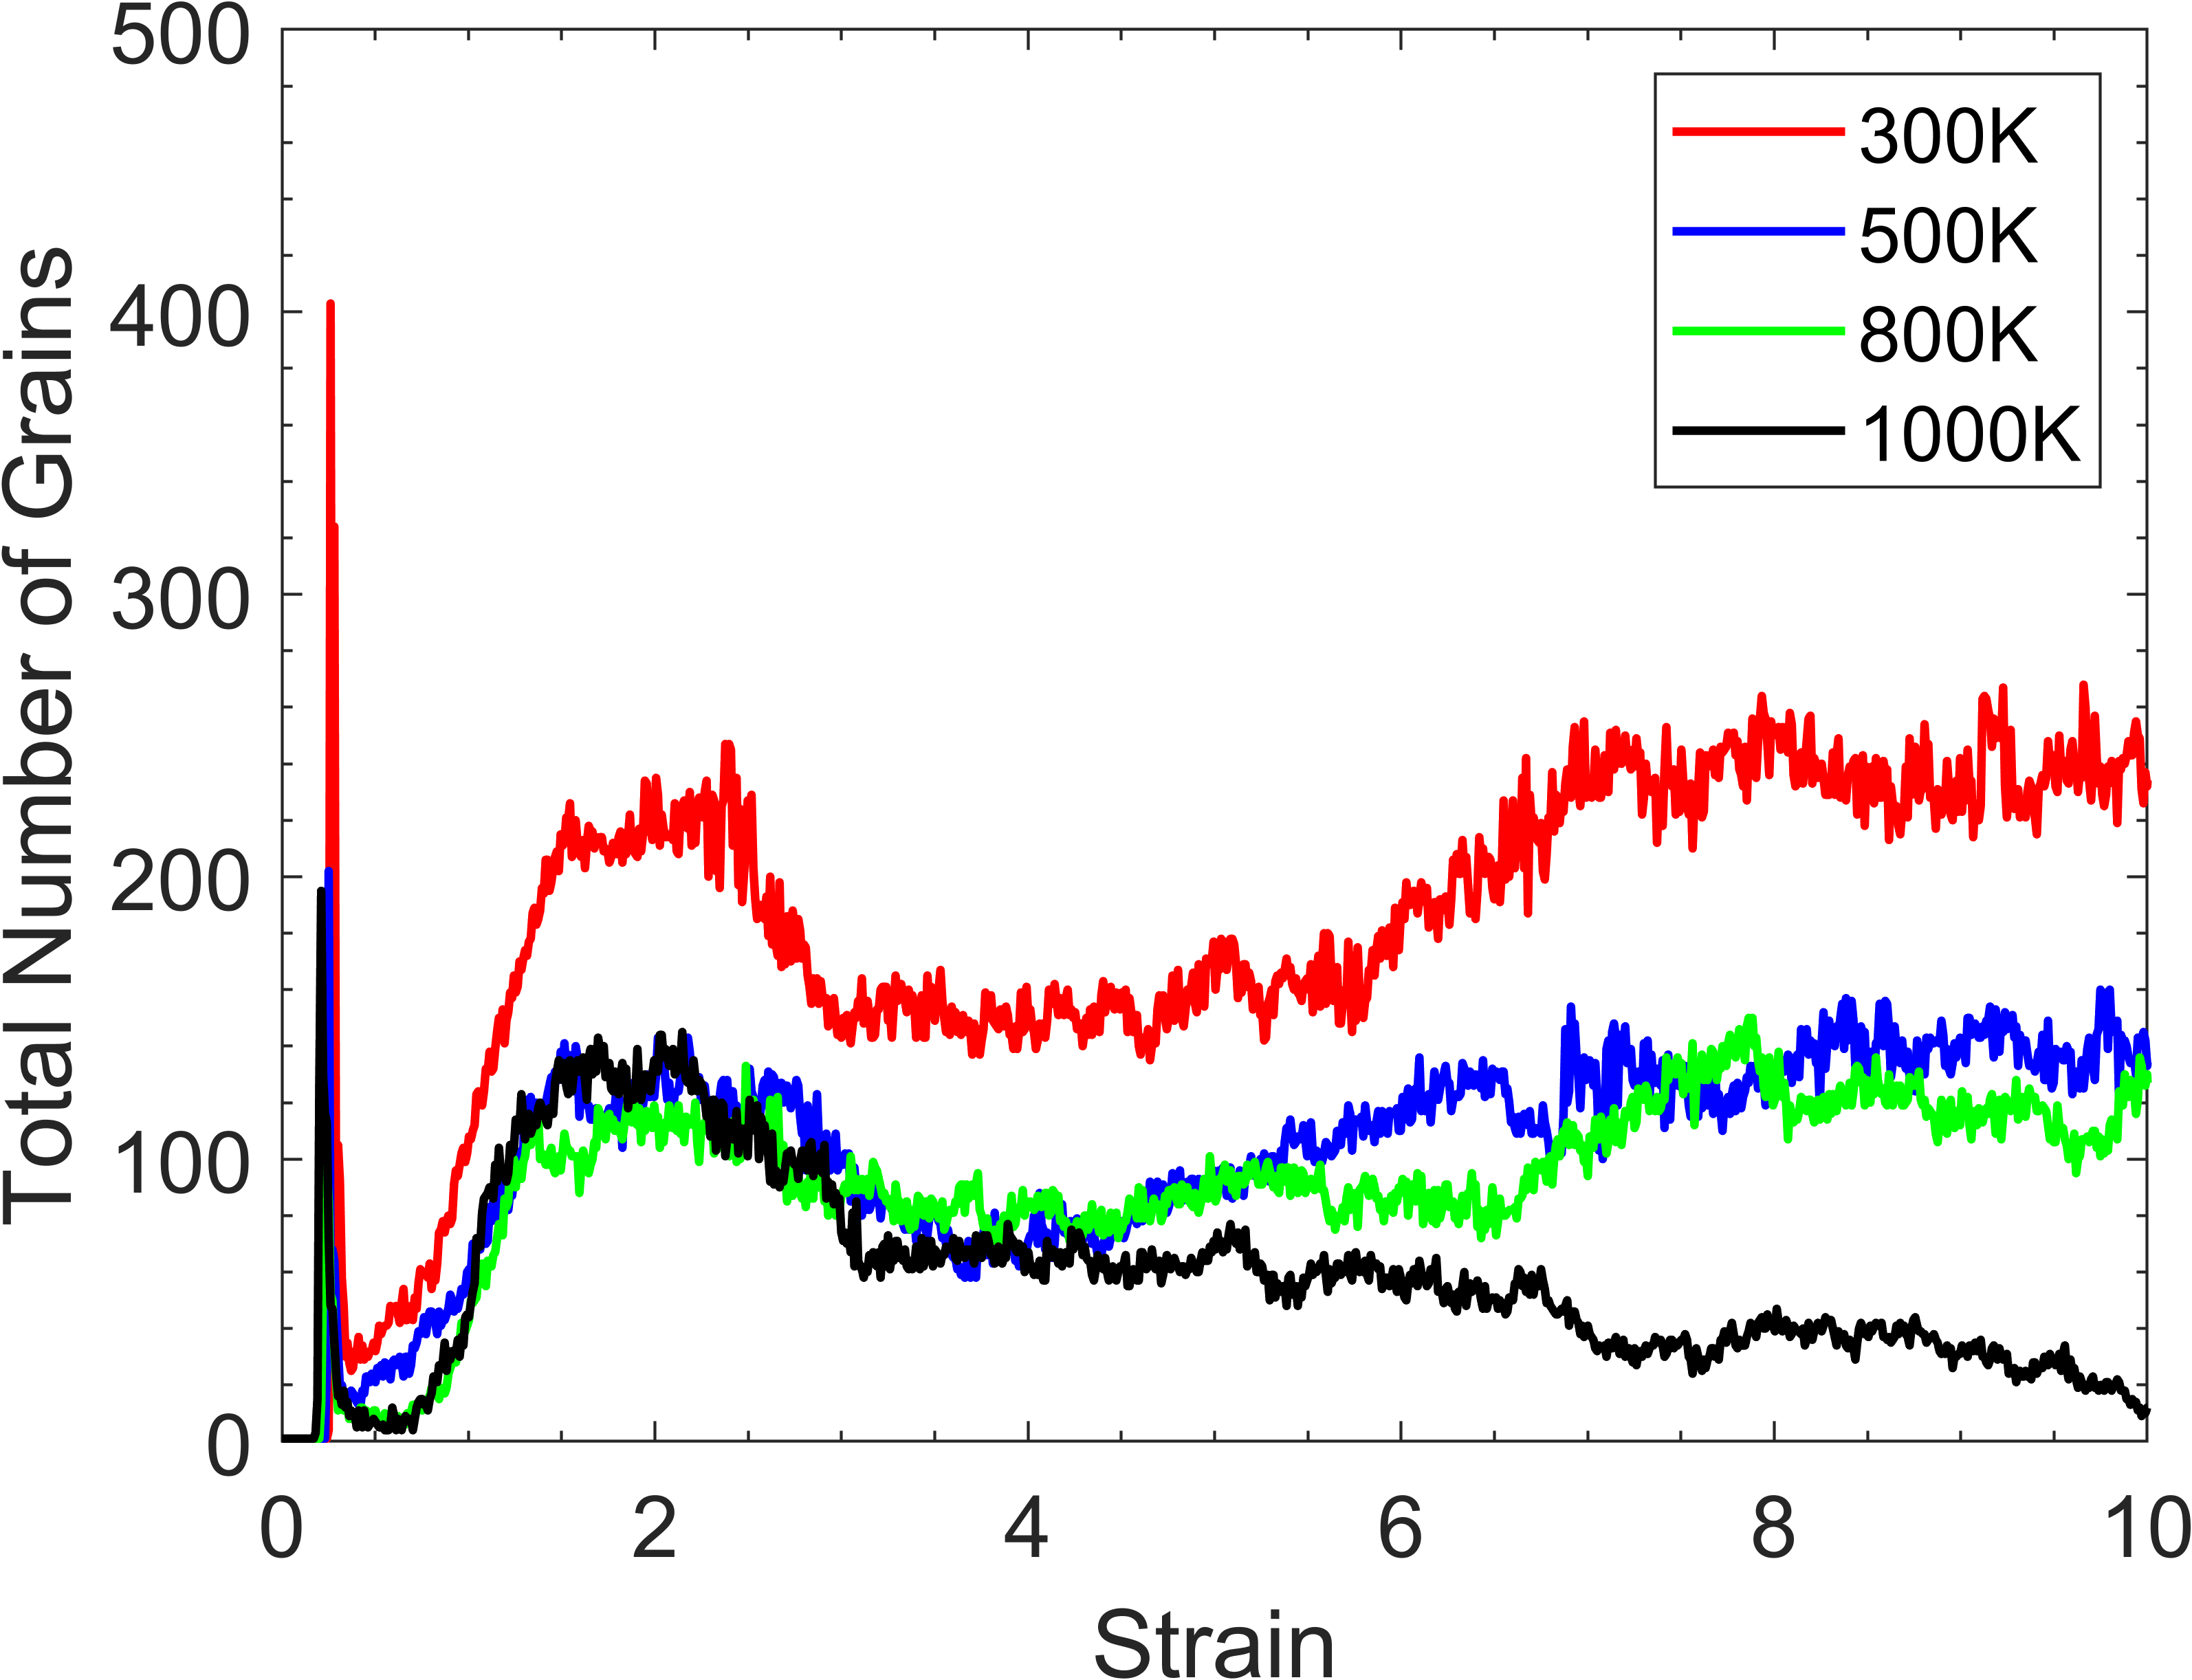
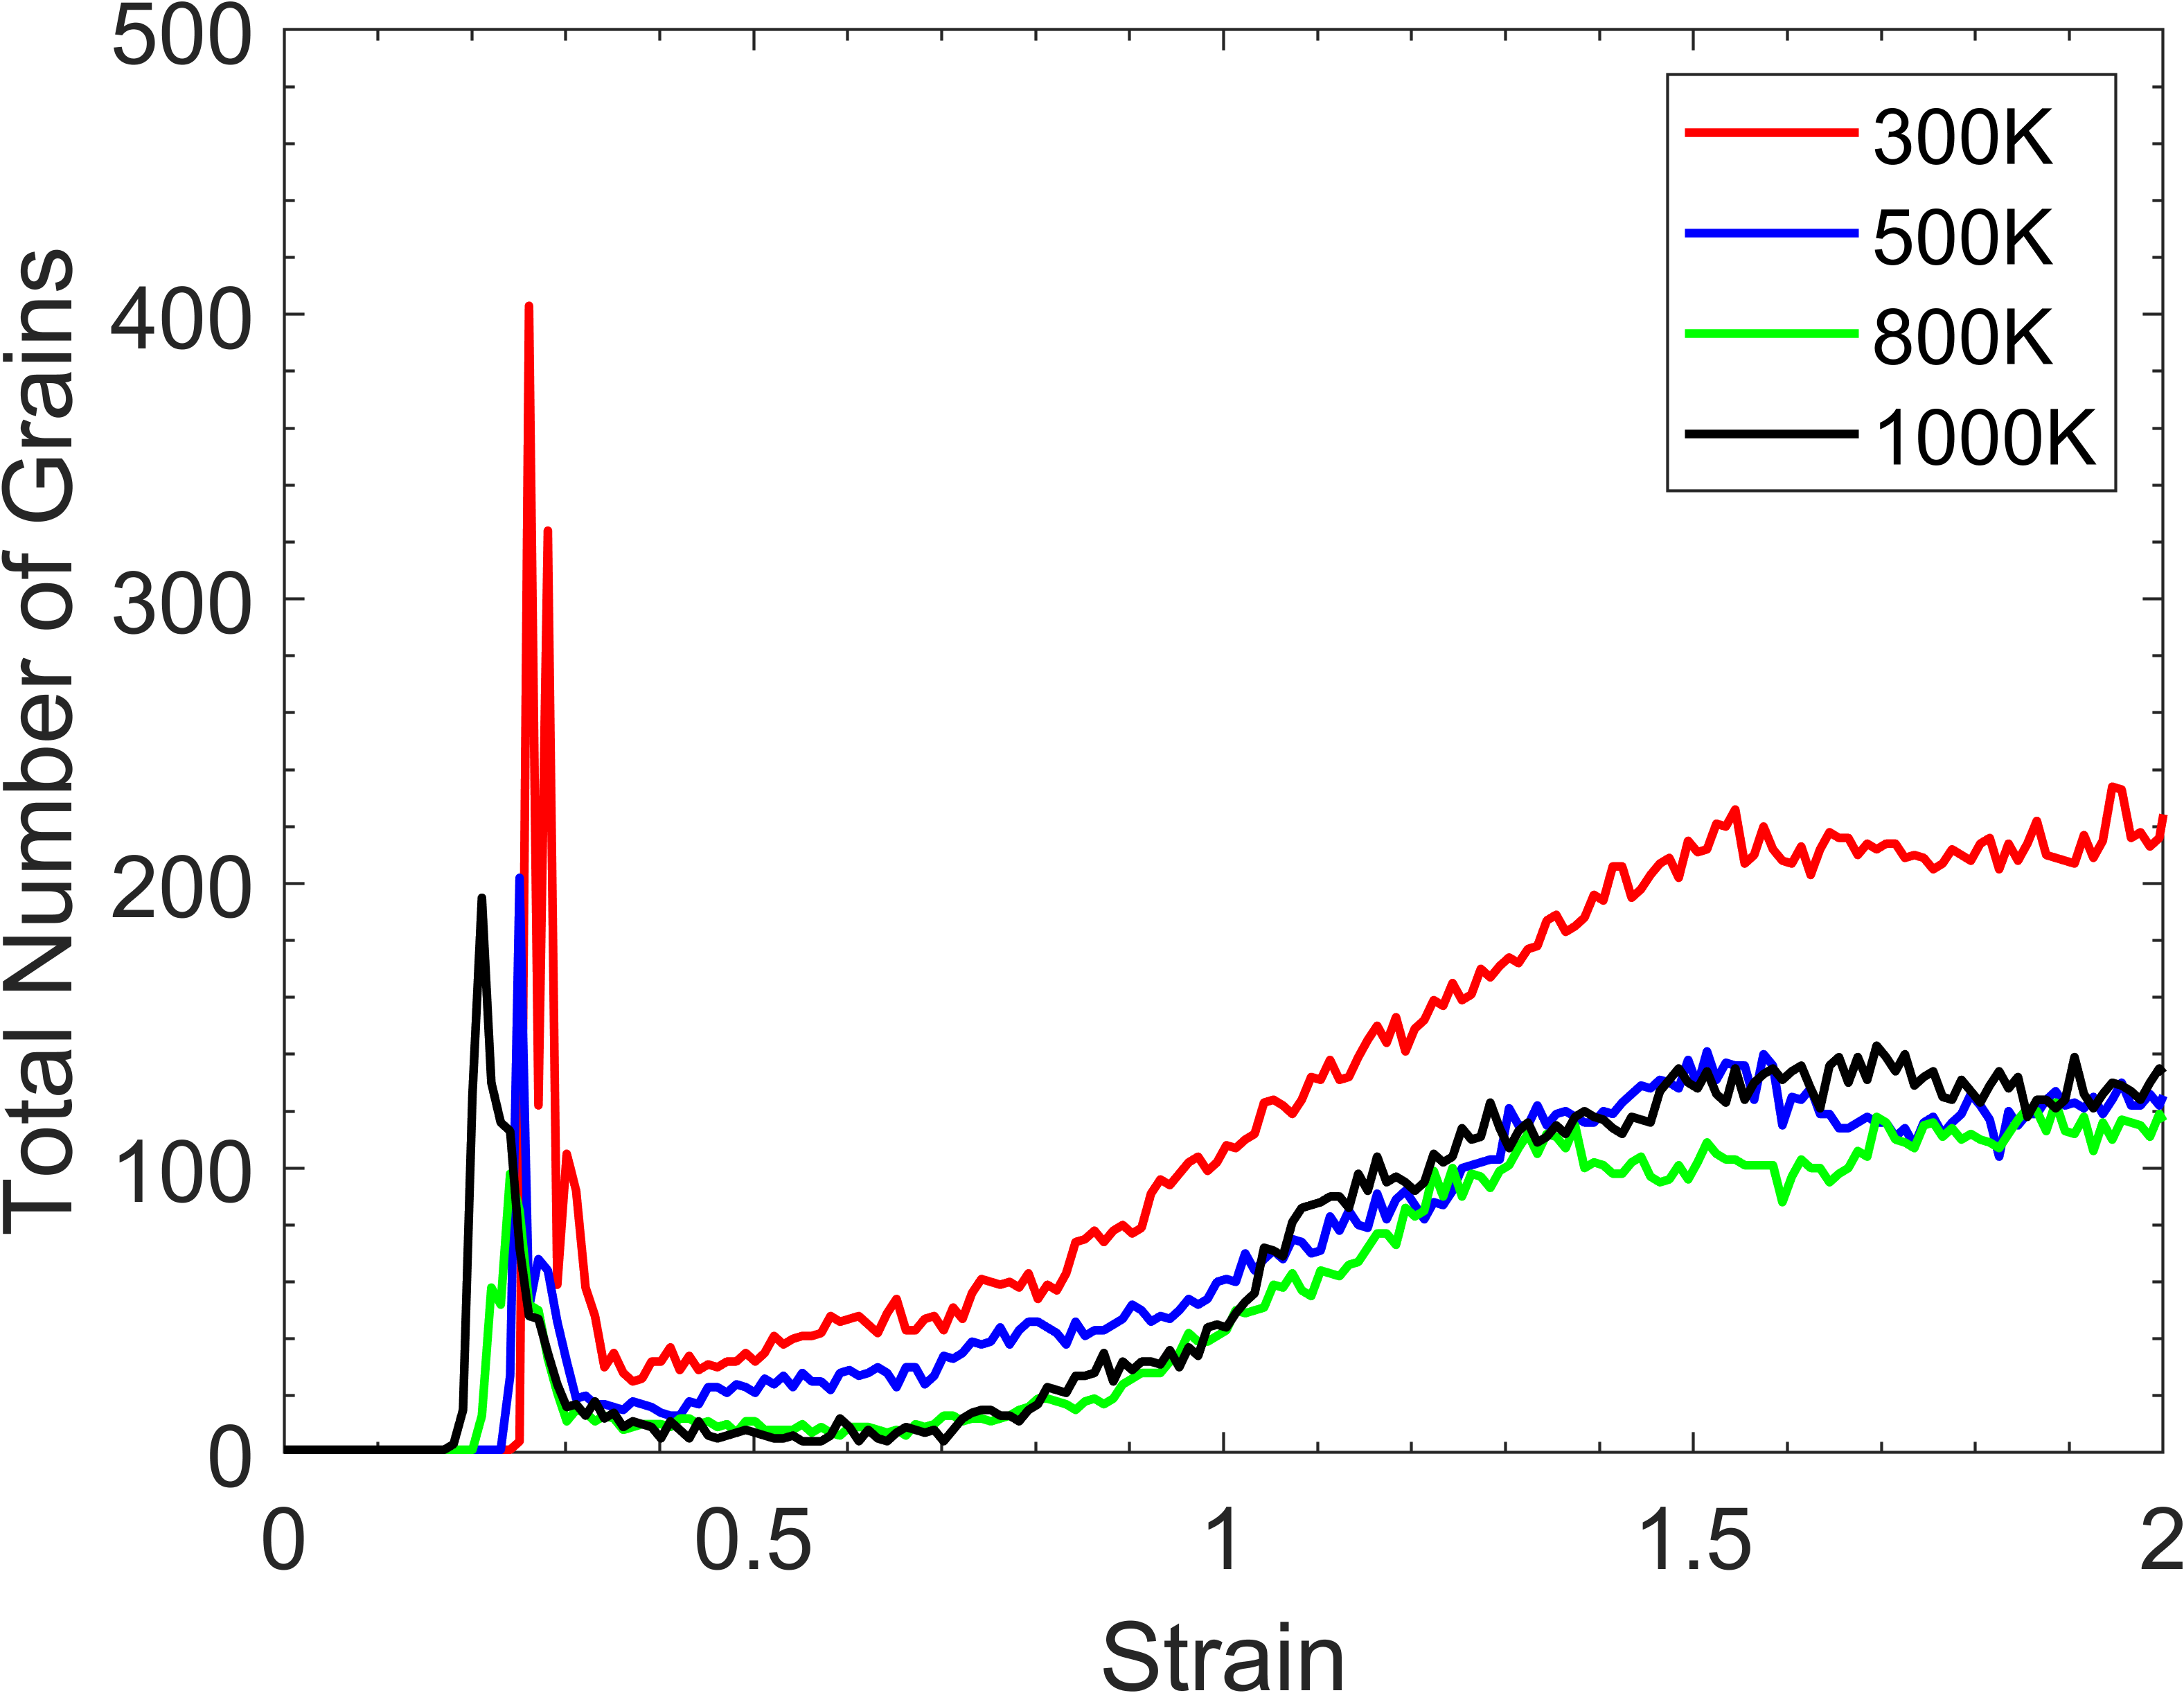
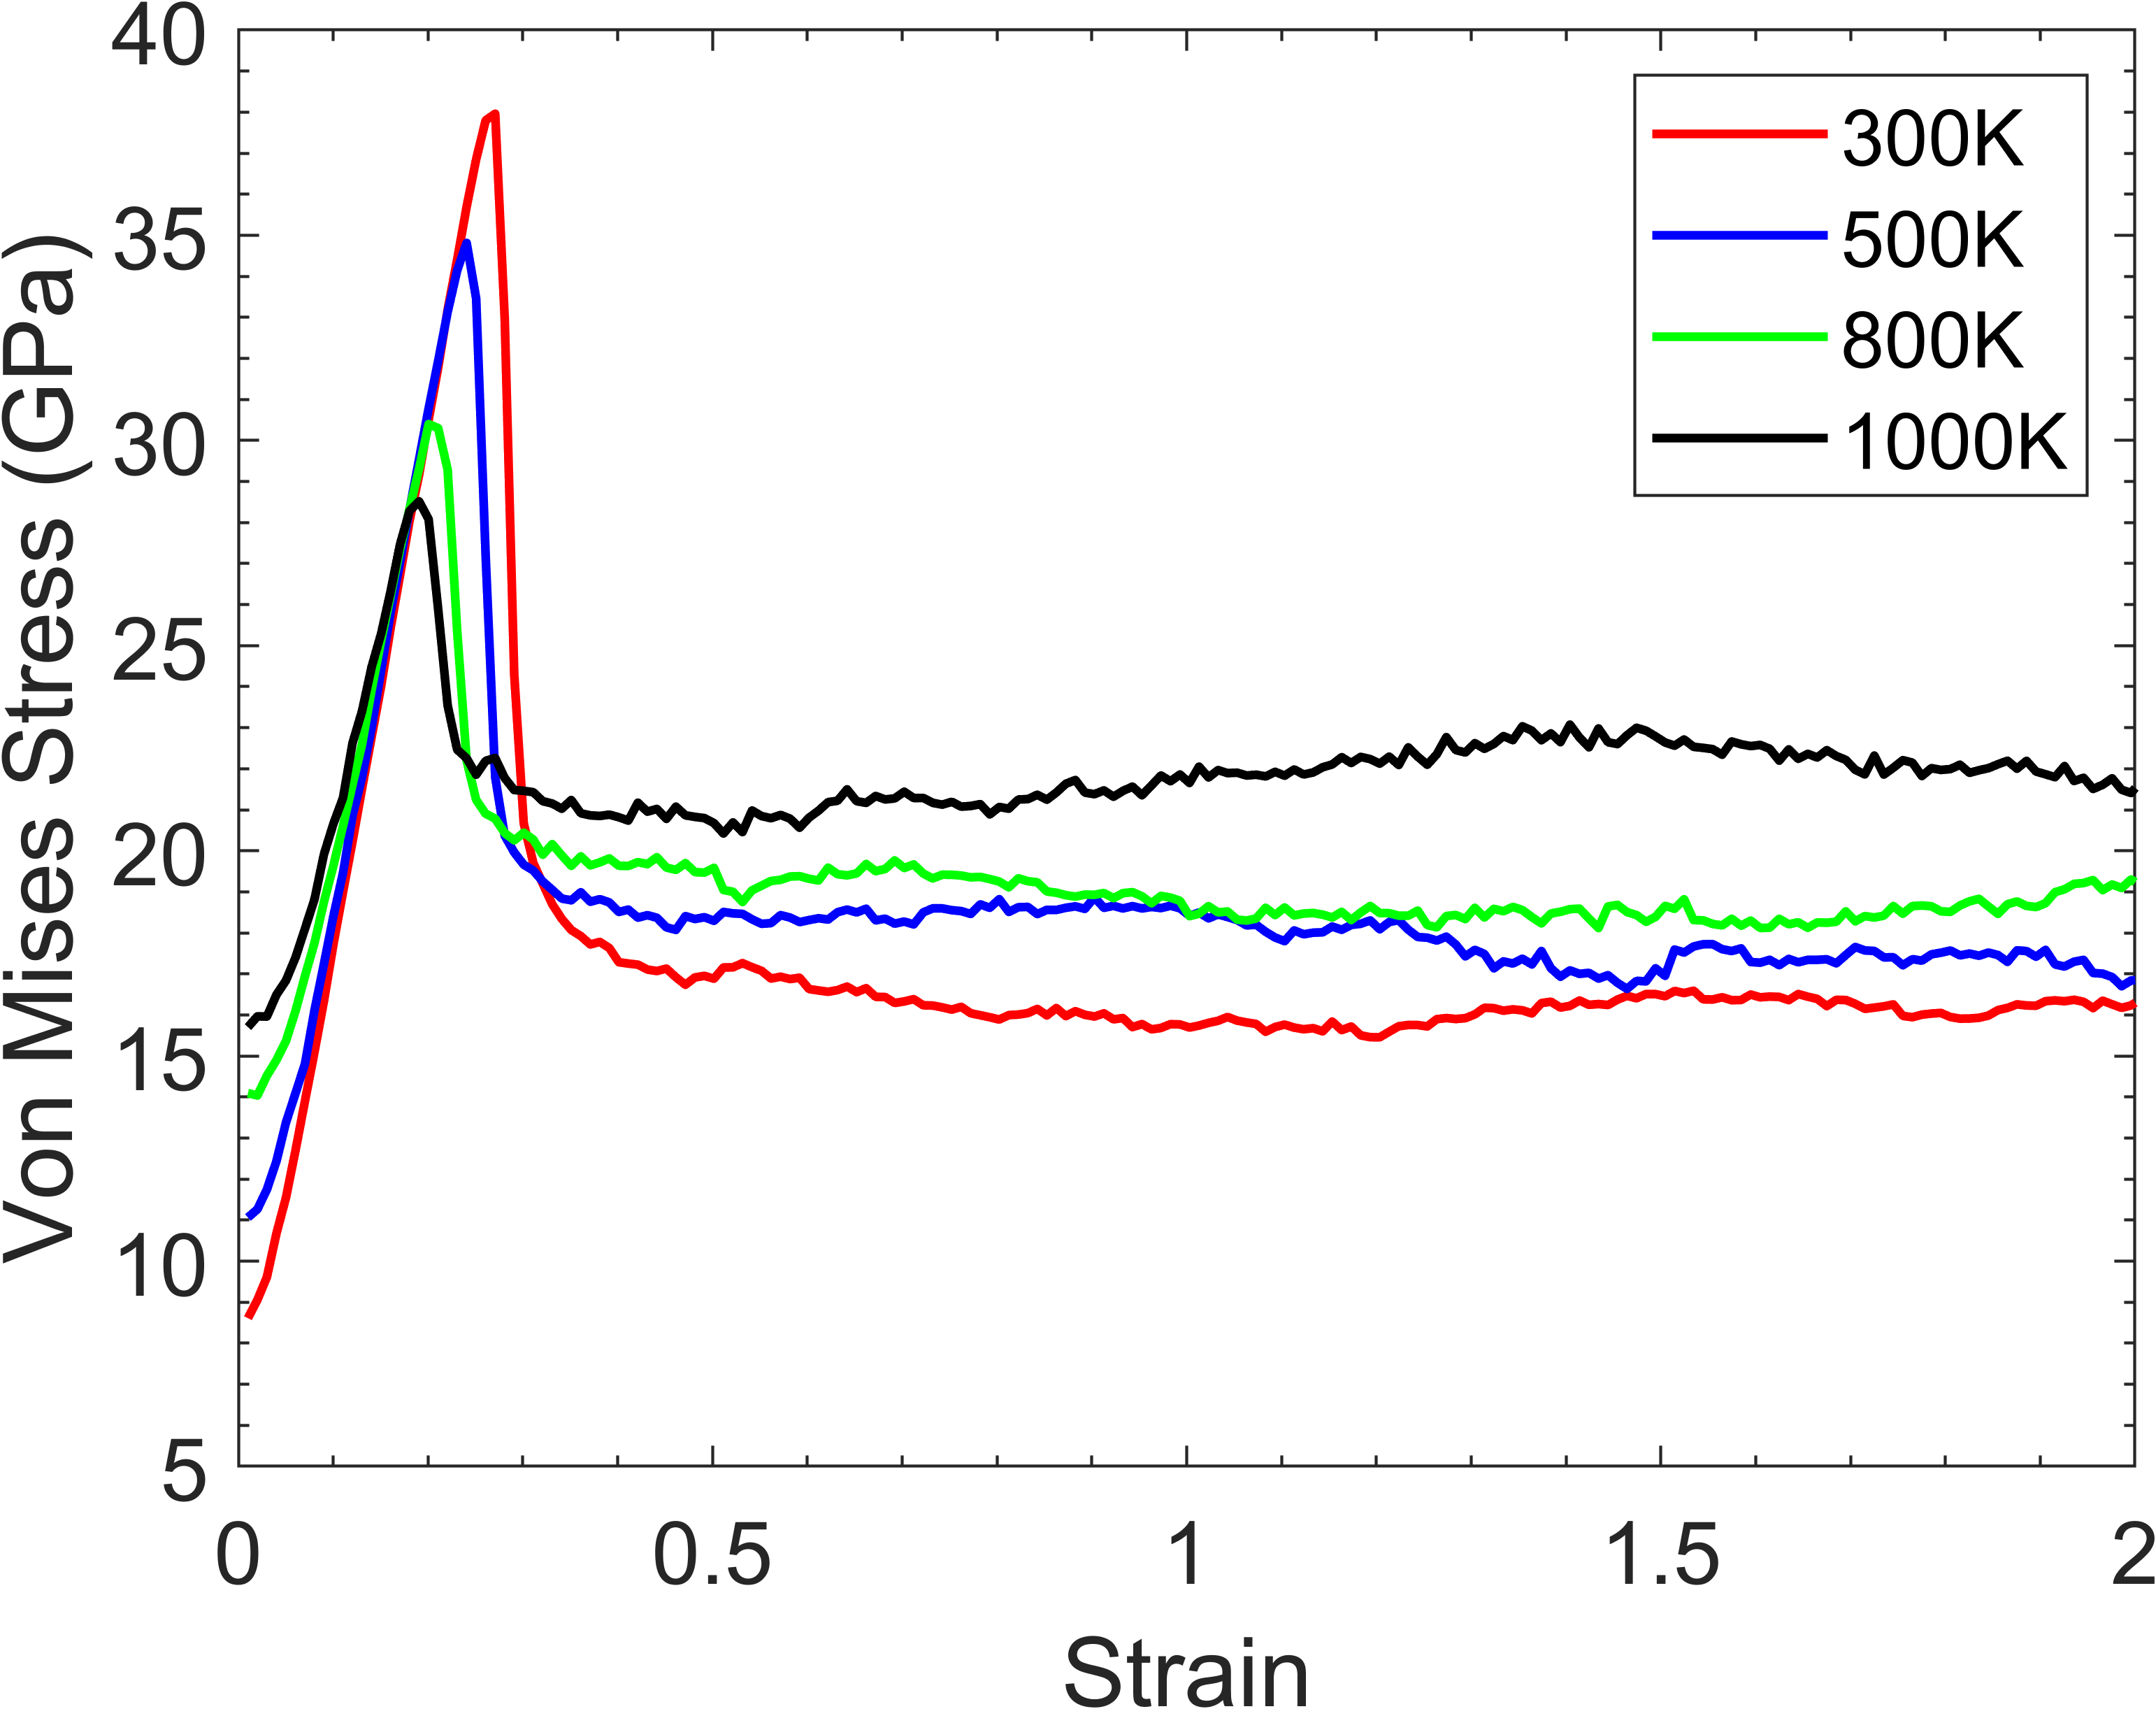
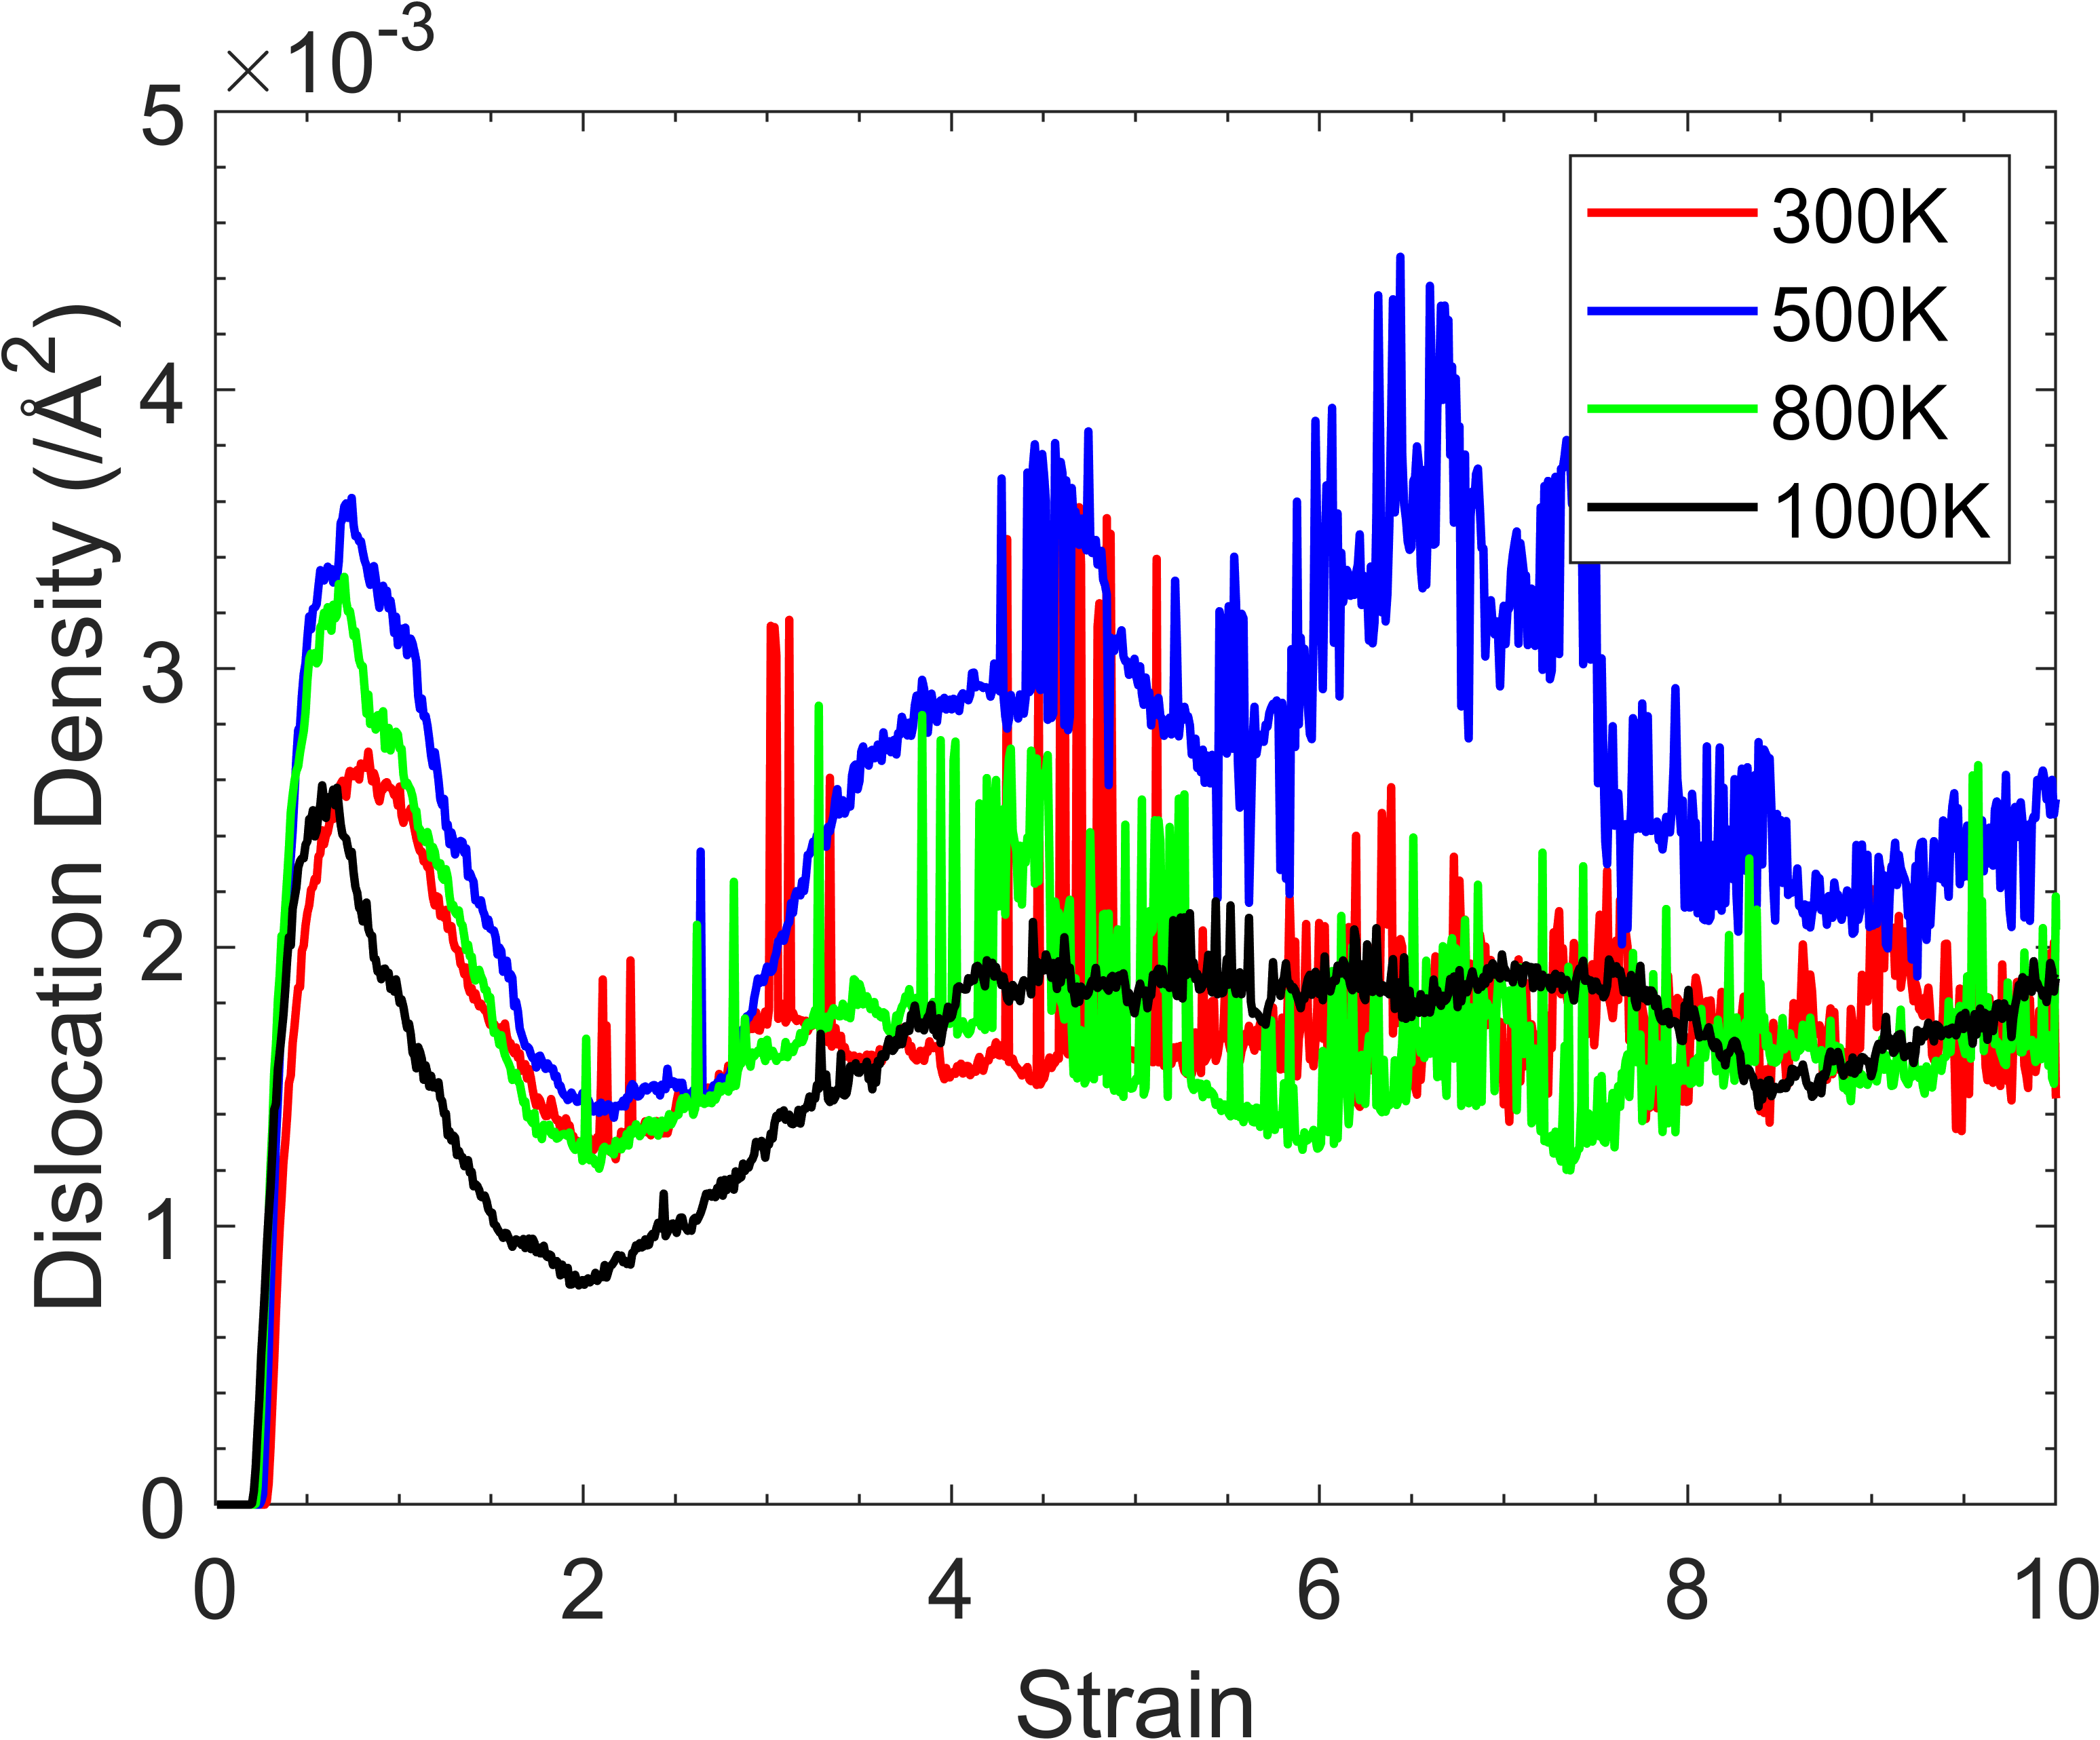
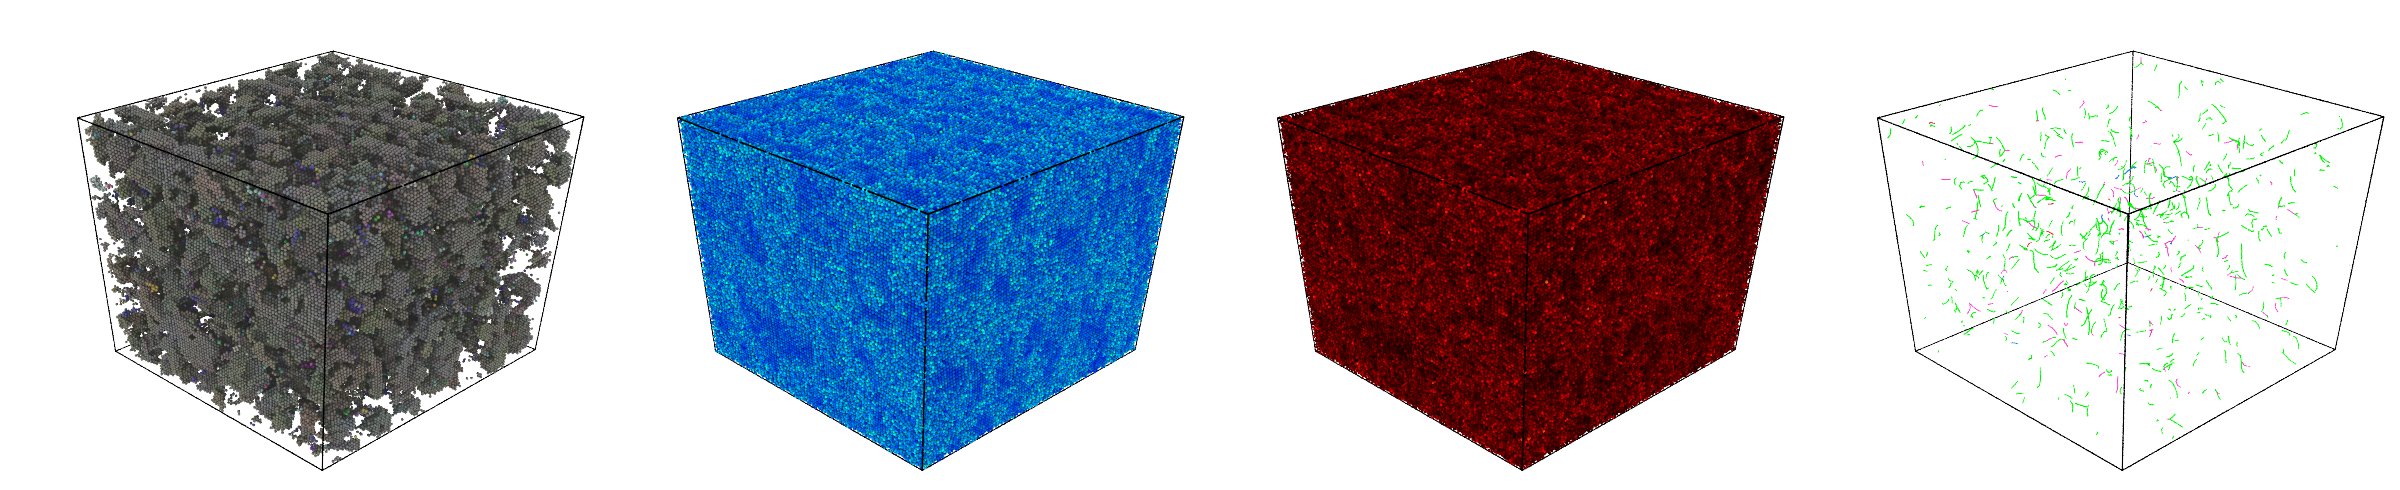
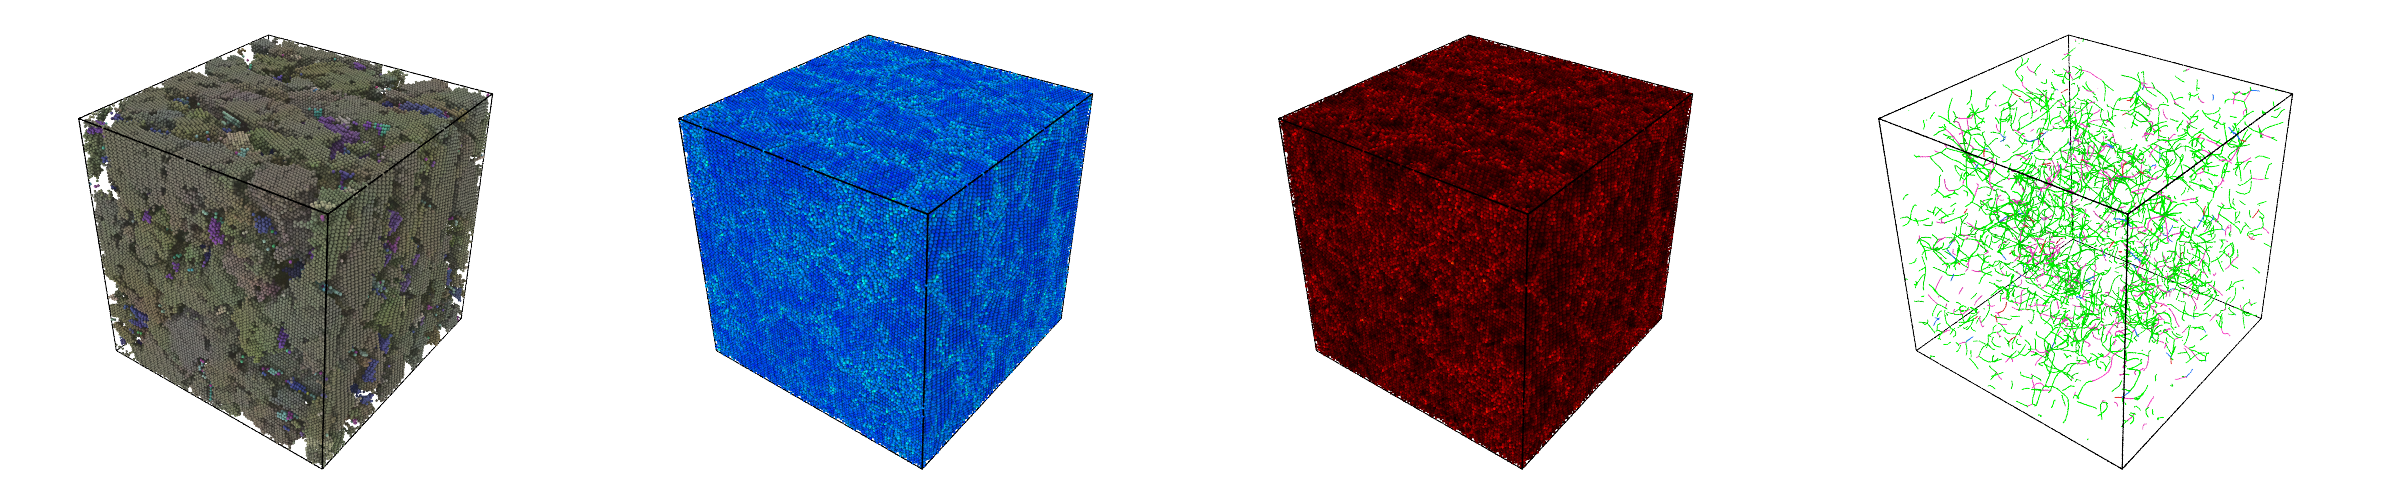
Figure 3 shows the atomic crystal orientation, total energy, von Mises stress, and dislocation lines at different shear strain values. The total energy is the sum of atomic potential and kinetic energy. The figure keys for the total energy and von Mises stress are shown in Figure 3(a). In the DXA analysis, green lines represent dislocations with Burgers vector , and pink lines represent . Figure 3 shows that most dislocation lines have . Only few dislocations have . This agrees with the experimental findings in the literature on iron, iron-chromium alloys and ferritic/martensitic steels [67, 68, 69].
Next, we consider the total energy and von Mises stress, shown in Figure 3. Initially, the atoms within the box have low energy and low stress. As the atoms become disordered, they experience a high energy and stress state, as shown by the colouring in Fig. 3(c). As recrystallisation occurs, it is evident that some atoms return to the low energy and stress state, whilst others remain in the high energy and stress state (Fig. 3(d)). As shear strain is continually applied, we can observe areas of both high and low energy and stress. The areas of low energy and low stress correspond to atoms within the grains and are BCC in nature, whilst the areas of high energy and high stress correspond to atoms which are not BCC in nature, and are not shown in the crystal orientation images. As such, Figure 3 shows that the atoms between the grains have high energy and high stress, which confirms the presence of grain boundaries in the simulation box [60].
III.2 Temperature
To further probe the underlying mechanisms for nanocrystal formation from an initially perfect crystal under high-shear strain, certain simulation variables were altered one-by-one. We first changed the thermostat temperature, whilst keeping all other conditions unchanged. Three additional simulations were carried out with thermostat temperatures T = 500 K, 800 K, and 1000 K. Figure 5 shows the kinetic energy, the potential energy, the temperature, the number of grains, the dislocation density, and the von Mises stress of different simulations.
Figure 5(a) and 5(b) show the change in kinetic energy. They are well correlated with the system temperature in Figure 5(e) because of the linear dependence between temperature and kinetic energy. We observe a notable difference in the increase in kinetic energy associated with the formation of the disordered phase at different thermostat temperatures. For example, the kinetic energy increases from around 0.039 eV/atom to 0.072 eV/atom for the 300 K simulation, an increase of 0.033 eV/atom, whilst the 800 K simulation experiences a spike from 0.1 eV/atom to around 0.117 eV/atom, an increase of 0.017 eV/atom, much less than the increment at 300 K. We can also observe from Figure 5(b) that the initial increase in kinetic energy occurs earlier for the higher temperature simulations, occurring at 0.27 strain for the 300 K, 0.25 strain for the 500 K, 0.2 strain for the 800 K, and 0.19 strain for the 1000 K simulations.
The increase in kinetic energy corresponds to a decrease in potential energy. Figure 5(c) and 5(d) show how the potential energy begins to decrease earlier for the higher temperature simulations. Interestingly, the thermostat temperature does not appear to significantly alter the maximum potential energy. Whilst the 300 K simulation increases to a maximum of -3.73 eV/atom, the higher temperature 500 K and 800 K simulations increase to -3.74 eV/atom, and the 1000 K simulation increases to -3.72 eV/atom. The higher temperature simulations generally experience higher potential energy after the initial spike, with the 1000 K simulation hovering at around -3.82 eV/atom after , whilst the 300 K simulation plateaus at around -3.89 eV/atom.
Inspection of Figure 5(f) and 6(a) provides interesting insight into the effect of the thermostat temperature change. All simulations experience an initial spike in grain number, with the spike occurring at a lower strain for higher temperature simulations. The magnitude of the increase does not appear to correlate with thermostat temperature. For example, whilst the 300 K simulation increases to around 400 grains, the 1000 K simulation only increases to around 195 grains, which is less than the 500 K simulation, but more than the 800 K simulation.
All simulations show a rapid decrease in grain number between 0.19 and 0.25 strain, followed by an increase in grain number at 2 strain. The 300 K simulation notably has the most grains at the local maximum point of 2 strain. The other temperature simulations have fewer grains at this point, with the 500 K, 800 K, and 1000 K simulations having roughly the same number of grains up to . The grain number in the 500 K and 800 K simulations increases and saturates after . The 1000 K simulation experiences a reduction in grain number after , and is as low as 11 grains at .
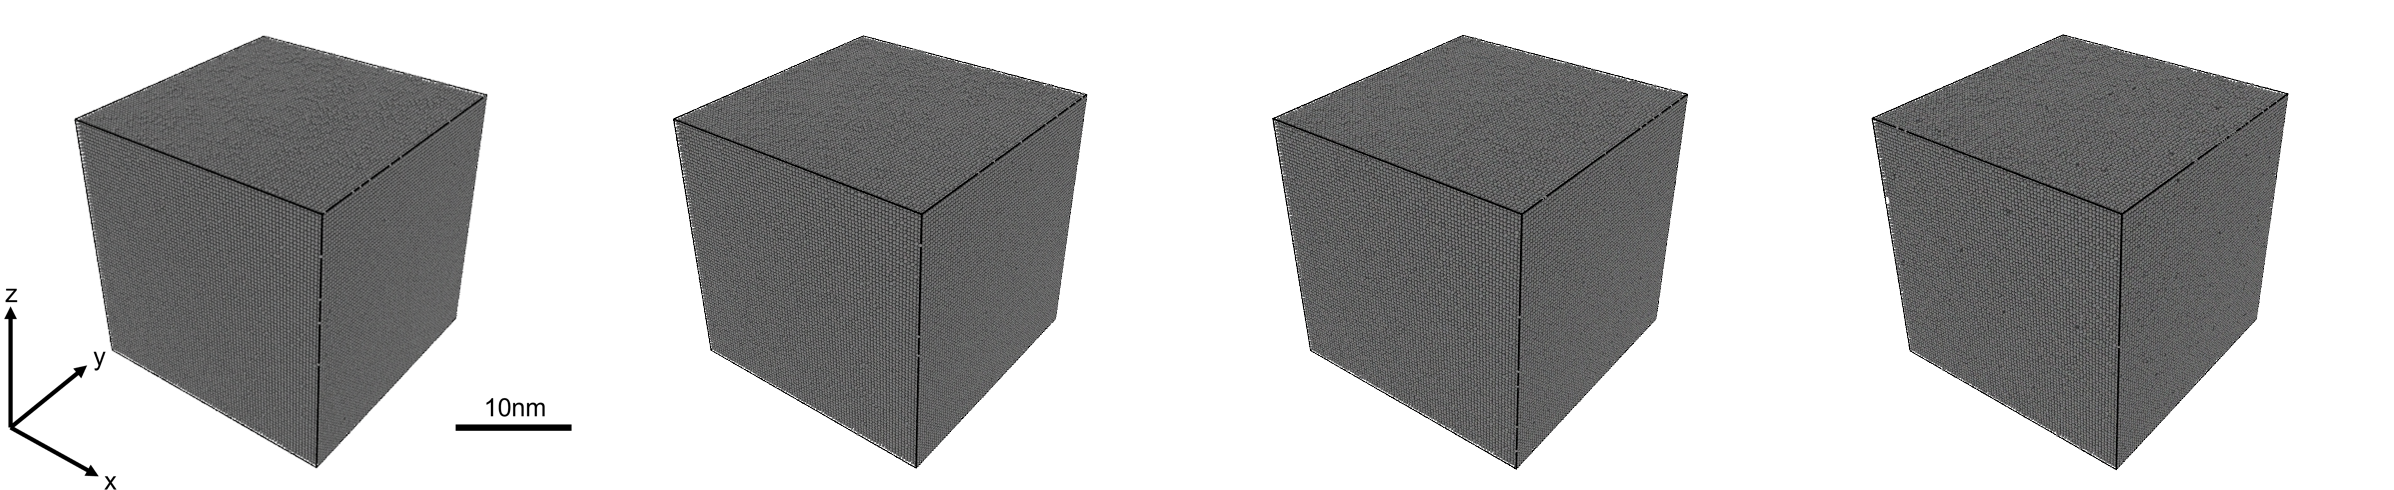
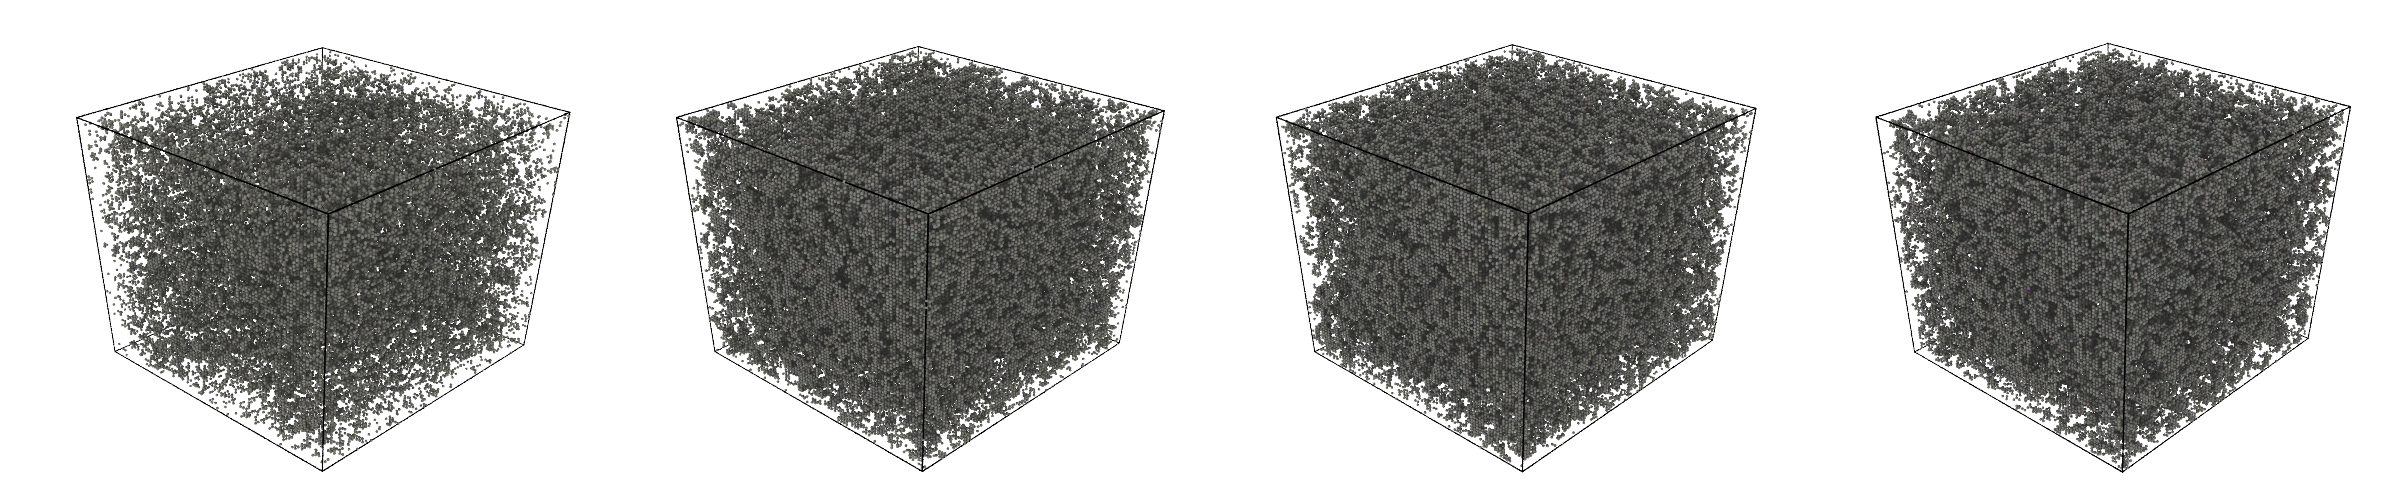
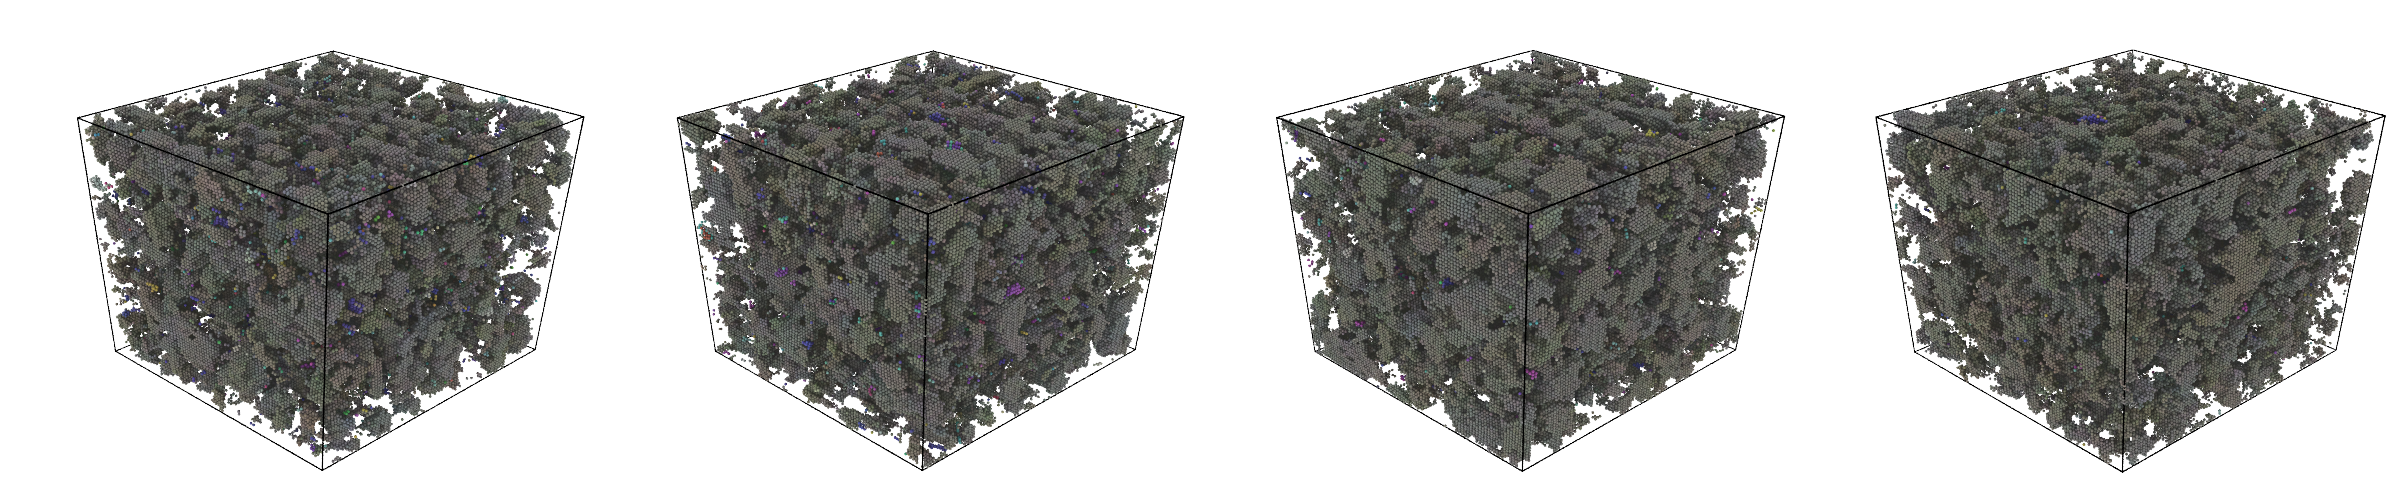
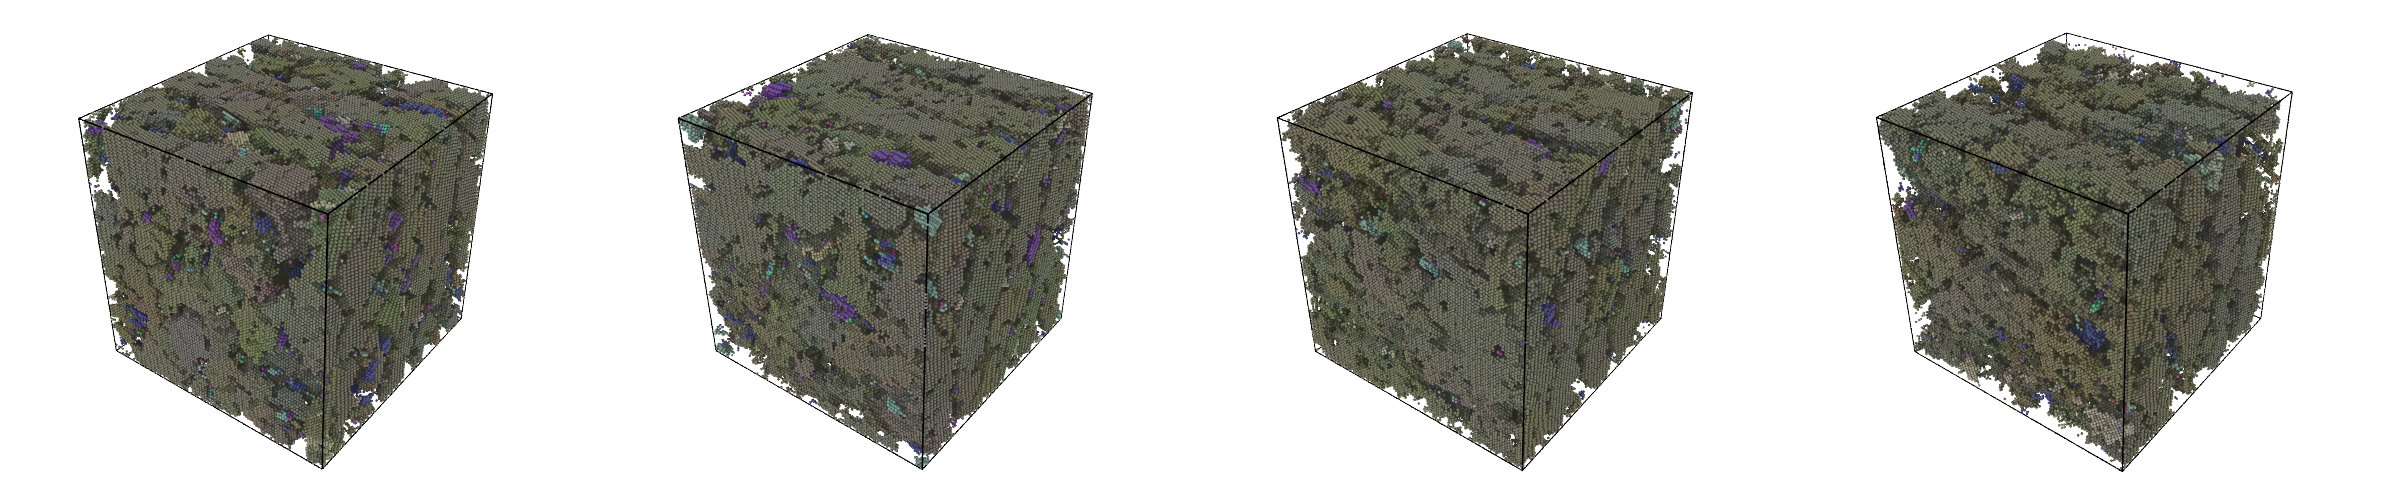
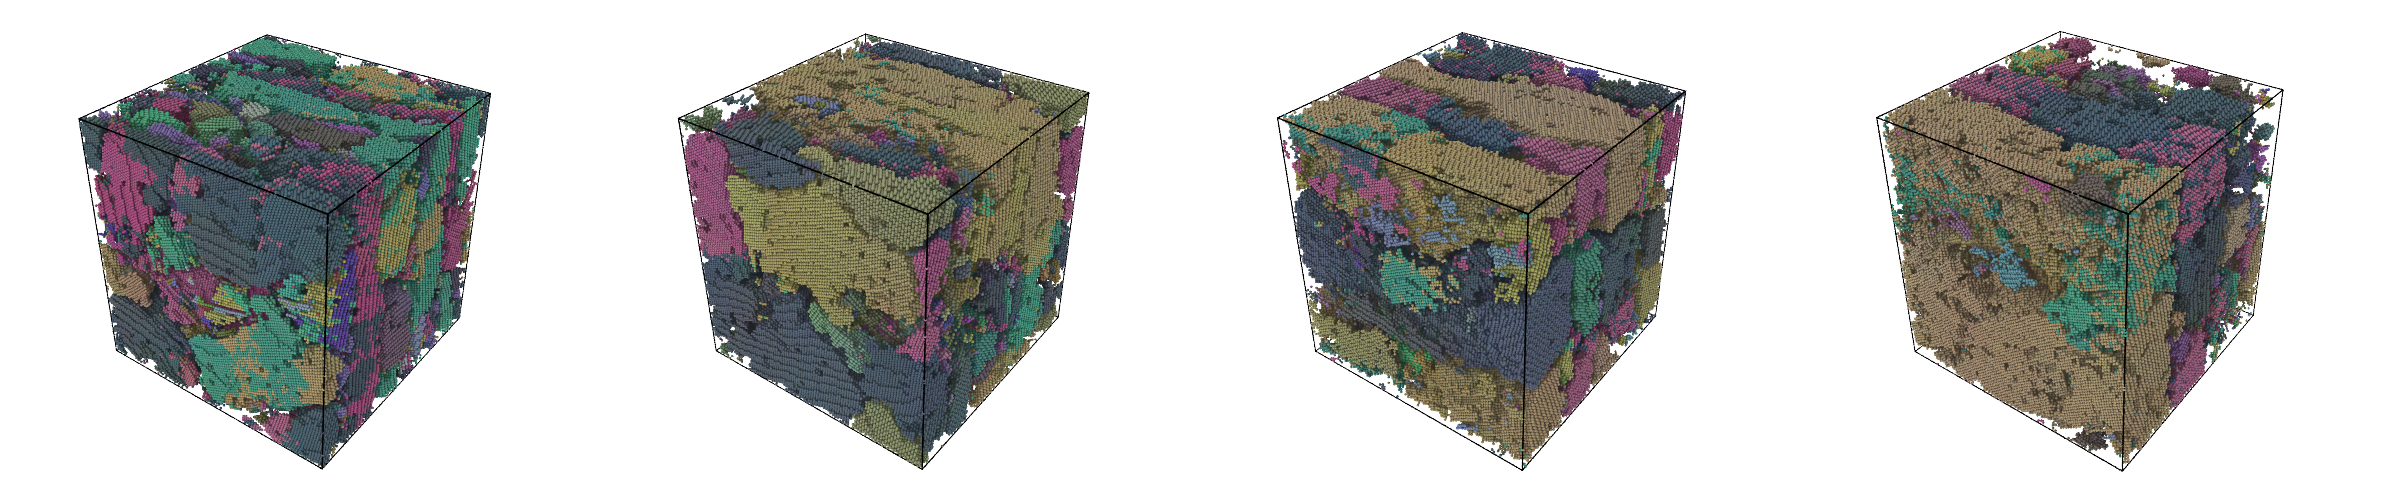
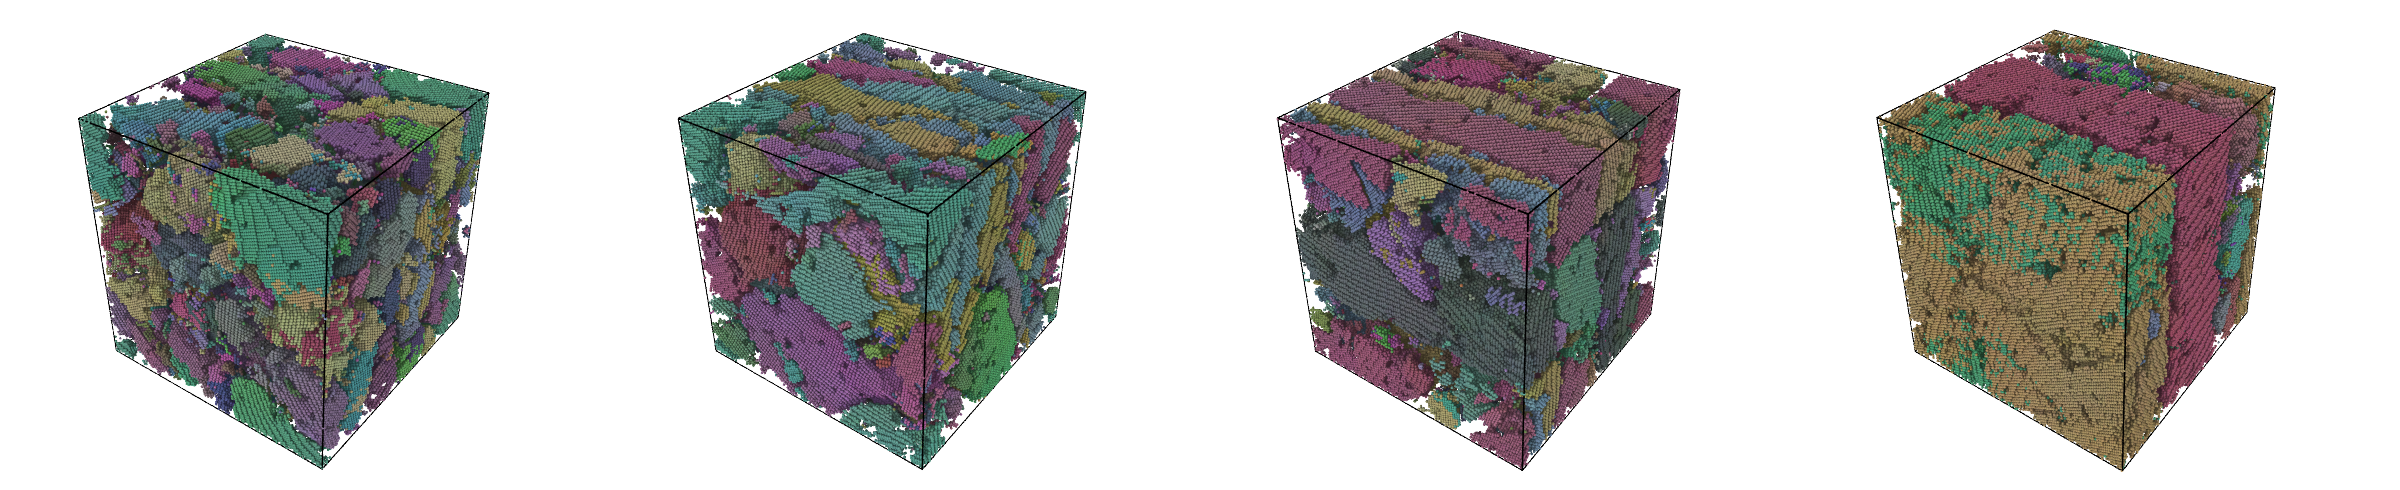

Figure 6(b) shows the von Mises stress. The stress directly correlates with the potential energy. This is evident in the figure as the decrease in stress after the initial increase occurs at exactly the same strain value as the potential energy decrease (see Figure 5(c) and 5(d)). Nevertheless, whilst the potential energy maximum is roughly the same value for all simulations, the von Mises stress shows an unequal increase. As made evident by Figure 6(b), the higher temperature simulations show a lower maximum von Mises stress and, as the simulation temperature decreases, the maximum von Mises stress increases. The subsequent decrease in von Mises stress is also larger in magnitude for the lower temperature simulations, and the value at which the stress plateaus with shearing is lower for the lower temperature simulations.
We observe in Figure 6(c) that the dislocation densities for the higher temperature simulations also follow the same pattern as the benchmark simulation. For each simulation, there is a marked increase in dislocation density between 0.19 and 0.25 strain, which corresponds to the point when kinetic energy begins to increase, and the potential energy decreases. This is followed by a maximum point in dislocation density, occurring at 0.82 strain for the 300 K simulation, 0.74 strain for the 500 K simulation, 0.7 strain for the 800 K simulation, and 0.6 strain for the 1000 K simulation. We note that the maximum value of dislocation density does not correlate with temperature. Both the 500 K and 800 K simulations have larger dislocation densities, whilst the 300 K and 1000 K simulations have lower maximum densities. As with the benchmark simulation, the dislocation densities decrease up to , after which there is another increase and saturation in dislocation density for all simulations.
In Figure 5(d), there appears to be a nearly universal maximum potential energy, around -3.73 eV/atom, for every simulation. We hypothesise that this value corresponds to the maximum potential energy the material can sustain before atoms are permanently displaced from their lattice positions, and it is the value attained before the initiation of the disordered atomic state. After this point, the potential energy decreases while the kinetic energy increases. The higher temperature simulations exhibit higher potential energy at 0 strain due to the principle of equipartition of energy. At higher temperatures, a system under strain should reach the point of instability, in terms of potential energy, sooner. This, in turn, causes the kinetic energy to increase at a lower strain value, meaning that the higher temperature simulations experience the initiation of the disordered state at a lower strain. This observation could explain the discrepancy in the von Mises stress peak between the simulations at different temperatures. As the temperature increases, the stress applied to reach a certain potential energy is reduced because the potential energy is already at a higher level. Similarly, this also explains why the spike in grain number occurs earlier for the higher temperature simulations.
Interestingly, upon analyzing Figure 5(f) and 6(c), we observe that the peak in grain number after recrystallization (at 2 strain) directly corresponds to a minimum value in dislocation density after the formation of the disordered phase. This finding aligns with previous MD simulations of nanocrystalline Cu [25]. The study found that at high dislocation density, a system is highly unstable when nanocrystalline grains are present. With applied strain, the dislocations were able to glide towards and annihilate at grain boundaries.
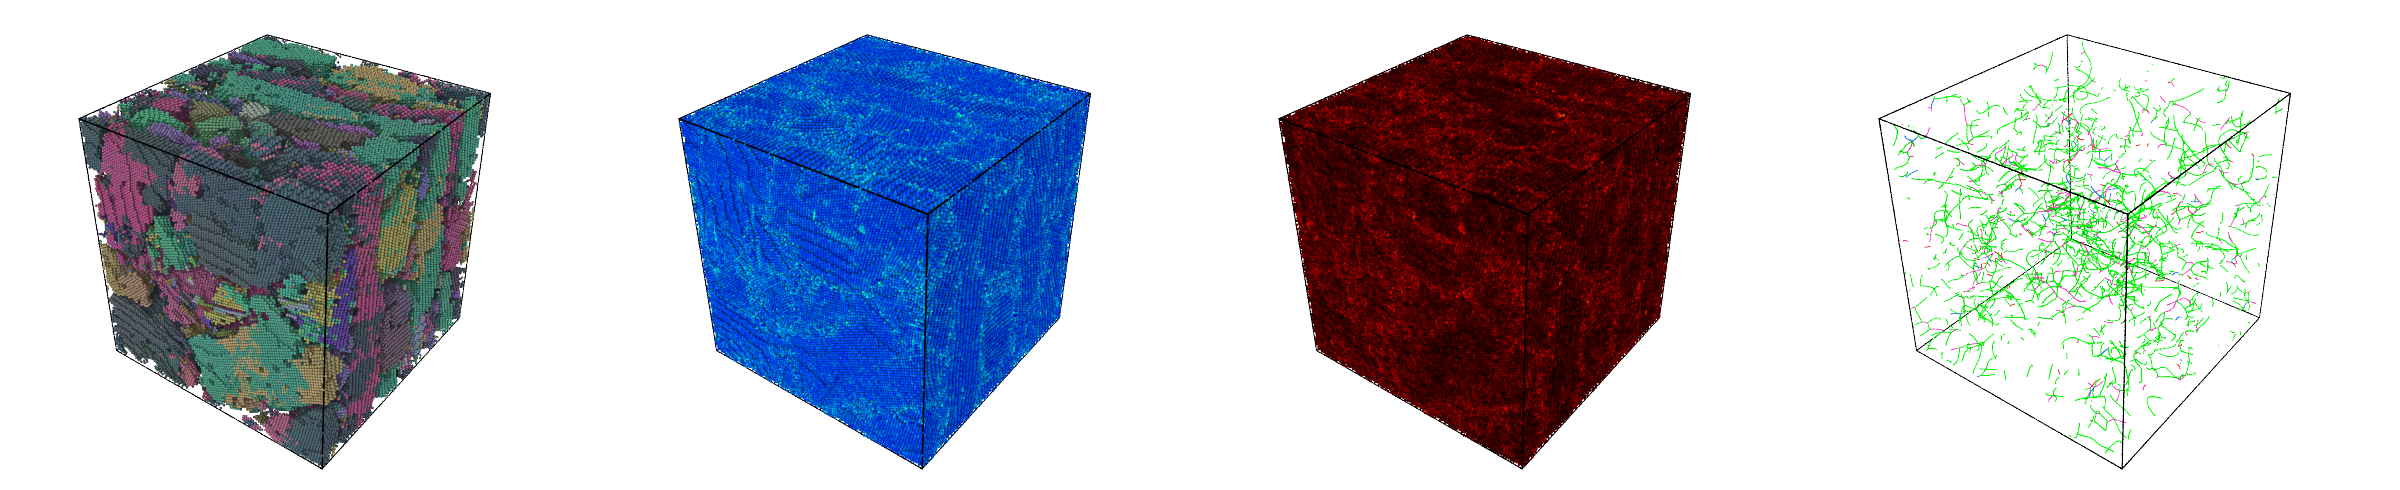
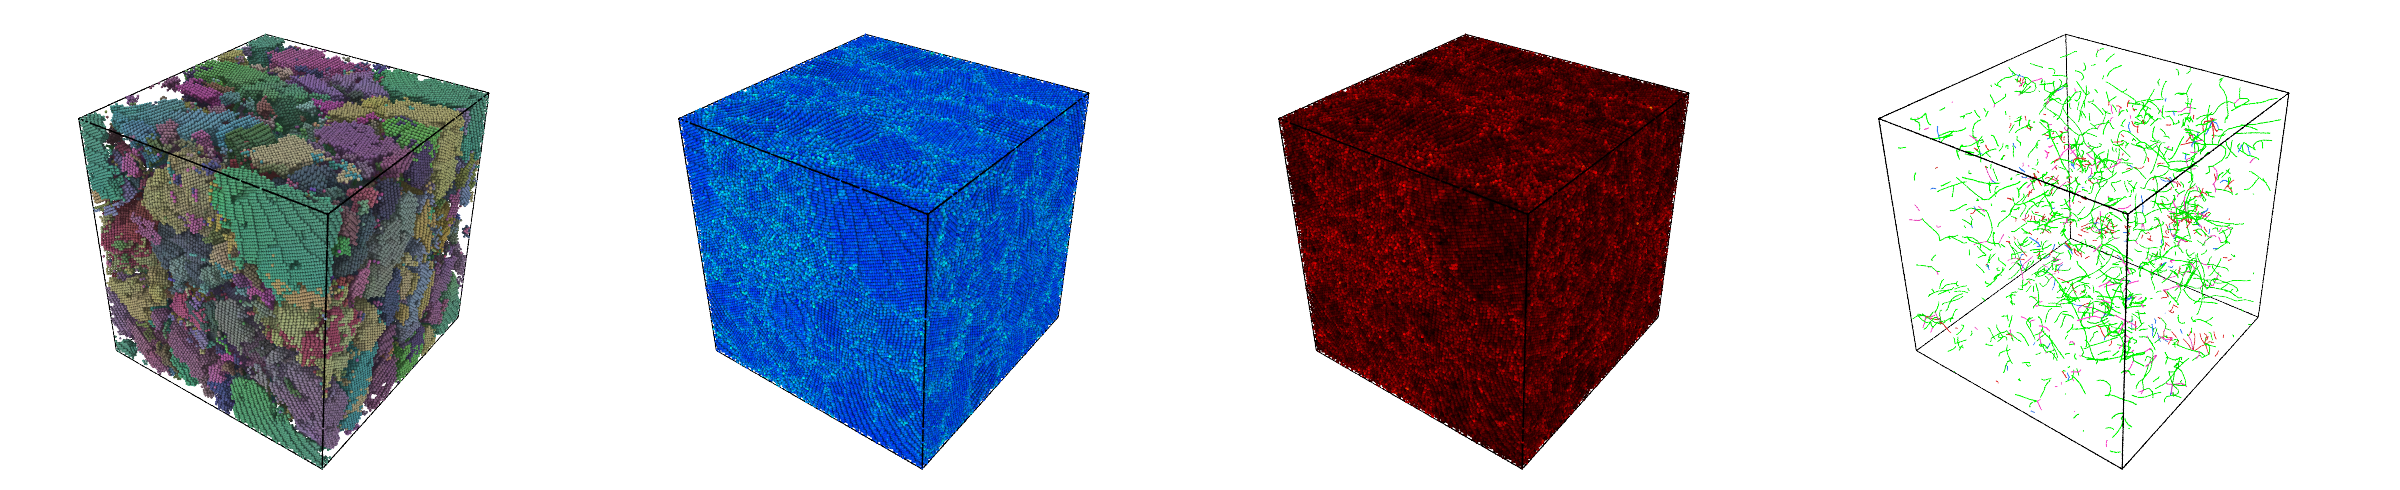
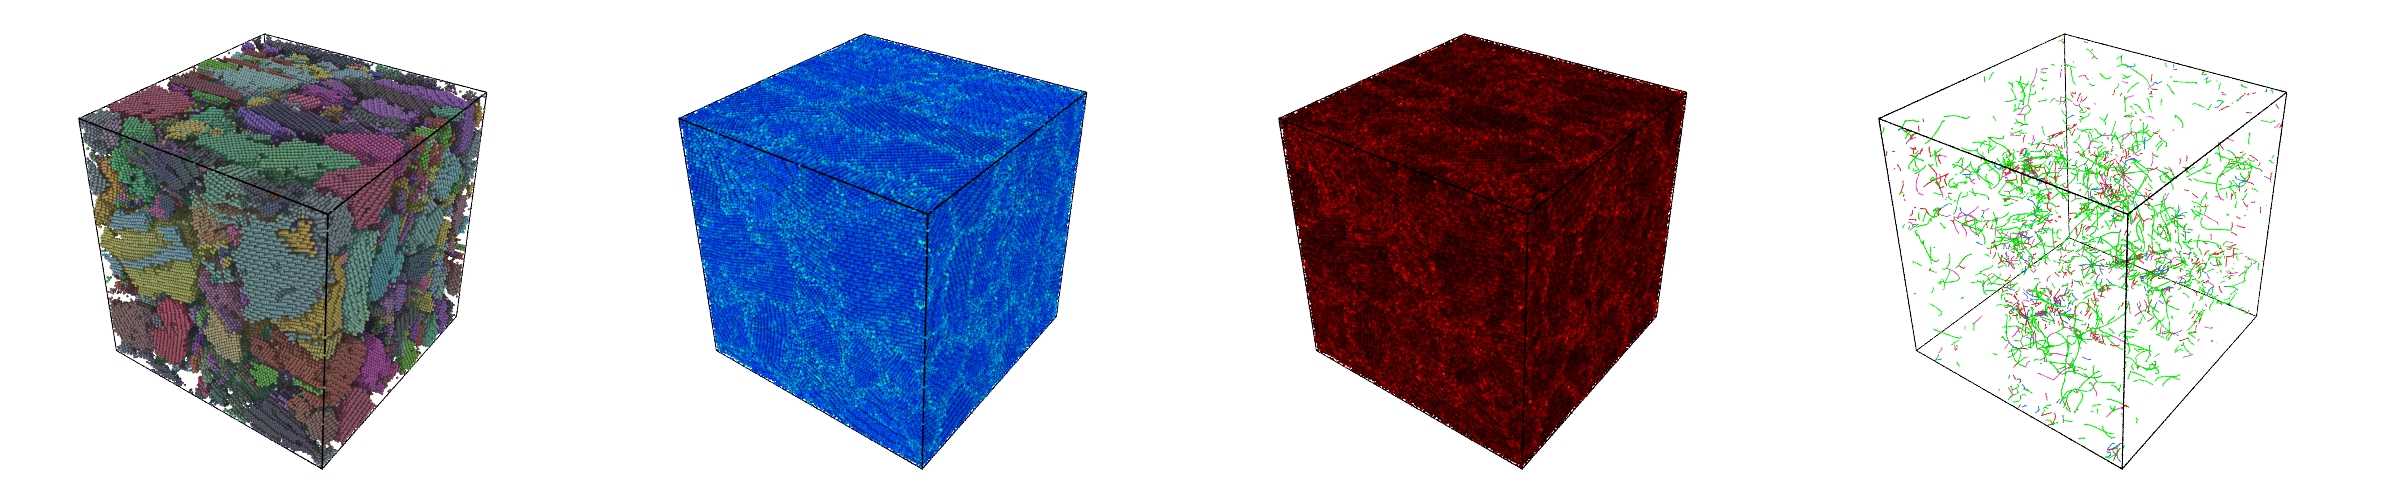
To further understand the effect of temperature on nanograin formation, we can consider Figure 7. This figure shows atoms coloured according to their local orientation, and only atoms in the BCC phase are visualized. The simulations, from left to right are at 300 K, 500 K, 800 K, and 1000 K, respectively. All simulations begin with a perfect box, thermalised to the desired temperature (Figure 7(a)). With applied shear strain, the cells all enter a highly disordered state (Figure 7(b)). The level of disorder appears to be larger for the lower temperature simulations. This is visible in that the number of BCC atoms is less for the 300 K simulation compared to, for example, the 1000 K simulation.
Each simulation experiences a subsequent recrystallization (Figure 7(c)), followed by a grain growth up to 1 strain (Figure 7(d)). At this point, through inspecting the colouring of atoms, the majority of atoms have similar crystal orientation to the initially perfect crystal lattice, meaning that the misorientation between grains is small. As the shearing continues, it is evident that grains develop different orientations, as shown in Figure 8(a) - 8(c). It is also evident that the grains are larger and longer for the higher temperature simulations compared to the lower temperature simulations. This is observed by comparing the 300 K and 1000 K simulations in Figure 8(c), where the grain number and size are very different. This is also consistent with the lower grain numbers for the higher temperature simulations compared to the 300 K benchmark, seen in Figure 5(f).
As -iron is a BCC metal, it has a very high stacking fault energy [70]. It is generally agreed that Dynamic Recovery (DRV) is the sole dynamic restoration mechanism in -iron and other ferritic metals [71, 70]. However, some studies have also shown that Dynamic Recrystallisation (DRX) occurs in BCC iron [72, 31]. Typically, DRV readily occurs in ferritic steels and iron at temperatures [73]. On the other hand, the data presented in Figure 6(c) suggests that this can also occur at room temperature, as this figure shows a marked annihilation of dislocations. The fundamental mechanisms of DRV are dislocation glide, climb, and cross-slip [70]. We speculate that the accumulation of dislocations also contributes to nanocrystal formation, as the dislocations accumulate and form LAGBs. In general, the dislocation density stays fairly constant after around for all simulations, whilst the grains continue to elongate, which is especially prominent for higher temperature simulations. This behaviour is expected for a metallic material under constant strain deformation [70, 74].
III.3 Heat dissipation
The heat dissipation from the lattice subsystem to the environment is represented by the Langevin thermostat. In metals, the dominant heat transfer mechanism is through electrons [75]. Therefore, we take the damping parameter , which governs the speed of heat dissipation, according to the phonon-electron coupling. The damping parameter has, so far, been kept at eV fs Å. To investigate the effect of the rate of heat dissipation on nanocrystal formation, a further simulation was carried out with a damping parameter of eV fs Å. All other conditions were kept the same. The Langevin thermostat was set to 300 K.
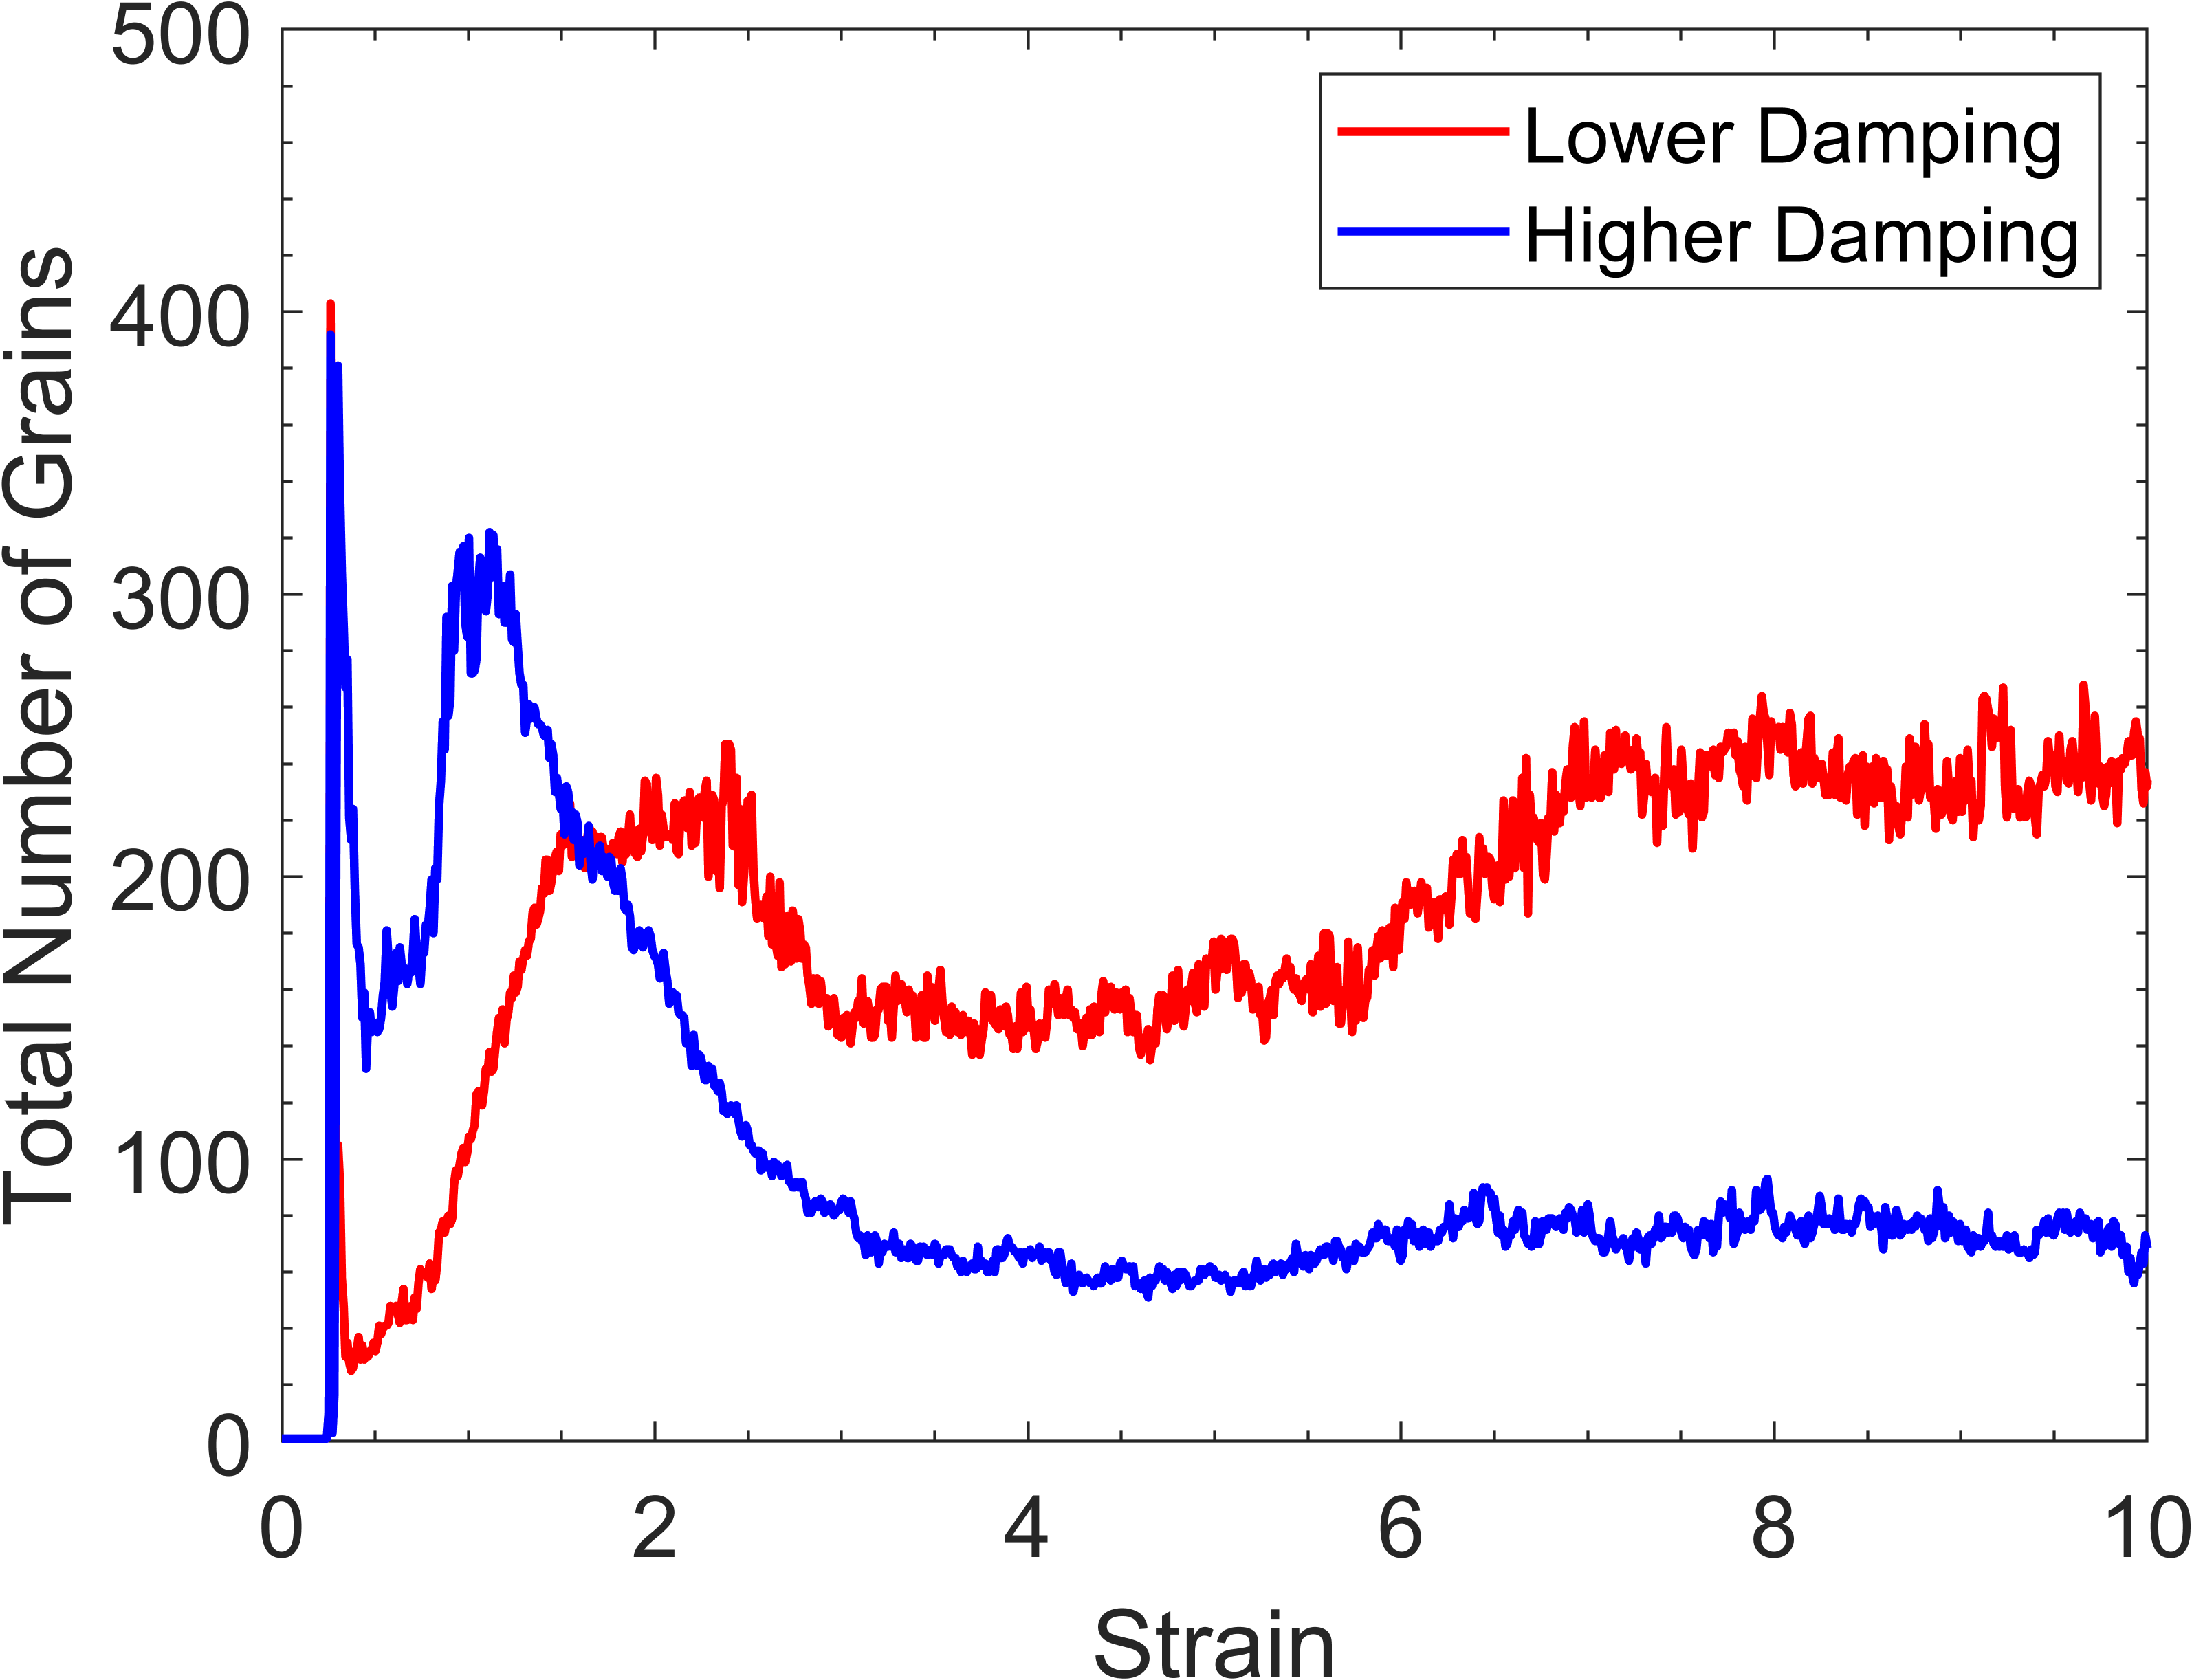
Figure 9 shows various quantities plotted as a function of shear strain when the two different damping parameters are used. We also compare the percentage of BCC structure found in the simulation cell as a function of strain. This will become important when considering Figure 10, which compares the evolution of the atomic orientations in simulations using different damping parameters.
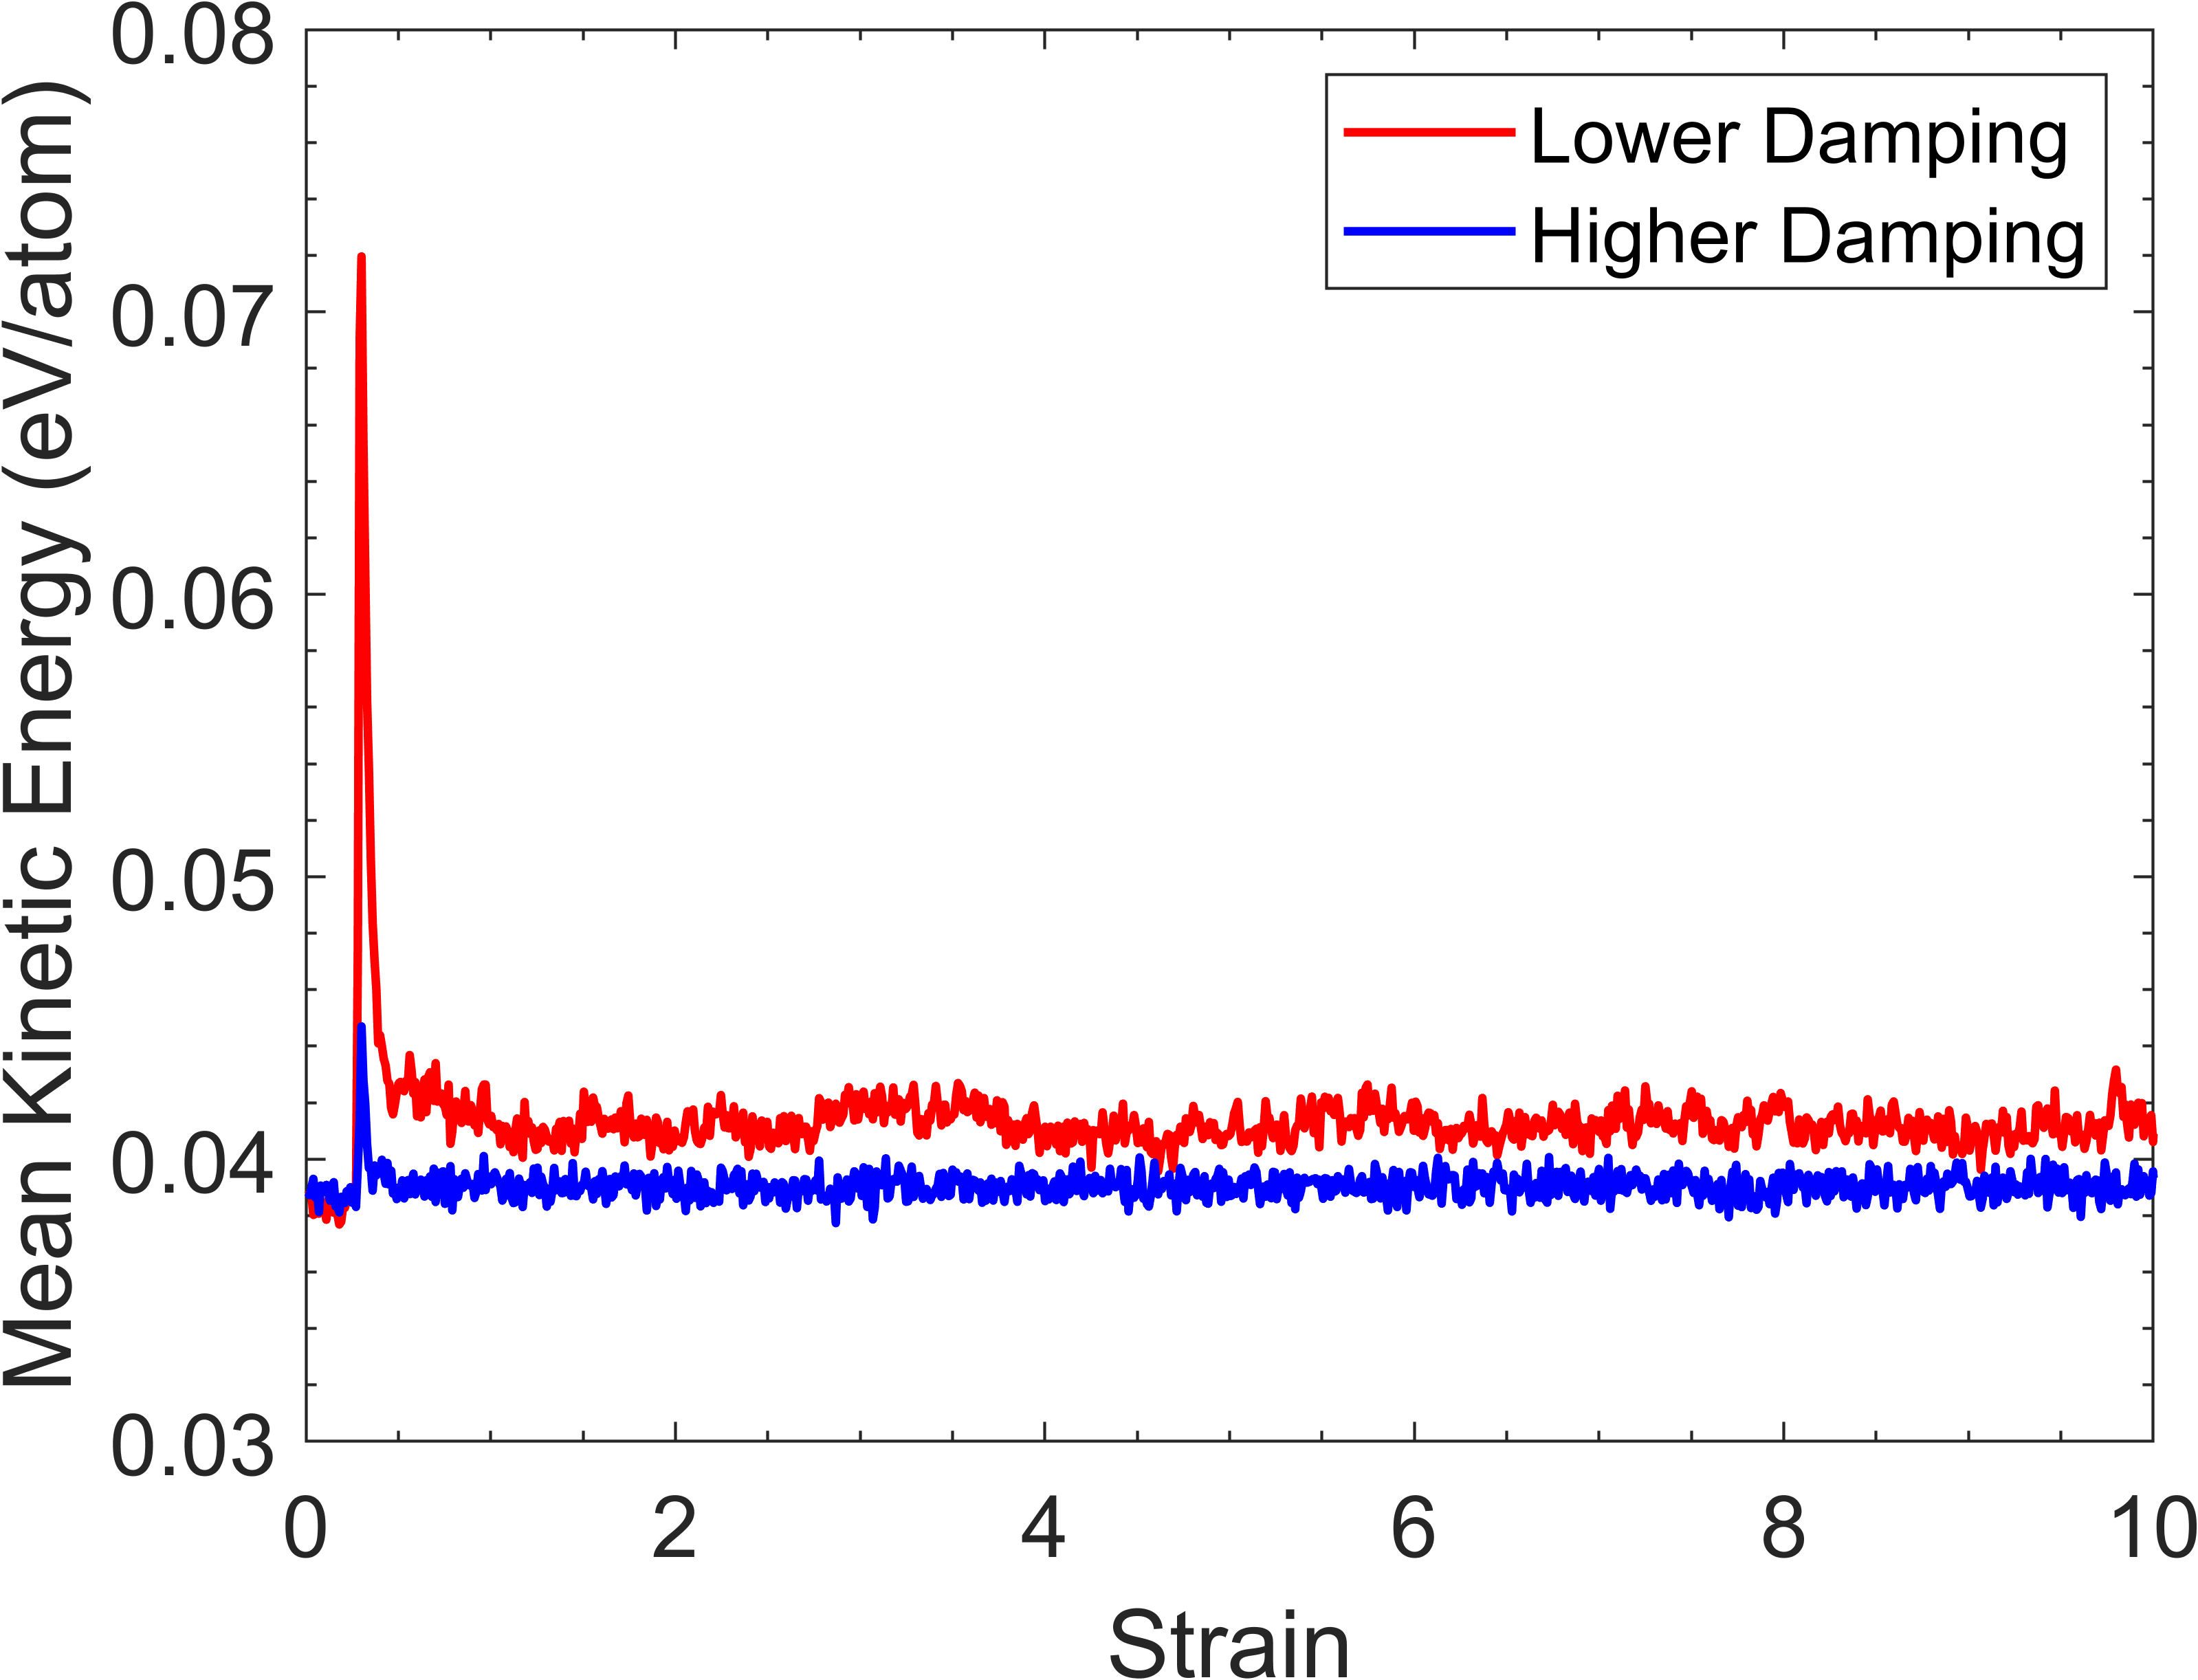
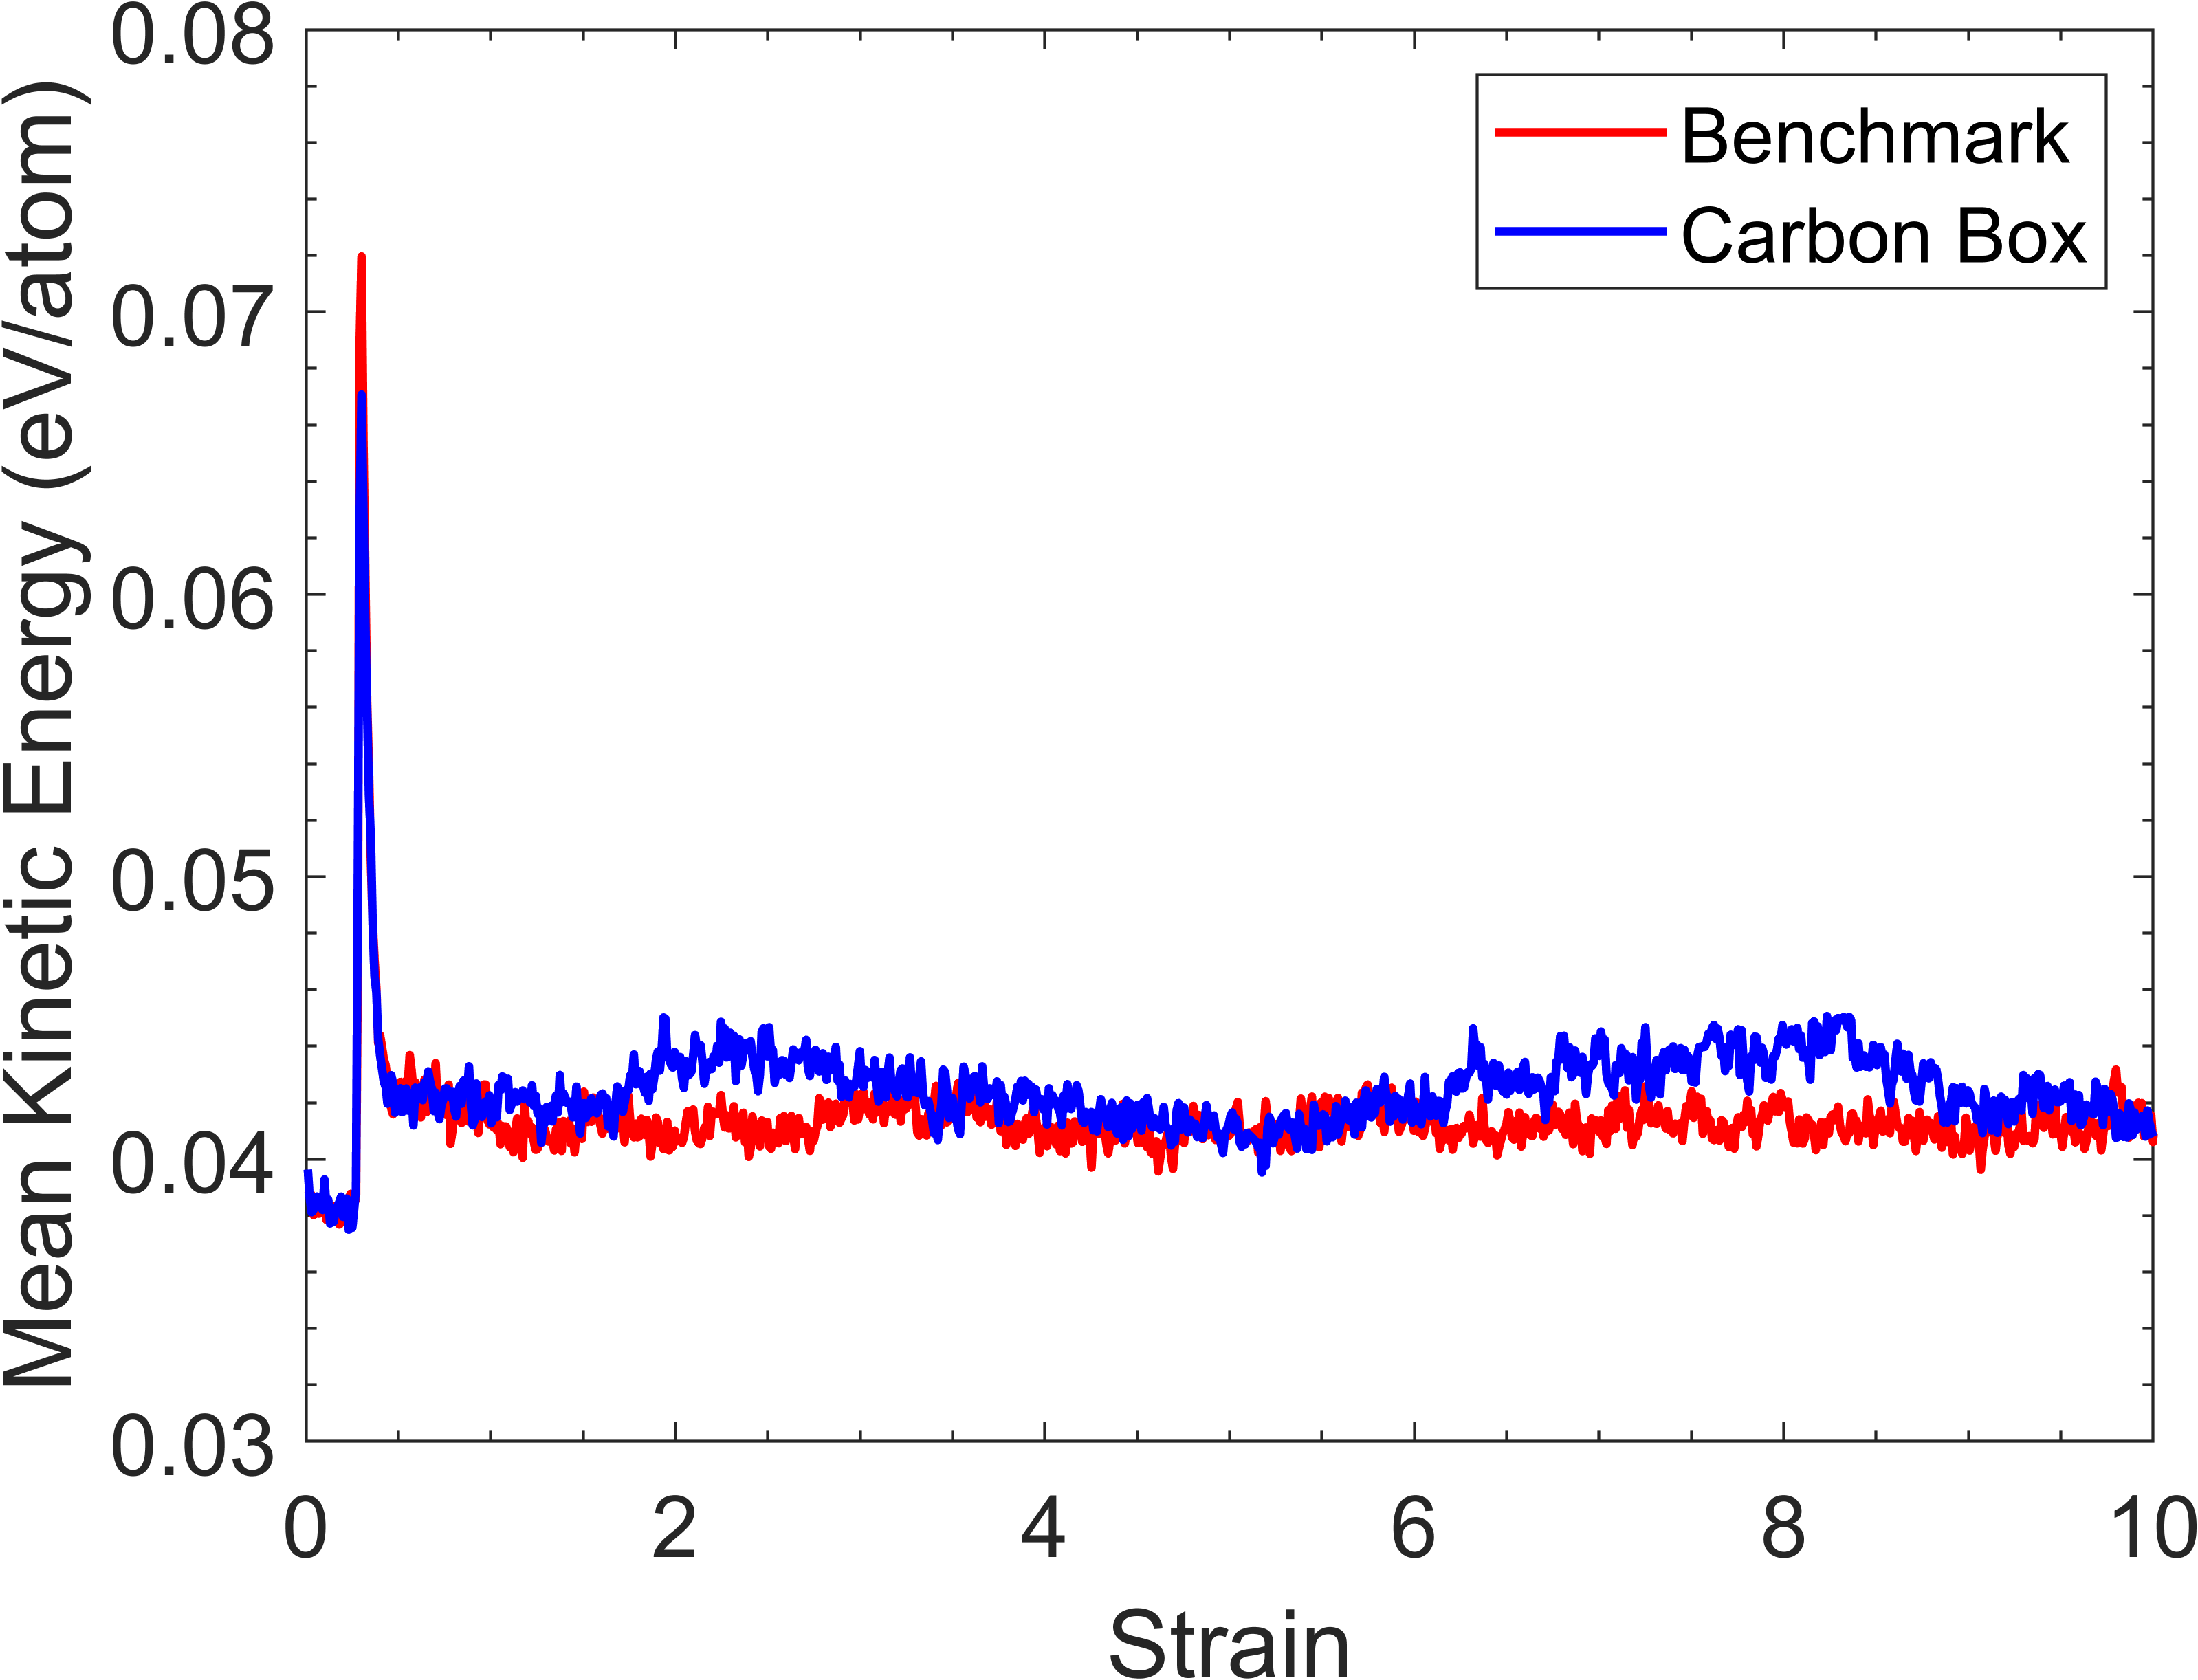
Figure 9(a) shows the change in kinetic energy between the lower (or benchmark) and higher damping simulations. The average kinetic energy in the lower damping simulation increases from around 0.038 eV/atom to 0.072 eV/atom, a difference of 0.034 eV/atom, before reducing to a dynamic quasi-steady state. Similarly, the higher damping simulation experiences an increase from 0.034 eV/atom to around 0.045 eV/atom, a difference of 0.011 eV/atom, before it drops. The increase in kinetic energy is much lower for the higher damping simulation because a higher damping parameter leads to a higher quenching rate. The kinetic energy is also noticeably lower for the higher damping simulation once both simulations have reached the dynamic quasi-steady state. The lower damping simulation plateaus at 0.042 eV/atom whilst the higher damping simulation sits at 0.039 eV/atom.
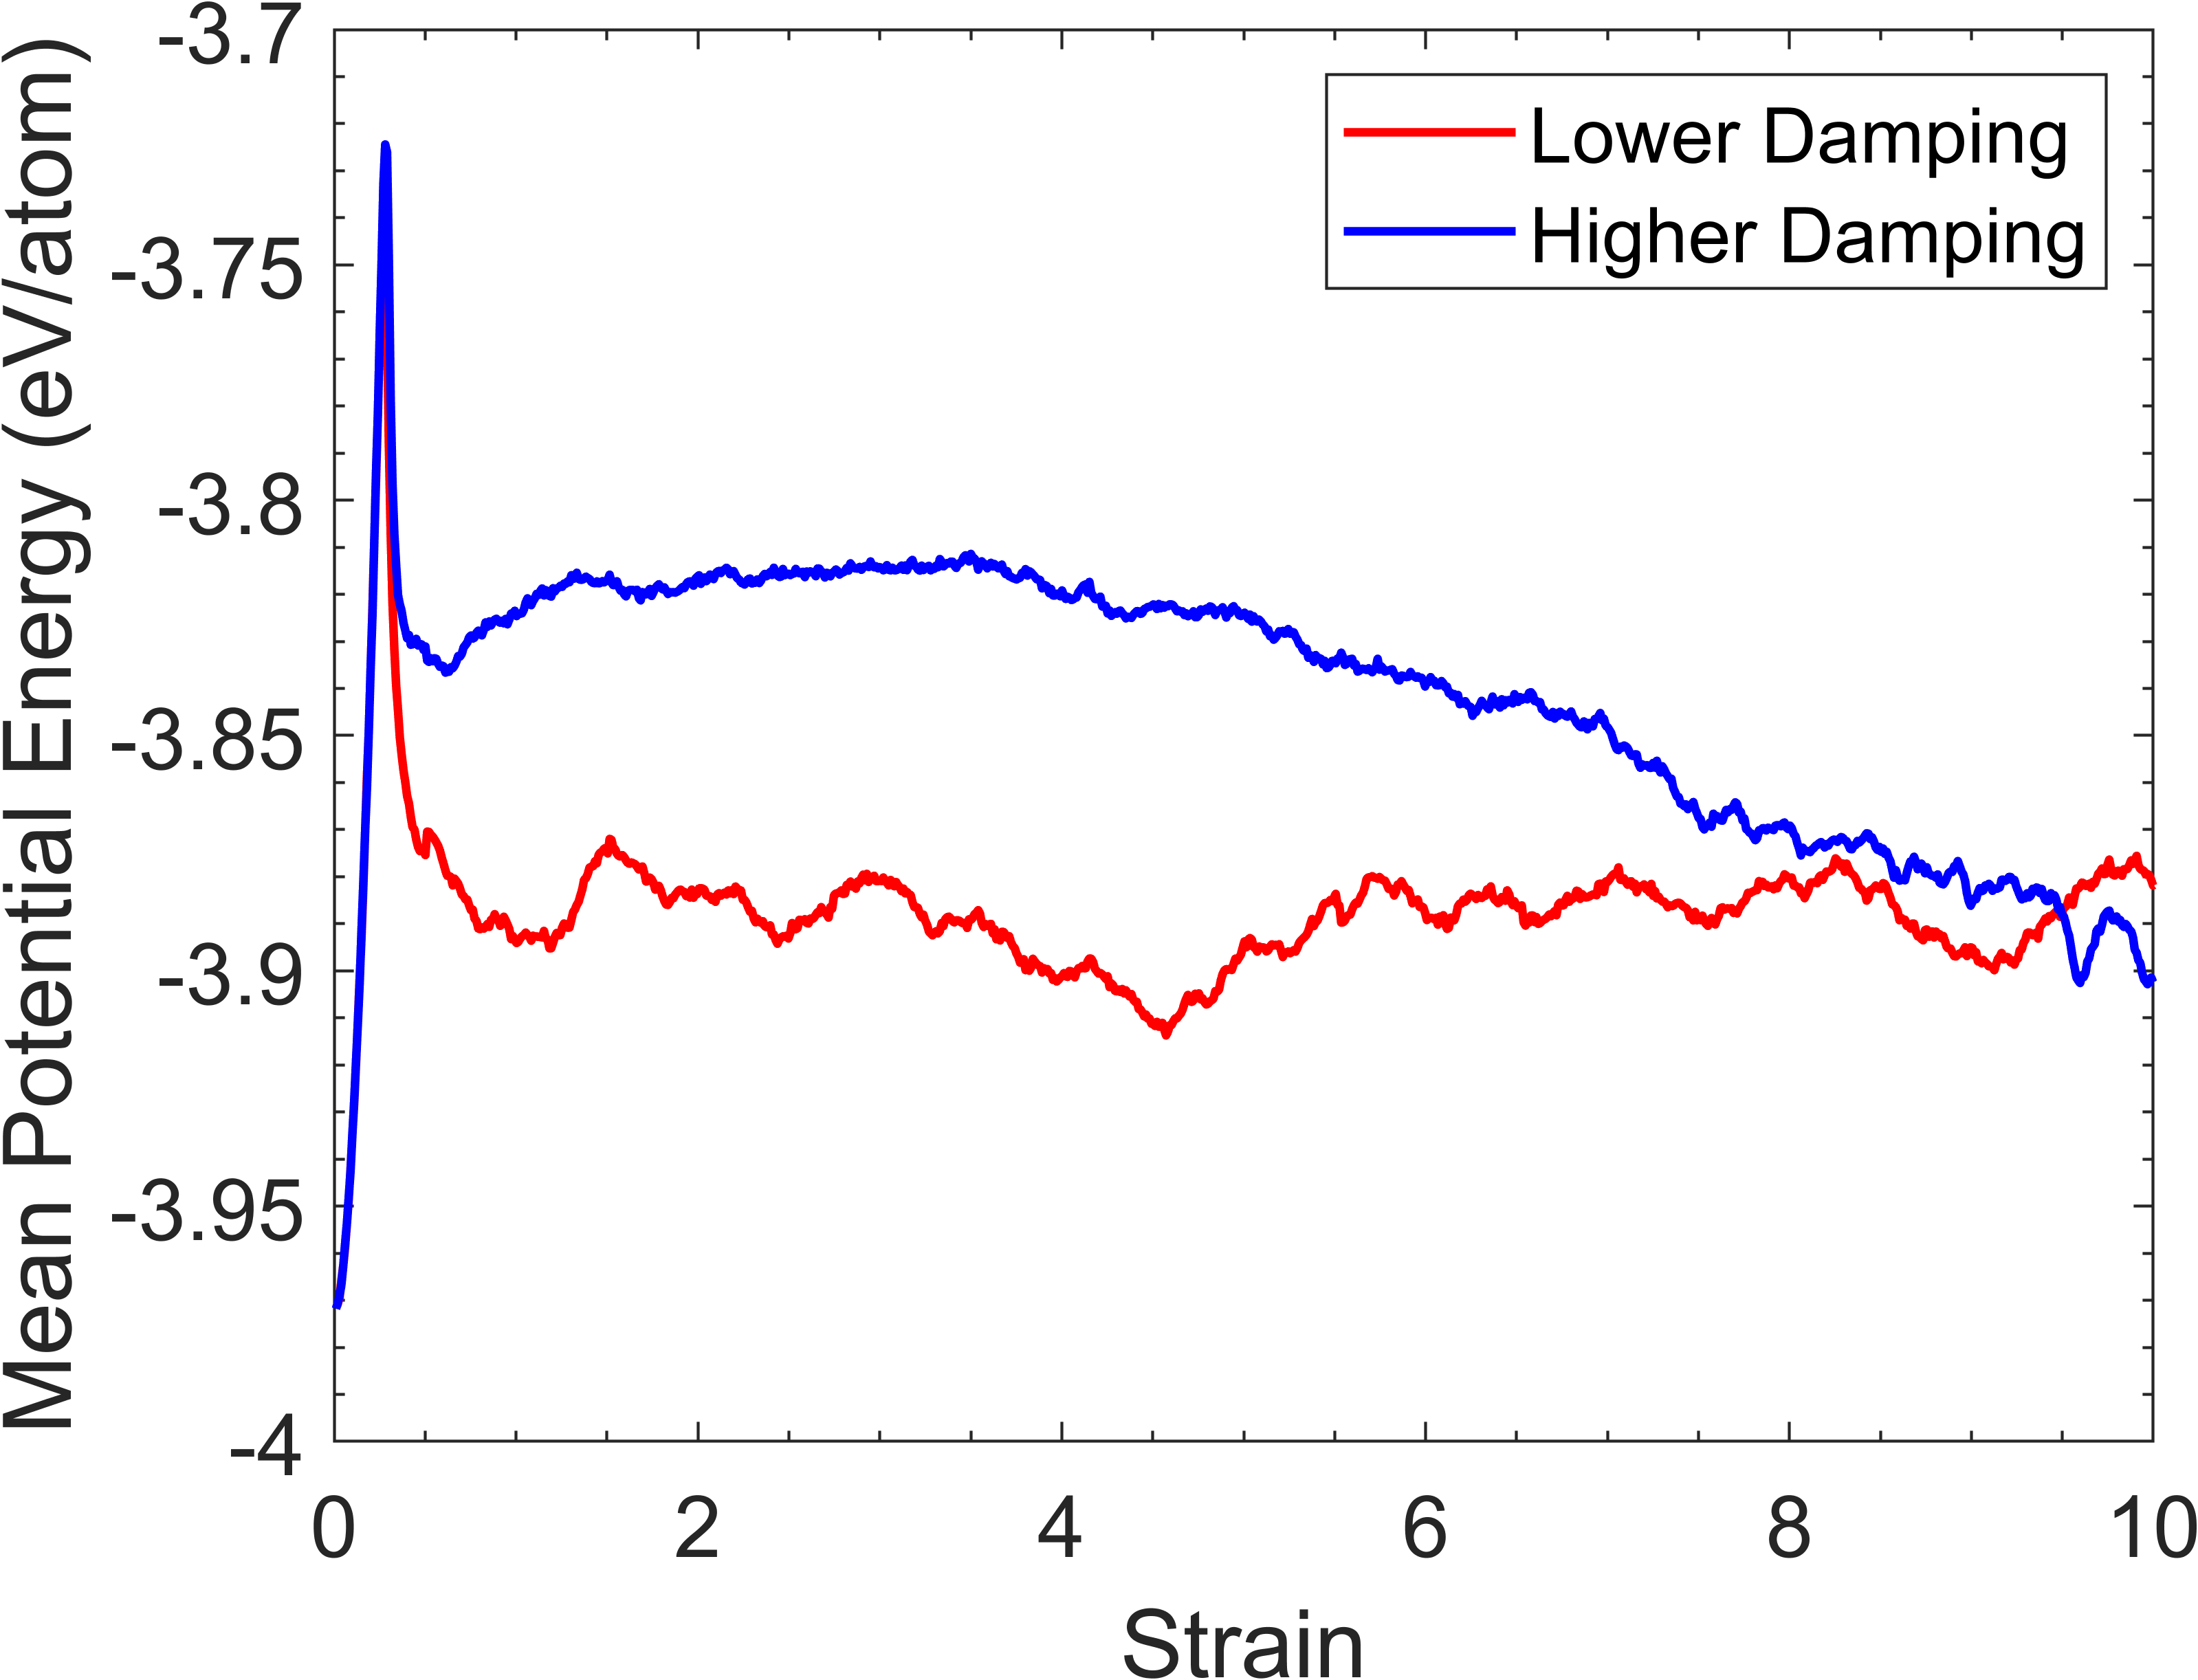
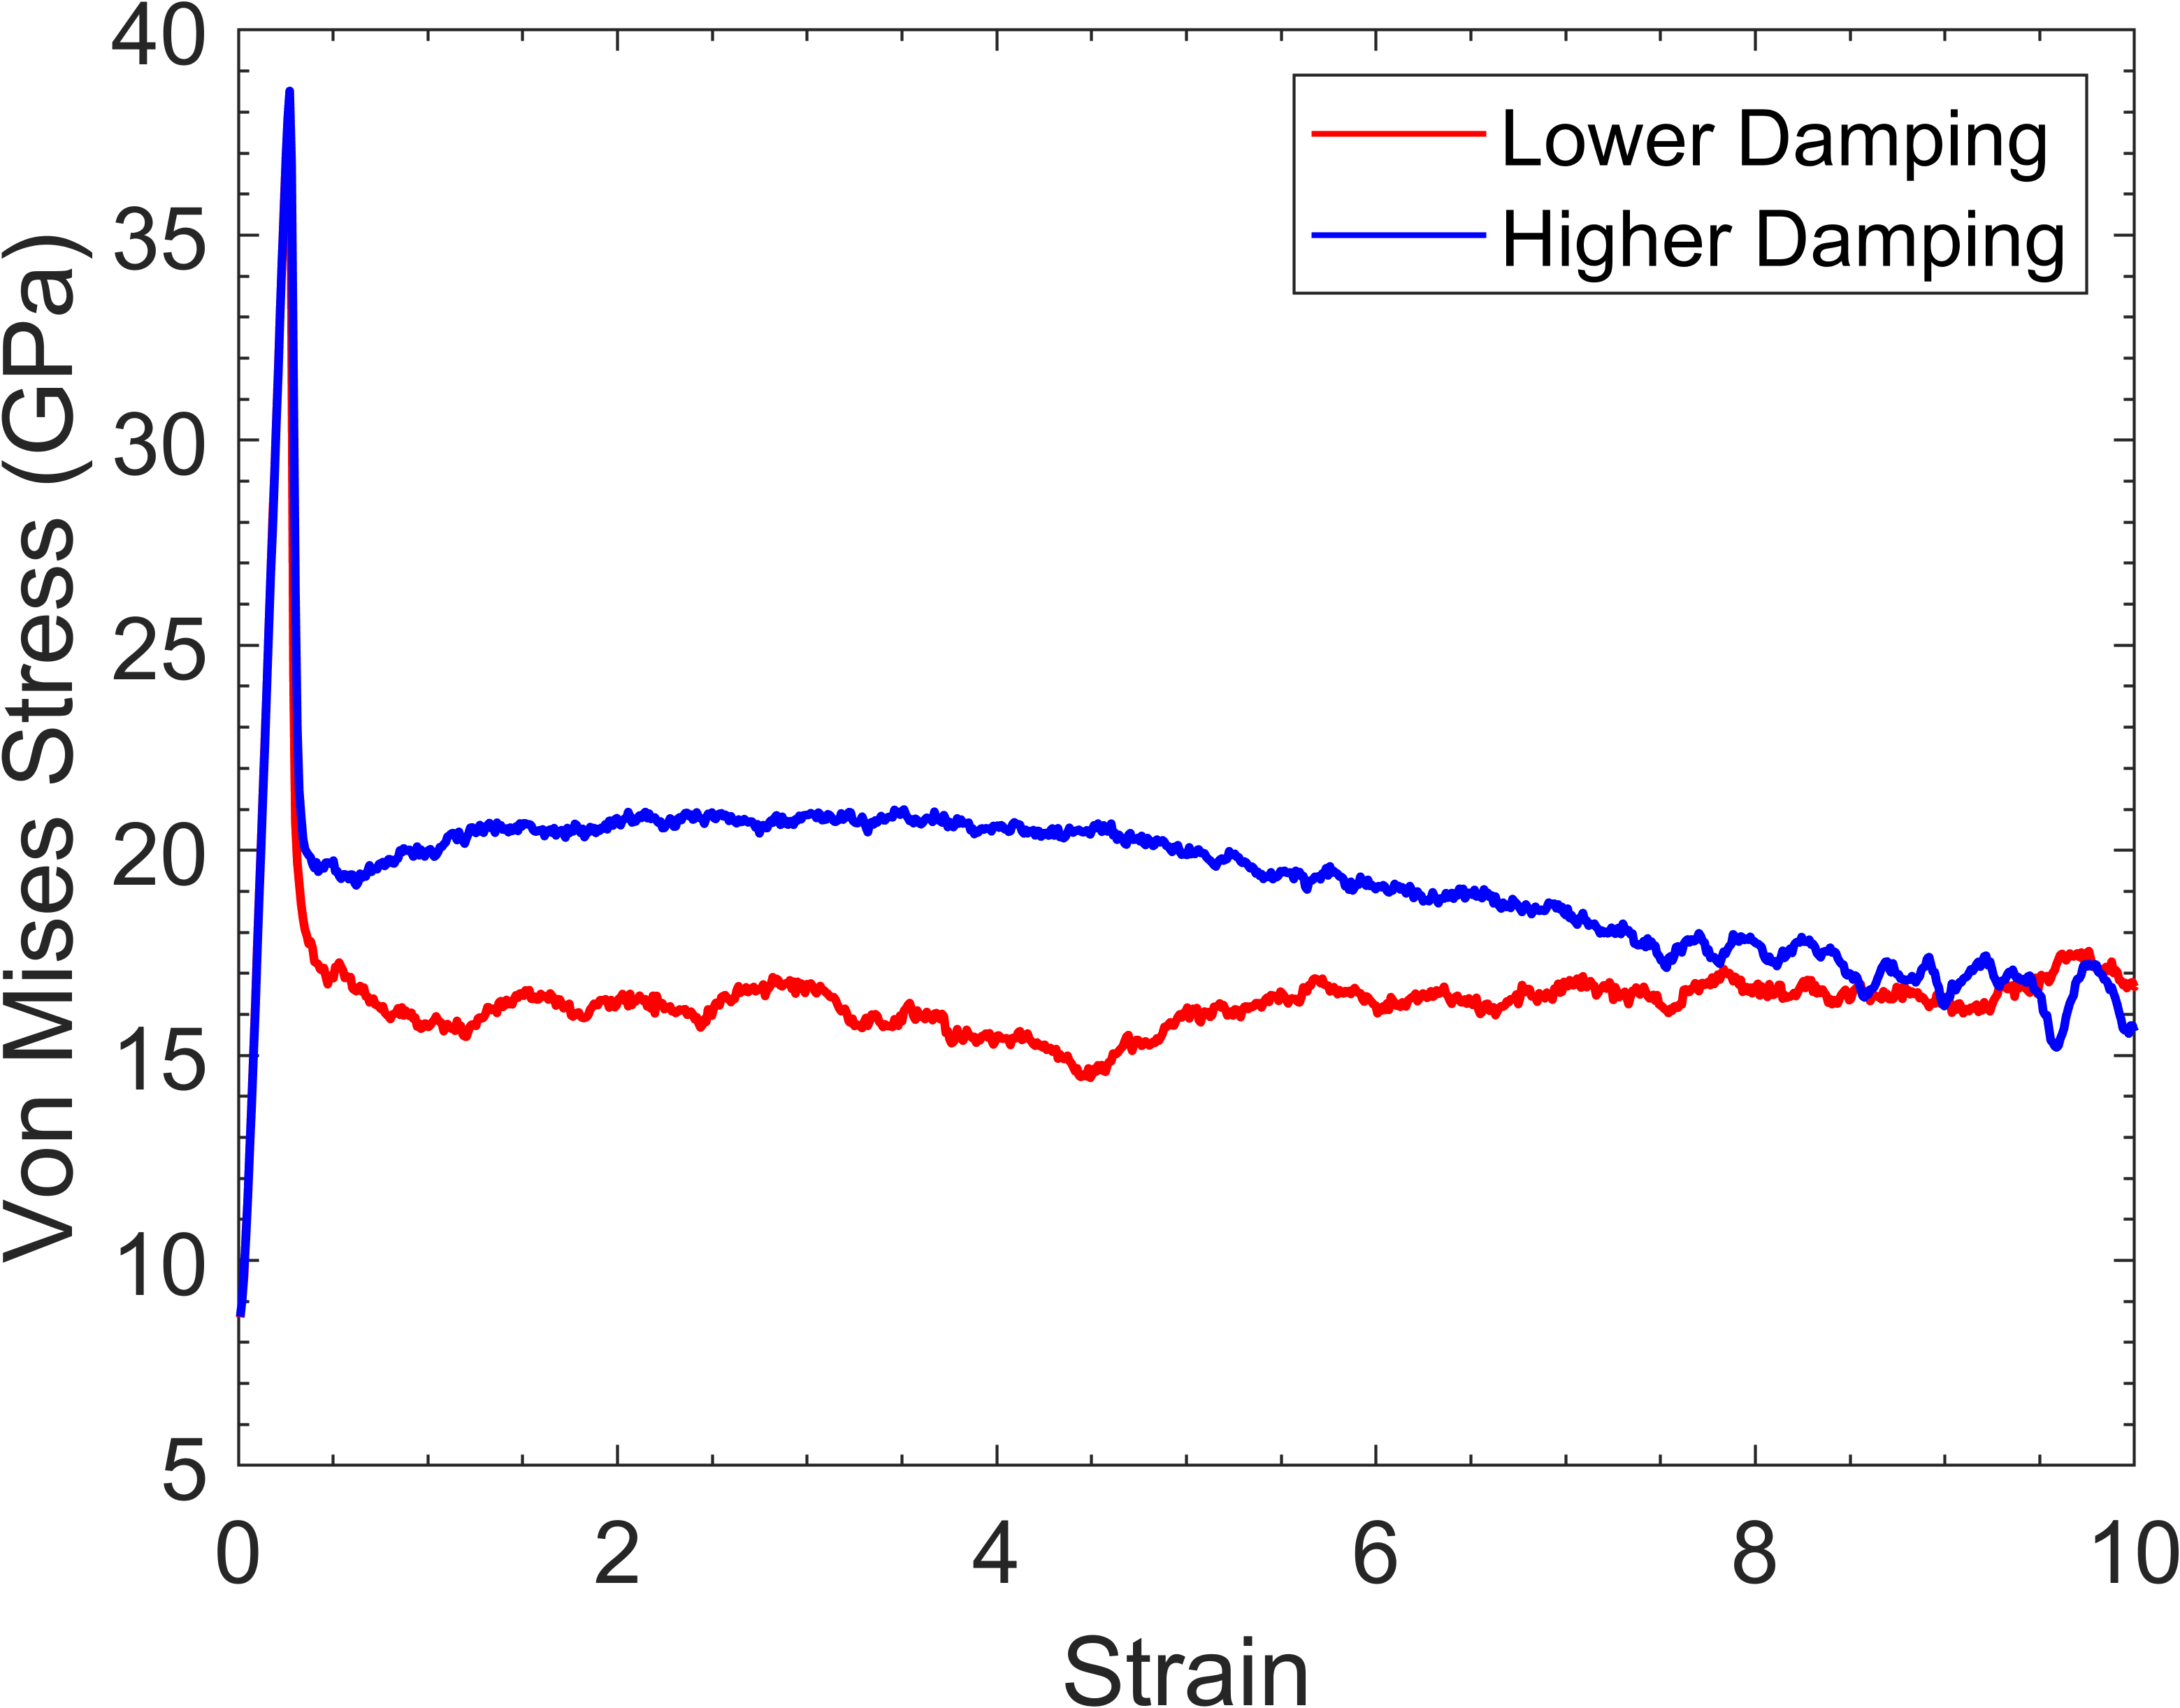
Figure 9(b) shows that both simulations experience an identical increase in potential energy with increasing shear strain up to a value of -3.73 eV/atom at 0.27 strain, corresponding to the highly disorder state. However, whilst the benchmark simulation reduces to and subsequently stabilises at around -3.89 eV/atom, the higher damping simulation only decreases to around -3.82 eV/atom, which suggests a higher state of disorder. Furthermore, the potential energy shows a gradual decrease after around 4 strain, until it approximately reaches the same value as the benchmark simulation at . As before, the average atomic von Mises stress, as shown in Figure 9(d), and the potential energy per atom, are well correlated for both simulations.
Next, we consider the grain counts in the simulation cells (Figure 9(c)). Both the benchmark and higher damping simulations exhibit significant disordered states at 0.27 strain. The benchmark cell contains about 400 grains, while the higher damping simulation shows 390. Both simulations show a rapid decrease in grain count. The benchmark simulation subsequently drops to around 30 grains, whereas the higher damping simulation only drops to around 130 grains. The benchmark simulation steadily increases in grain count until about 2 strain, reaching 220 grains. In contrast, the higher damping simulation rapidly rises to 320 grains around 1.1 strain, then sharply declines. By 3 strain, the higher damping simulation maintains around 70 grains, plateauing until the end of simulation, a lower count than the benchmark simulation’s plateau at 240 grains.
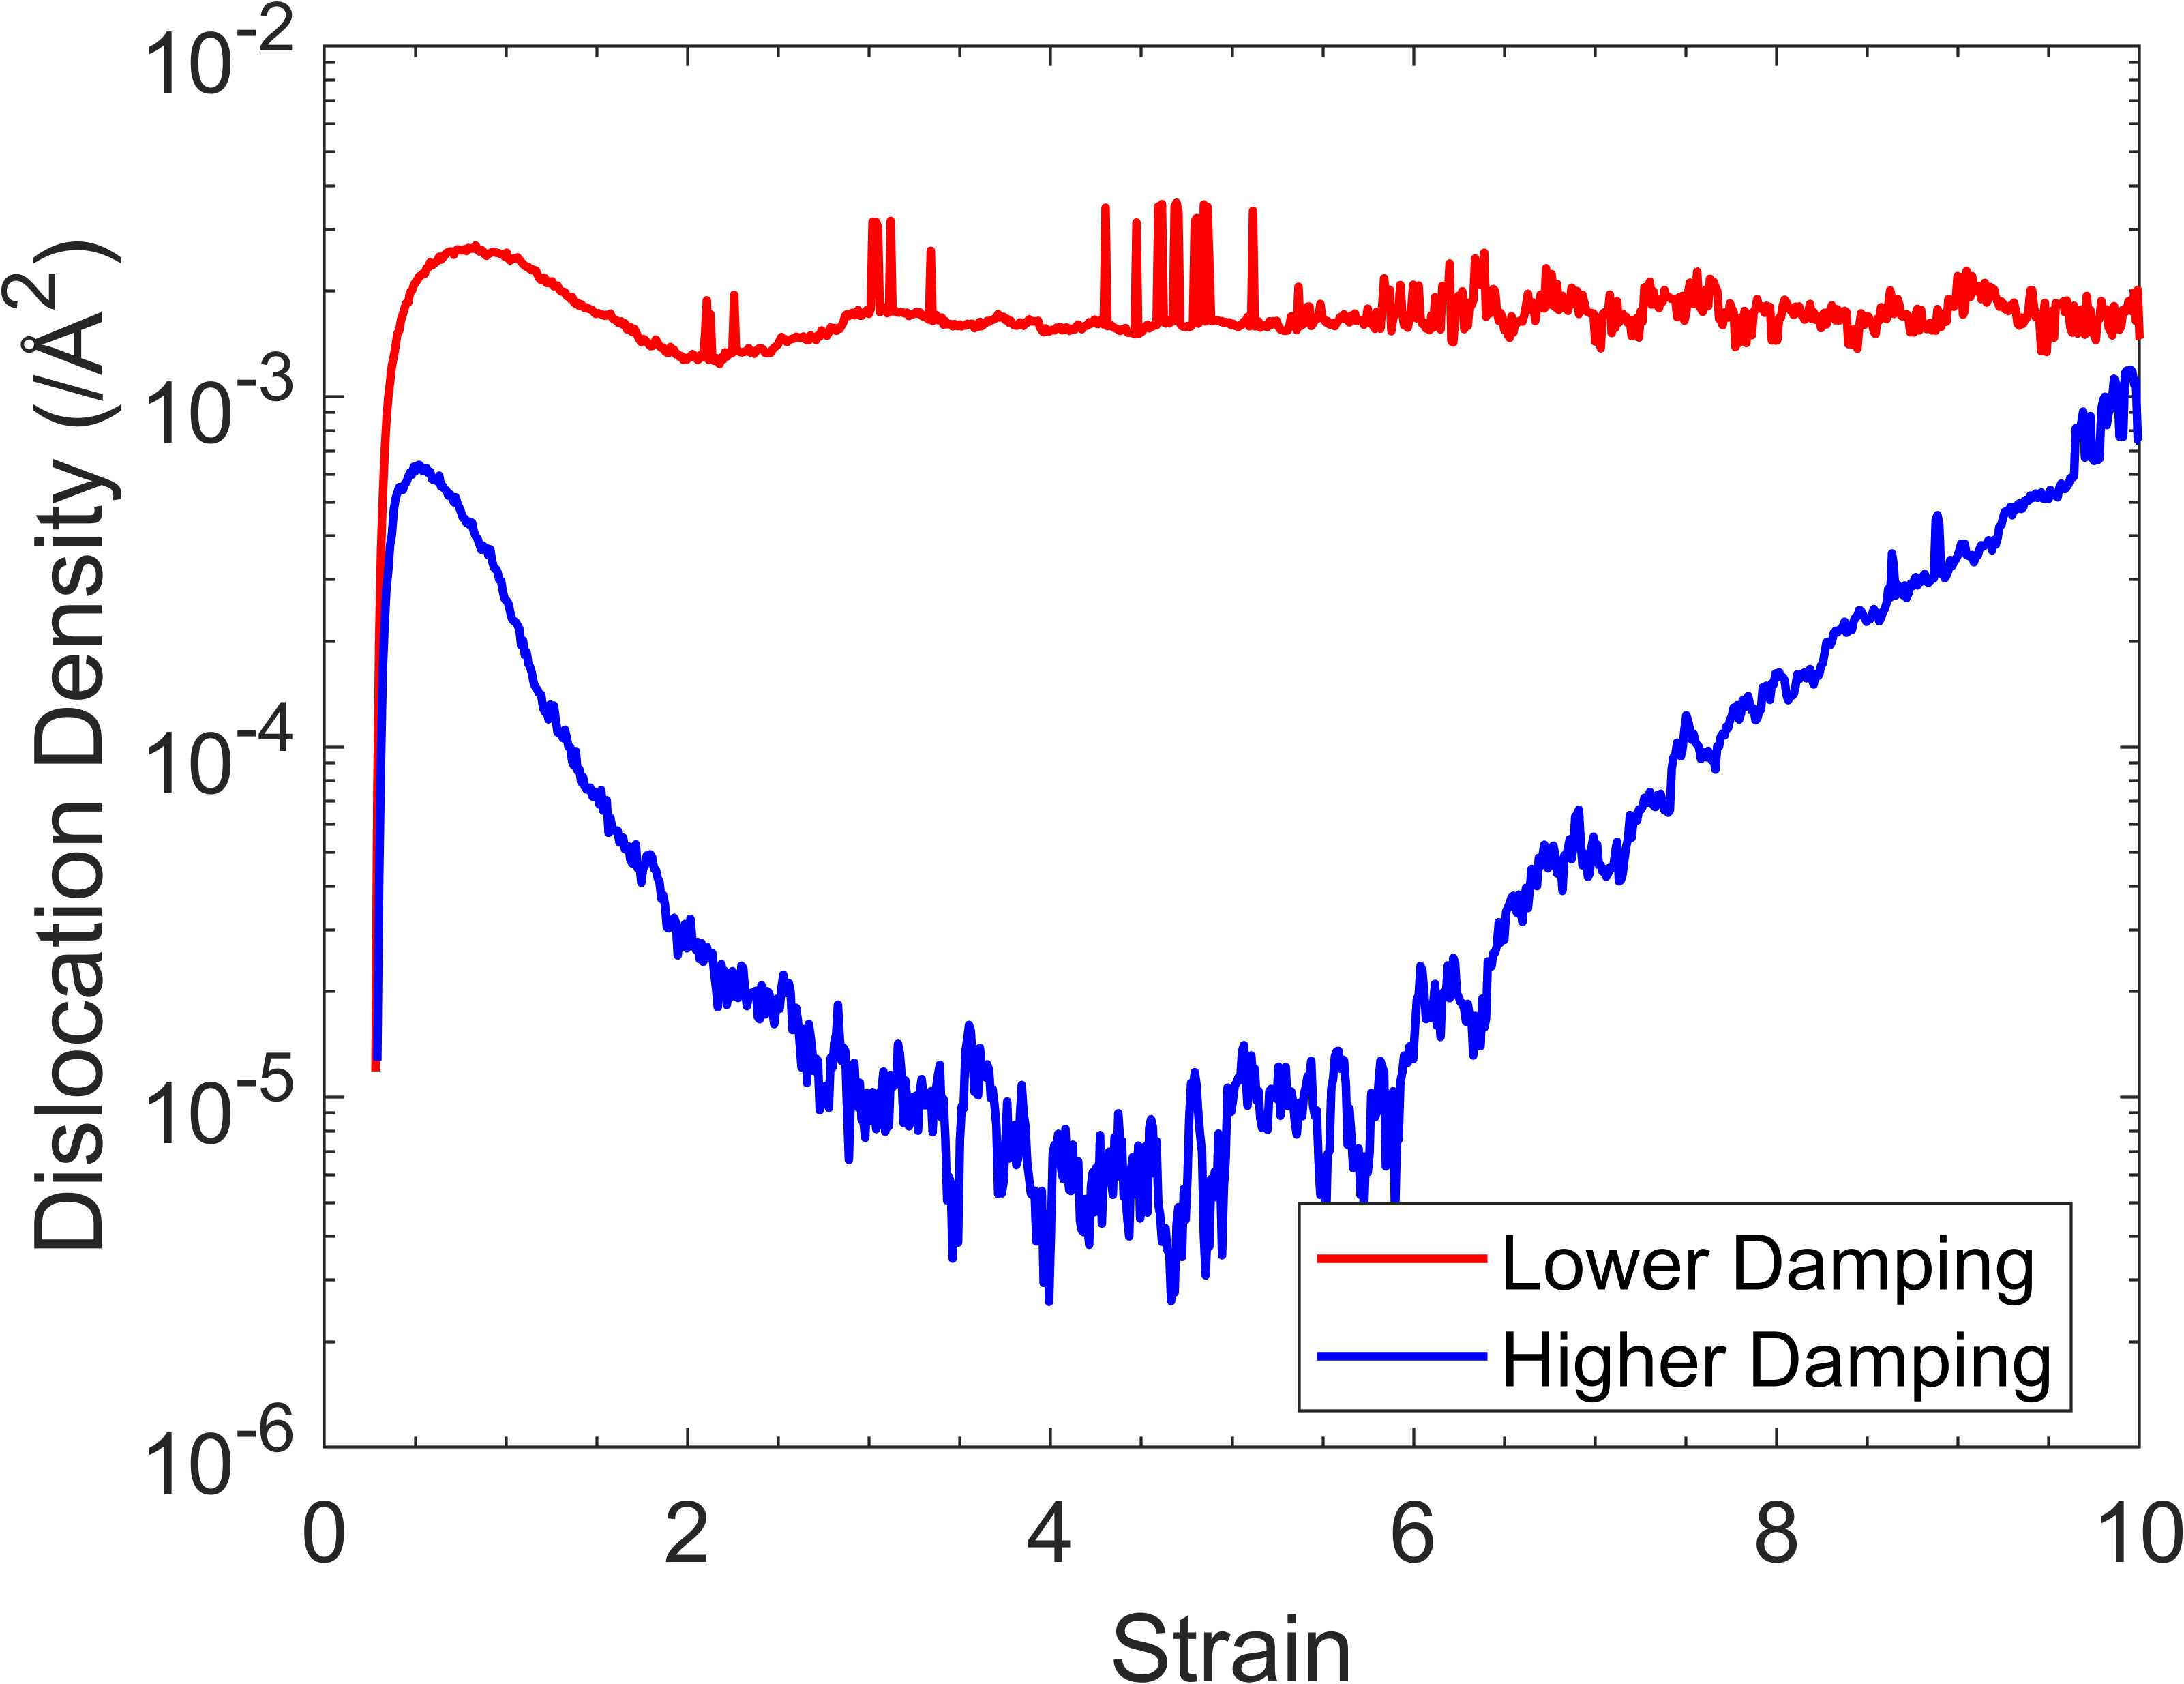
By observing Figure 9(e), which shows the dislocation density for the simulations, we see that the initial spike in dislocation density is much lower for the higher damping simulation. Whilst the benchmark simulation increases to around Å2 at 0.82 strain, the higher damping simulation’s dislocation density only increases to Å2 at 0.51 strain. With increased shearing, the dislocation density for the benchmark simulation decreases and then saturates at around Å2. This is in contrast to the higher damping simulation where the dislocation density decreases to Å2 at around 2 strain and begins to increase at around 6.5 strain, with the dislocation density for the higher damping simulation peaking at around Å2 at .
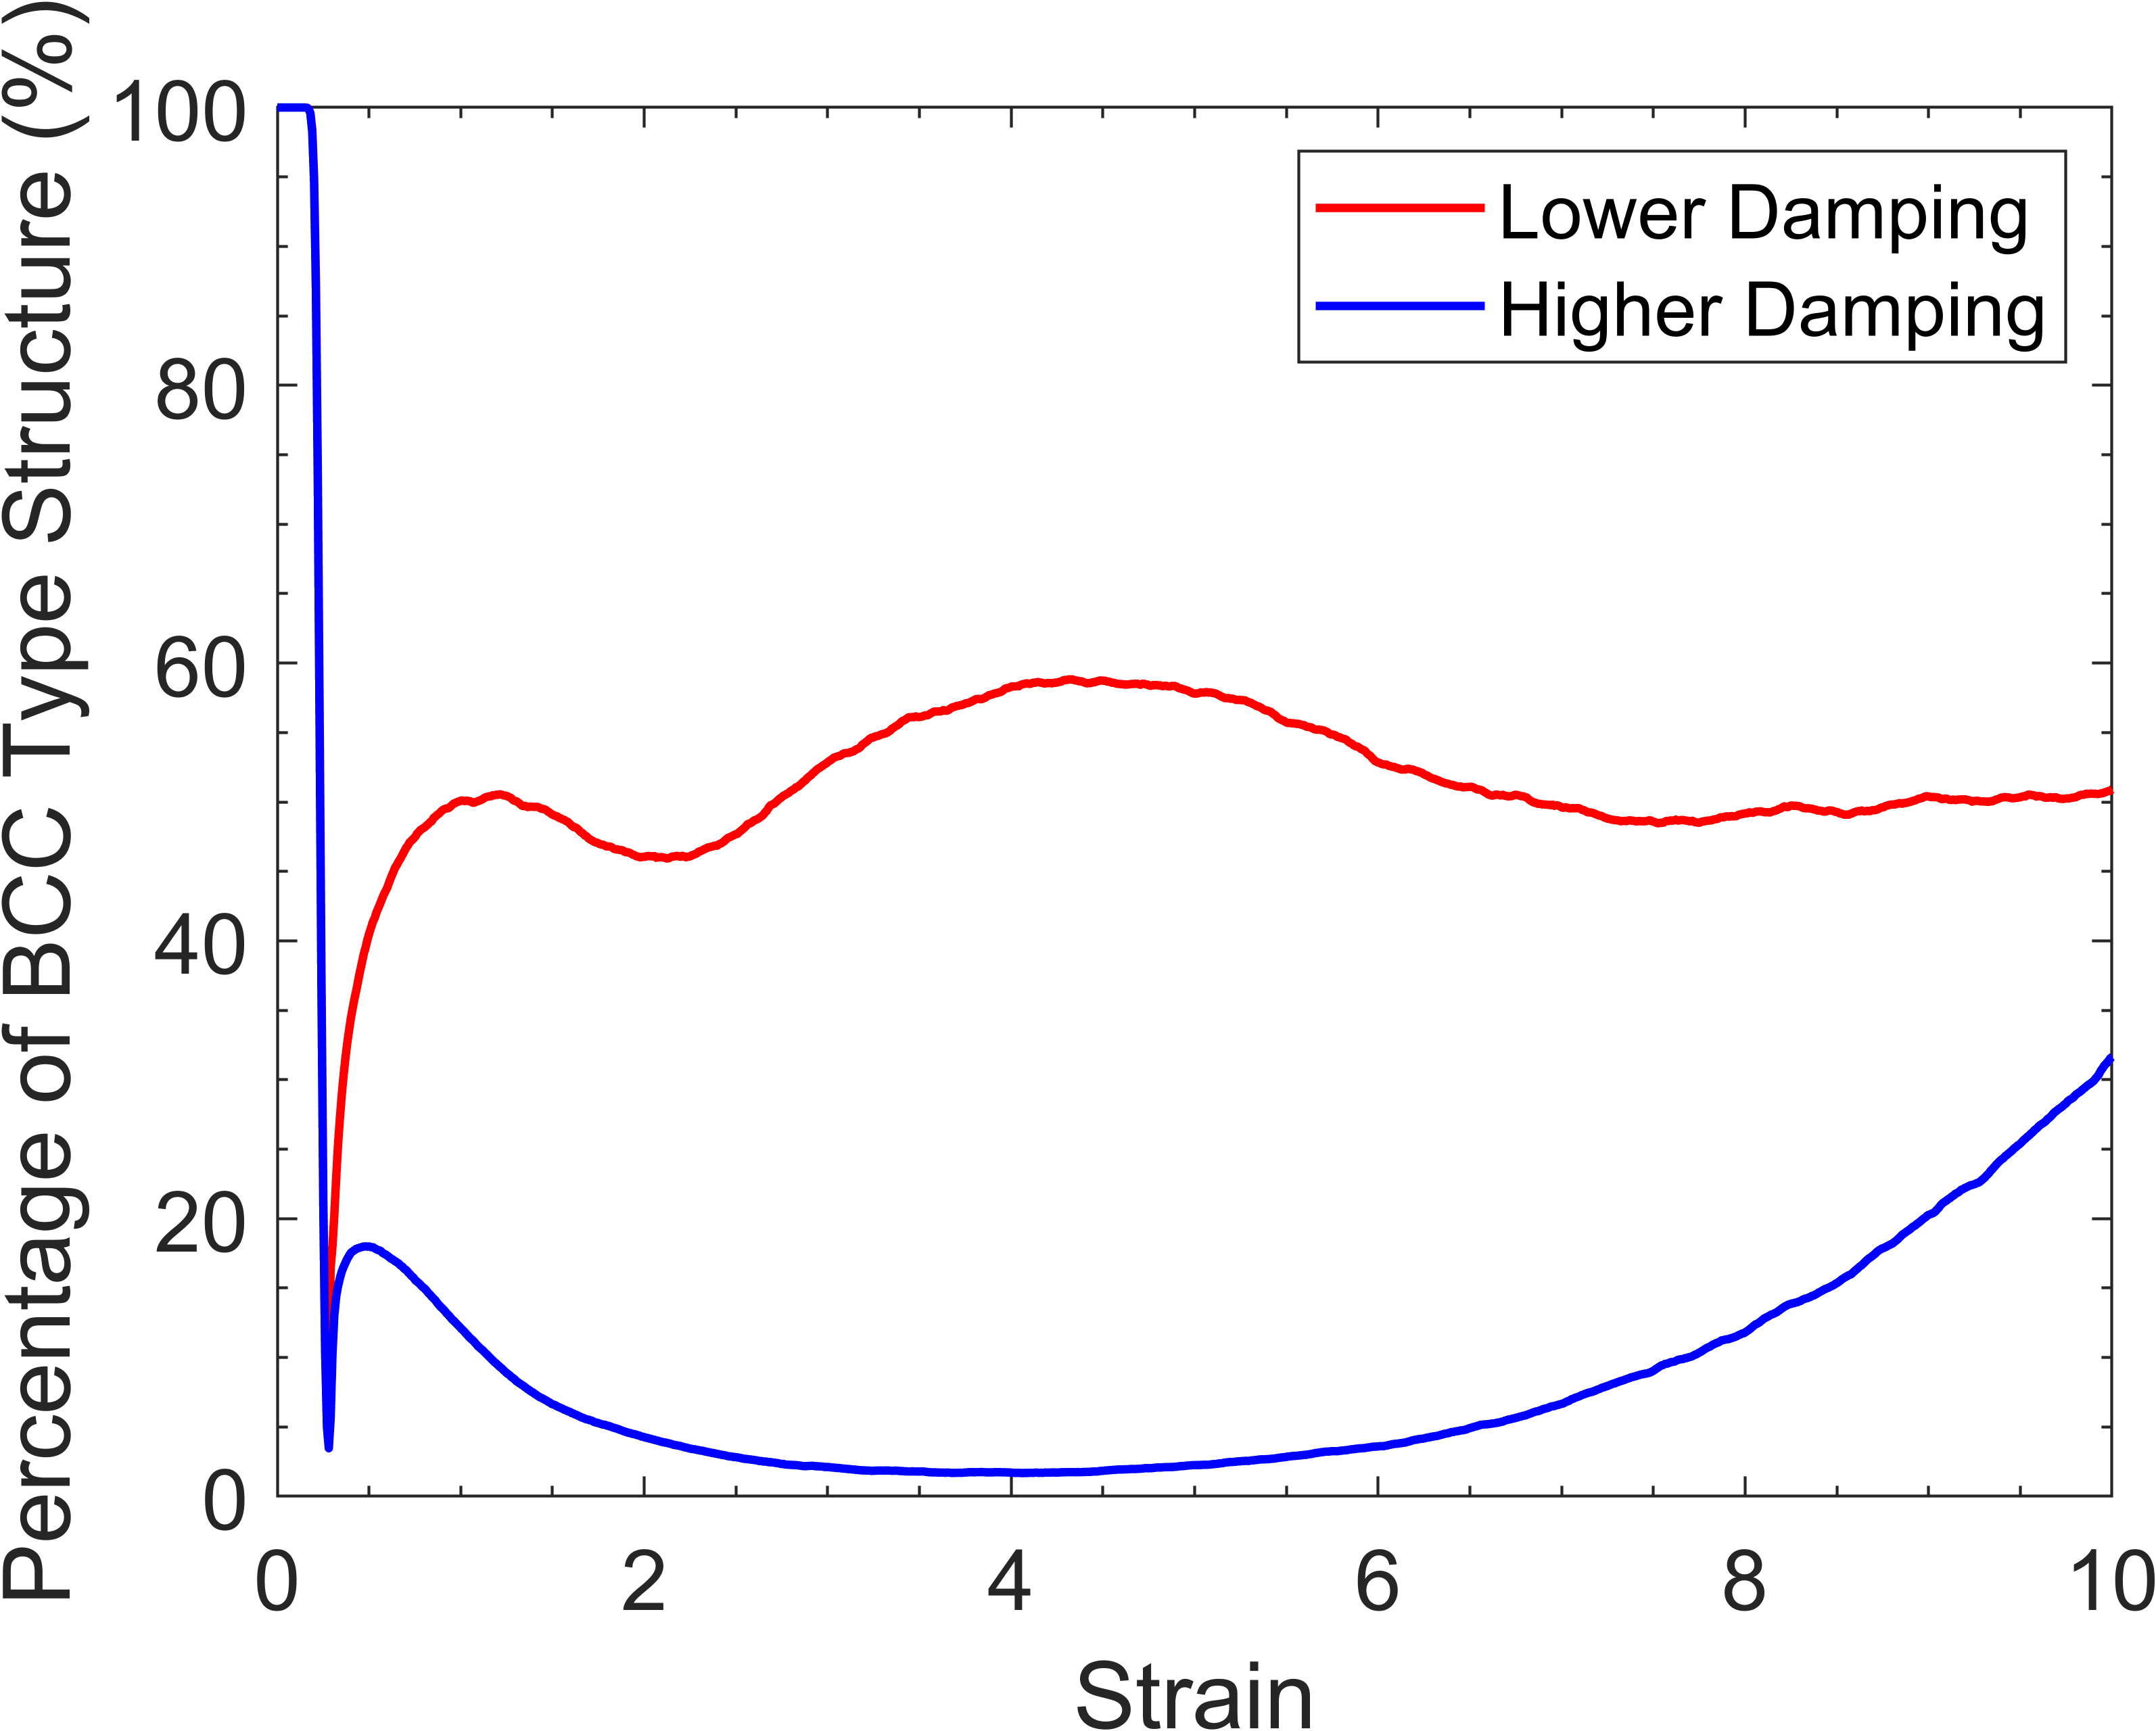
Figure 9(f) shows the percentage of the overall structure in the BCC phase as a function of strain. Both simulations experience a highly disordered state transition at 0.27 strain, where the percentage of BCC atoms within the cells is below 10% for both simulations. However, the benchmark simulation rapidly recovers, and around 50% of the atoms are considered to be BCC after . Conversely, the higher damping simulation makes a slight recovery to 17% at 0.44 strain, before reducing to 2% BCC. After 5 strain, the higher damping cell begins to recover its BCC structure, increasing to 32% BCC at 10 strain.
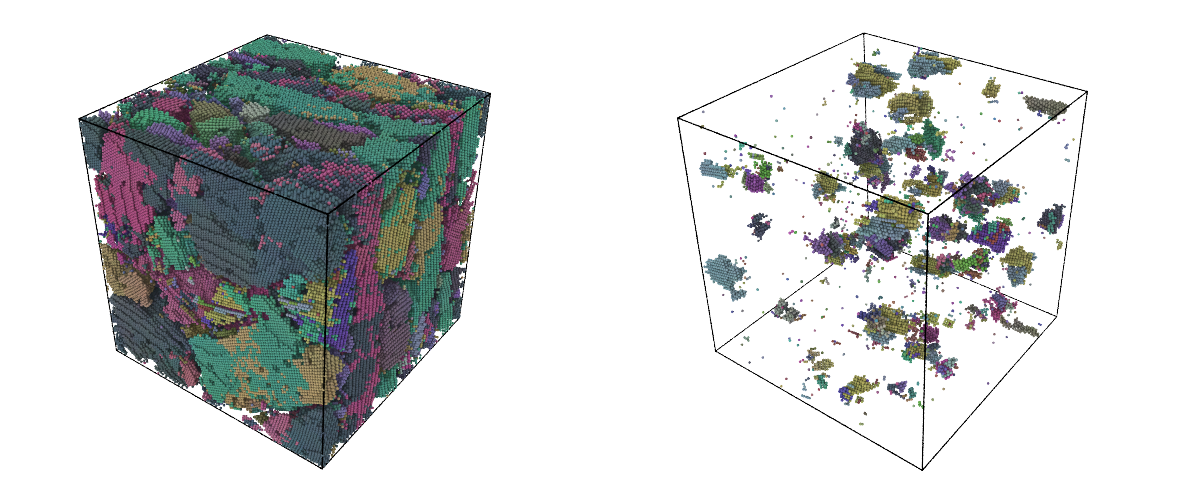
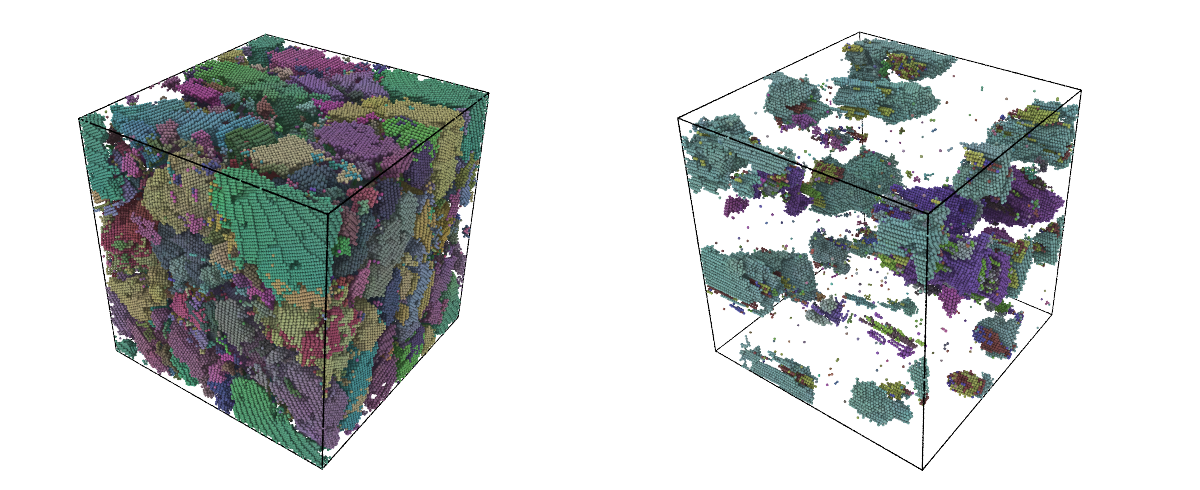

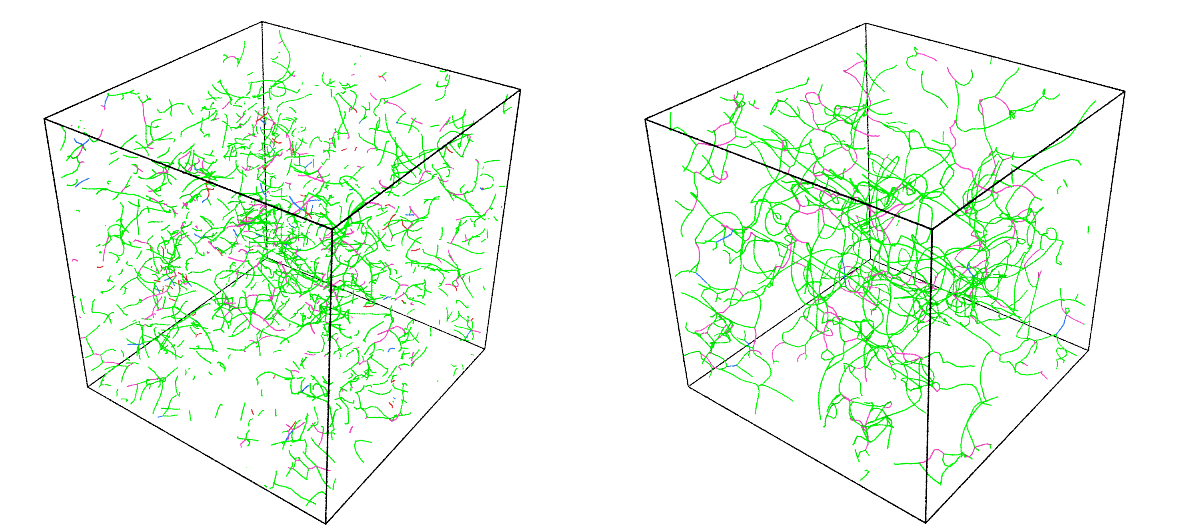
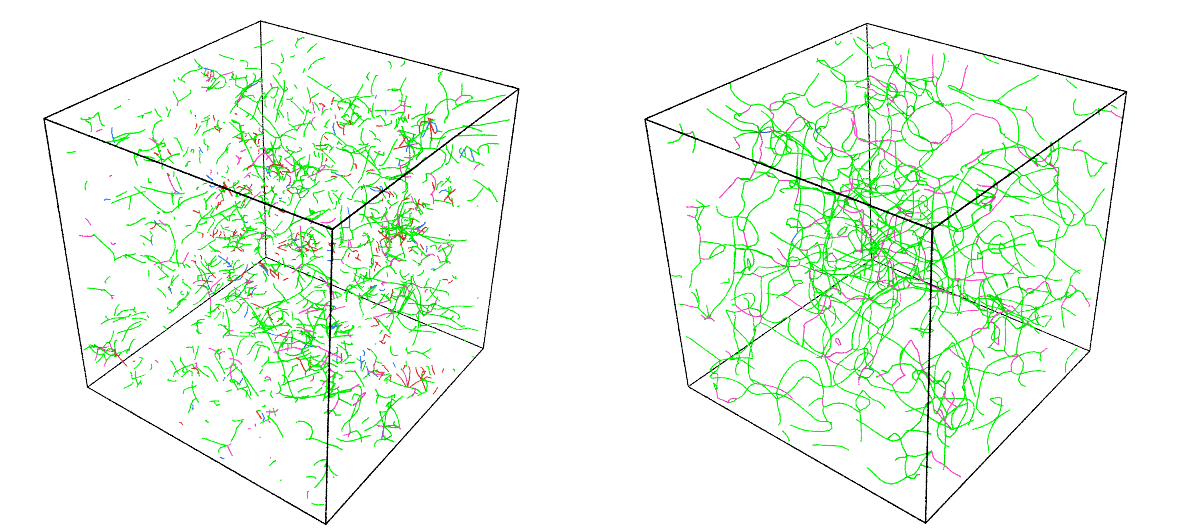
To further explore the data presented in Figure 9, a visual representation of atomic crystal orientation is shown in Figure 10. Both simulations begin with a perfect cell (Figure 10(a)) before experiencing a disordered state (Figure 10(b)) followed by a recrystallisation (Figure 10(c)). The number of atoms in the disordered phase is much larger for the higher damping simulation. During the recrystallisation, the grains appear to be much larger for the benchmark simulation, with many small pockets of BCC structure being present in the higher damping simulation.
In Figure 10(d), the higher damping simulation does not experience a grain growth similar to the benchmark simulation, with many fragmented grains and disordered atoms present. By Figure 10(e), most of the cell is in the disordered phase. There are only a few pockets of BCC atoms still present within the box. This is consistent with Figure 9(f) which shows that the percentage of atoms in the BCC phase at 4 strain was 2%. Between 4 strain (10(e)) and 7 strain (10(f)), there is a noticeable grain growth, which is even more noticeable at 10 strain (10(g)), corresponding to a larger number of atoms transitioning into the BCC phase as also seen in Figure 9(f).
Previous studies [70, 71] consider DRV to be the only dynamic recovery method in ferritic steels. However, the data presented in Figures 9 and 10 appears to show that DRX mechanisms are at play, which agrees with the observations made by Tsuji et al. [72], which confirmed the occurrence of DRX in BCC iron.
Considering Figure 10(e) - 10(g), the few remaining grains at 4 strain grow much larger and recrystallisation occurs. This process continues to produce a small number of large grains at . This coincides with an increase in the percentage of BCC phase, as shown in 9(f). Interestingly, previous analysis of Figure 9(c) showed that the grain number plateaued at around for the higher damping simulation. This provides further evidence for DRX, as the grain number stays constant whilst the BCC structure continues to recover.
A larger damping parameter fundamentally means that the quenching rate is faster. This means that atoms lose their kinetic energy more quickly, and get trapped in a disordered state. As shown in Figure 10(c) and 10(d), the higher damping simulation experiences recrystallisation, similar to the benchmark simulation, but not to the same extent. Increased shear strain causes the atoms revert into a disordered state, as shown in Figure 10(e). This is confirmed by considering Figure 9(f), which shows a recovery of the BCC phase from the minimum at 0.27 strain, to 17% BCC at 0.44 strain. This is followed by a return to the disordered phase. It is not immediately evident why the atoms return to the disordered state post recrystallization. In the following section, we will attempt to outline a possible explanation for this.
As previously mentioned, the system is quenched at a higher rate for the higher damping simulation which causes many atoms to remain in the disordered phase. This essentially means that after recrystallisation at 0.32 strain, the grains are very small and the grain boundary volume is large. As such, the dislocations formed as a result of shearing are heavily constrained within small grains [76] and more readily meet and annihilate at the grain boundaries. This is evident from Figure 9(e) which shows an increase in dislocation density up to Å2 post recrystallisation, followed by a quick drop in dislocation density to Å2 at .
As dislocations are annihilated at grain boundaries and an increasing number of atoms enter a disordered state, the percentage of BCC structure decreases. The growth in grain size for the higher damped simulation provides the necessary grain volume for the propagation of dislocations, and an increase in dislocation density can be observed with the increase in BCC structure at . It is also possible that, since there are many highly disordered atoms that manifest as grain boundaries, the free energy in the simulation is high, which drives the recrystallisation.
III.4 Strain Rate
The effect of strain rate was explored next. We performed a simulation at a shear strain rate which is 10 times slower than the benchmark simulation, whilst keeping other parameters unchanged. Figure 11 shows different quantities plotted as a function of strain for the normal and slow rate simulation.
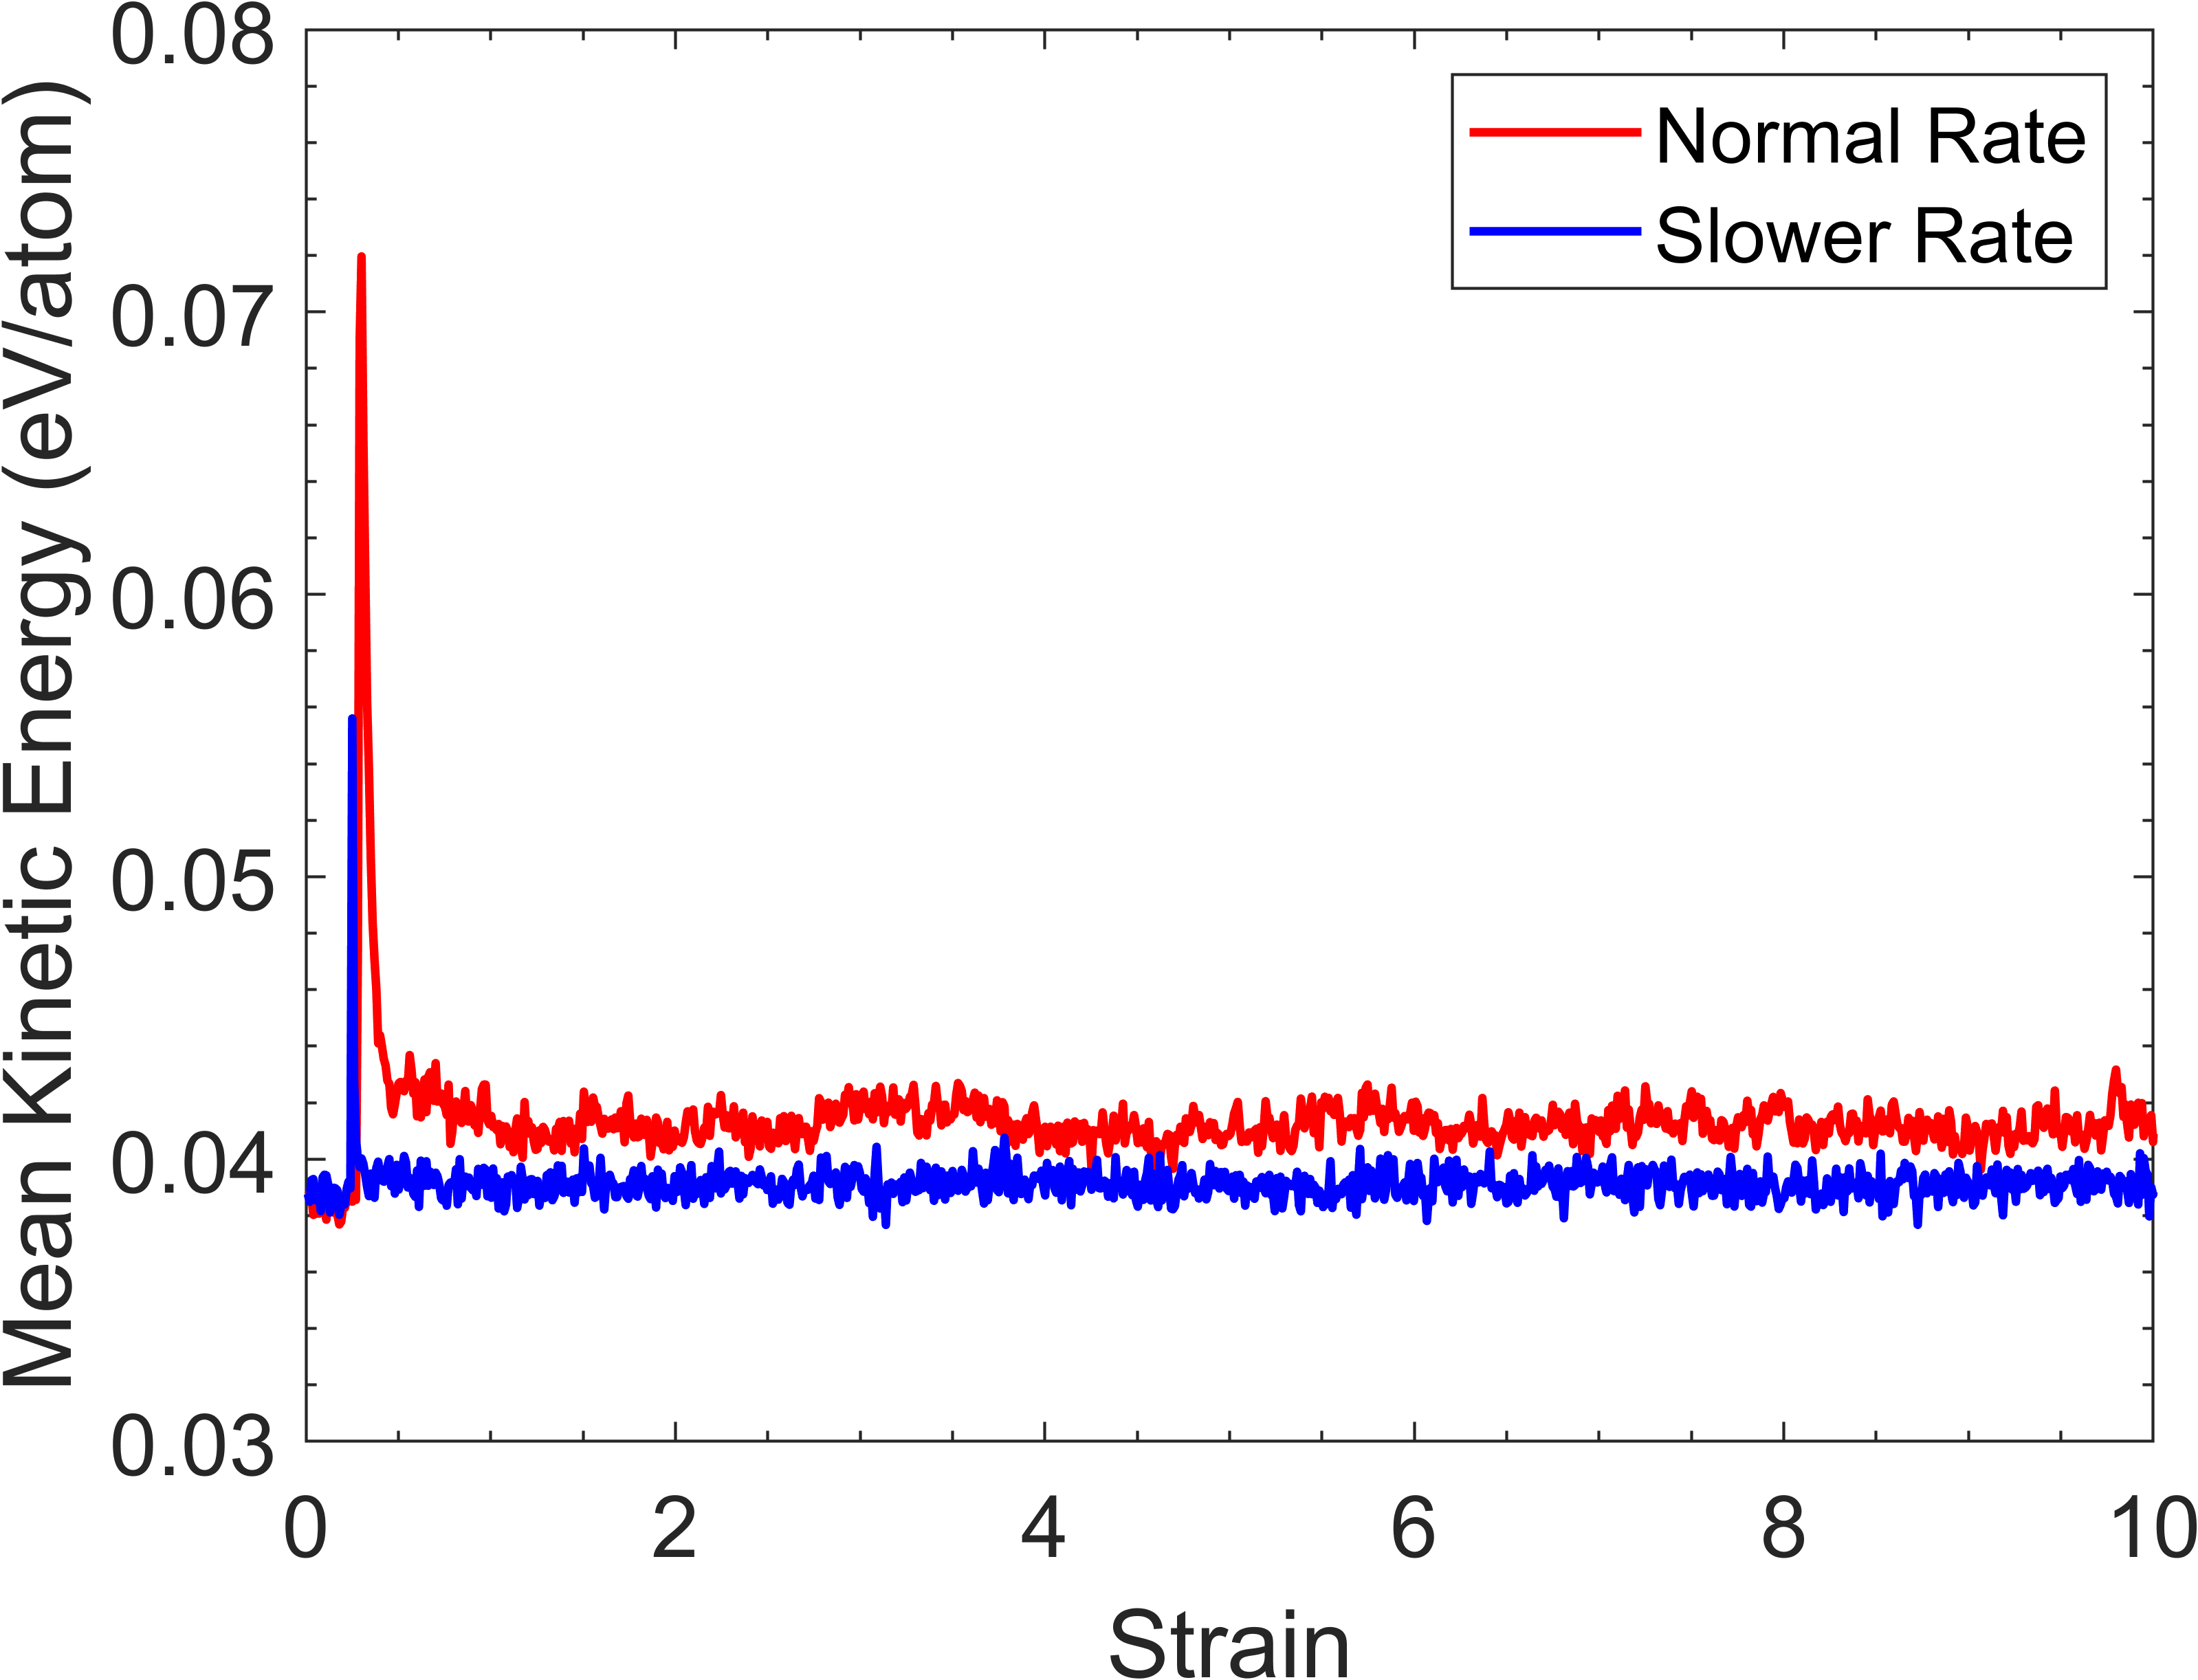

In Figure 11(a) and 11(b), the initial kinetic energy spike is not as pronounced for the slow strain rate simulation. Whilst the benchmark simulation shows an increase from 0.039 eV/atom to 0.072 eV/atom, the slow rate simulation only shows an increase from 0.039 eV/atom to 0.056 eV/atom. Furthermore, the spike for the benchmark simulation begins at 0.27 strain and peaks at 0.3 strain, whilst the slow rate simulation experiences a rise starting at 0.24 strain, and peaking at 0.25 strain. After the initial increase and subsequent decrease in kinetic energy, the slow rate simulation plateaus at a lower kinetic energy of around 0.039 eV/atom, compared with the benchmark simulation at 0.042 eV/atom.
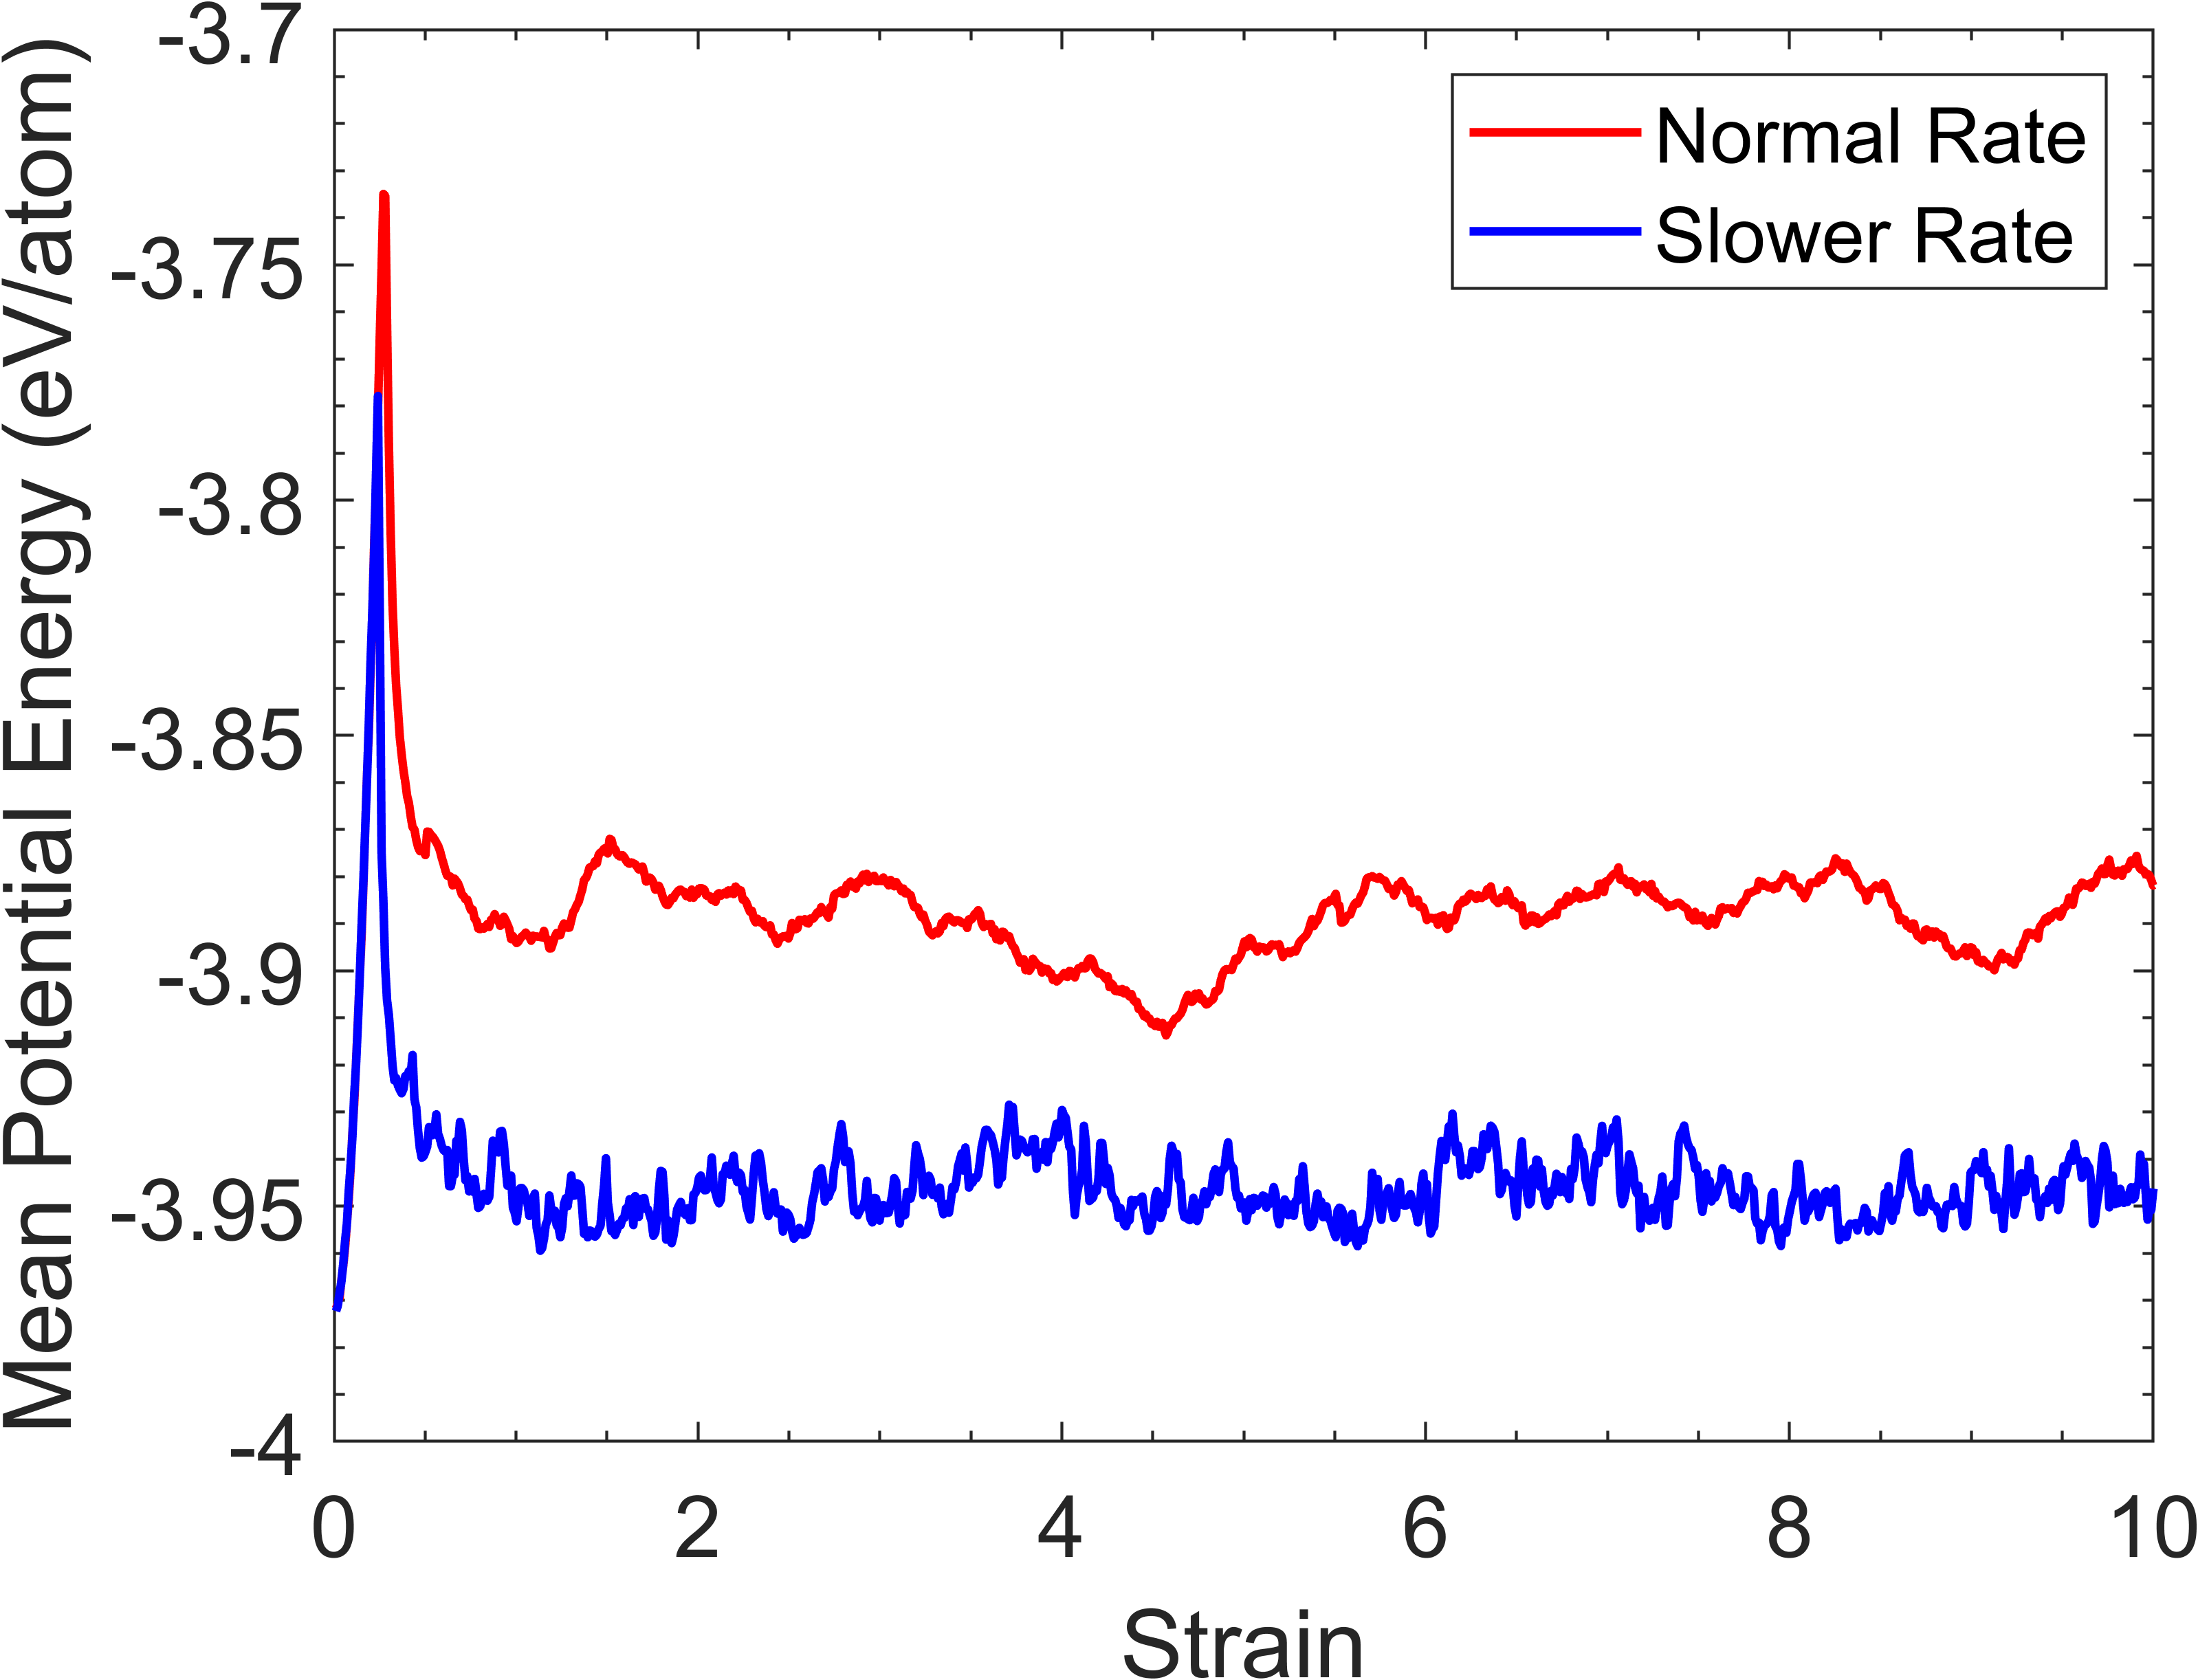
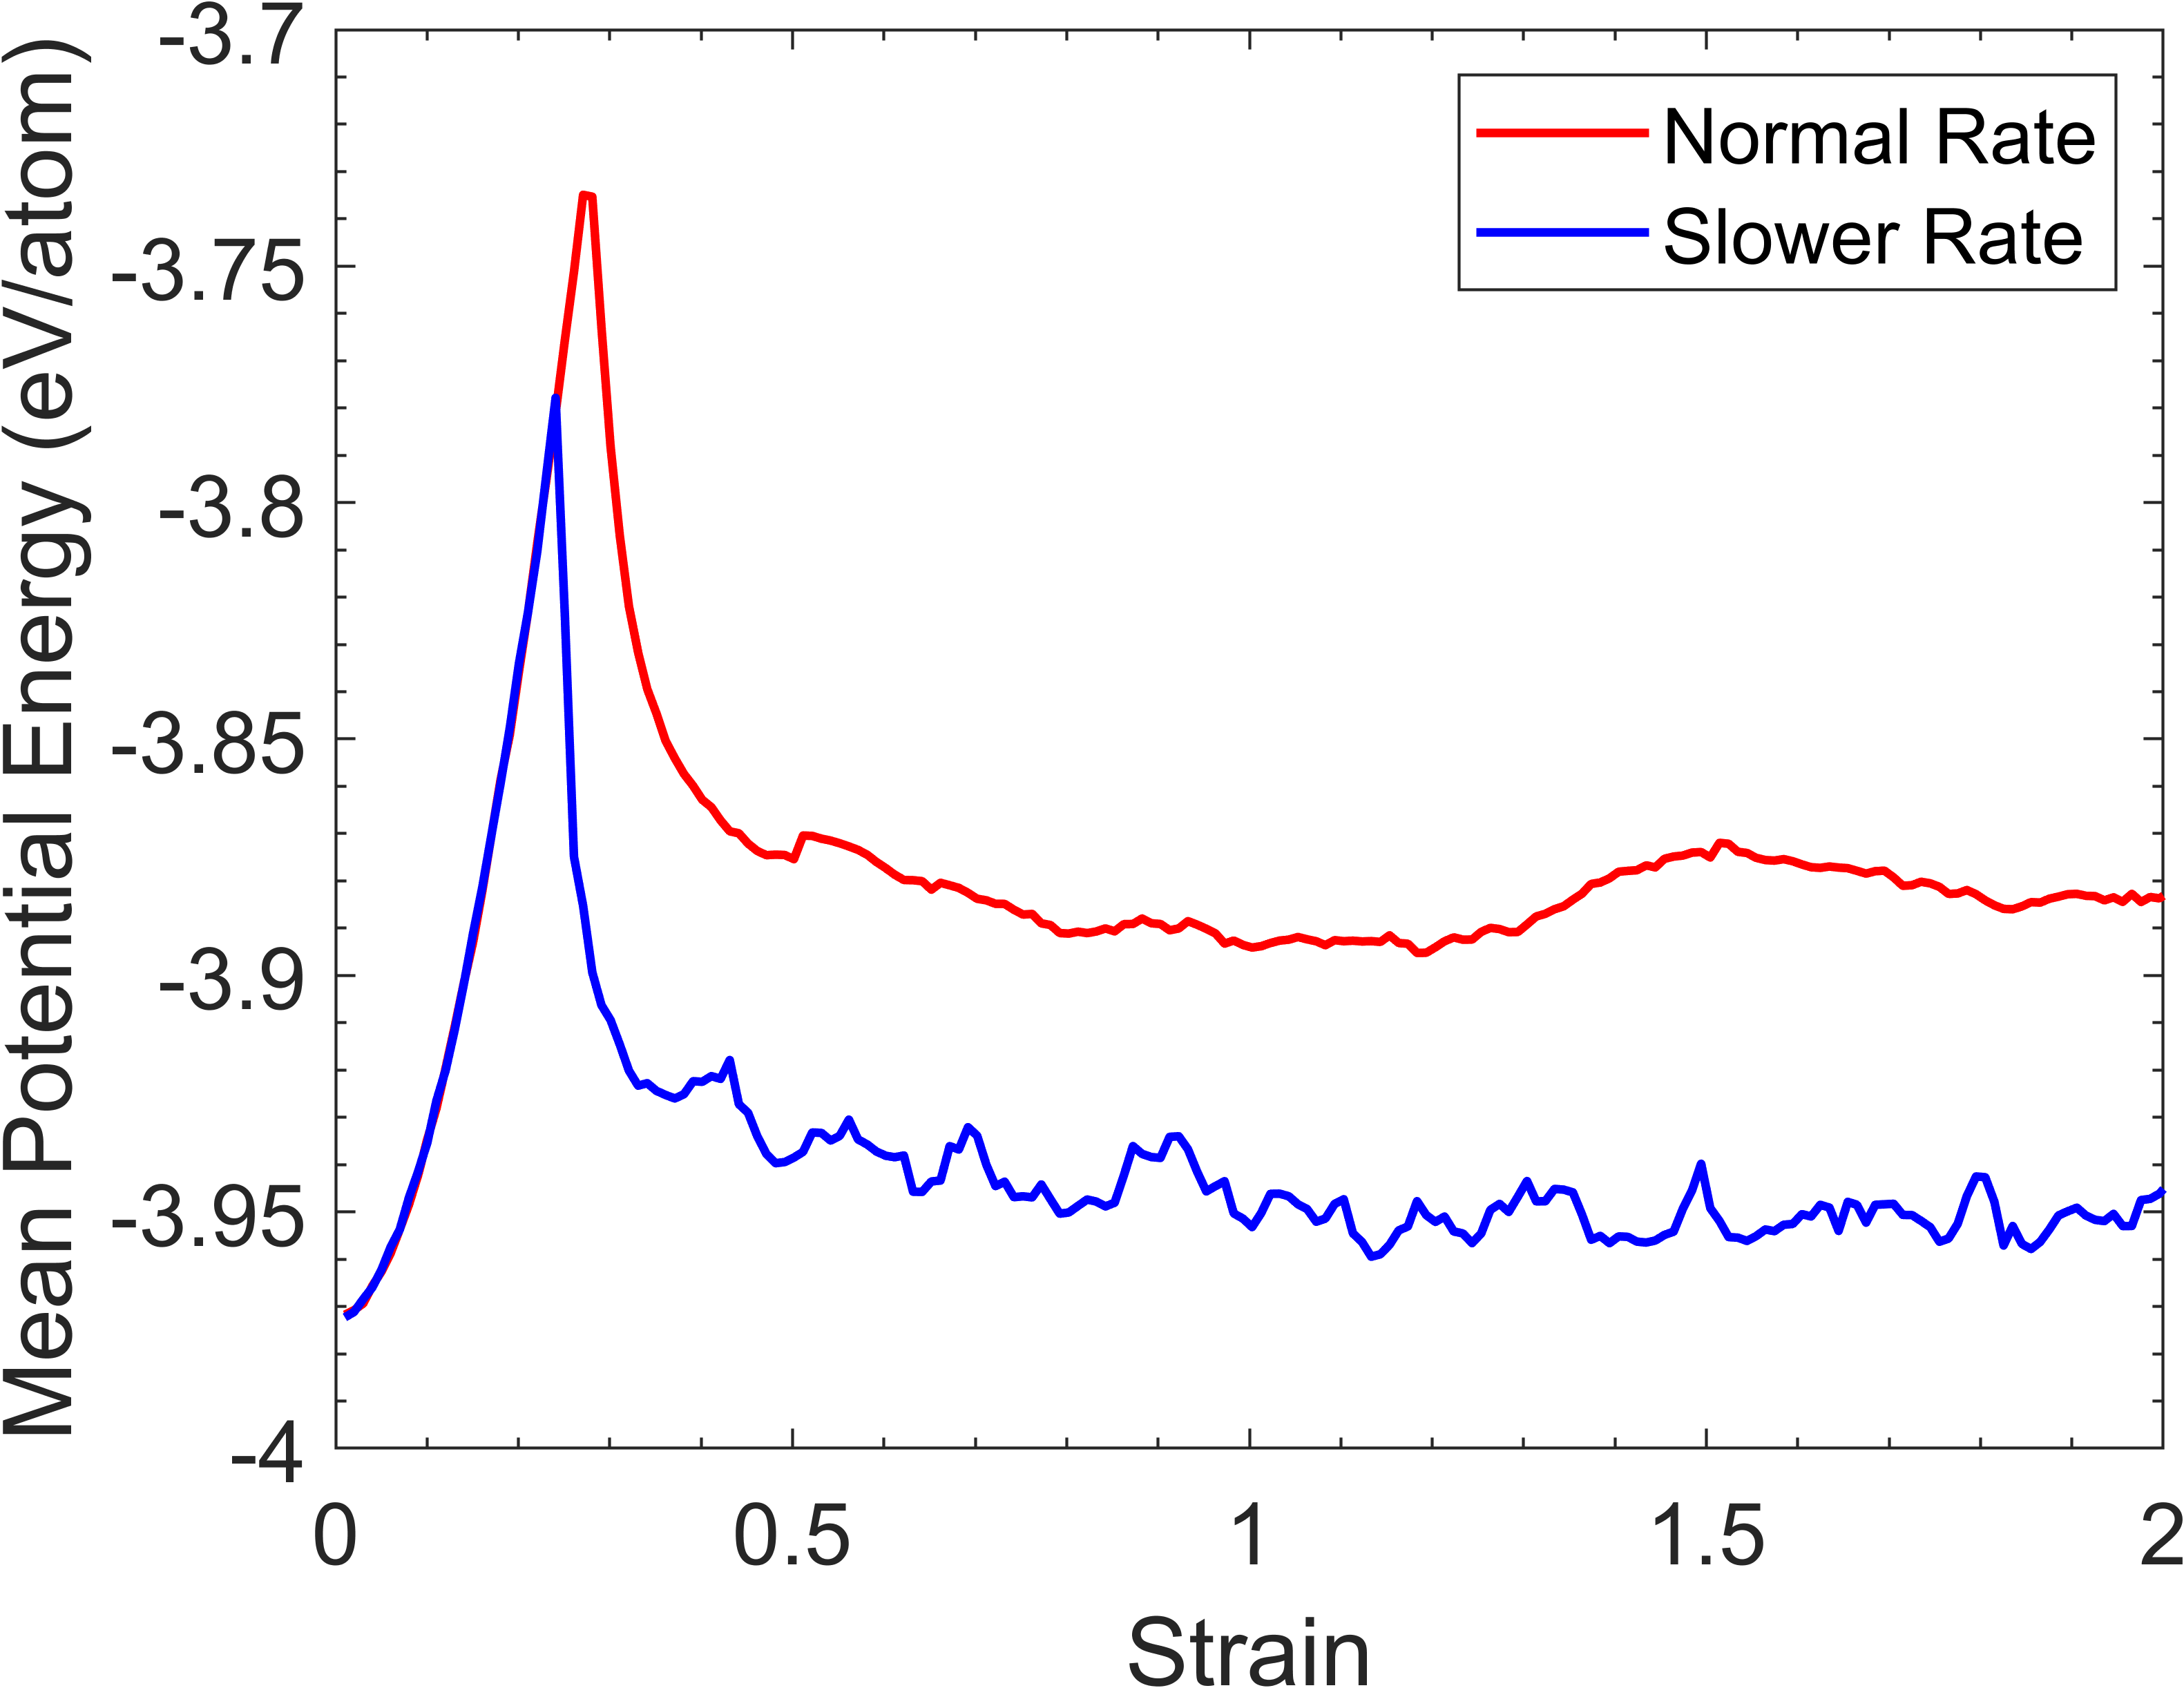
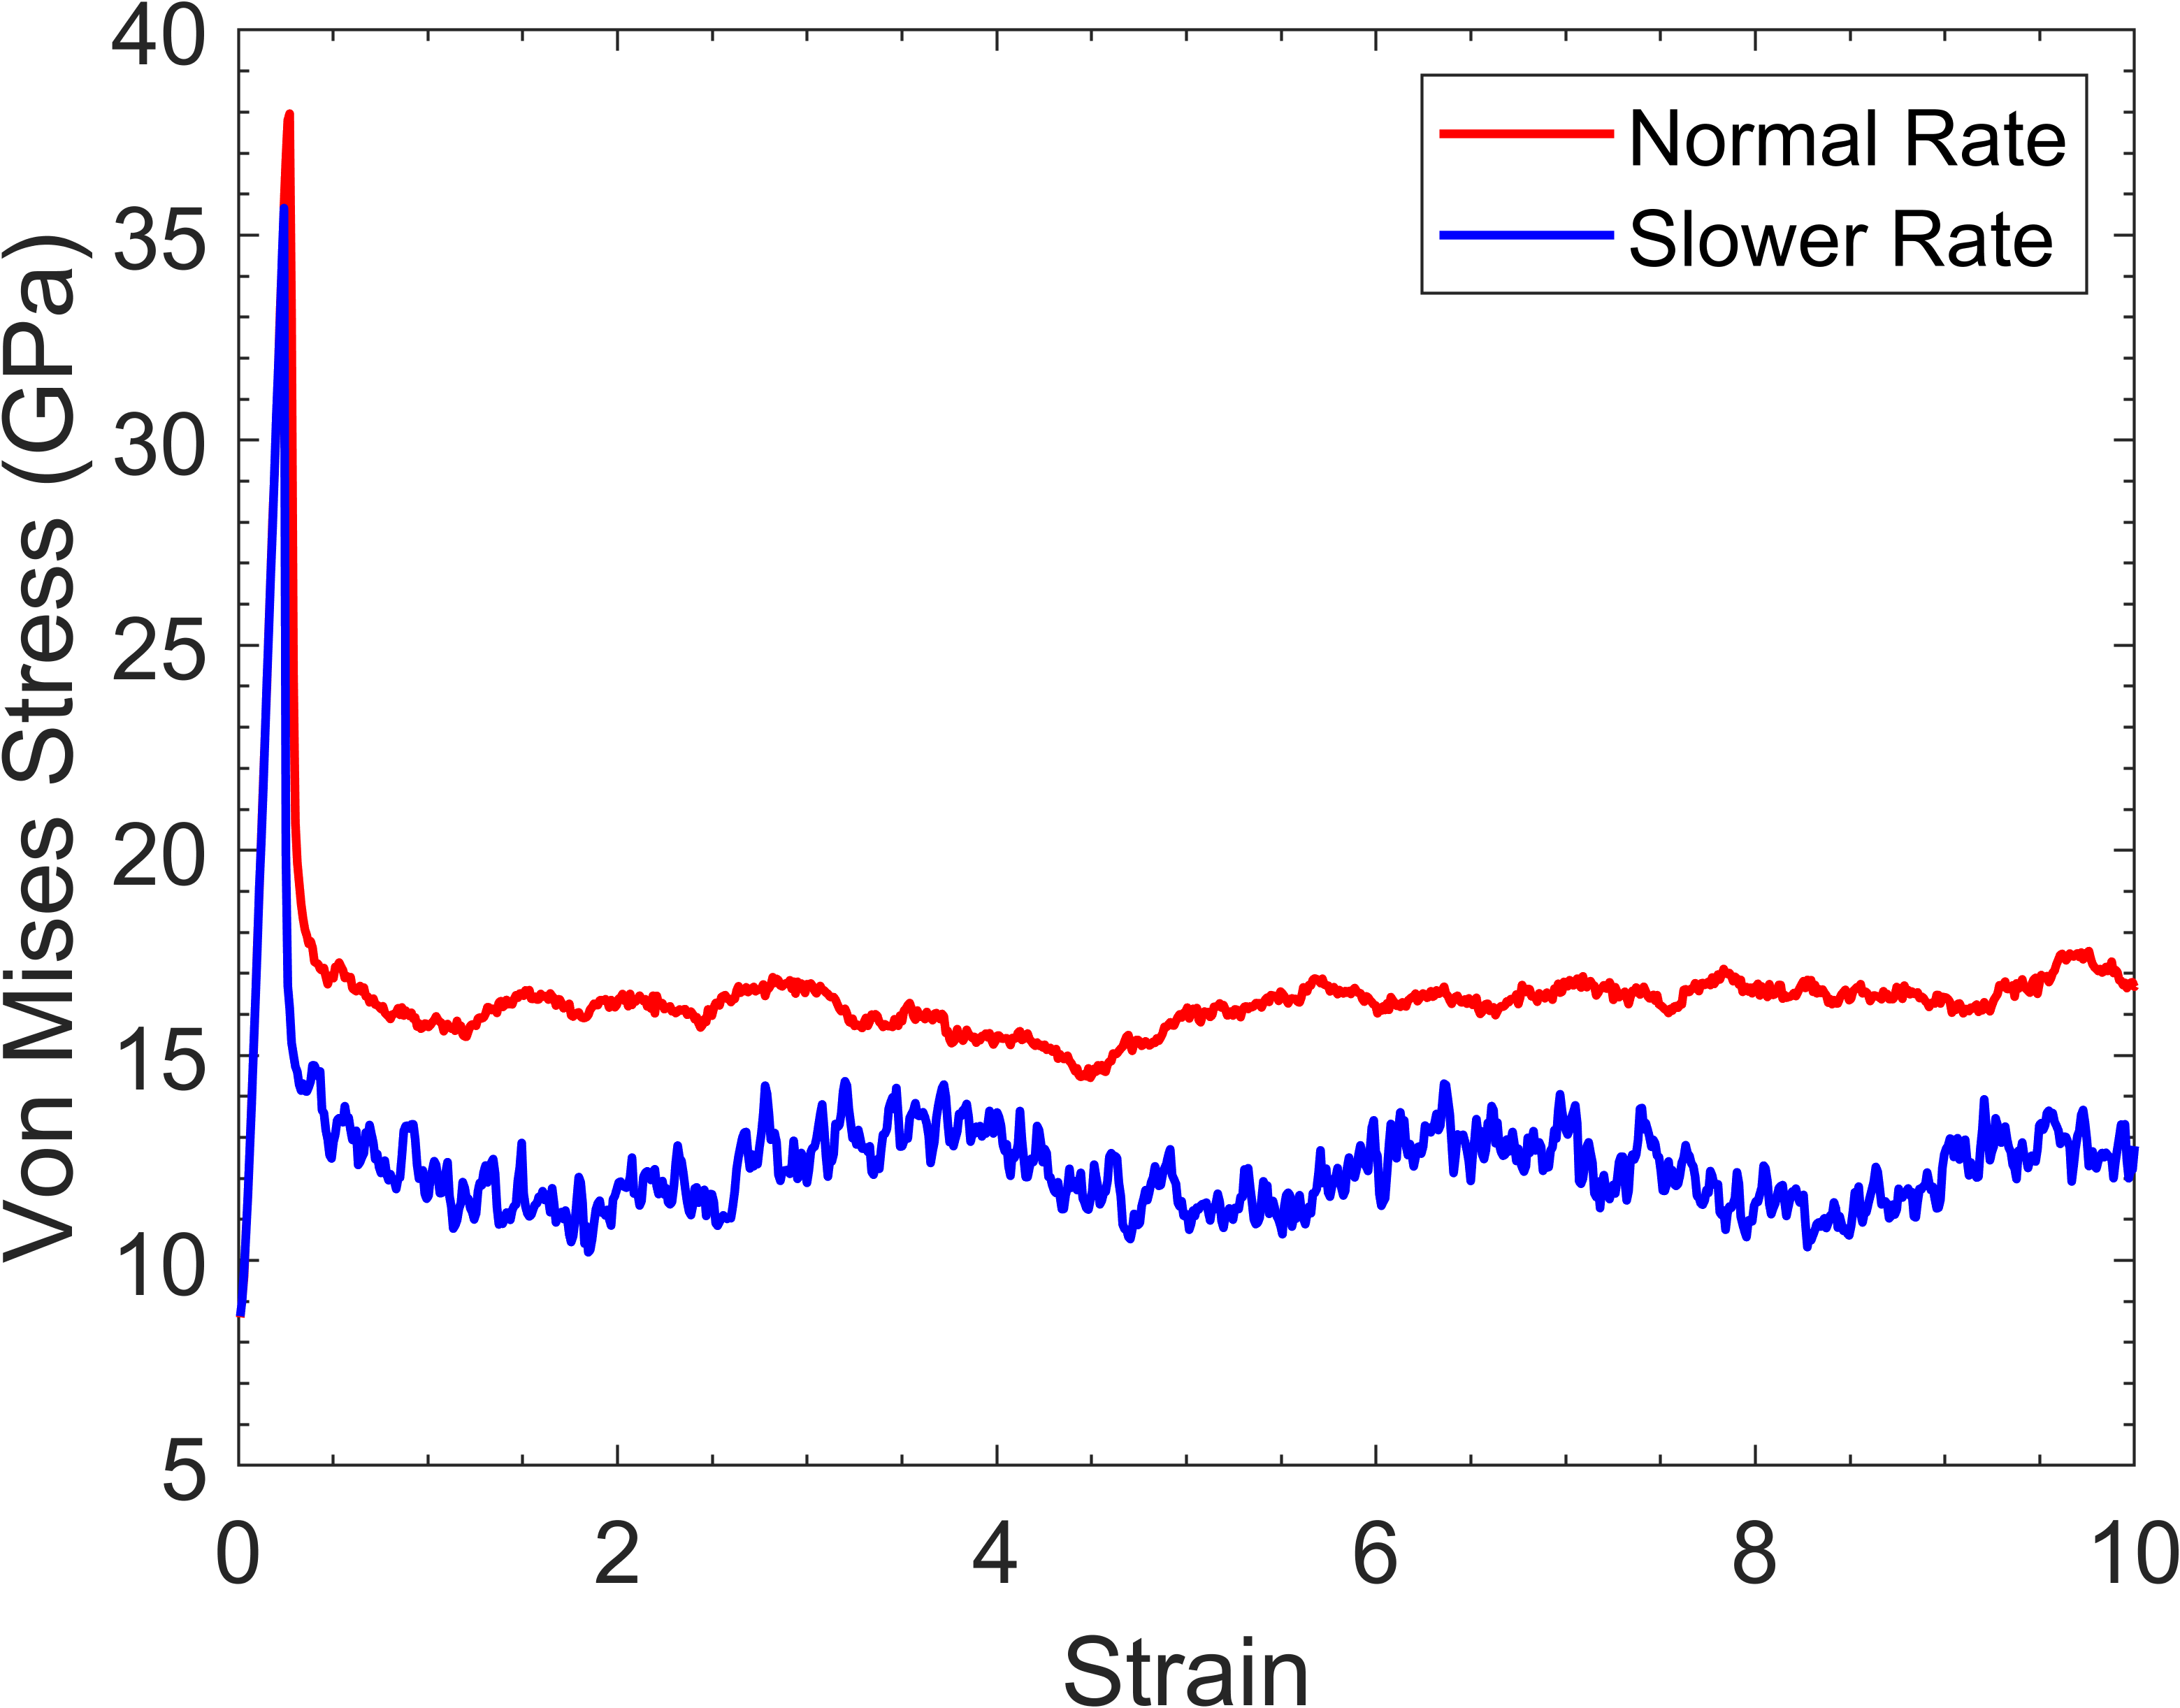
The difference in the potential energy is shown in Figure 11(c) and 11(d). Both simulations have identical trajectories in the initial stage. However, the slow rate simulation reaches the peak in potential energy at an earlier stage than the benchmark. The benchmark simulation peaks at -3.73 eV/atom at 0.27 strain, while the slow rate simulation peaks at -3.78 eV/atom at a strain of 0.24. This is followed by a rapid decrease for both simulations. The slow rate simulation decreases and plateaus at a lower potential energy, i.e. -3.95 eV/atom, than the benchmark, i.e. -3.89 eV/atom. The von Mises stress again correlates to the potential energy as shown in Figure 11(f).
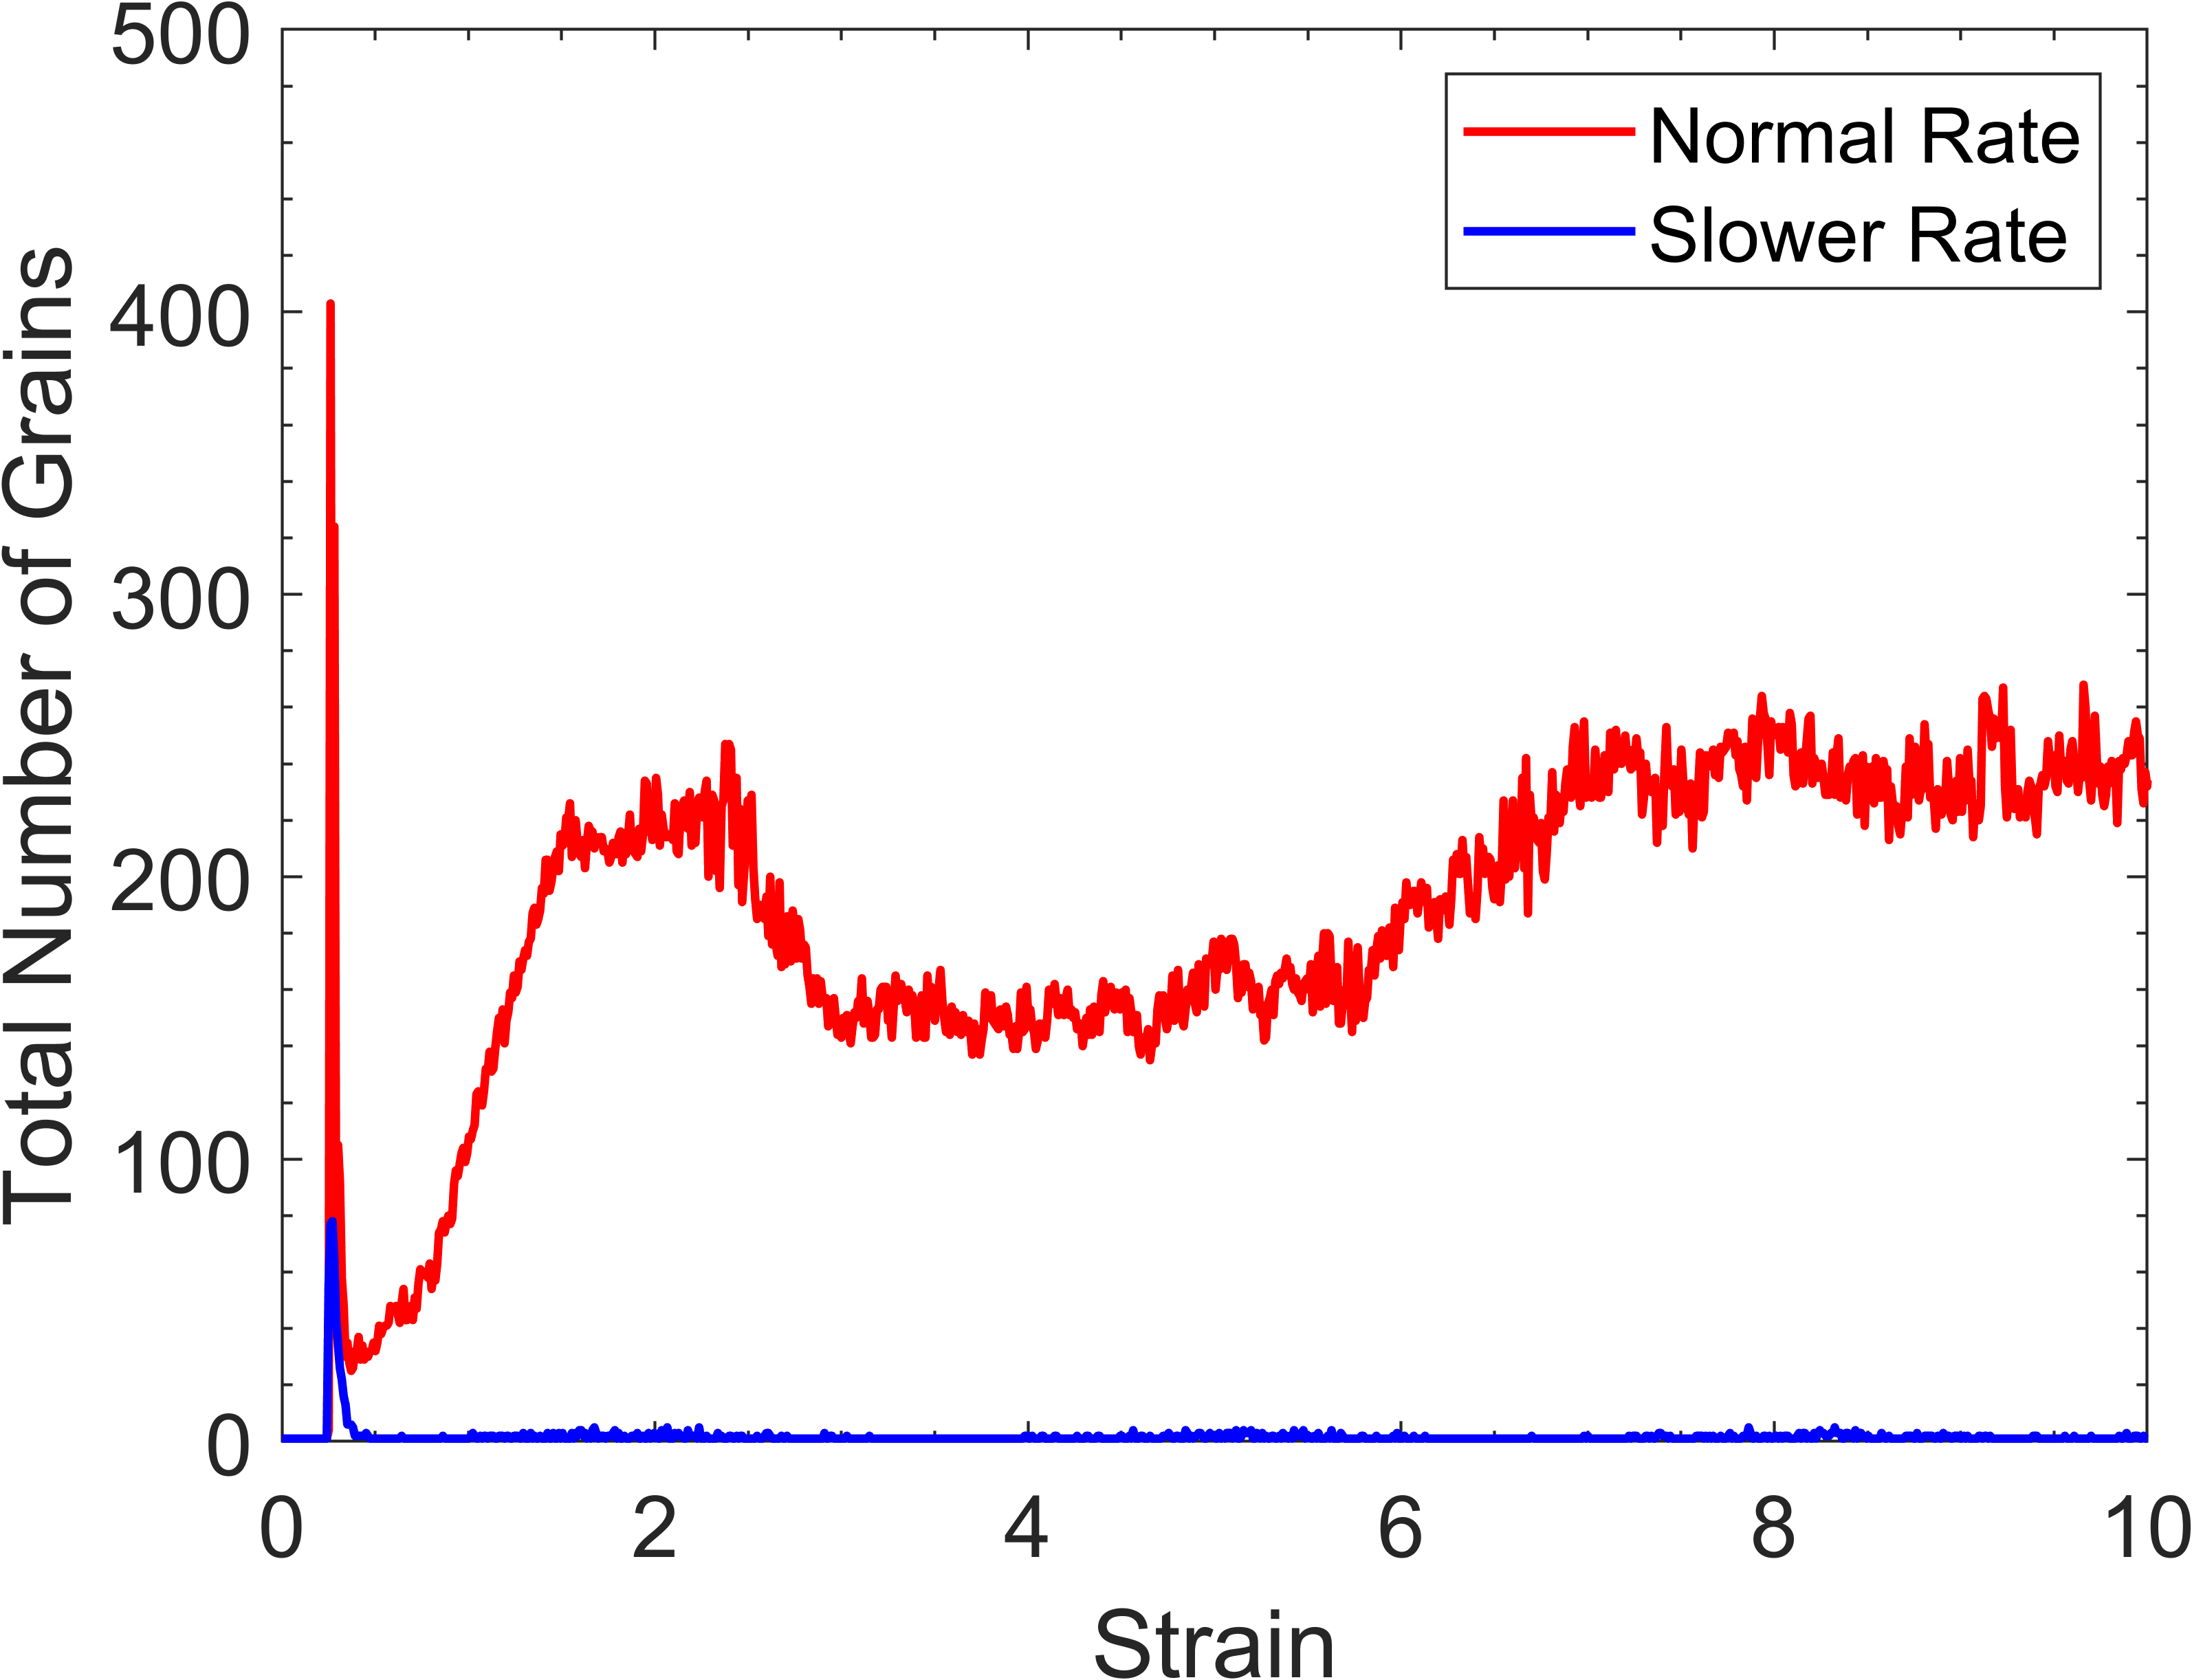
Though we can observe grain refinement in the benchmark simulation, this does not occur in the slow rate simulation, as shown in Figure 11(e). The previously observed large spike in grains for the benchmark simulation does not occur in the slow rate simulation. Whilst there is a smaller initial peak of 80 grains at 0.27 strain for the slower rate simulation, this does not result in the formation of a largely polycrystalline structure, and after 0.38 strain, a single grain is present. This is contrary to the data obtained for the benchmark, and other previously discussed simulations that experienced the generation of many nanocrystalline grains.
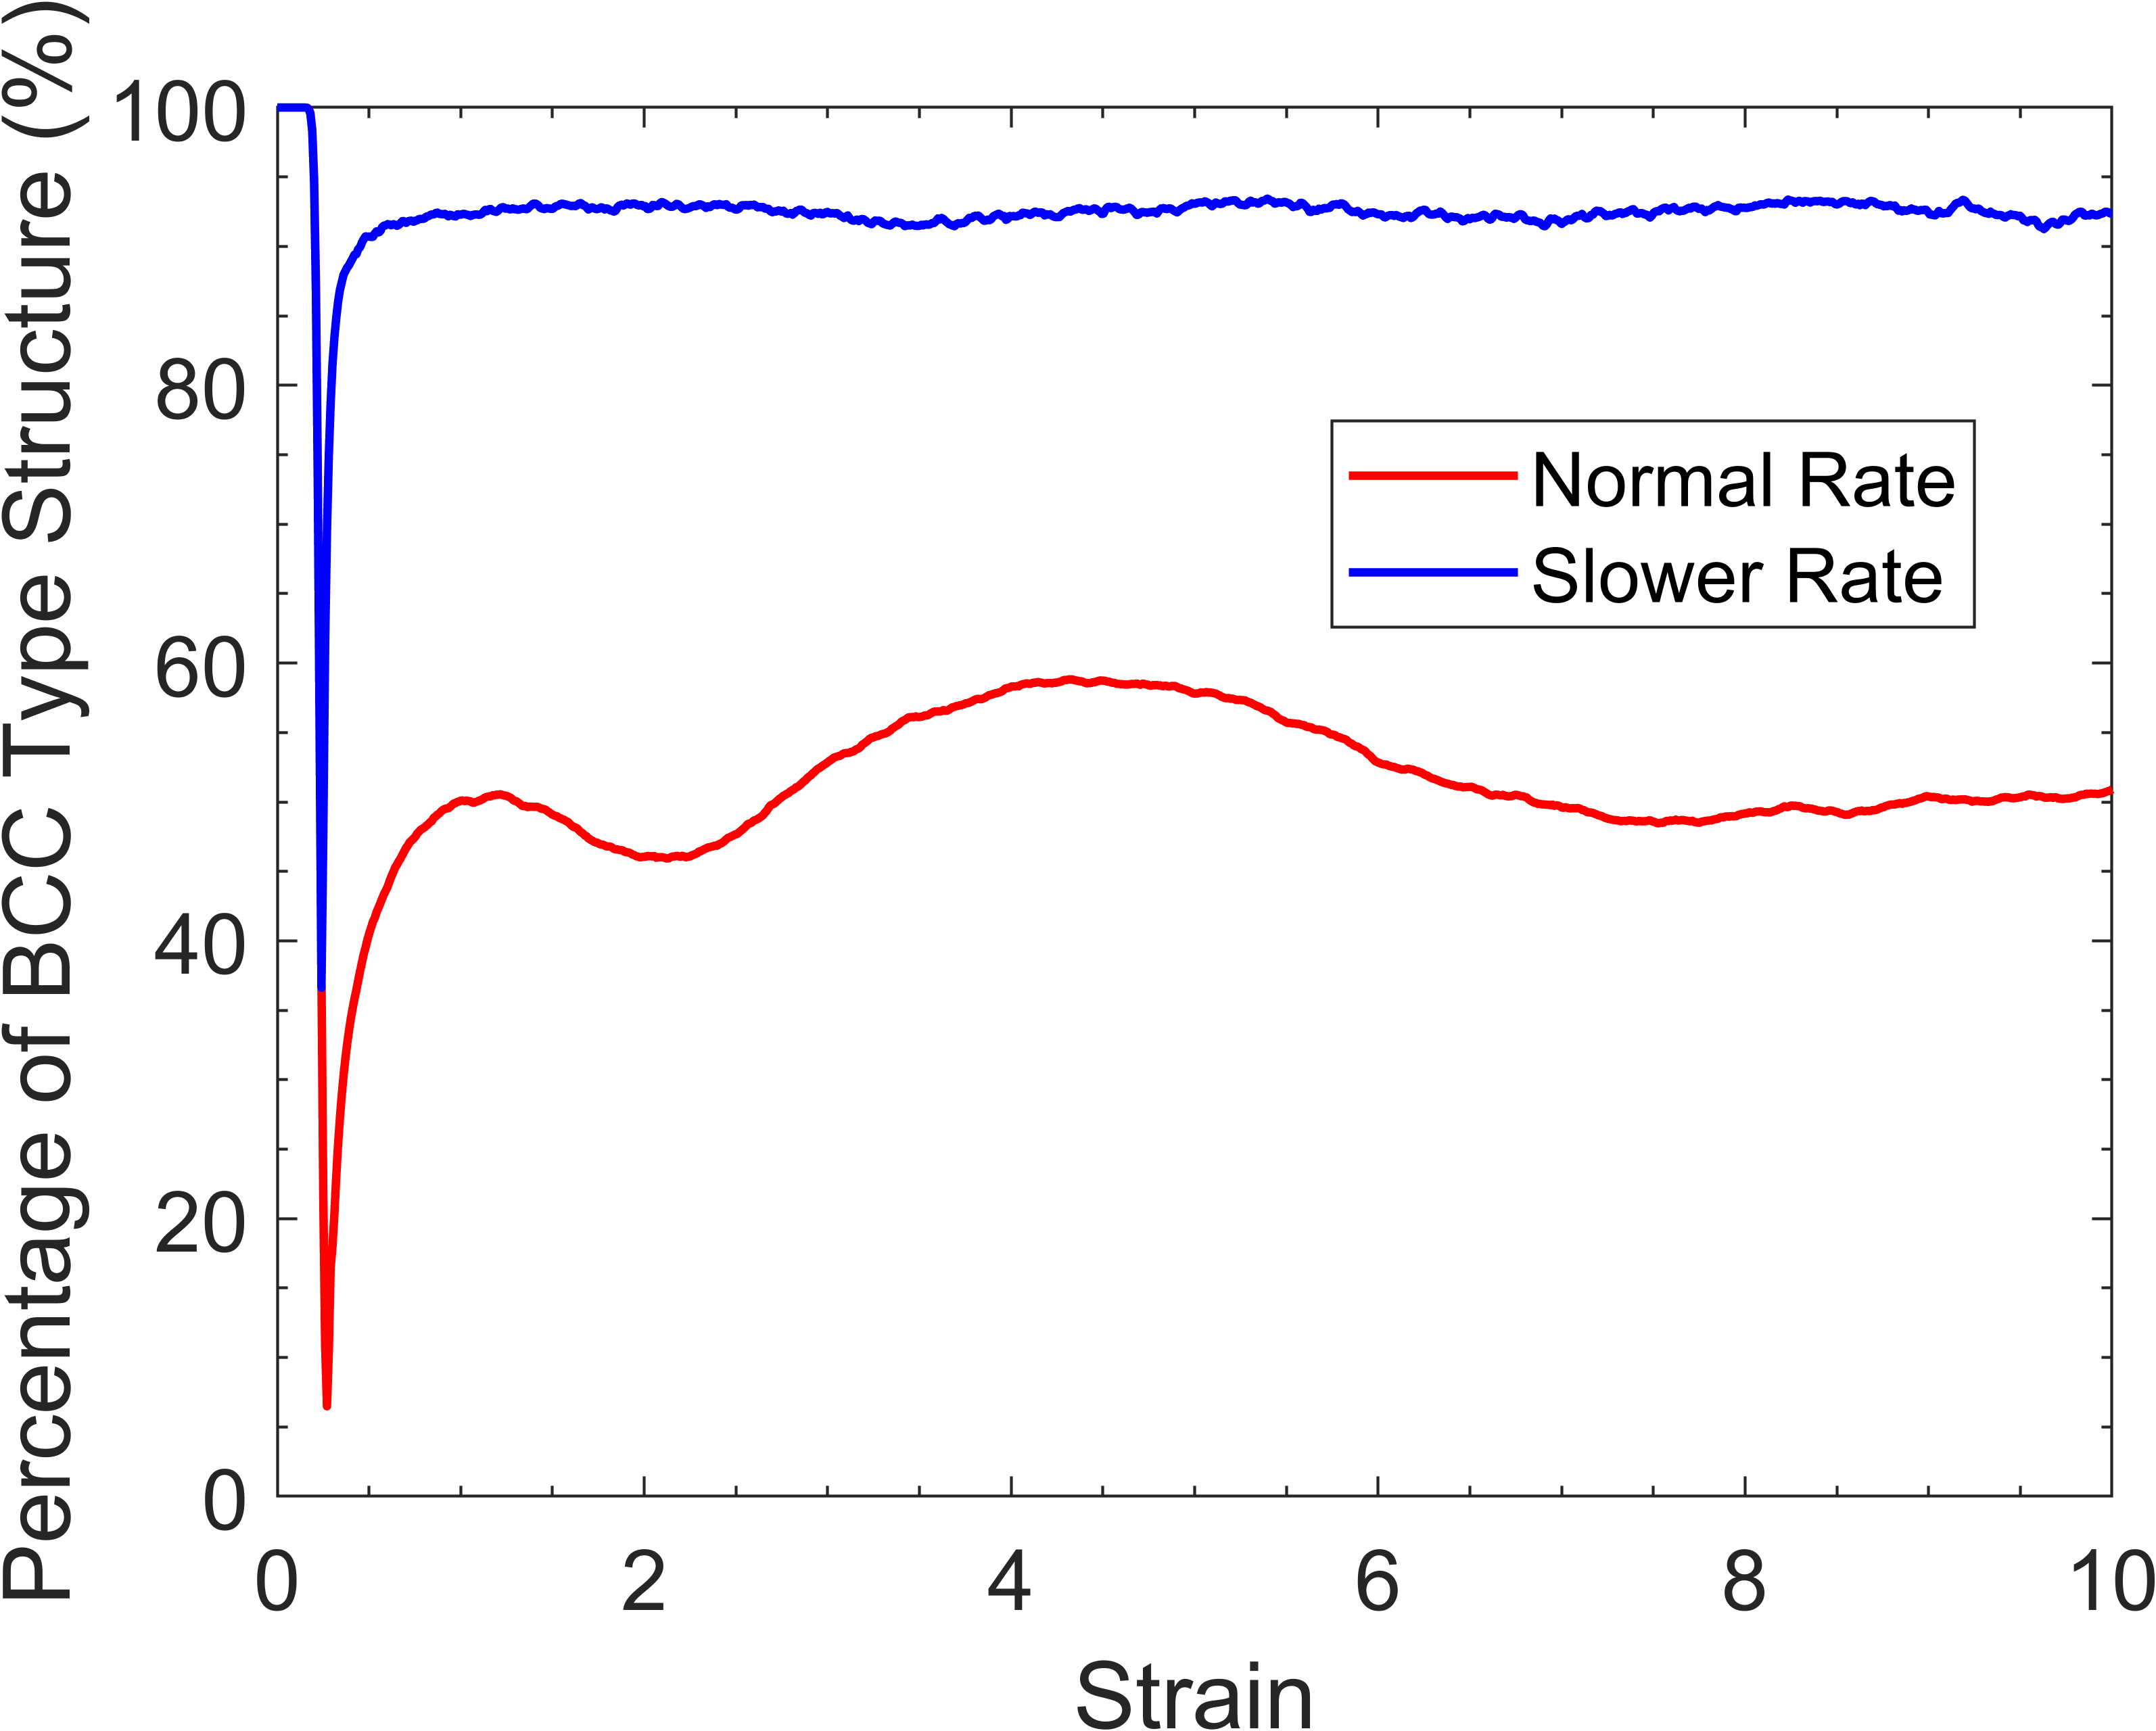
This difference is also inferred by Figure 12(c) which compares the percentage of atoms in the BCC phase as a function of strain. A highly disordered state is observed for the benchmark simulation at 0.27 strain, where only 7% of the atoms are in the BCC phase, followed by a recovery where around 50% of the atoms remain in the BCC phase. The slow rate simulation also experiences this disordered state, but to a lesser extent. At 0.24 strain, 37% of the atoms in the slow rate simulation are in the BCC phase, which is 30% more than the lowest benchmark value. Furthermore, the vast majority of the atoms regain their BCC phase, with the percentage of BCC atoms plateauing at around 93%. This is logical as the structure in the slow rate simulation is largely a single crystal, and there are no grain boundaries in the highly disordered state.
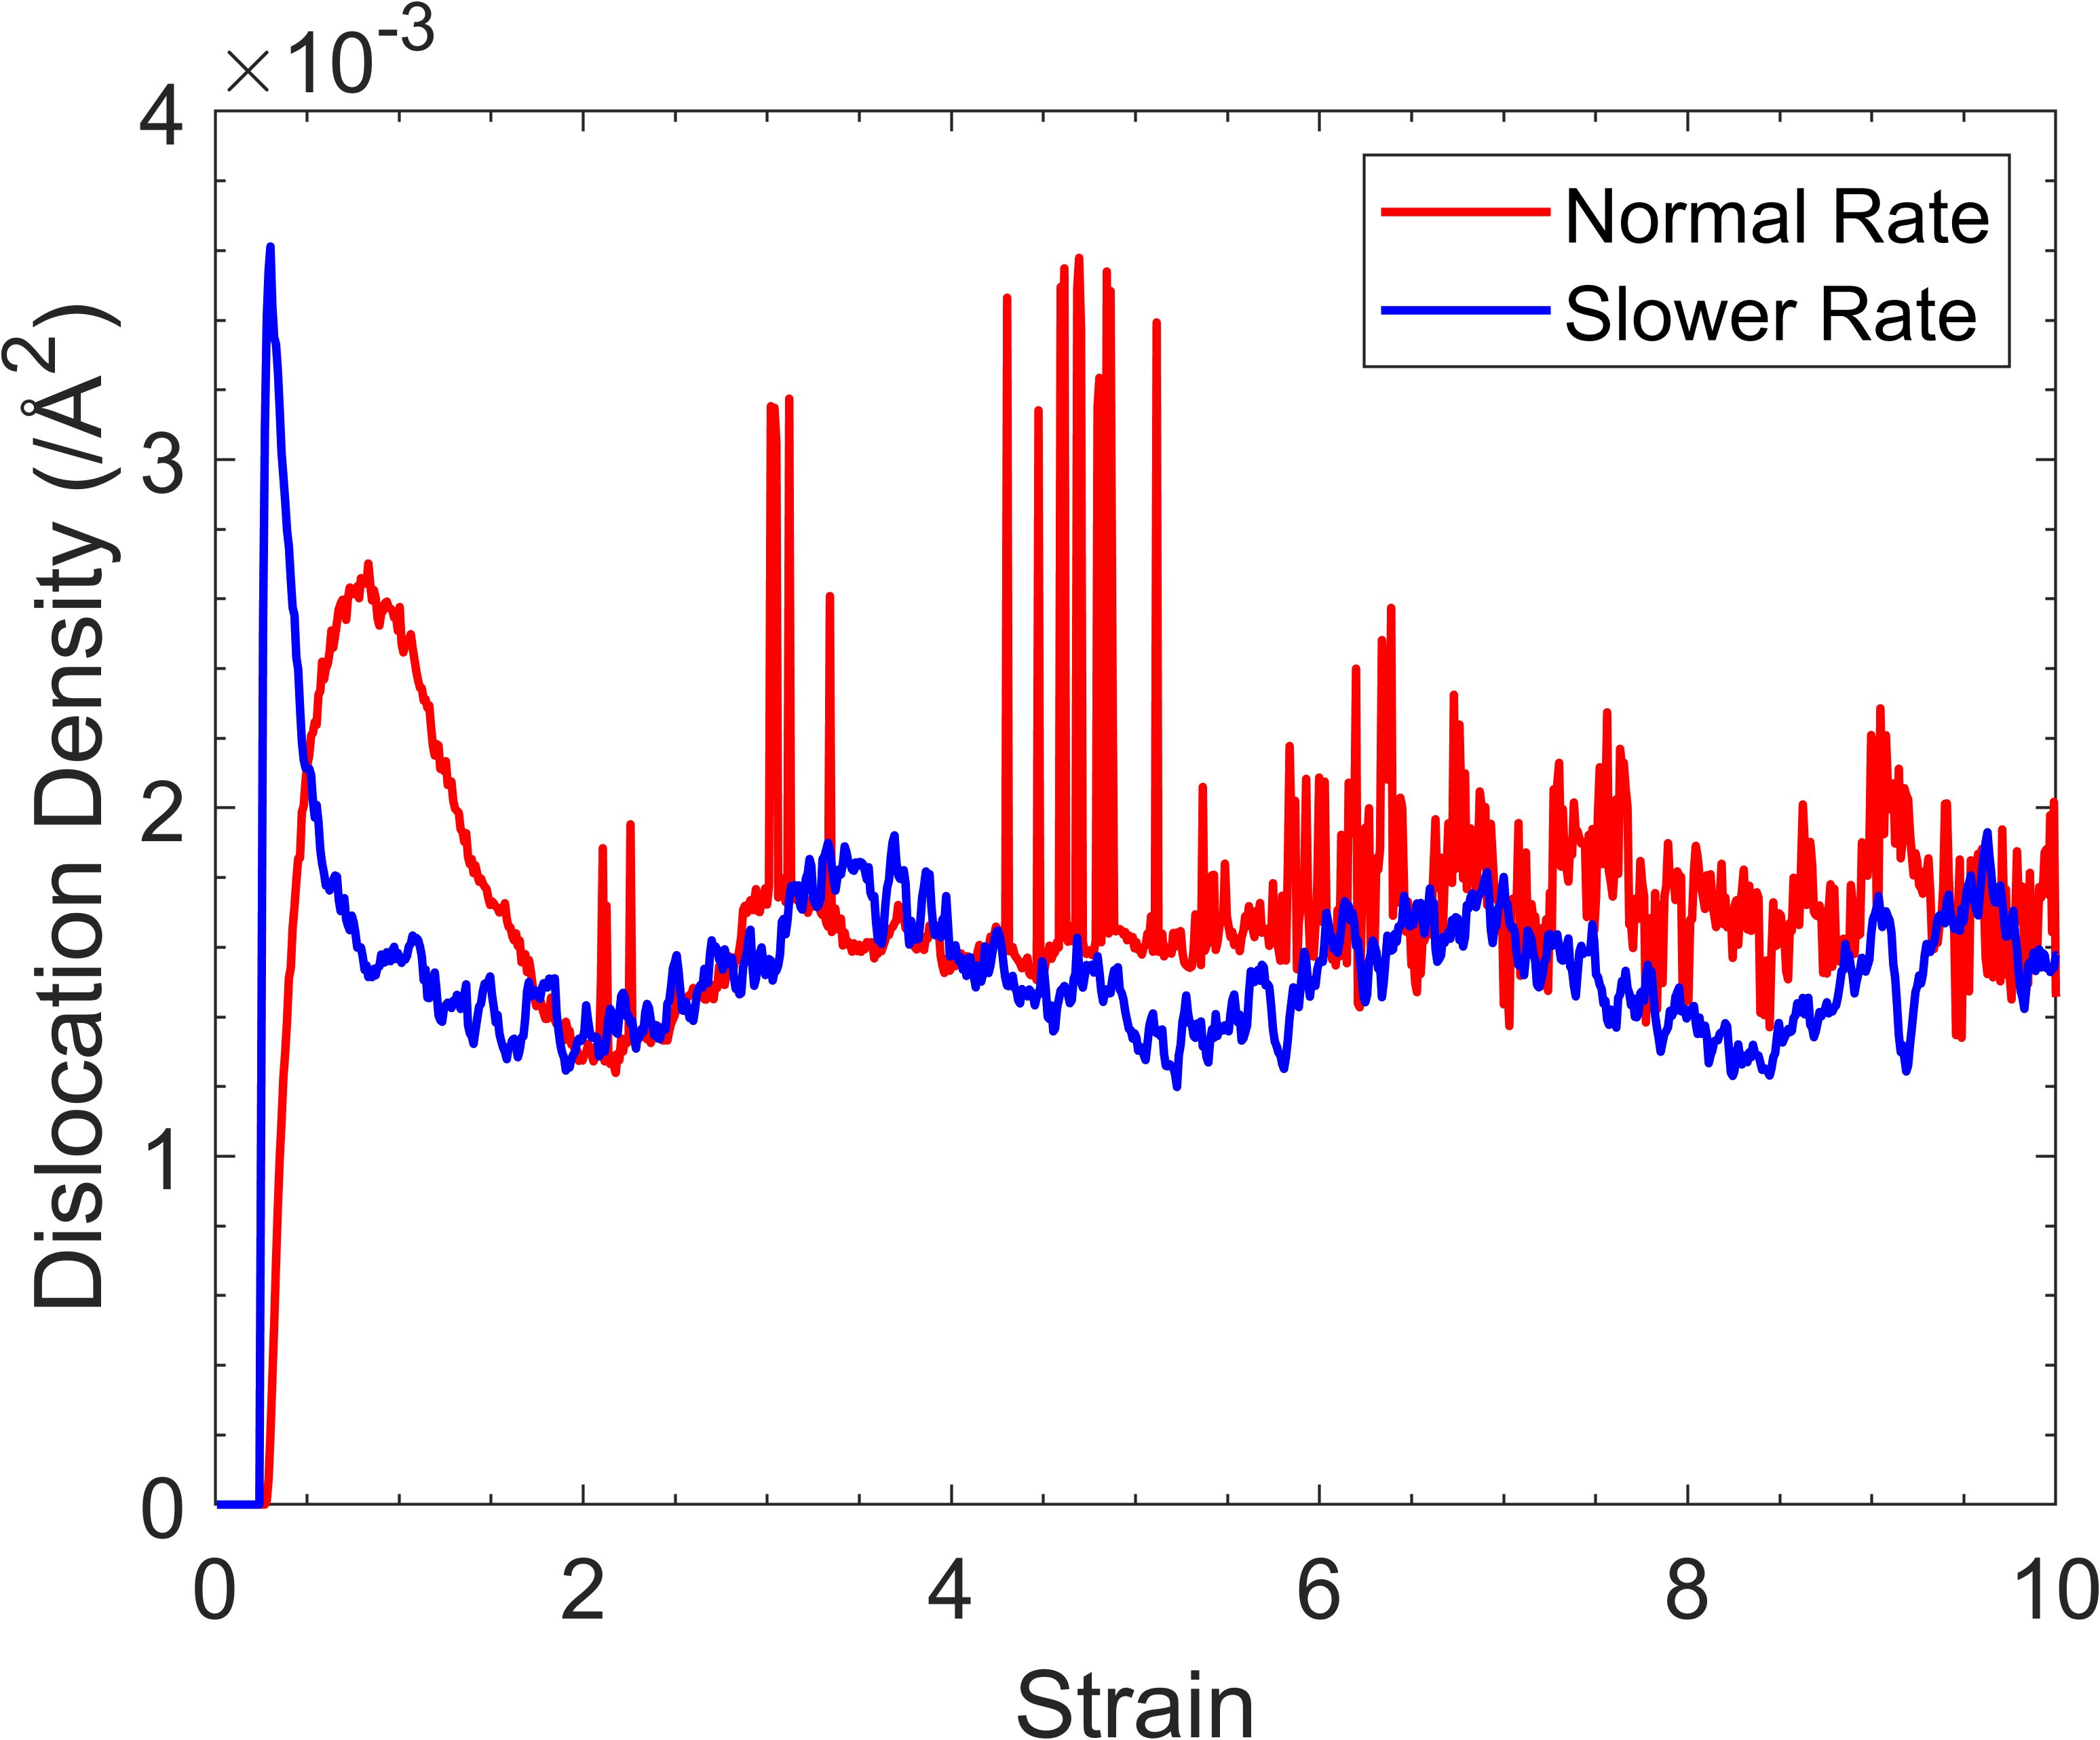
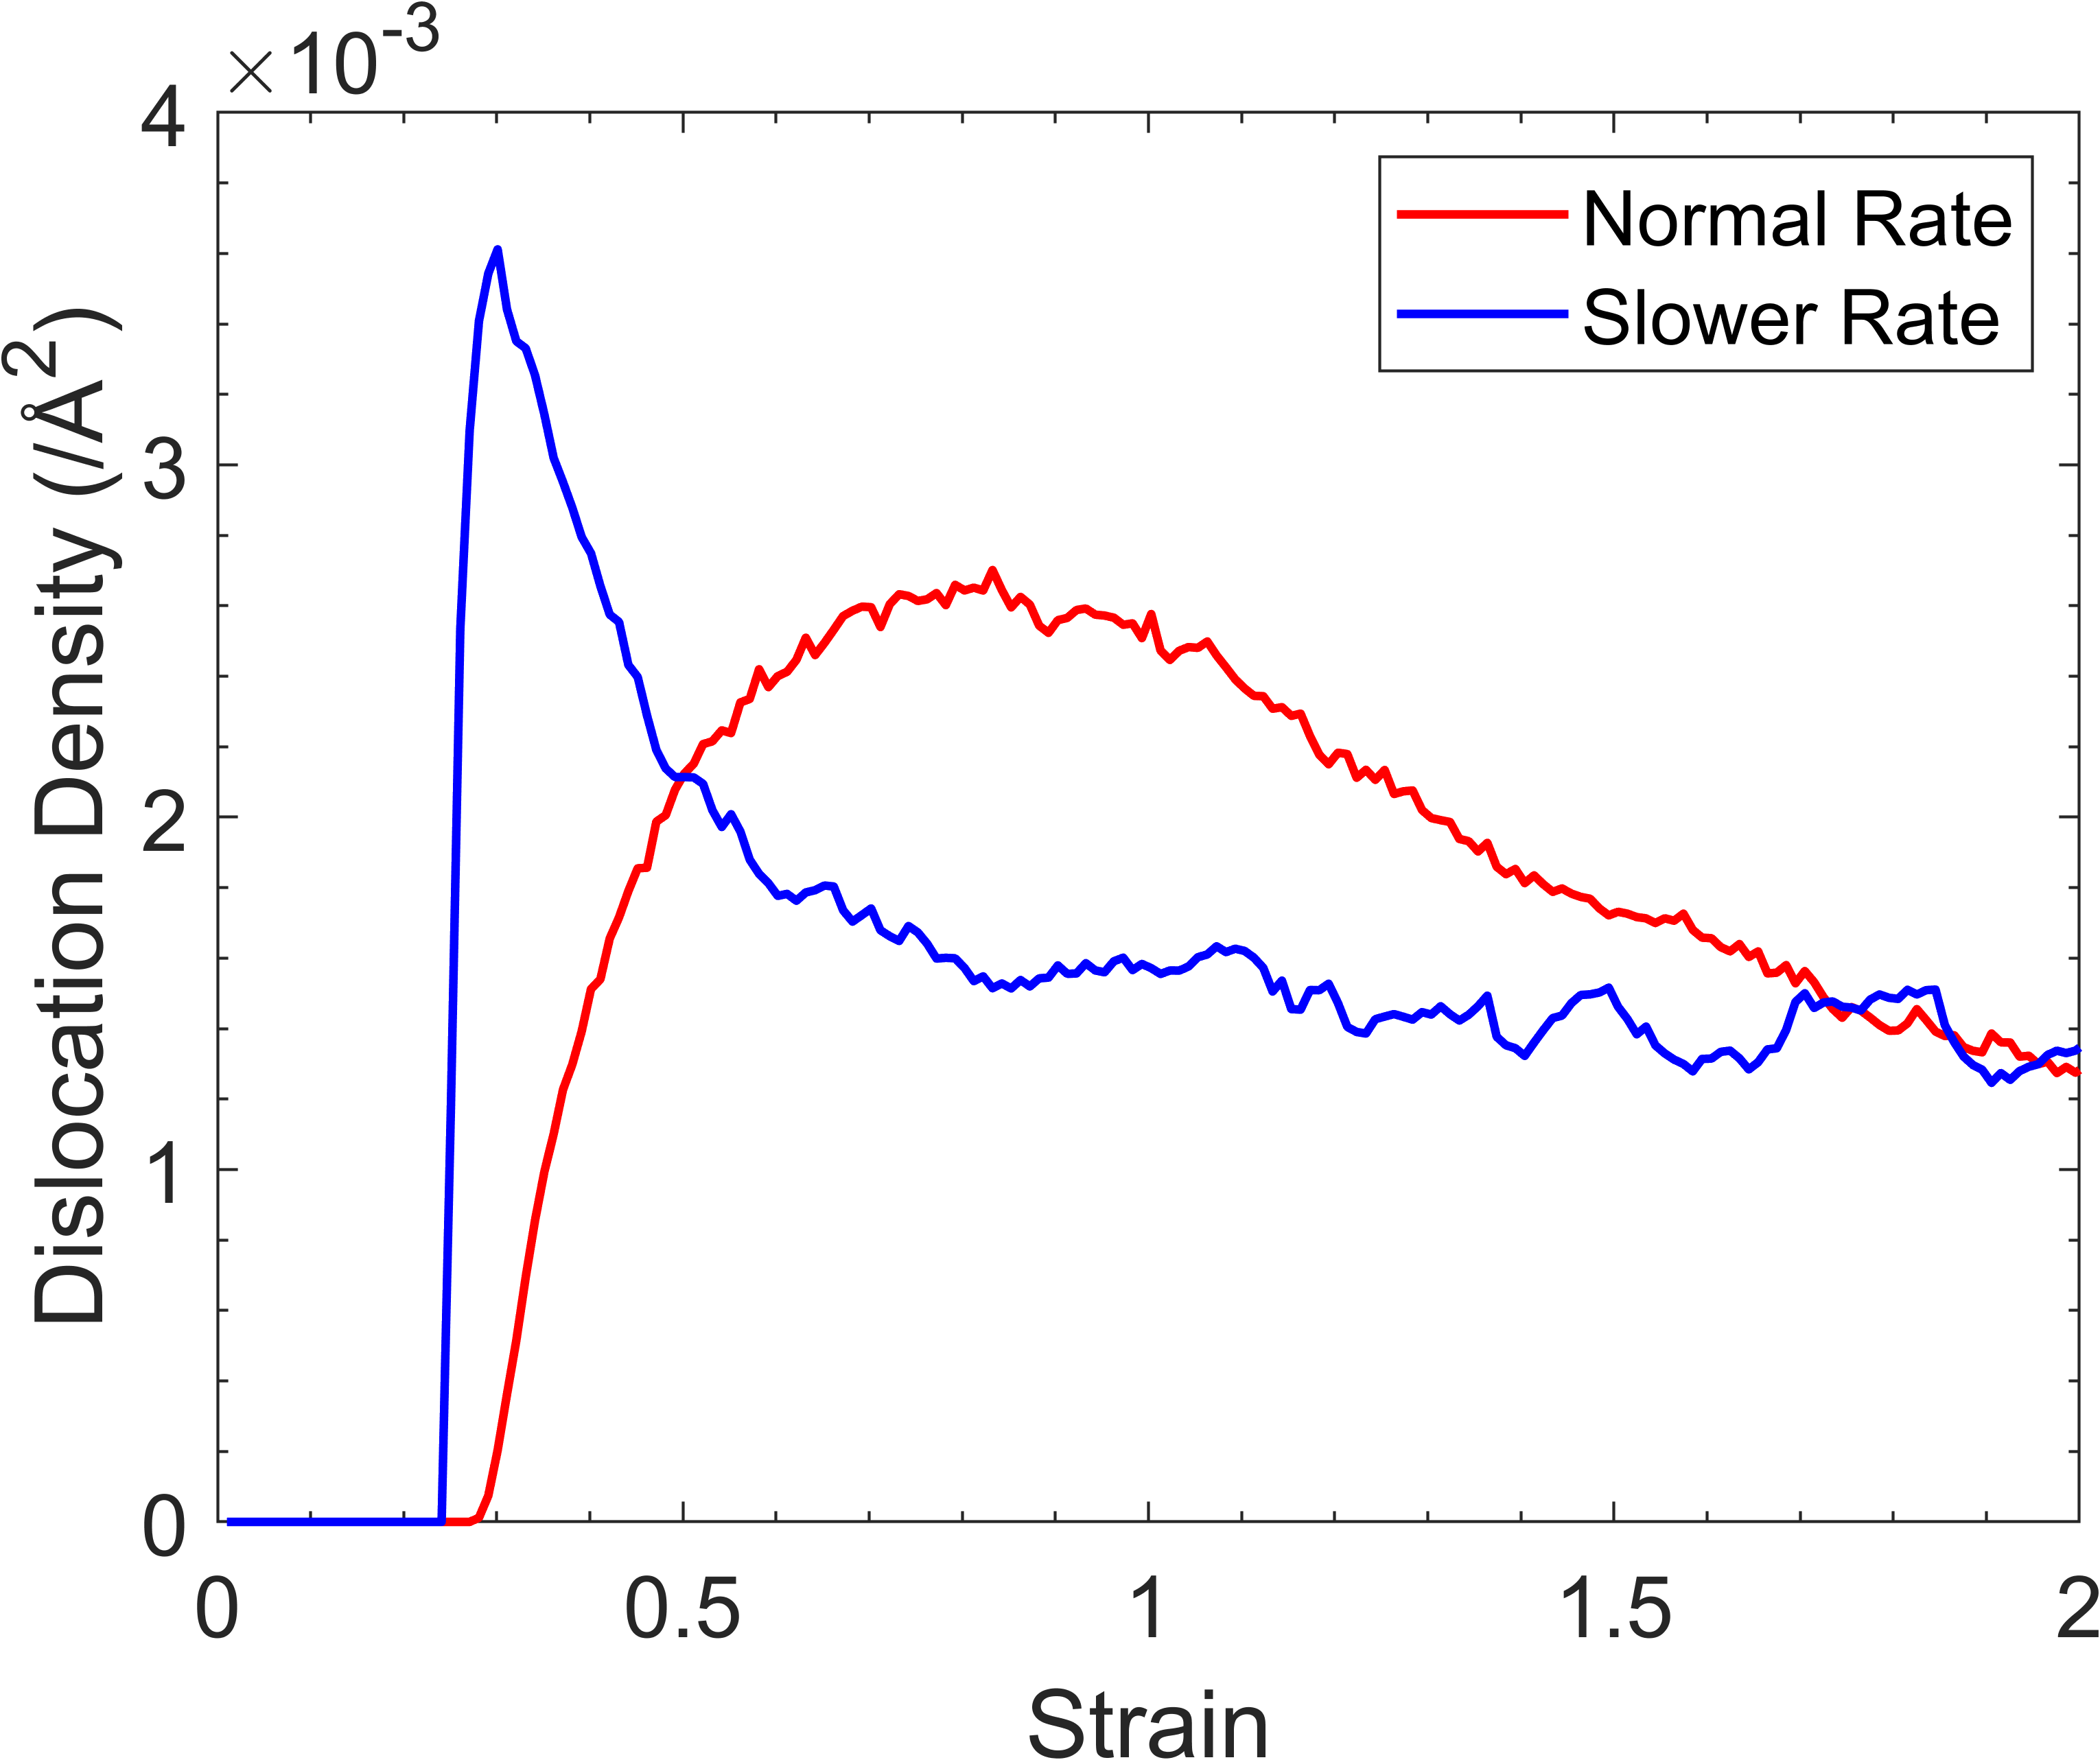
Several differences between the simulations are observed when analysing the dislocation densities in Figure 12(a) and 12(b). After a shear strain of 0.27, the dislocation density for the benchmark simulation gradually increases up to Å2 at 0.82 strain, after which it decreases to Å2 at around 2 strain before plateauing at Å2. However, in the slow rate simulation, dislocation densities show a rapid increase to Å2 at 0.3 strain followed by a decrease to around Å2 at 1.6 strain. After this point, the dislocation densities for the simulations stay fairly similar, with the benchmark simulation having a slightly higher dislocation density with continued shearing.
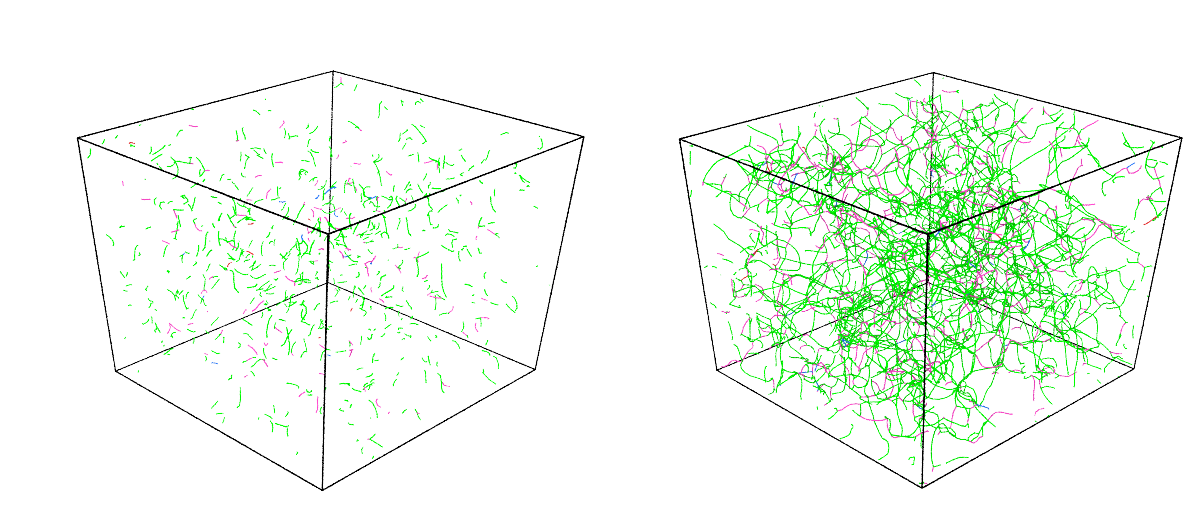
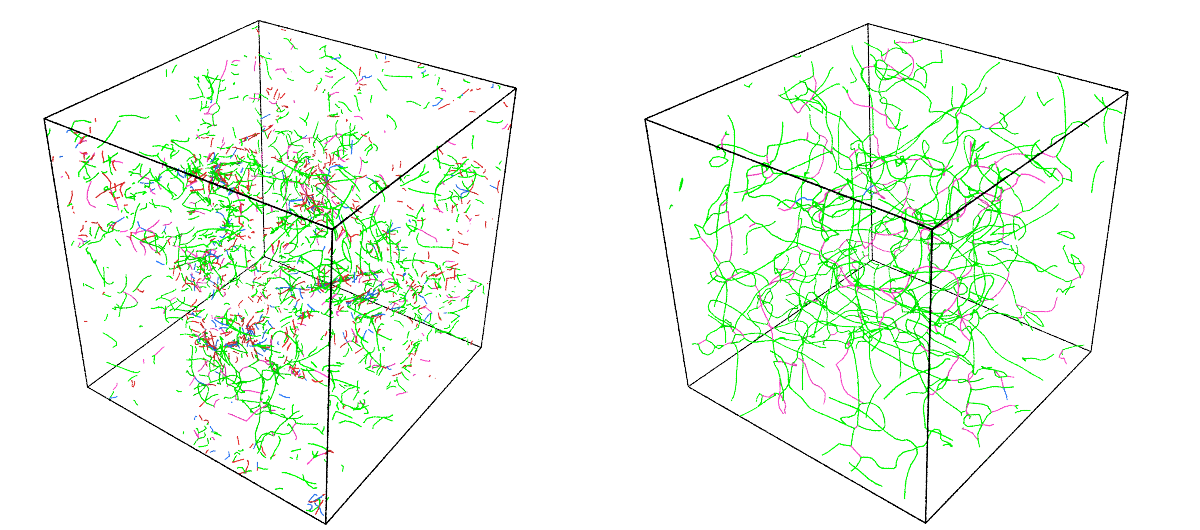
A visual representation of dislocation density is shown in Figure 13 in pairs. The left-hand side is the benchmark simulation, while the right-hand side shows the slow rate simulation. Dislocations are colour-coded in the same way as in Figure 3. During recrystallisation, in Figure 13(a), the benchmark simulation shows few dislocation lines, and they are sparse and disconnected. However, in the slow rate simulation, the dislocation density is much higher with a dislocation network being formed. This is in agreement with Figure 12(b) which depicts a large dislocation density at recrystallisation for the slow rate simulation compared with the benchmark.
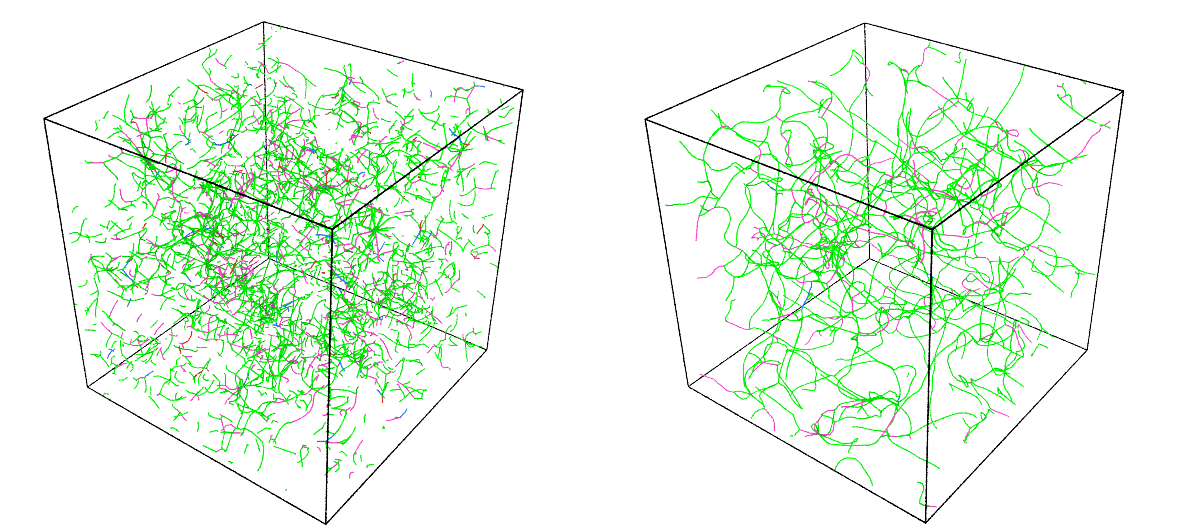
At (Figure 13(b)), a significant increase in dislocation density is observed within the benchmark simulation. In contrast, the slow rate simulation cell displays a reduction in dislocation density, consistent with Figure 12(b). From 1 strain (Figure 13(b)) to 10 strain (Figure 13(e)), the dislocation pattern in each simulation persists. The benchmark simulation shows short dislocation lines, with dislocation pile-ups attributed to grain boundary interactions. In contrast, the slow rate simulation displays long dislocation lines, that form an extensive dislocation network. This behaviour persists due to the absence of grain boundaries constraining dislocation motion within the slow rate simulation cell.
These observations can be rationalised as follows: the slow rate simulation does not show the formation of nanocrystals. During the initiation of plastic deformation, many dislocation loops are formed, which causes a spike in dislocation density, as seen in Figure 13(a). These loops do not form in the benchmark simulation due to the presence of highly disordered atoms that manifest as grain boundaries. Polycrystalline grains limit the volume in which the dislocations can form, resulting in the short dislocation lines observed in the benchmark simulation. With increased strain, the dislocations in the slow rate simulation are allowed to evolve and are not annihilated, as there are few grain boundaries. Instead, as shown in Figure 13, they combine and form a large network of extended dislocations. The presence of grain boundaries does not permit this phenomenon to occur in the benchmark simulation, so short dislocations are observed.
We may speculate about the reason why the slower strain rate simulation does not experience the same nanocrystal formation as the benchmark simulation. The kinetic increases less in the slow rate simulation, which could point to fewer atoms being able to accelerate within the lattice. As such, many atoms will retain their original structure, which is confirmed by Figure 12(c). This increase in kinetic energy comes at a lower strain for the slow rate simulation, which results in a smaller increase in potential energy. Ultimately, this means that fewer atoms reach the disordered state in the slow rate simulation. It appears that, with increased strain, it is more energetically favourable for the atoms to recrystallise back into a single crystal structure rather than a polycrystalline one.
The DRV mechanism appears to be present in the slow rate simulation, as the longer time scale gives dislocations more time to recover [77]. As a result dislocations are less likely to pile up, and thus do not form grain boundaries, limiting grain refinement. It is also possible that the dislocations are simply unable to pile up, because the large dislocation network, on different slip planes, impedes extended dislocation glide [78]. As dislocation motion becomes constrained, the formation of LAGBs and thus, further grain refinement, are inhibited.
Experimental works suggest that a lower strain rate correlates to a larger mean grain size [66, 64] and it is possible that the present simulation cell size is the limiting factor. In the future, it may be beneficial to carry out such shearing simulations with a much larger number of atoms to ascertain whether this is the case.
III.5 Carbon Impurities
At which point, may one consider the carbon impurity content to be negligible? Some sources point to a maximum carbon content of 0.006% [79] whilst others argue that a carbon content as low as 0.001% can already immensely affect the properties of iron [80]. Ferritic/martensitic steels that have been selected for fusion applications typically contain less than 0.15% carbon [81]. The atomic size of carbon is small enough that the atom can enter the iron lattice as an interstitial solute atom [82]. Experiments showed that carbon can greatly influence the microstructural behaviour of iron. For example, Stein [83] showed that the dislocation velocity exponent increases in iron with an increase in carbon content when held at room temperature. This alters the yield point and rate of crack propagation within the material. Molecular dynamics simulations have also been carried out which show the effect of carbon interstitials. Carbon atoms can block dislocation motion in an iron simulation cell [84].
In the current work, we inserted 102 carbon atoms into the simulation cell, that is 100 appm or 0.01 atomic %. We attempt to understand the effect of carbon interstitial atoms on the formation of nanograins under shear strain in iron.
Figure 14 shows various simulation properties with and without carbon impurities. Figure 14(a) shows the differences in kinetic energy between the simulations. The benchmark simulation experiences a rapid increase in kinetic energy, from 0.039 eV/atom at 0.27 strain, to 0.072 eV/atom at 0.3 strain, before rapidly decreasing and plateauing at 0.042 eV/atom. Similarly, the kinetic energy for the carbon-containing simulation increases from 0.039 eV/atom at 0.27 strain, to 0.067 eV/atom at 0.3 strain, before rapidly decreasing. Hence, the difference in maximum kinetic energy between the simulations is around 0.005 eV/atom.Furthermore, both simulations experience kinetic energy reductions to 0.043 eV/atom at 0.32 strain. After this point, both kinetic energies remain very similar, with only minor differences between them.
In Figure 14(b), the behaviour of the potential energy is nearly identical for both simulations up to 1 strain. Both cells experience a rapid increase from 0 strain, followed by a rapid decrease at 0.27 strain, to a value of around -3.89 eV/atom at around 0.82 strain. However, the potential energy of the carbon-containing simulation increases again from this point, reaching -3.85 eV/atom at , before decreasing slightly, and once again increasing to -3.84 eV/atom at . This trend is also shown in Figure 14(d), which shows the von Mises stress for both cells.
Figure 14(c) shows the number of grains found in each simulation cell. There are some minor differences between the two simulations. The initial grain number increases up to around 400 for the benchmark simulation, whilst the maximum number of grains found in the cell with carbon atoms is 440, a difference of 40 grains. Nevertheless, both simulations experience a nearly identical trajectory from 0.27 strain to 3 strain. After this point, the number of grains present in the benchmark simulation is noticeably larger than the carbon-containing cell. For example, at , the number of grains found in the benchmark simulation is around 260, whilst the carbon-containing cell only has around 210.
A similar trend is observed when considering the dislocation densities of the simulations in Figure 14(e). Again, the trajectories of the simulations are nearly identical up to . With continued shearing, the dislocation density of the carbon-containing cell is noticeably larger, until the values become similar for both simulations at around .
In Figure 14(f), it is interesting to observe identical simulation temperatures for the benchmark simulation and carbon-containing simulation, whilst the kinetic energy between them is not identical. It is not immediately apparent what could cause this.
Figure 15 shows the mean kinetic energy broken down by atom type for the carbon-containing simulation. Evidently, the carbon atoms have higher kinetic energy that the iron atoms, and the energy fluctuation is large. However, the kinetic energy of the carbon atoms stays fairly consistent on average, at a value of around 0.058 eV/atom.
Carbon atoms can move within the material by jumping between interstitial sites through diffusion [85]. The work done by Wert [86] managed to characterise the diffusion coefficient of carbon in iron as a function of the temperature, and subsequent work has pointed to a diffusion barrier of around 0.87 eV for carbon in iron at room temperature [87]. This is further reinforced by the work of Tapasa et al. [88], which also found that the activation energy of C migration in Fe to be 0.82 - 0.86 eV, which is much larger than the kinetic energy spikes in Figure 15. Fu et al. [89] performed density functional theory (DFT) calculations to explore the migration energy of C atoms in Fe. They found that C atoms will migrate from neighbouring octahedral sites through a tetrahedral site, with an energy barrier of 0.87 eV. This value agrees with the work of Wert [86] and Tapasa [88]. Other DFT calculations have also obtained similar values [90, 91].
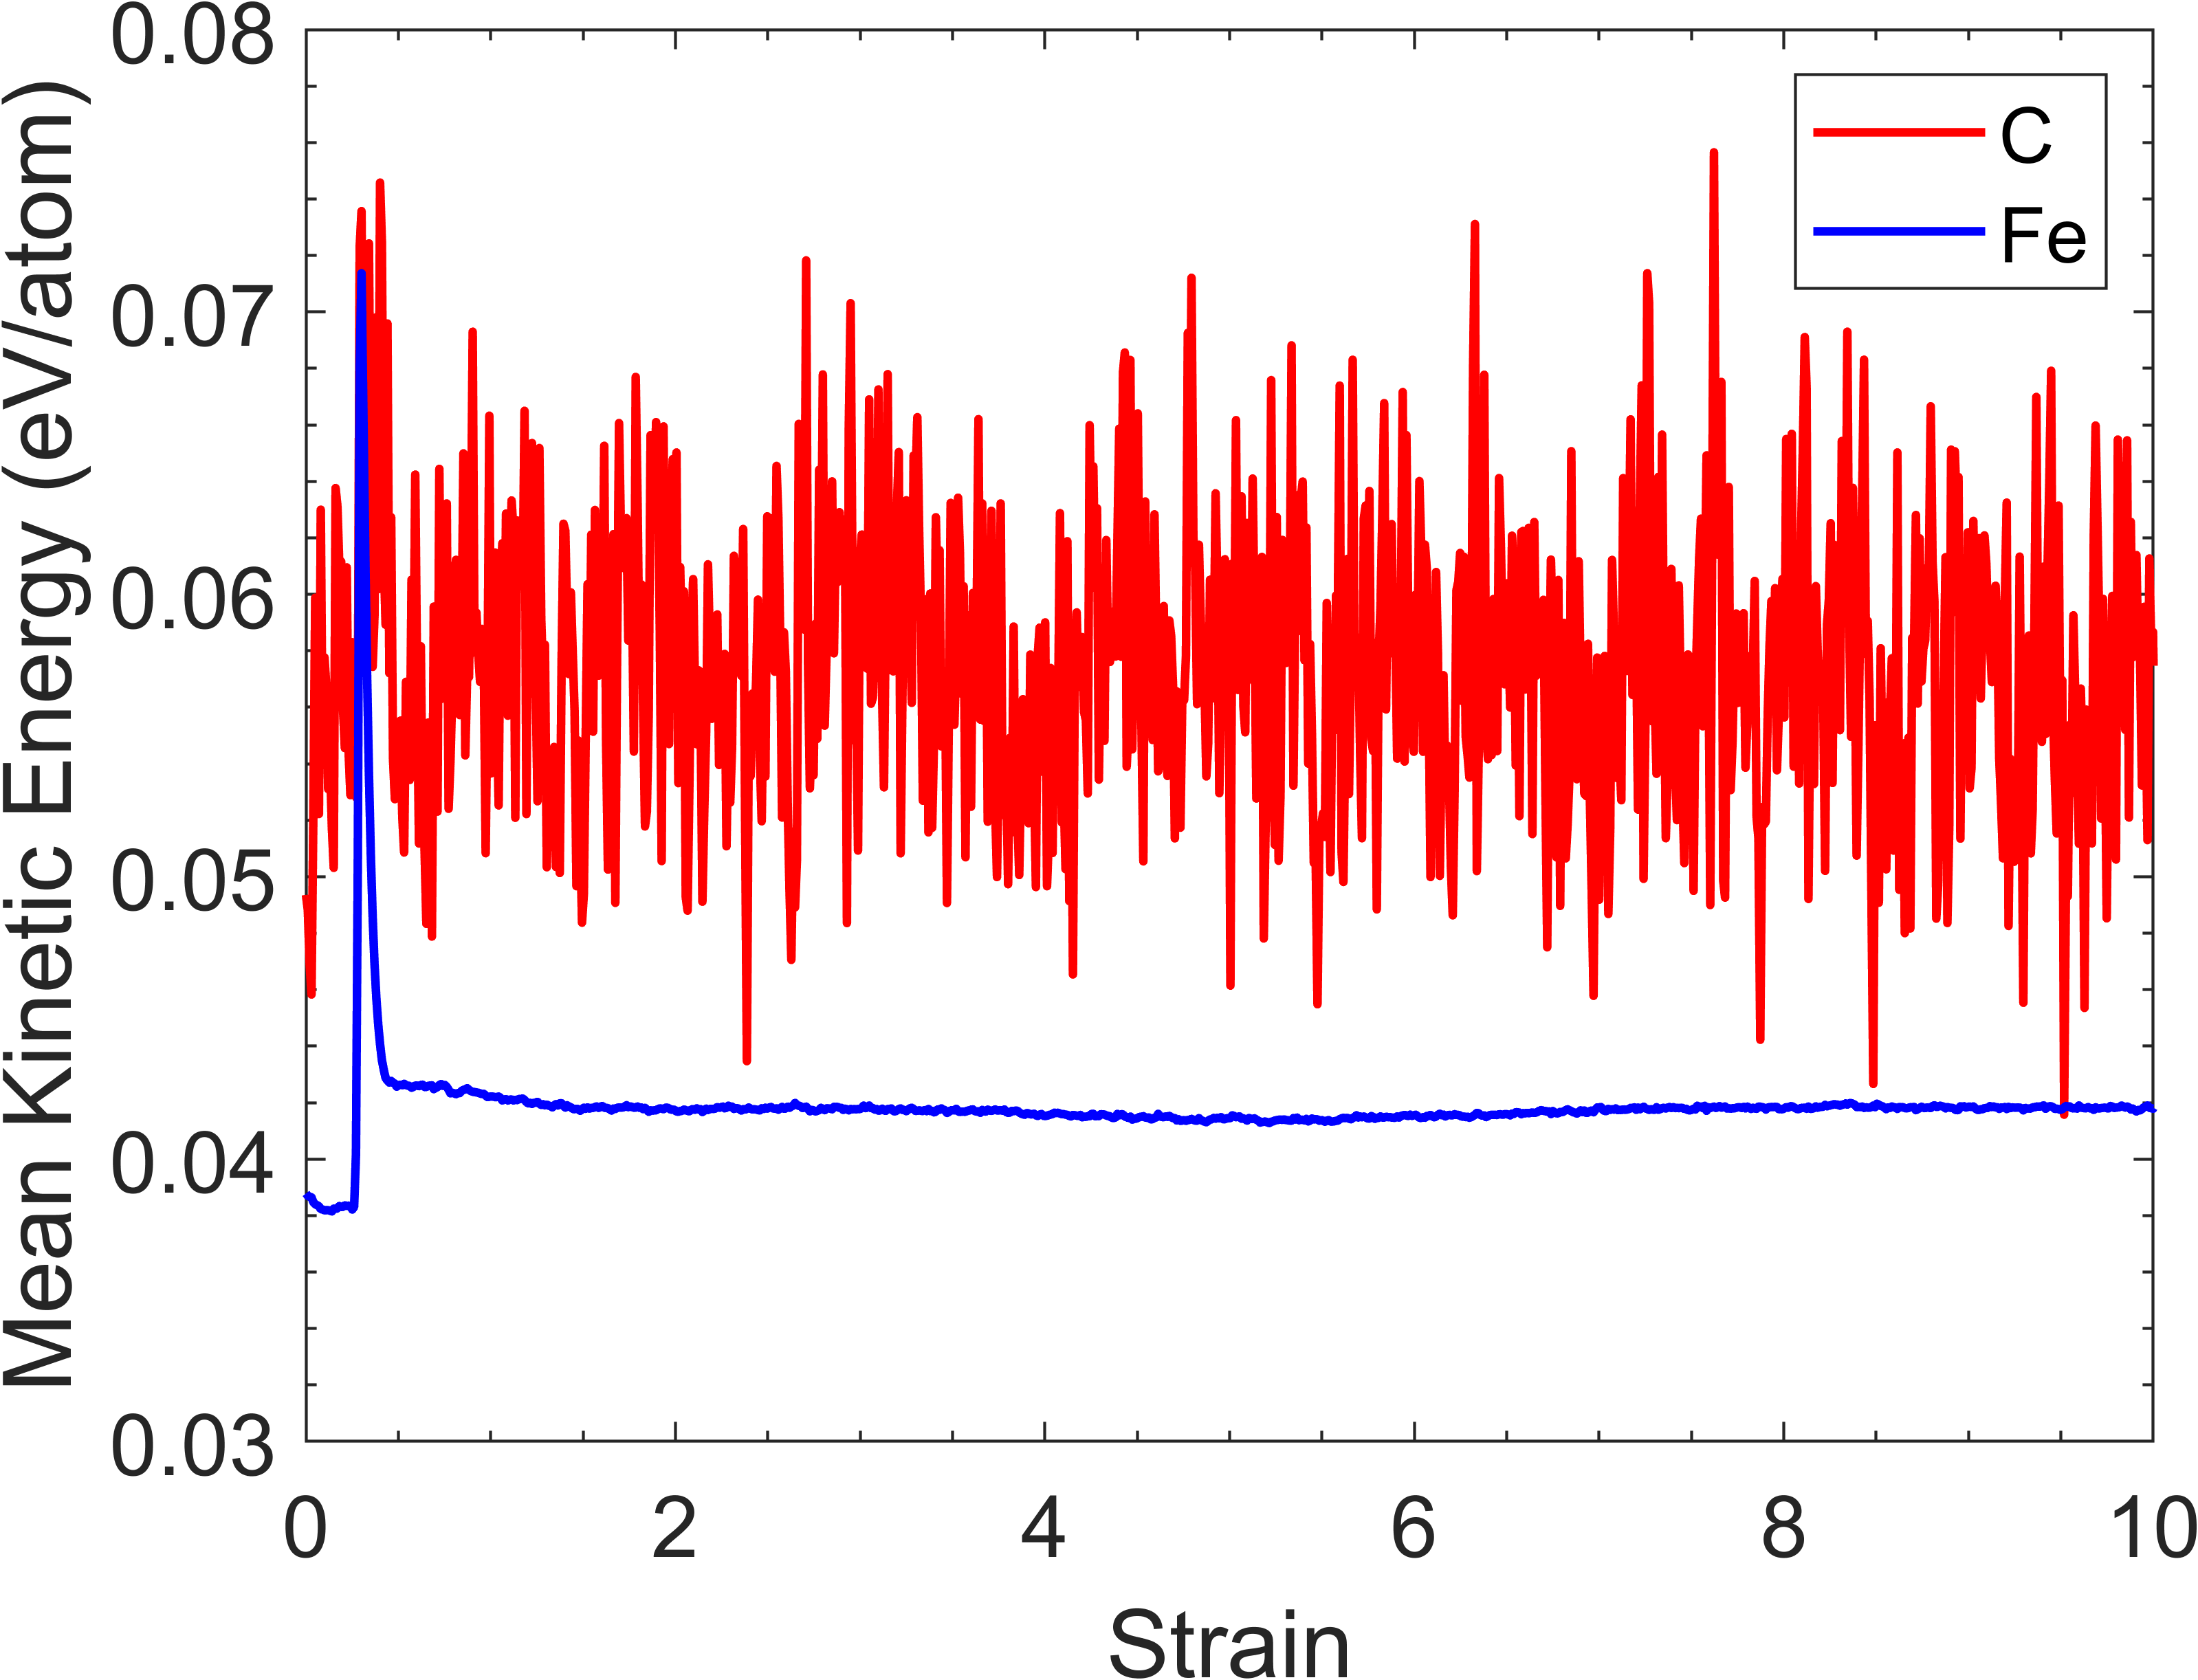
Figure 15 suggests that these carbon atoms are not overcoming the energy barrier as their average kinetic energy is never increases past the diffusion energy barrier, therefore suggesting that the carbon atoms do not readily move through diffusion. Instead, the movement of carbon atoms may be conducted through a mobile Cottrell atmosphere. In Figure 14(e), the carbon-containing cell initially shows a higher dislocation density compared to the benchmark simulation up to around 8.5 strain, after which they become similar. Carbon, behaving as a solute interstitial in the lattice, impedes dislocation motion [92]. This prohibits dislocations from gliding effectively within the lattice, hampering their movement toward grain boundaries and limiting the formation of new LAGBs. This restraint likely contributes to the lower overall grain count in the carbon-containing cell, as shown in Figure 14(c). Essentially, hindered dislocation glide and limited LAGB formation slow grain refinement, yielding higher dislocation density. Moreover, dislocations carry excess free energy [60], likely contributing to the higher overall potential energy in the carbon-containing cell (Figure 14(b)). Interestingly, the potential energy notably decreases beyond , even surpassing the benchmark simulation, aligning with the reduction in dislocation density in the carbon-containing box.
IV Conclusion
Nanocrystalline formation in iron under high shear strain has been observed through molecular dynamic simulations. The process of nucleation and growth of nanograins during the shearing involves a disordered state, recrystallization, and grain coarsening. The disordered state is caused by a sudden surge in kinetic energy gained from the drop in potential energy, which was high and unstable due to shearing. Following this, energy is dissipated into the environment, mimicked by the thermostat. Atoms rearrange locally to achieve energetically favourable configurations that lead to recrystallization and grain coarsening.
We also examined the influence of various factors, such as thermostat temperature, heat dissipation rate, shear strain rate, and carbon content. Simulations at higher temperatures still experience nanocrystalline formation, but with larger and longer grains forming. A faster rate of heat dissipation altered the grain refinement process. This also involved a disordered state, followed by recrystallization. However, dynamic restoration mechanisms were observed to play a major role in nanocrystalline formation. Simulations with a slower strain rate did not produce nanocrystalline material, with only a single crystal structure being observed. The inclusion of carbon interstitial atoms had a minor effect on nanocrystalline formation, with the process of grain refinement being identical to that of the pristine material. Nonetheless, a smaller number of grains were generally observed for the carbon-containing simulations.
The current simulations demonstrate a possible mechanism of nanograin formation using high-shear methods, which we have not found reported in the literature.
V Data Availability
All input scripts and simulation data presented in the current work are available at A link will be provided after the review process and before publication.
Acknowledgements.
The authors gratefully acknowledge the Department of Engineering Science at the University of Oxford for their contribution to the funding of the project. This work has been carried out within the framework of the EUROfusion Consortium, funded by the European Union via the Euratom Research and Training Programme (Grant Agreement No 101052200 — EUROfusion) and from the EPSRC [grant number EP/W006839/1]. To obtain further information on the data and models underlying this paper please contact PublicationsManager@ukaea.uk. Views and opinions expressed are however those of the author(s) only and do not necessarily reflect those of the European Union or the European Commission. Neither the European Union nor the European Commission can be held responsible for them. The authors acknowledge the use of the Cambridge Service for Data Driven Discovery (CSD3) and associated support services provided by the University of Cambridge Research Computing Services (www.csd3.cam.ac.uk) in the completion of this work. This work used the ARCHER2 UK National Supercomputing Service (https://www.archer2.ac.uk).Appendix A Further analysis
A.1 Slip Systems
To analyze the slip systems within the current orientation, we calculated the Schmid factor [93]. We apply a constant shear strain in the xy direction, resolving to principal strain at 45°. Although the stress magnitude changes as the simulation progresses, normalizing the applied stress direction to is feasible. With shear strain confined to the xy direction and periodic boundary conditions in place, a plane stress is assumed. In BCC structures like -iron, slip direction predominantly aligns with the family, while slip planes encompass the {110}, {112}, and {123} families for Fe [94, 95]. Using these stress values alongside slip planes and directions, we calculated the Schmid factor using:
| (6) |
where m is the Schmid factor, is the angle between the normal of the slip plane and the direction of applied stress, and is the angle between the direction of applied stress and the slip direction.
The Schmid factor can be calculated using:
| (7) | |||
| (8) |
where is the vector normal to the slip plane, and is the vector in the direction of the slip.
There is a total of 48 slip systems in BCC metal. A full list of these can be found in [96]. The Schmid factor was calculated for each system and this is shown in Figure 16.
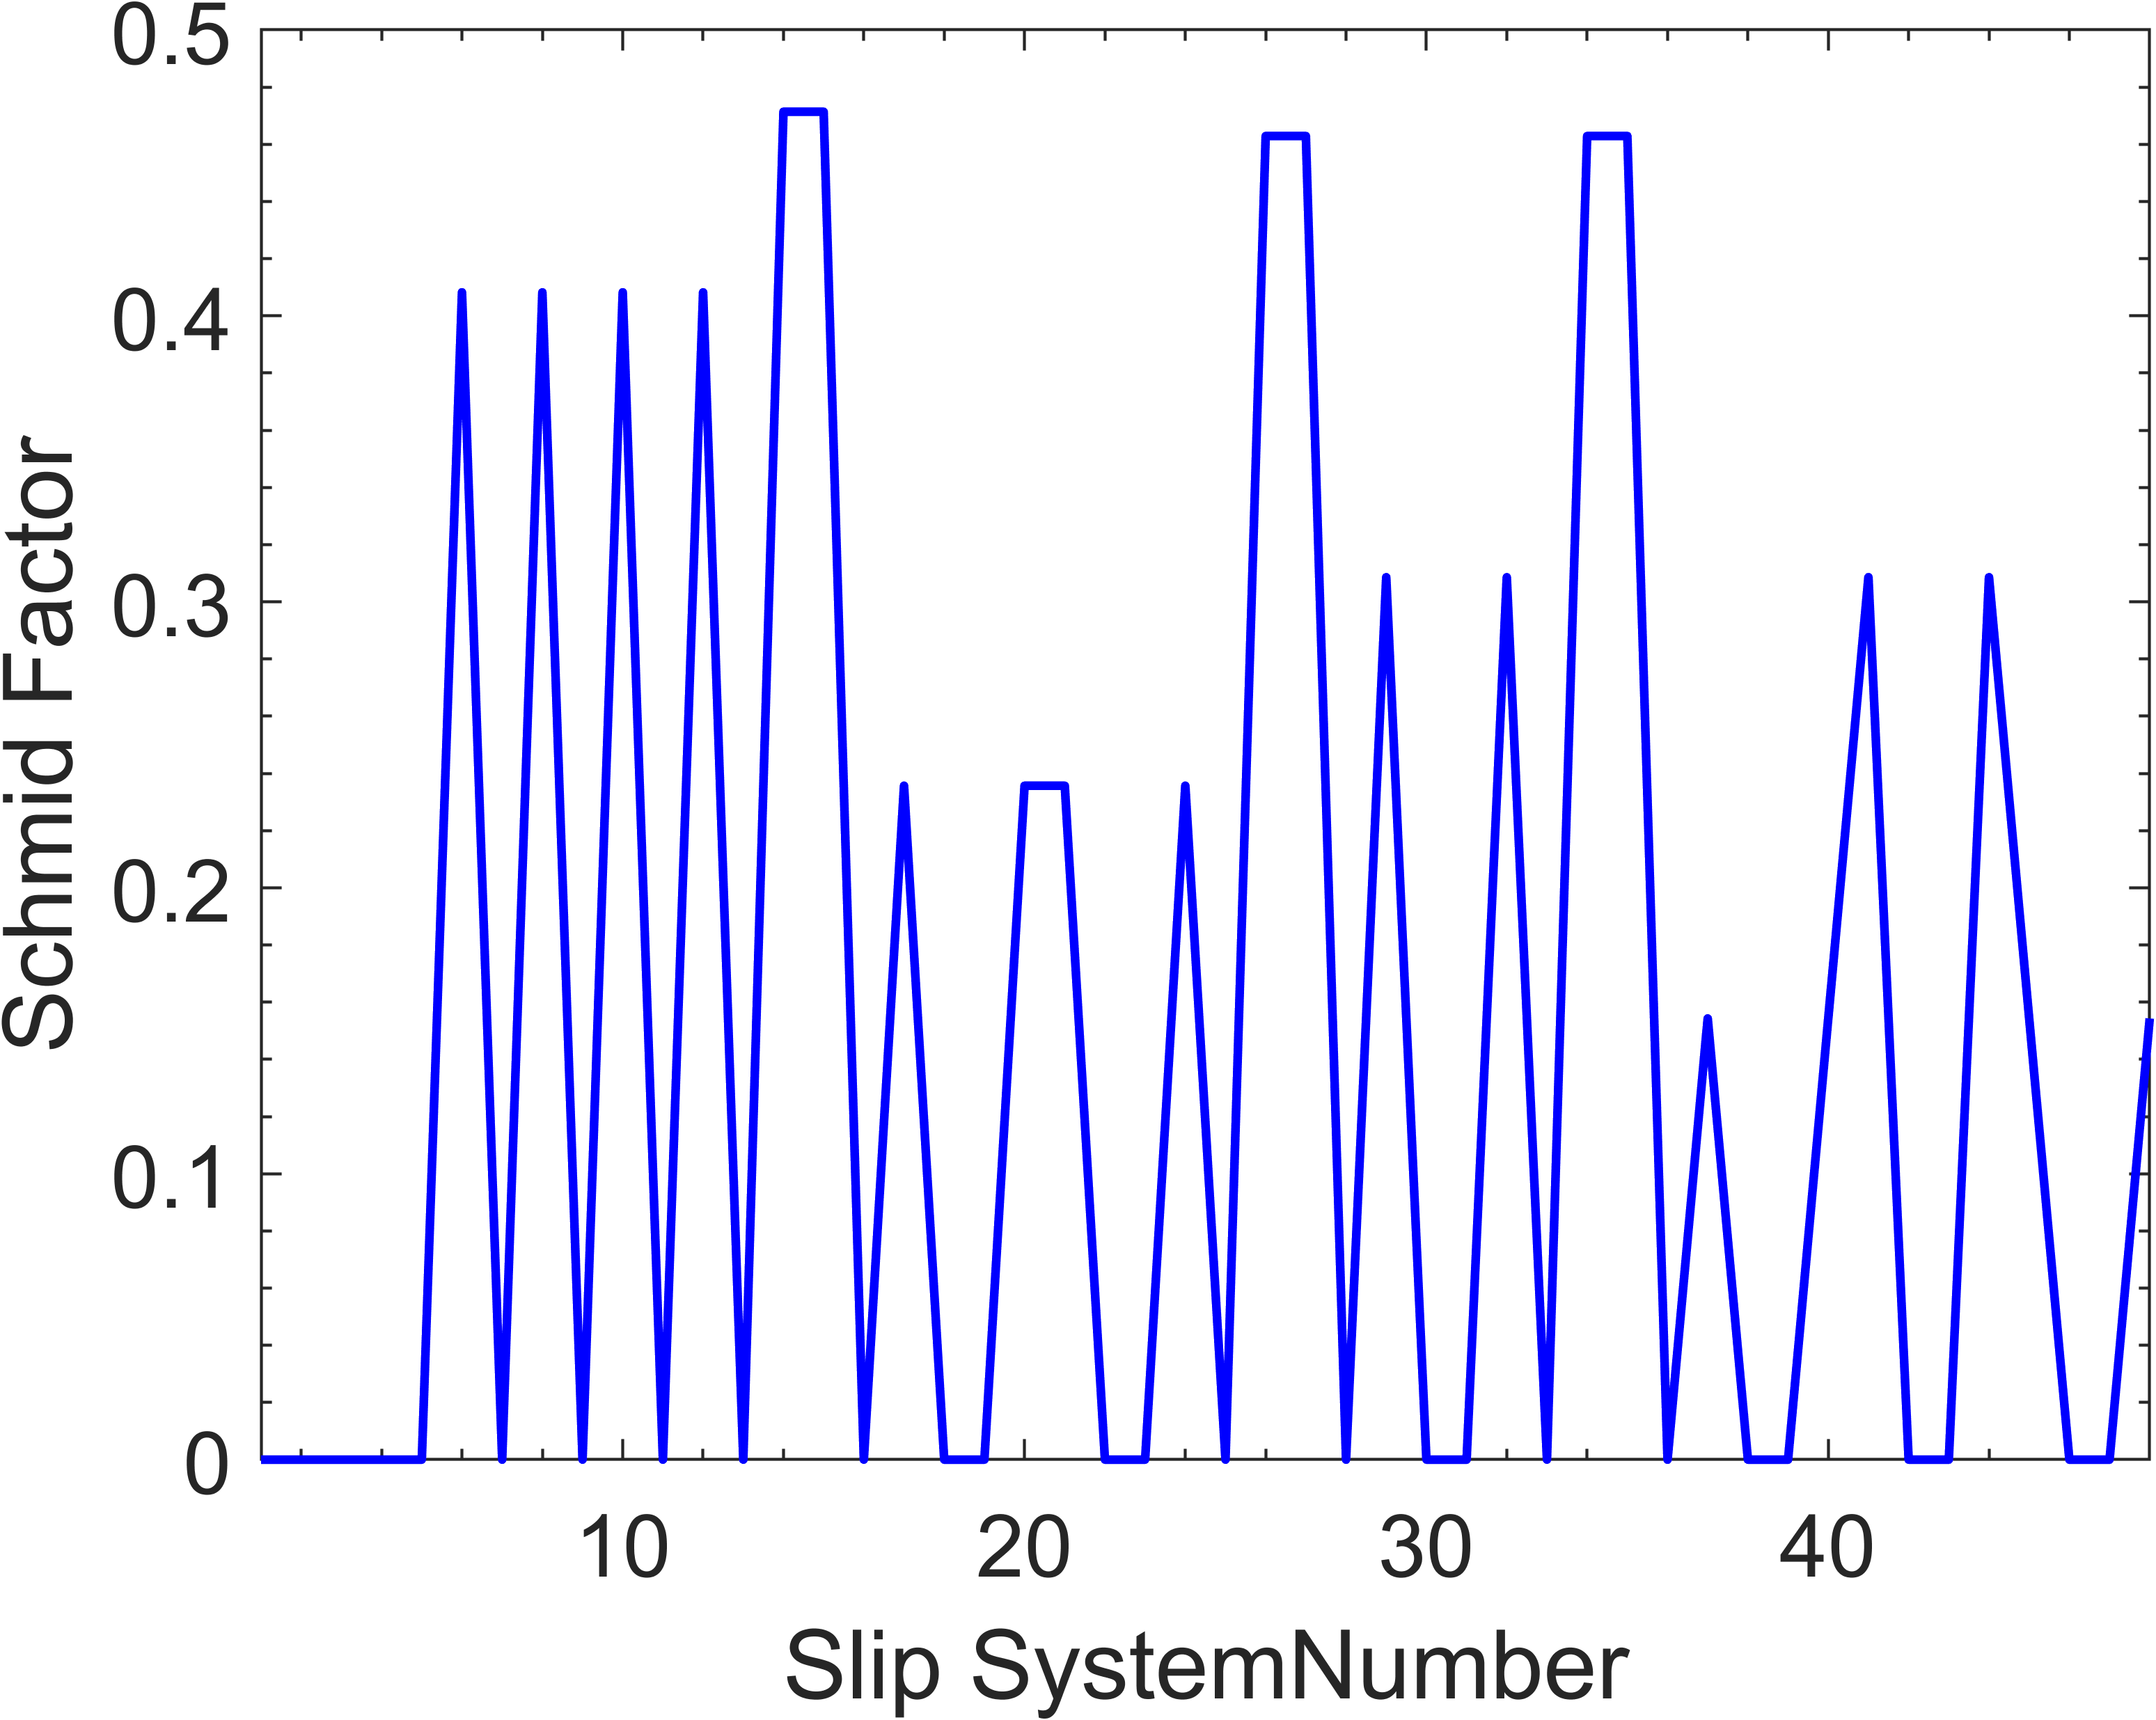
Analyzing Figure 16, we discover a multitude of potential slip systems that can activate within the system when the crystal is oriented along . This observation may shed light on why the grain refinement process initiates with numerous atoms entering a highly disordered state. During the shearing of the cell, a diverse set of slip systems is simultaneously engaged. Upon reaching the critical stress point, this leads to a mixing of atoms, inducing high disorientation due to the involvement of multiple slip directions. Subsequent quenching then triggers recrystallization.
A.2 Further Dislocation Analysis
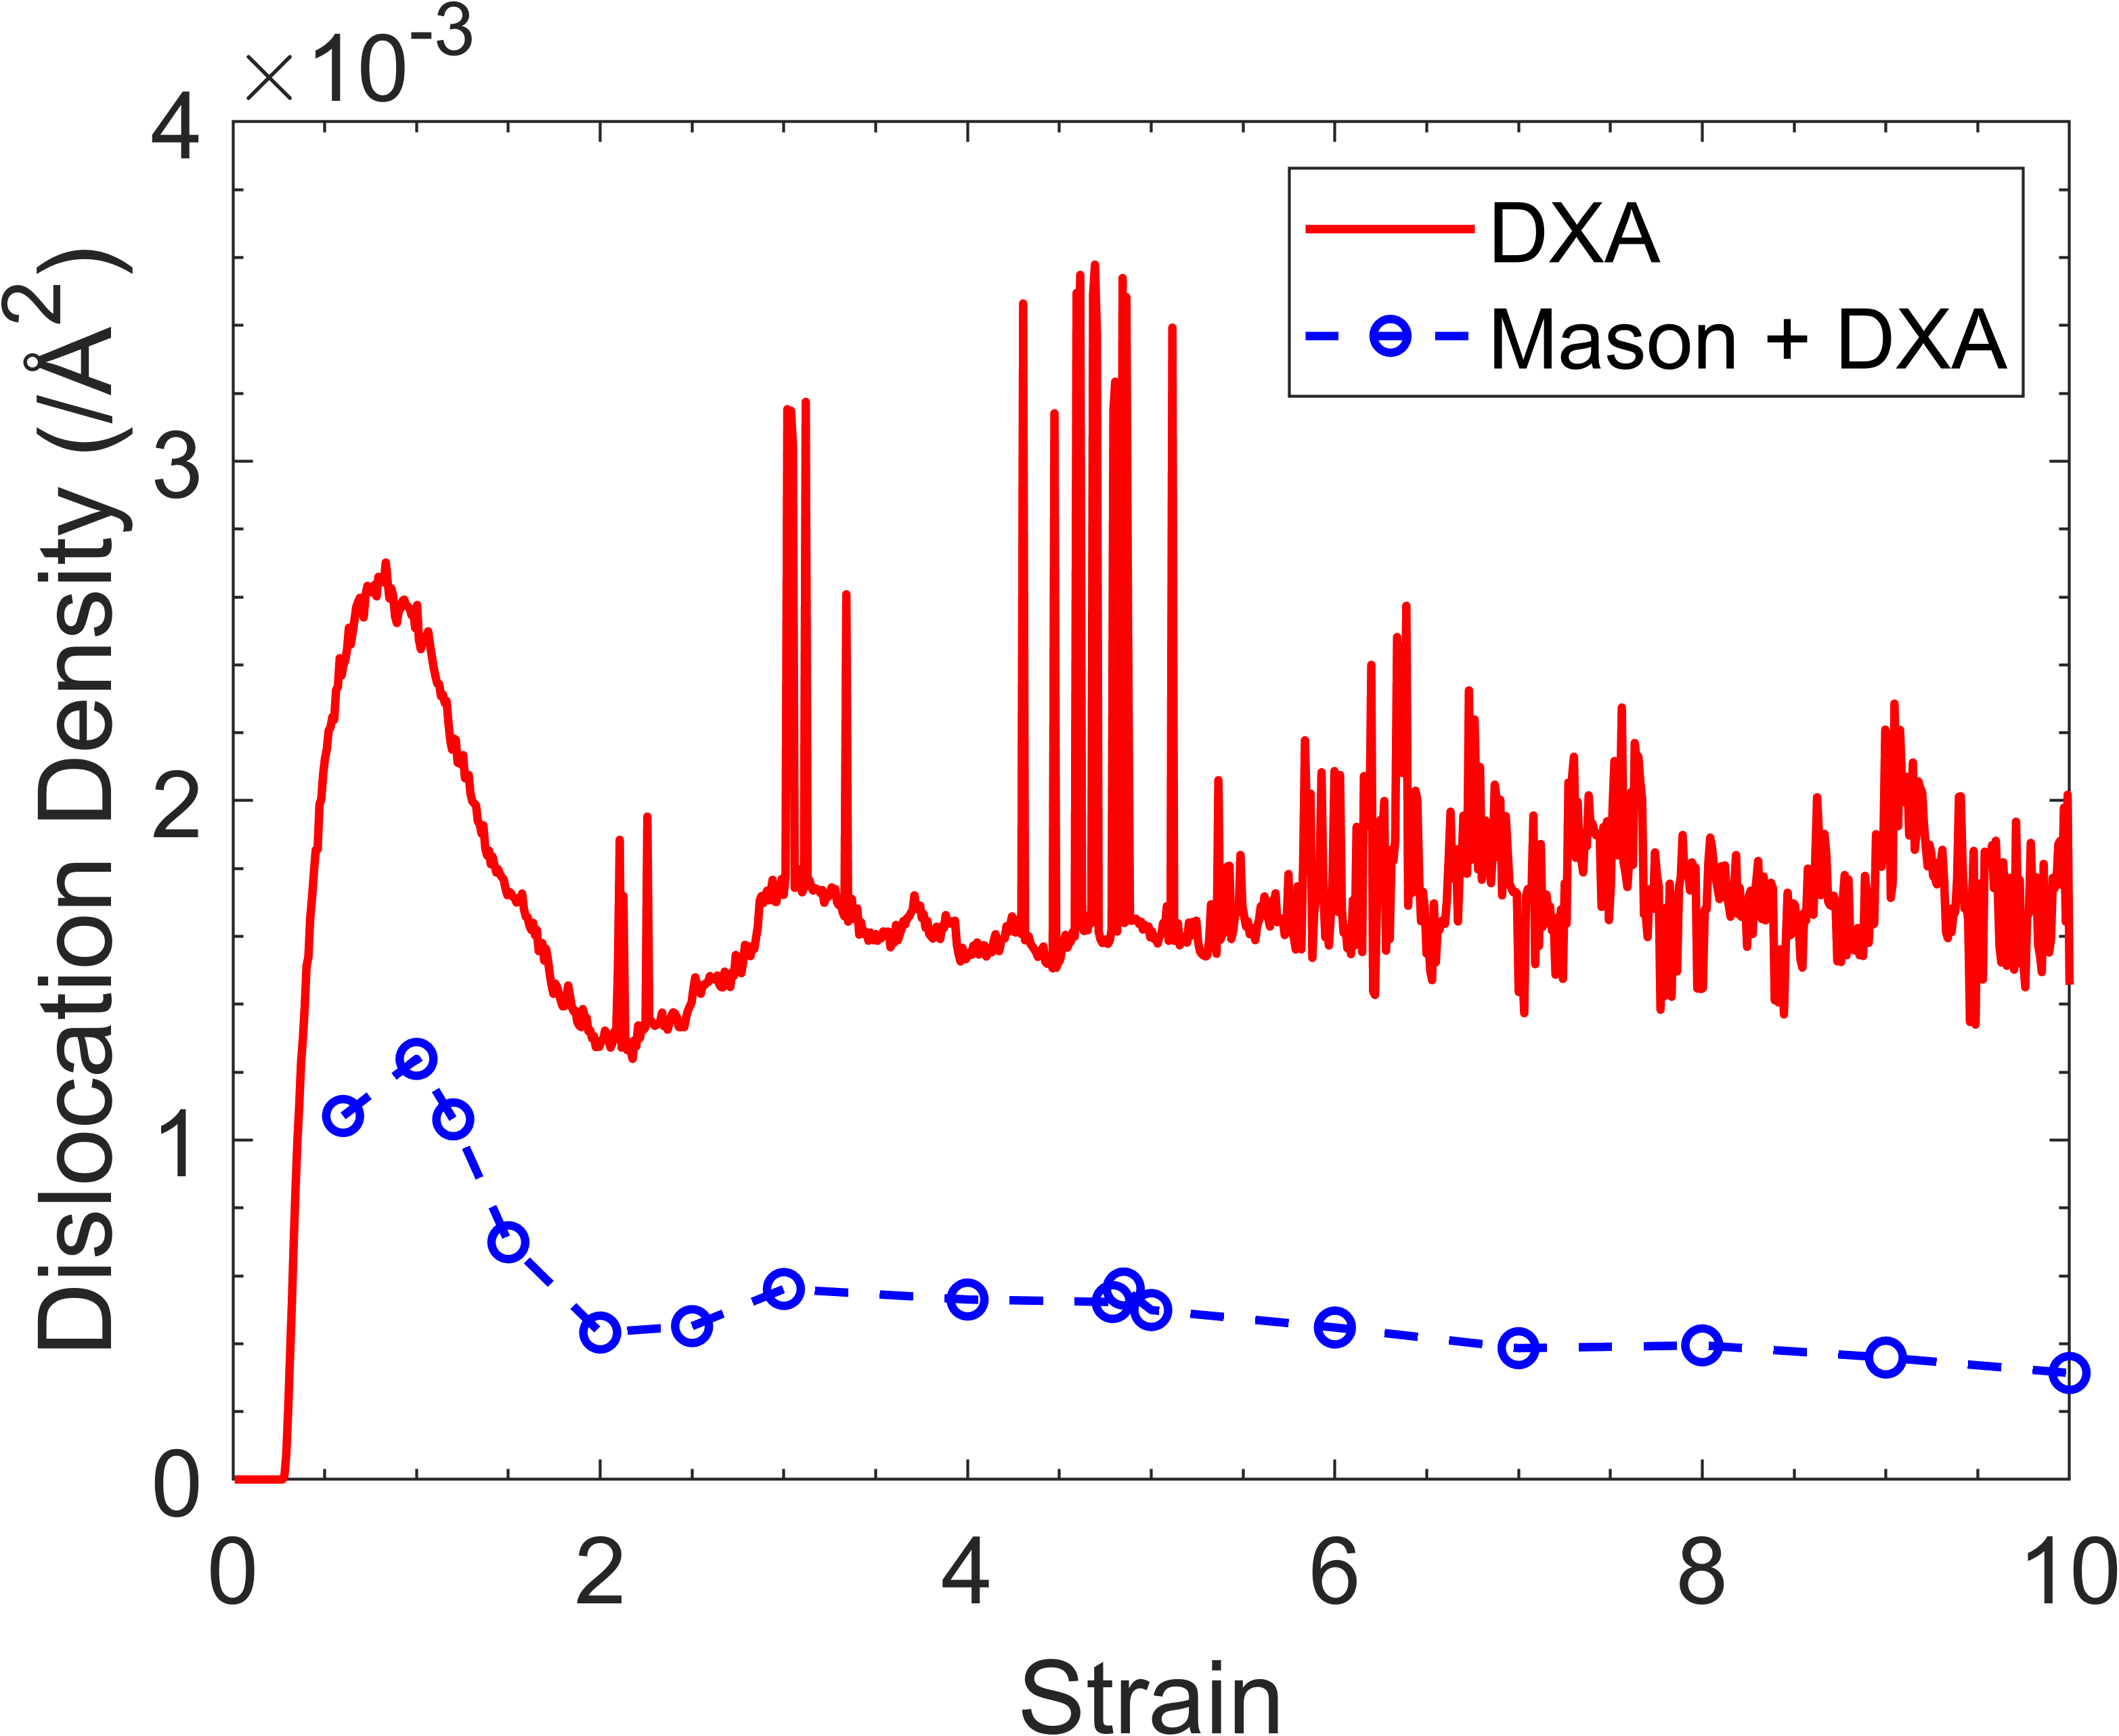
We performed additional DXA calculations after eliminating grain boundaries. This is done by removing atoms that are sitting close to grain boundaries. We adopt the code developed by Mason [97, 62]. It provides the distance of each atom to the nearest grain boundary. Atoms with Å were excluded, followed by a subsequent DXA calculation. Figure 17 displays the analysis outcomes.
Figure 17 demonstrates that the standard DXA tends to overestimate dislocation density, possibly due to grain boundaries. Dislocations can glide and accumulate at grain boundaries, with some leading to the formation of LAGBs [4, 8, 9, 10]. It’s likely that DXA interprets certain LAGBs as dislocation lines, accounting for the discrepancy in dislocation count. Specifically, conspicuous spikes in dislocation density around 4.8 strain are observed, absent when atoms are excluded. Thus, we conclude that the standard DXA encompasses dislocation pile-ups and LAGBs in its dislocation density computation. Nevertheless, the current analysis remains a robust foundation for comparing various simulations.
A.3 What Constitutes a Grain?
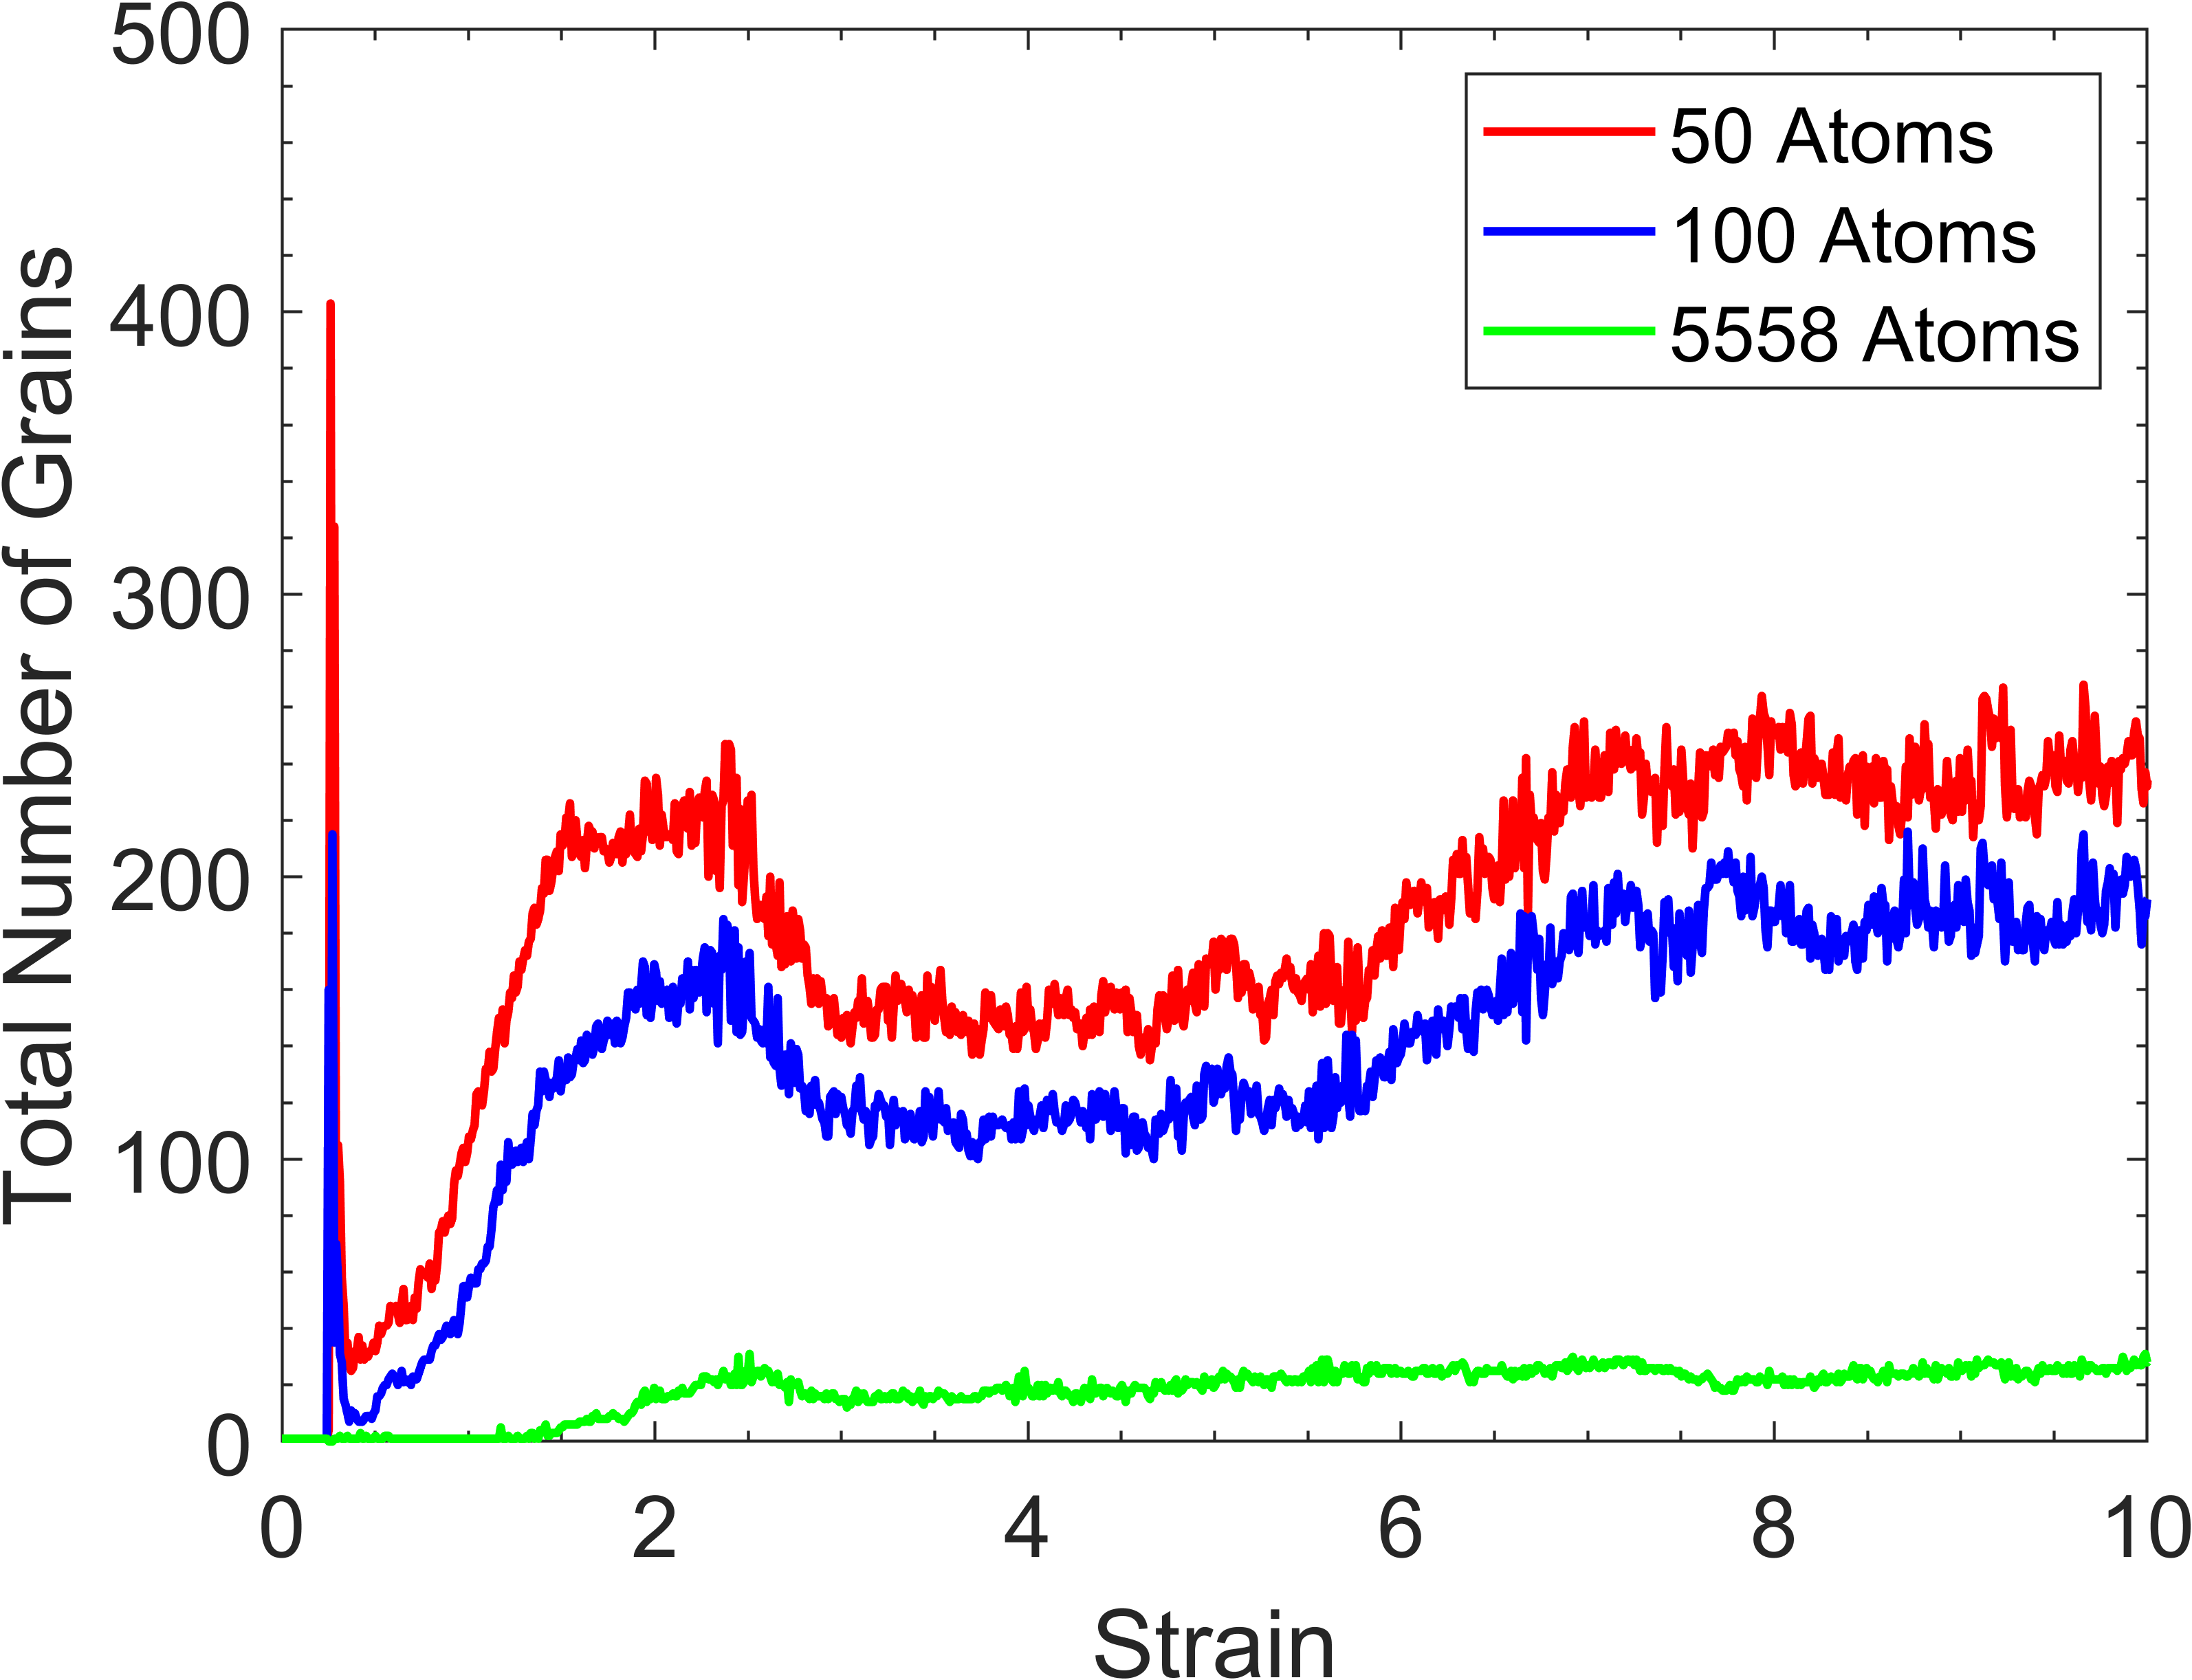
In this work, we considered a minimum grain size of 50 atoms when determining the number of grains present within the system. This number was selected as it allowed us to observe the transition to the disordered state and the subsequent recrystallisation clearly. Nevertheless, Figure 18 shows the comparison of grain numbers for the benchmark simulation with different numbers of atoms selected to form the minimum grain size. The Ovito default of 100 atoms was selected for comparison, as was 5,558 atoms, which corresponds to a 5nm diameter spherical grain. A 5nm grain corresponds to a minimum grain size which can accurately be resolved using transmission Kikuchi diffraction (TKD, or t-EBSD) [98], allowing comparisons with future experimental HPT data.
Figure 18 shows that the number of grains between the 50-atom and 100-atom analyses largely follow the same trajectory. At 0.27 strain, our-50 atom analysis showed 400 grains whilst the 100-atom analysis showed 215. This means that 185 grains were found to have less than 100 but more than 50 atoms at this point. This further suggests that the spike is caused by a highly disordered state of the atoms whereby only small pockets of BCC phase atoms remain, which is flagged as a grain. At this strain value, the 5nm grain analysis cannot pick up any grains due to the highly disordered state, and the grain number is shown as 0. After 2 strain, the 50- and 100-atom trajectories follow the same trajectory, however, there is always a difference of around 40 grains between the analyses. Therefore, we conclude that there are always around 40 grains in the simulation cell which have less than 100 atoms but more than 50. Interestingly, the 5nm grain analysis does not follow the same trajectory, and instead hovers around 1 grain up to around 1.37 strain. After this point, the grain number increases for the 5nm analysis, as shown in Figure 18. A local maximum of grain number is reached at around 2.5 strain, with 30 grains being present. This is followed by a minor decrease, after which the grain number sits steadily at around 25 after 4 strain. As such, we observe that the process of grain refinement still occurs if we define a grain with a minimum of 5,558 atoms.
It further supports our hypothesis that the transition of atoms into the disordered state, followed by a recrystallisation and grain growth, is a major mechanism of grain refinement. It is clear that up to 1.37 strain, all of the grains are small, with many containing less than 100 atoms. Through the processes of grain growth described above, the grains expand, causing the 5nm analysis value to increase. This analysis saturates at around 25-30 grains and any subsequent changes in the simulation cell with shear occur through small grain processing.
By increasing the minimum number of atoms that constitute a grain, we can compare the effects of temperature and carbon on the formation of experimentally observable grains. Figure 19 shows the number of 5nm spherical grains found in different temperature simulations and carbon-containing simulations.
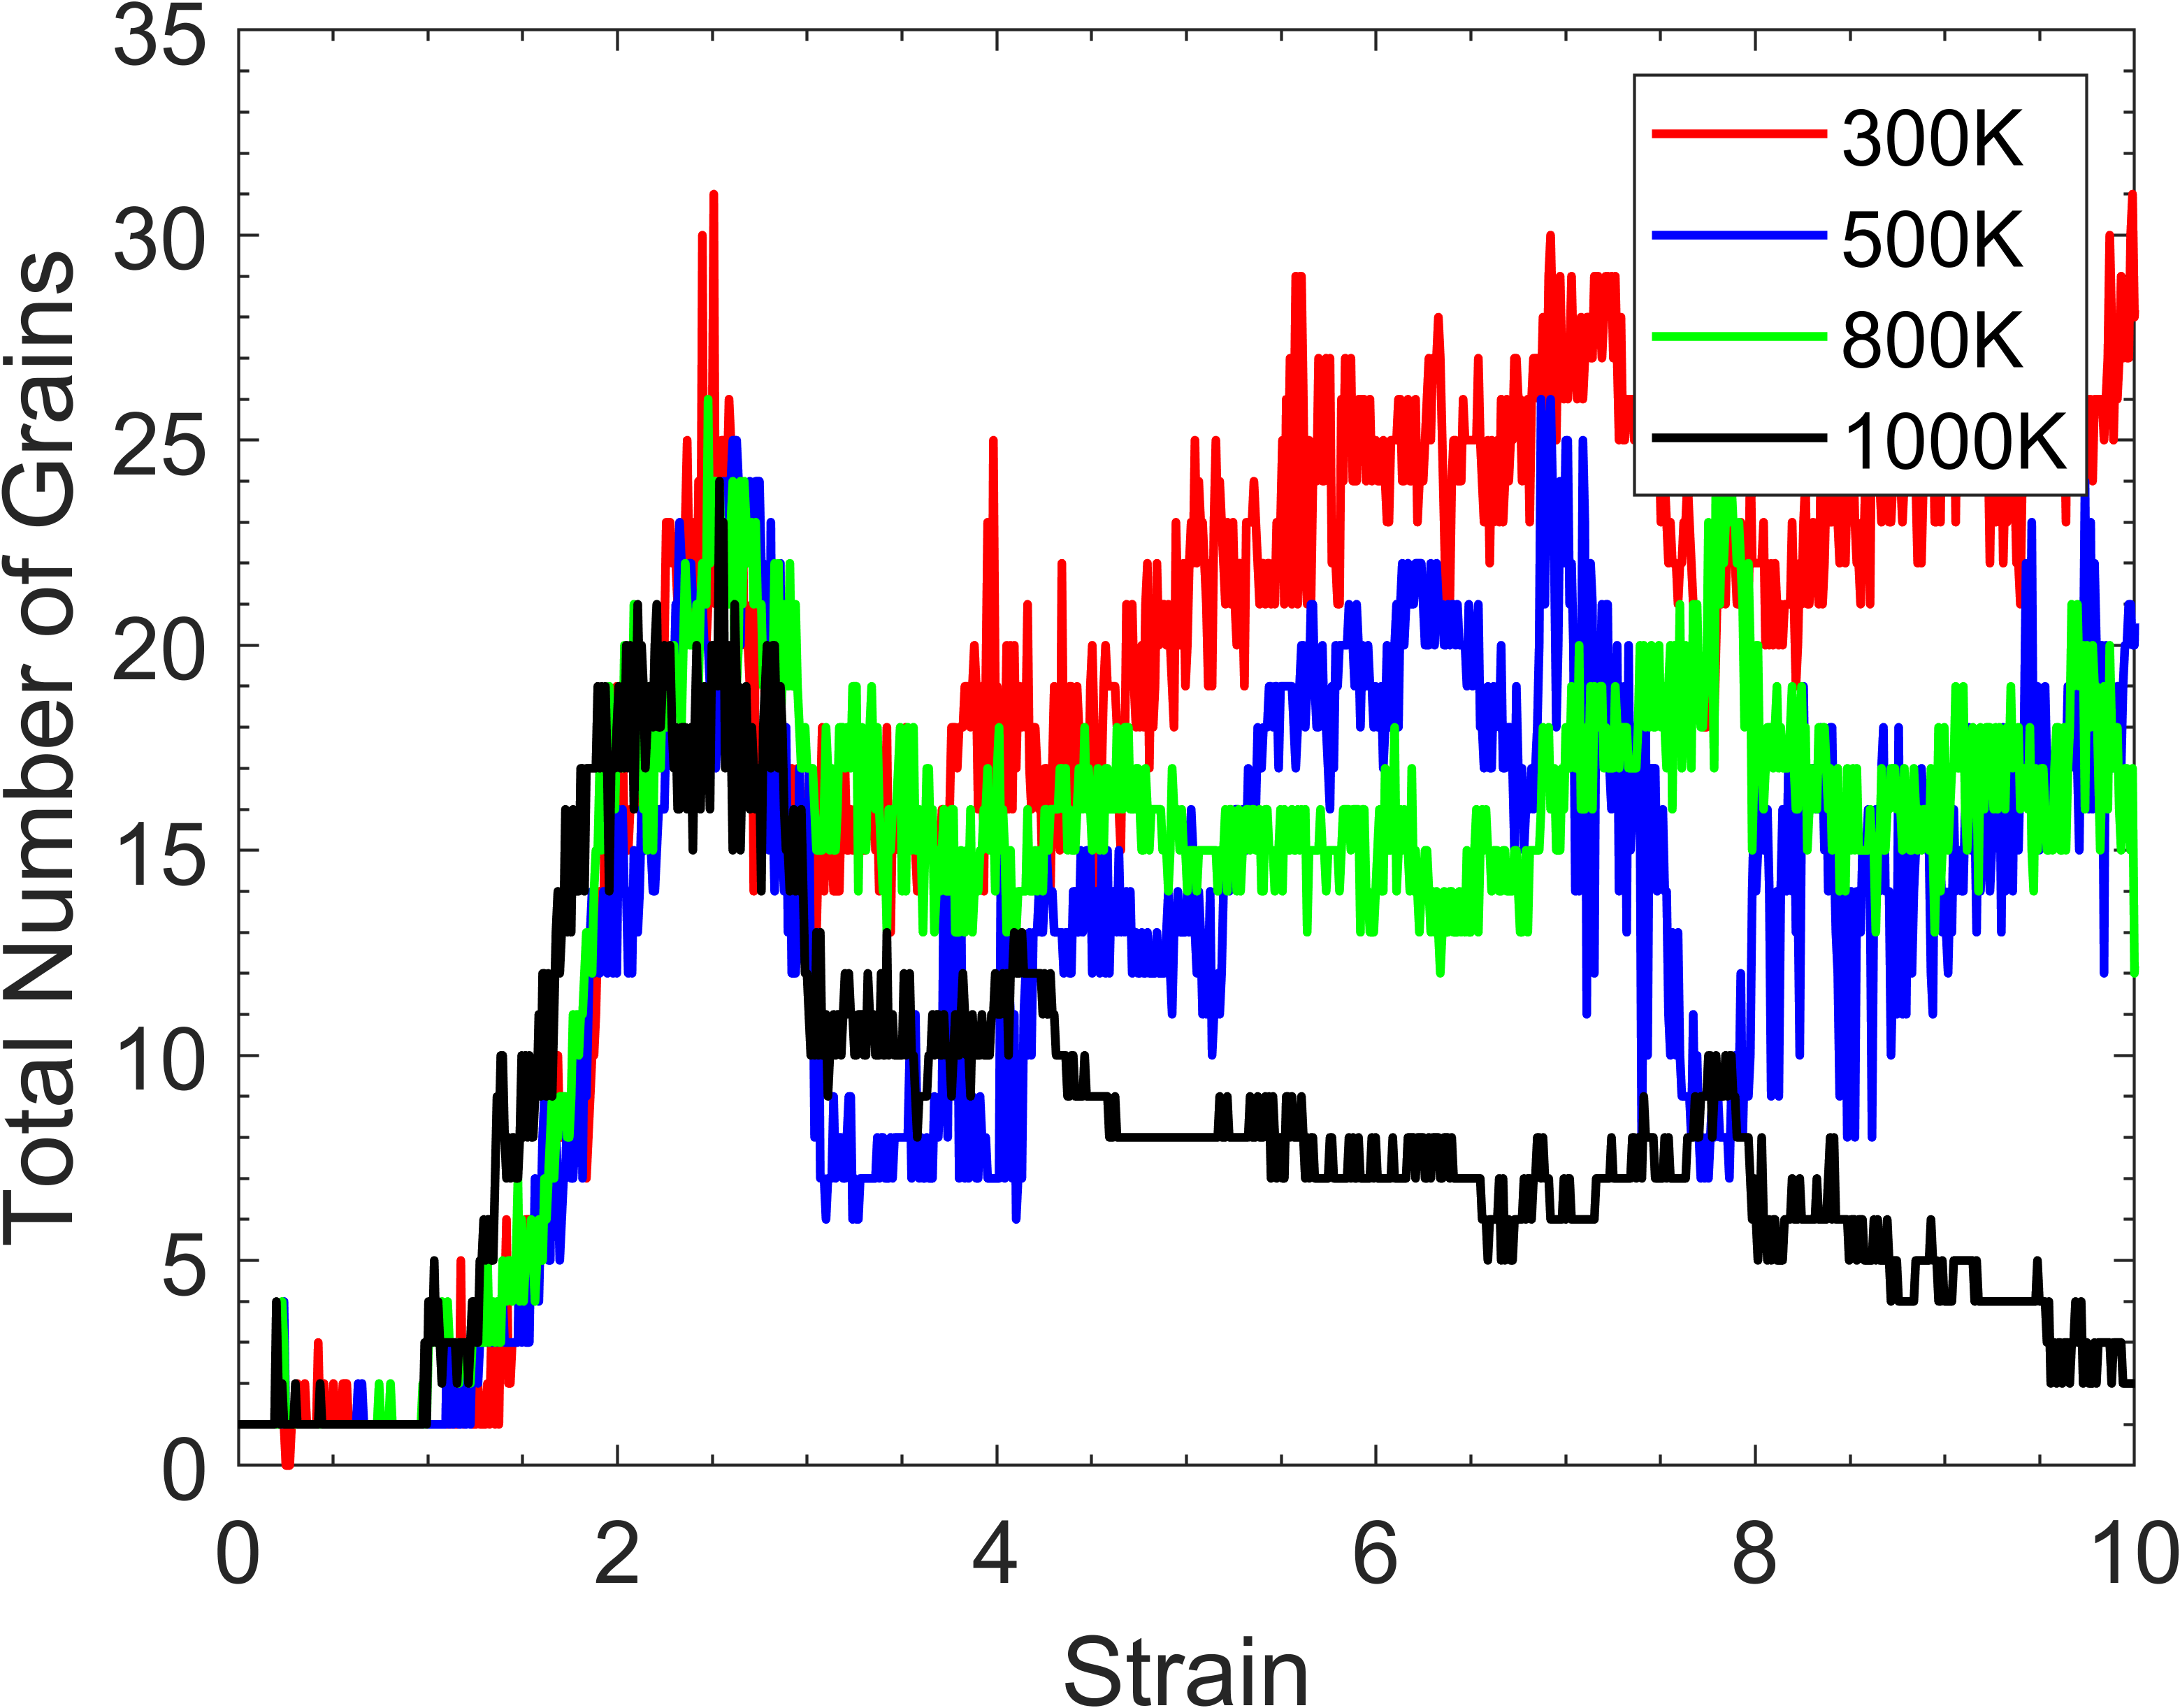
In Figure 19(a), there is no initial spike in 5nm grains for any simulation, and the trajectories of the different simulations are largely similar until around 2.5 strain. This is contrary to the data shown in Figure 5(f) which shows that the 300 K simulation has the most grains at this point, suggesting that at 300 K, the grain numbers are increased due to the presence of many small grains. We also notice that the 1000 K simulation has around 2 grains larger than 5nm at 10 strain, which is visible by considering Figure 8(c). Ultimately, the 300 K simulation still shows the largest number of grains overall. However, this is not to the same extent as in Figure 5(f), again suggesting that the shearing process stimulates the production of many small grains in the 300 K simulation. Nevertheless, the 500 K and 800 K simulations also have many small grains, and this is visible by comparing the data in Figure 19(a) to Figure 5(f). For example, at 6 strain, the total number of grains present for the 500 K simulation is 120 and that number drops to 20 when considering only 5nm grains.
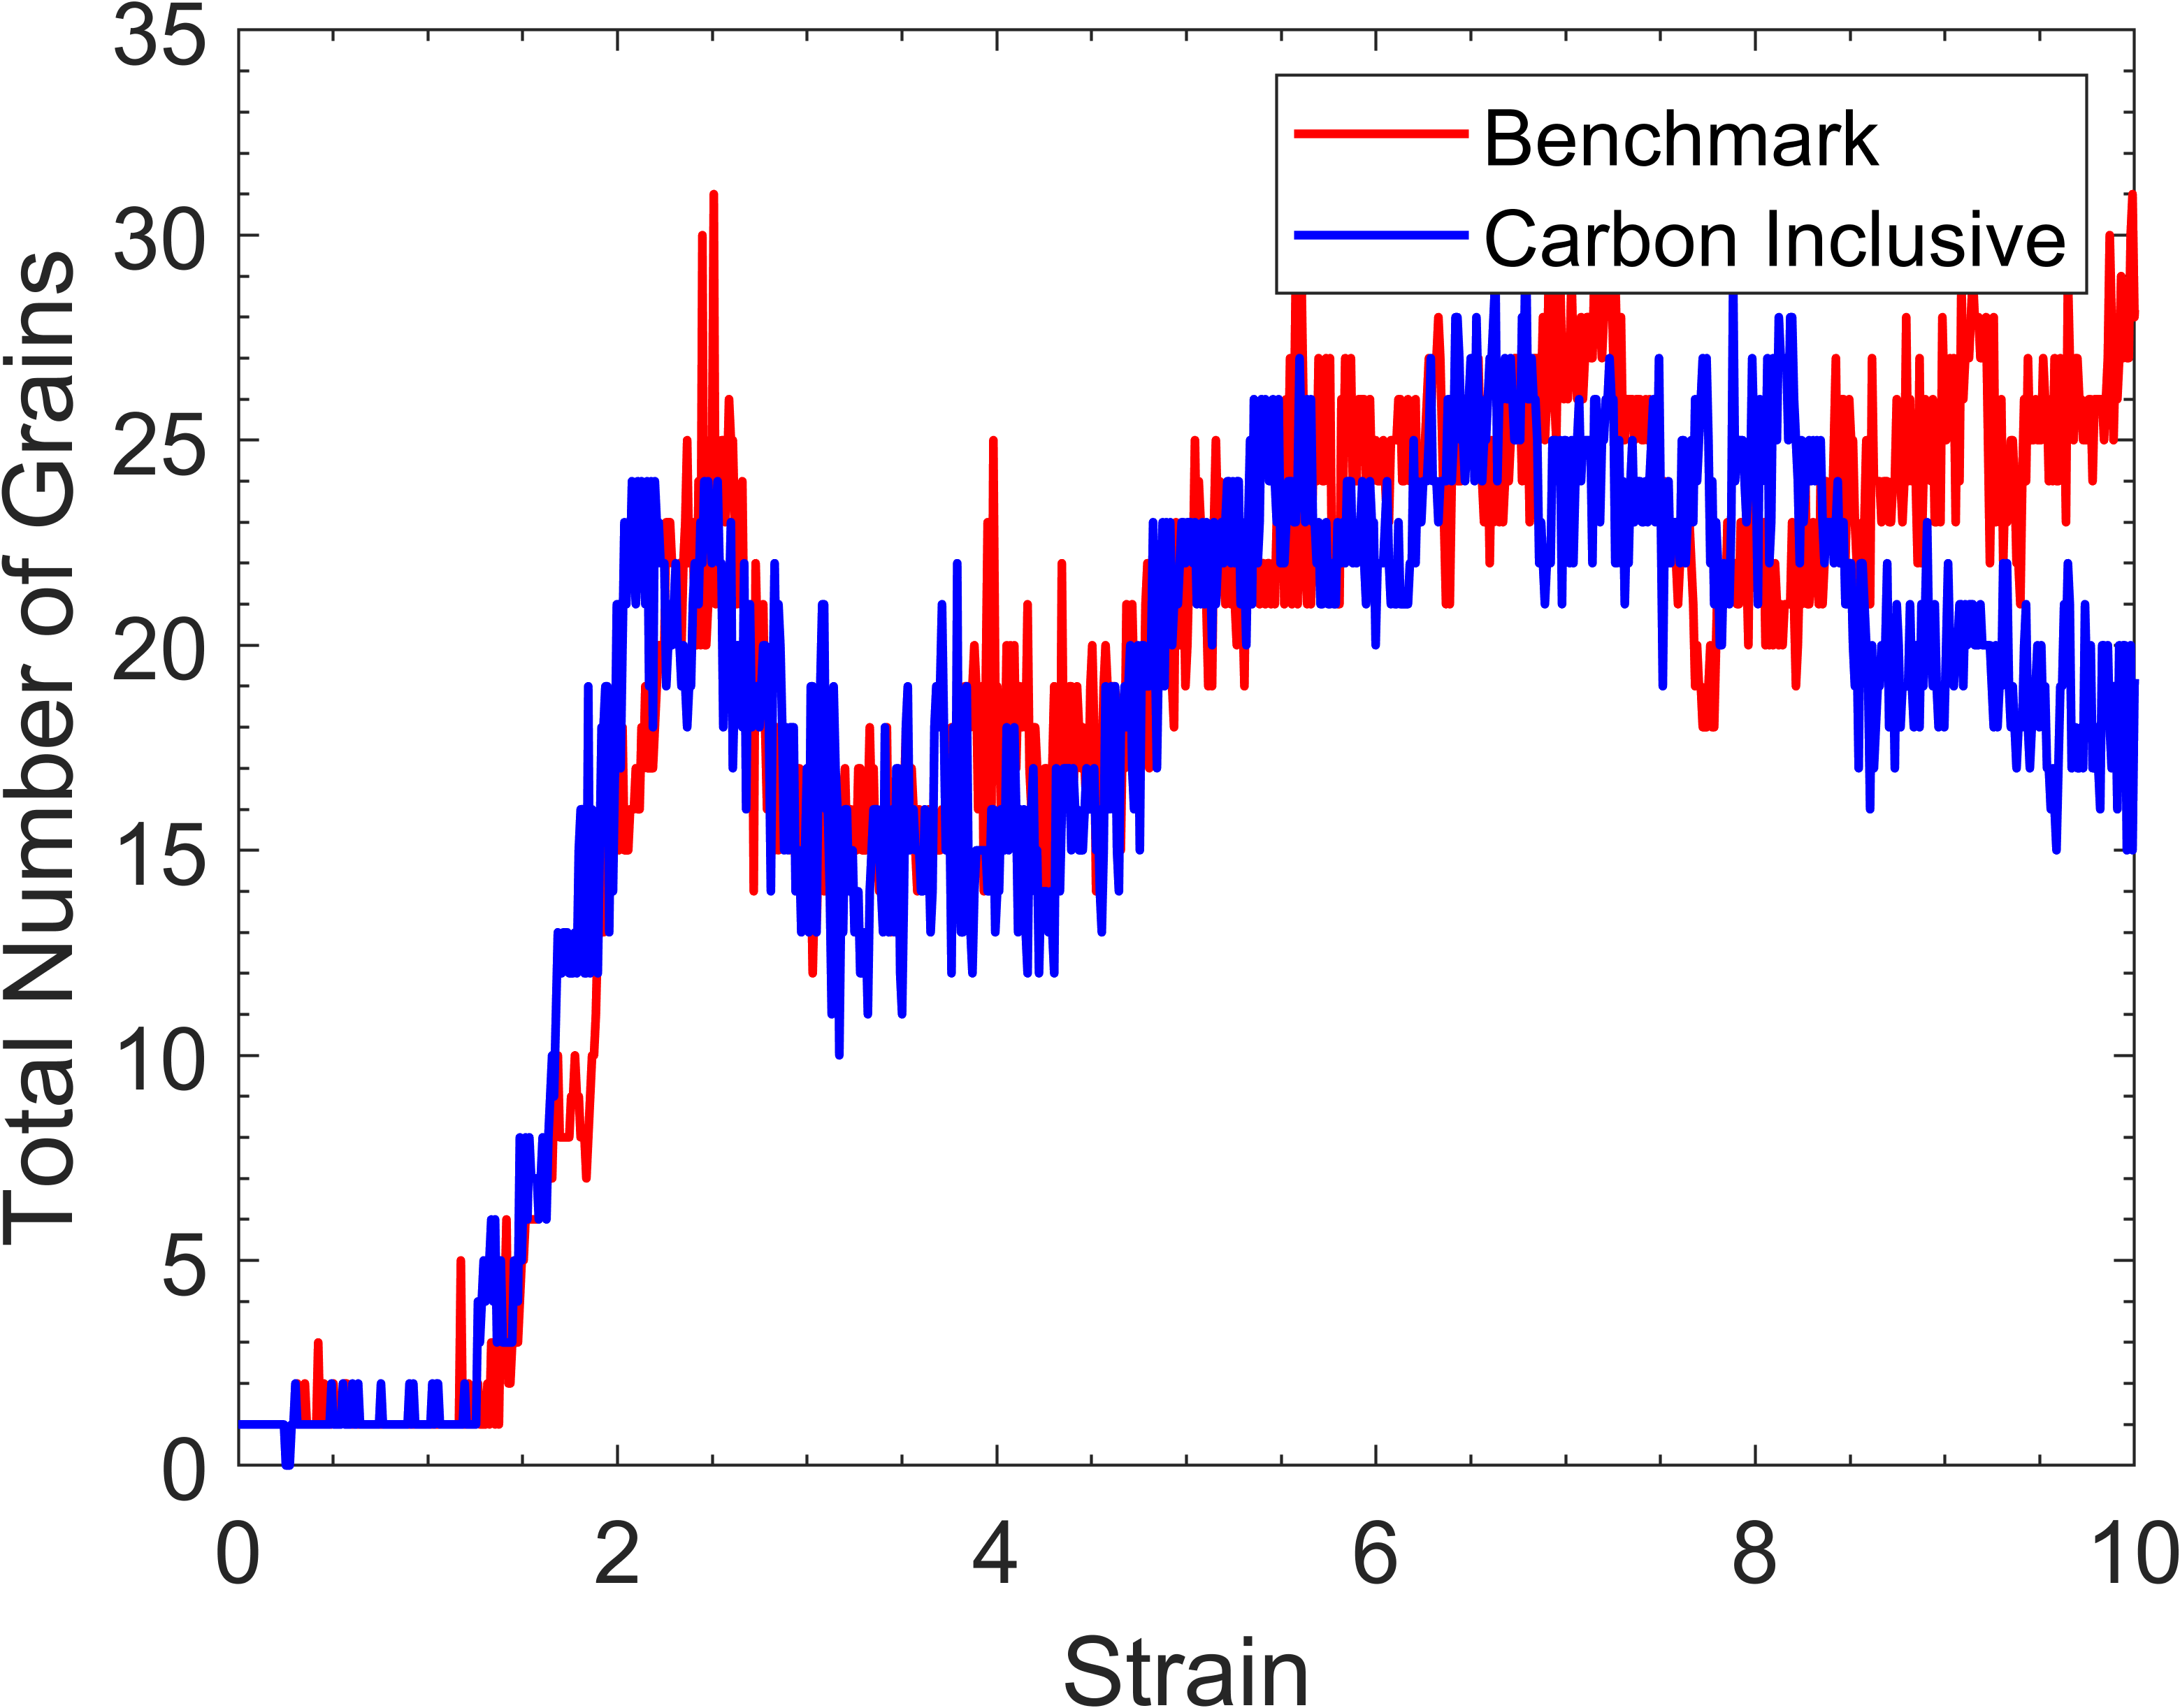
Figure 19(b) also shows the comparison of 5nm grains between the benchmark and carbon-containing simulation. We show here that the deviation in grain number observed in Figure 14(c) does not occur when considering 5nm grain, up to 8.5 strain. This suggests that the benchmark simulation has many smaller grains than the carbon-containing simulation. After 8.5 strain, we notice that the carbon-containing simulation begins to dip in grain number whilst the benchmark simulation cell rises.
A.4 Thermal Stability of Grains
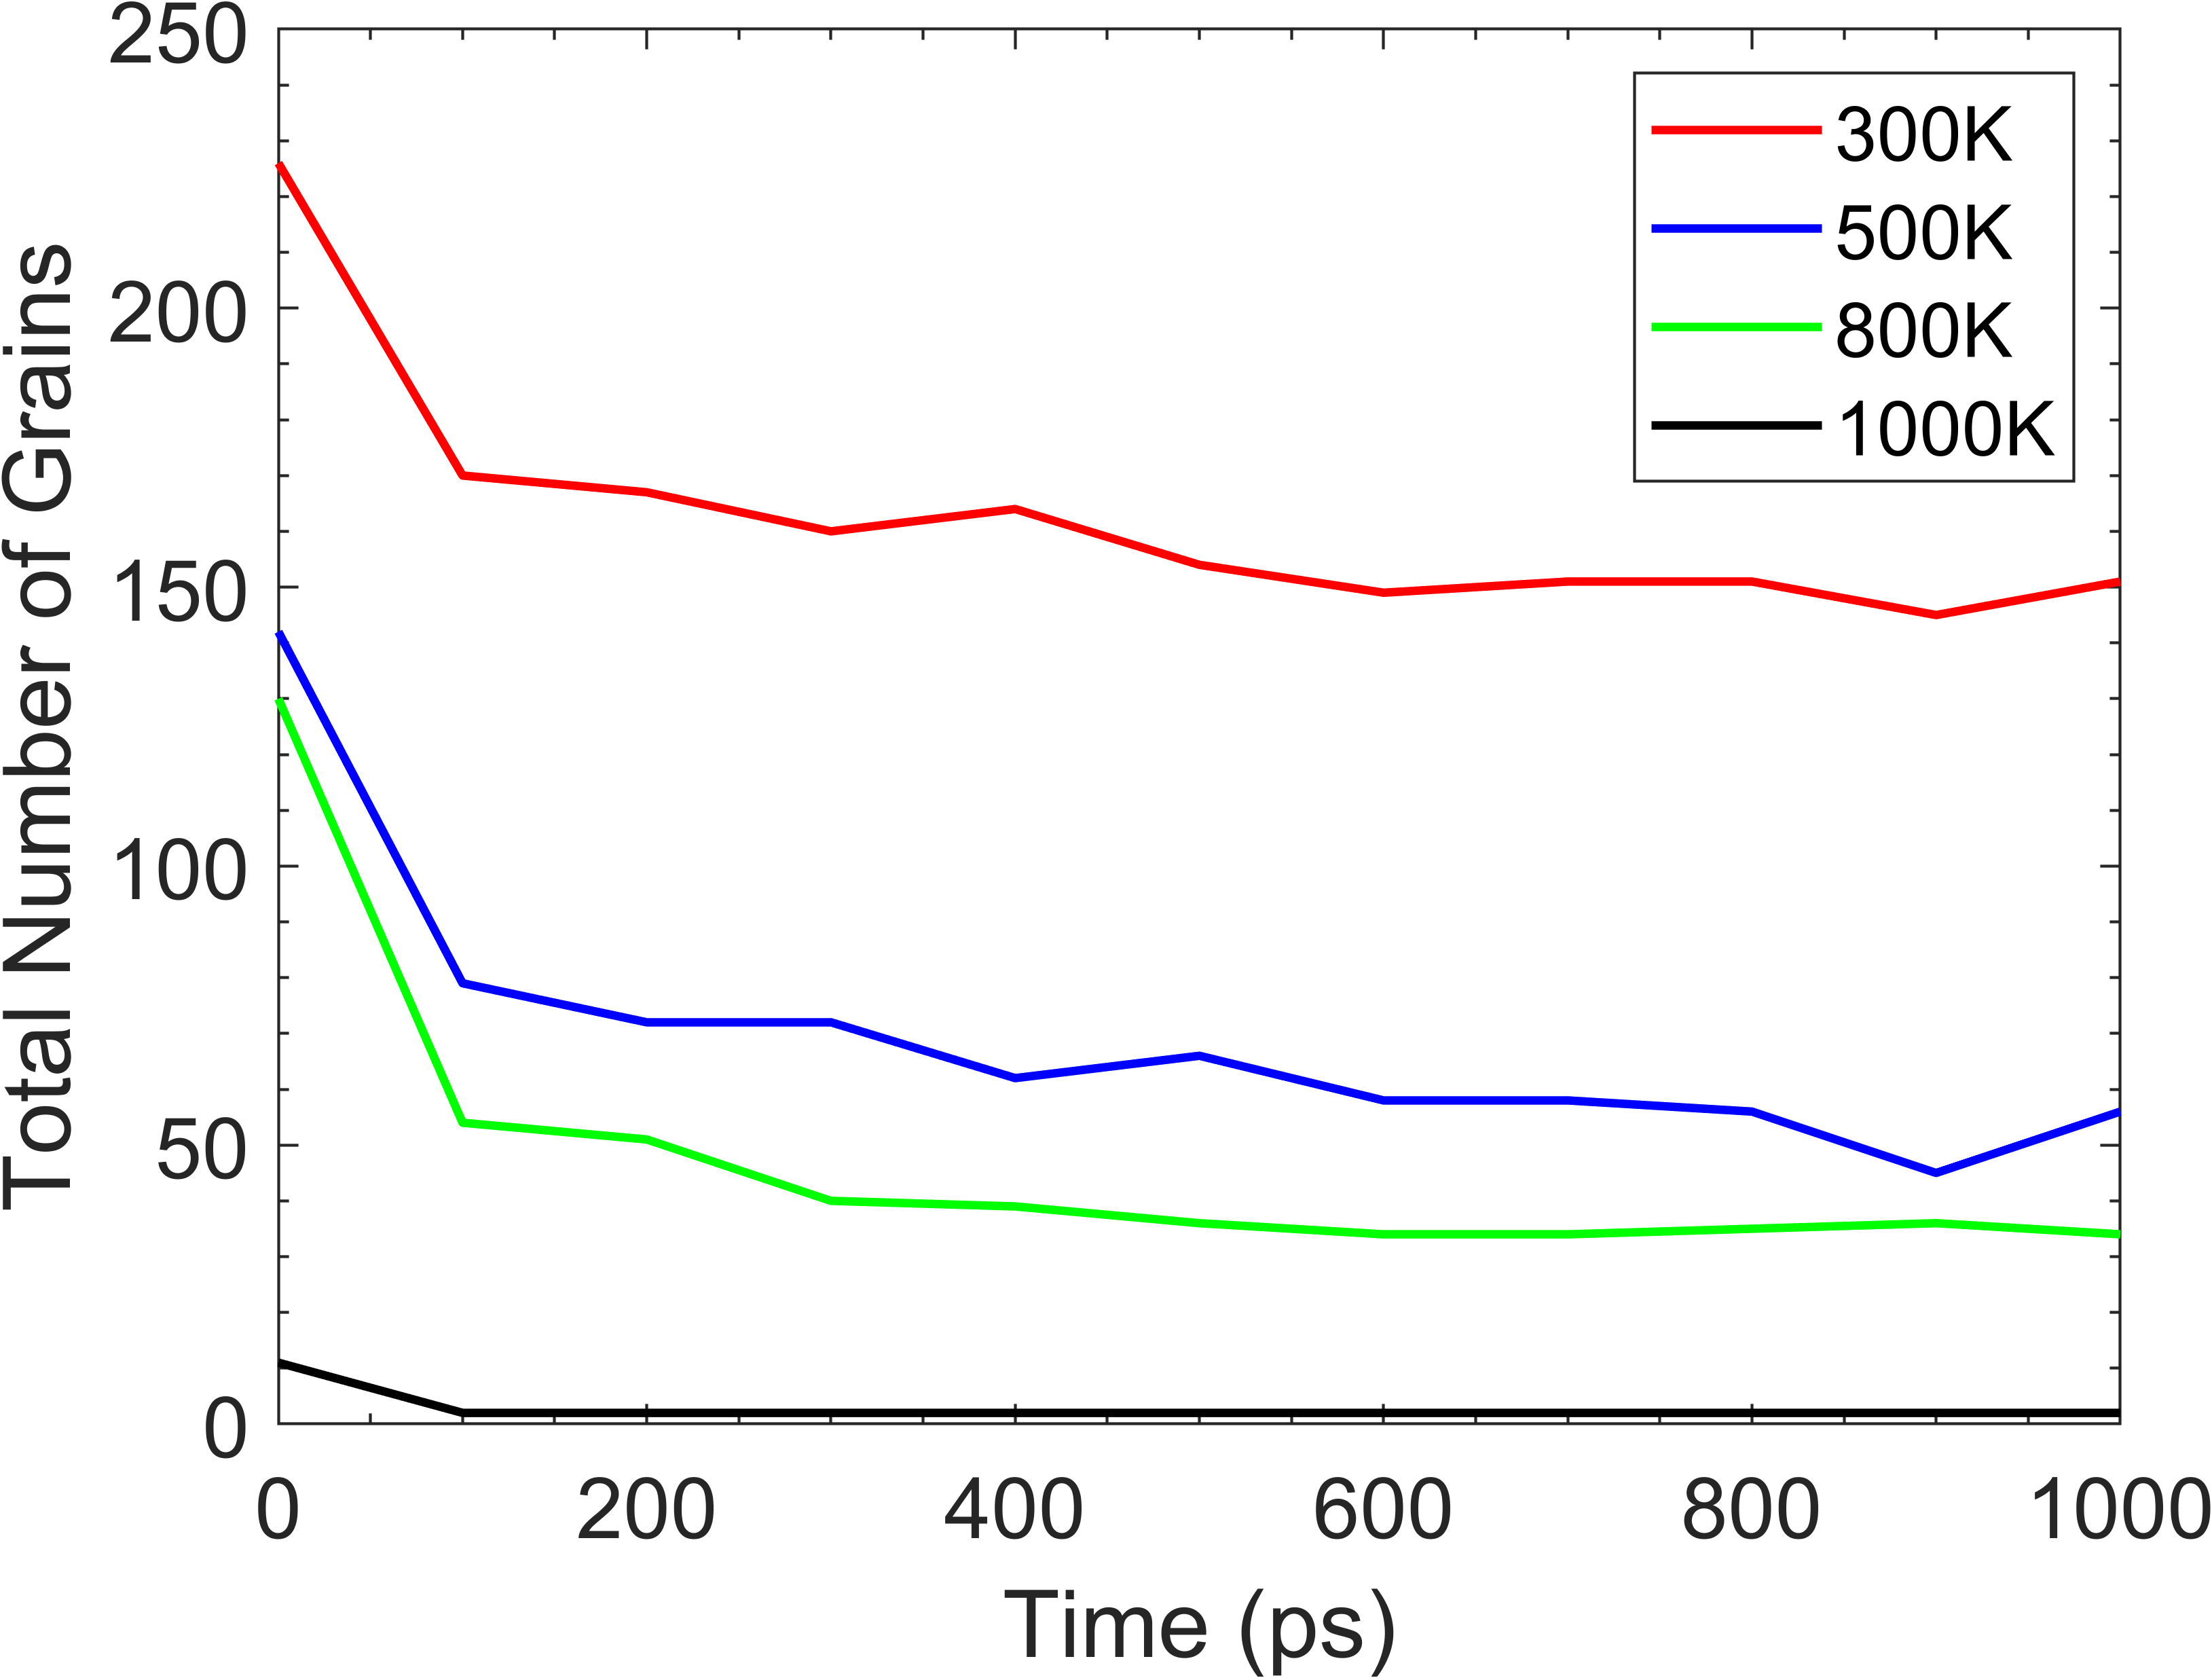
It was important to assess the stability of the newly formed grains to assess their usefulness for future simulations. The benchmark simulation and the variable temperature simulations from Section 3 were chosen for assessment. These cells were thermalised for 1ns using the NPH ensemble, with the Langevin thermostat keeping the temperature at 300 K, 500 K, 800 K, and 1000 K. Figure 20 shows the total number of grains present after the 1ns run time for each simulation cell. For the purposes of this comparison, the minimum grain size was taken as 50 atoms.
Inspection of Figure 20 shows that all cells follow similar trends. There is first a reduction in the number of grains found in the cell, after which the number of grains stabilises after around 700 ps of thermalisation. The 300 K, 500 K, and 800 K simulations all stabilise at around 150, 56, and 35 grains, respectively. It is shown that the 1000 K simulation stabilises much earlier, at a value of 2 grains. As such, it is inferred that the nanocrystalline structure will remain stable at finite temperatures.
References
- Govender et al. [2014] G. Govender, H. Möller, and O. Damm, 5.06 - semisolid processes, in Comprehensive Materials Processing, edited by S. Hashmi, G. F. Batalha, C. J. Van Tyne, and B. Yilbas (Elsevier, Oxford, 2014) pp. 109–134.
- Agarwal et al. [2019] K. M. Agarwal, R. K. Tyagi, V. K. Chaubey, and A. Dixit, Comparison of different methods of severe plastic deformation for grain refinement, IOP Conference Series: Materials Science and Engineering 691, 012074 (2019).
- Zhilyaev et al. [2005] A. Zhilyaev, K. Oh-ishi, T. Langdon, and T. McNelley, Microstructural evolution in commercial purity aluminum during high-pressure torsion, Materials Science and Engineering: A 410-411, 277 (2005), the Langdon Symposium: Flow and forming of Crystalline Materials.
- Ito and Horita [2009] Y. Ito and Z. Horita, Microstructural evolution in pure aluminum processed by high-pressure torsion, Materials Science and Engineering: A 503, 32 (2009), international Symposium on Bulk Nanostructured Materials: from Fundamentals to Innovation, BNM 2007.
- Jamalian et al. [2019] M. Jamalian, M. Hamid, N. De Vincentis, Q. Buck, D. P. Field, and H. M. Zbib, Creation of heterogeneous microstructures in copper using high-pressure torsion to enhance mechanical properties, Materials Science and Engineering: A 756, 142 (2019).
- Bryła et al. [2018] K. Bryła, J. Morgiel, M. Faryna, K. Edalati, and Z. Horita, Effect of high-pressure torsion on grain refinement, strength enhancement and uniform ductility of ez magnesium alloy, Materials Letters 212, 323 (2018).
- Mohd Yusuf et al. [2021] S. M. Mohd Yusuf, Y. Chen, and N. Gao, Influence of high-pressure torsion on the microstructure and microhardness of additively manufactured 316l stainless steel, Metals 11, 1553 (2021).
- Borodachenkova et al. [2017] M. Borodachenkova, W. Wen, and A. M. de Bastos Pereira, High‐pressure torsion: Experiments and modeling, in Severe Plastic Deformation Techniques, edited by M. Cabibbo (IntechOpen, Rijeka, 2017) Chap. 4.
- Xu et al. [2022] W. Xu, J. Yu, L. Jia, C. Gao, Z. Miao, G. Wu, G. Li, and Z. Zhang, Grain refinement impact on the mechanical properties and wear behavior of Mg-9Gd-3Y-2Zn-0.5Zr alloy after decreasing temperature reciprocating upsetting-extrusion, Journal of Magnesium and Alloys 10, 3506 (2022).
- Li and Lu [2021] X. Li and K. Lu, Refining grains of metals through plastic deformation: Toward grain size limits, Accounts of Materials Research 2, 108 (2021), https://doi.org/10.1021/accountsmr.0c00075 .
- Starink et al. [2009] M. J. Starink, X. G. Qiao, J. Zhang, and N. Gao, Predicting grain refinement by cold severe plastic deformation in alloys using volume averaged dislocation generation, Acta Materialia 57, 5796 (2009).
- Liu et al. [2010] M. Liu, H. Roven, X. Liu, M. Murashkin, R. Valiev, T. Ungár, and L. Balogh, Grain refinement in nanostructured al–mg alloys subjected to high pressure torsion, Journal of Materials Science 45, 4659 (2010).
- Borodachenkova et al. [2015] M. Borodachenkova, F. Barlat, W. Wen, A. Bastos, and J. Grácio, A microstructure-based model for describing the material properties of al–zn alloys during high pressure torsion, International Journal of Plasticity 68, 150 (2015).
- Luo et al. [2019] J. Luo, W. Yu, C. Xi, C. Zhang, and C. Ma, Preparation of ultrafine-grained gh4169 superalloy by high-pressure torsion and analysis of grain refinement mechanism, Journal of Alloys and Compounds 777, 157 (2019).
- Wu et al. [2017] W. Wu, M. Song, S. Ni, J. Wang, Y. Liu, B. Liu, and X. Liao, Dual mechanisms of grain refinement in a fecocrni high-entropy alloy processed by high-pressure torsion, Scientific Reports 7, 46720 (2017).
- Isik et al. [2016] M. Isik, M. Niinomi, H. Liu, K. Cho, M. Nakai, Z. Horita, S. Sato, T. Narushima, H. Yilmazer, and M. Nagasako, Grain refinement mechanism and evolution of dislocation structure of co–cr–mo alloy subjected to high-pressure torsion, MATERIALS TRANSACTIONS 57, 1109 (2016).
- Verleysen et al. [2013] P. Verleysen, F. Van den Abeele, and J. Degrieck, Numerical simulation of severe plastic deformation during high pressure torsion processing, in SIMULIA, Proceedings (2013) p. 9.
- Pereira and Figueiredo [2019] P. H. R. Pereira and R. B. Figueiredo, Finite element modelling of high-pressure torsion: An overview, MATERIALS TRANSACTIONS 60, 1139 (2019).
- Kim [2001] H. S. Kim, Finite element analysis of high pressure torsion processing, Journal of Materials Processing Technology 113, 617 (2001), 5th Asia Pacific conference on Materials processing.
- Yoon et al. [2008] S. C. Yoon, Z. Horita, and H. S. Kim, Finite element analysis of plastic deformation behavior during high pressure torsion processing, Journal of Materials Processing Technology 201, 32 (2008), 10th International Conference on Advances in Materials and Processing Technologies.
- Zhang et al. [2017a] X. Zhang, Z. Chen, and Y. Liu, Chapter 6 - constitutive models, in The Material Point Method, edited by X. Zhang, Z. Chen, and Y. Liu (Academic Press, Oxford, 2017) pp. 175–219.
- Wei et al. [2019] P. Wei, H. Zhou, H. Liu, C. Zhu, W. Wang, and G. Deng, Investigation of grain refinement mechanism of nickel single crystal during high pressure torsion by crystal plasticity modeling, Materials 12, 10.3390/ma12030351 (2019).
- Frydrych and Kowalczyk-Gajewska [2018] K. Frydrych and K. Kowalczyk-Gajewska, Grain refinement in the equal channel angular pressing process: simulations using the crystal plasticity finite element method, Modelling and Simulation in Materials Science and Engineering 26, 065015 (2018).
- Mecking et al. [1996] H. Mecking, U. Kocks, and C. Hartig, Taylor factors in materials with many deformation modes, Scripta Materialia 35, 465 (1996).
- Schiøtz and Jacobsen [2003] J. Schiøtz and K. W. Jacobsen, A maximum in the strength of nanocrystalline copper, Science 301, 1357 (2003), https://www.science.org/doi/pdf/10.1126/science.1086636 .
- Merzhievsky et al. [2016] L. A. Merzhievsky, I. F. Golovnev, and E. I. Golovneva, Molecular-dynamic simulation of nanocrystal structure evolution under dynamic loading, AIP Conference Proceedings 1785, 10.1063/1.4967018 (2016), 020002, https://pubs.aip.org/aip/acp/article-pdf/doi/10.1063/1.4967018/7485459/020002_1_online.pdf .
- Kotrechko et al. [2006] S. Kotrechko, A. Filatov, and A. Ovsjannikov, Molecular dynamics simulation of deformation and failure of nanocrystals of bcc metals, Theoretical and Applied Fracture Mechanics 45, 92 (2006).
- Wang et al. [2016] P. Wang, X. Yang, and D. Peng, Molecular dynamics investigation of the grain boundary migration hysteresis of nanocrystalline ni under cyclic shear loading, Modelling and Simulation in Materials Science and Engineering 25, 025006 (2016).
- Agarwal et al. [2016] G. Agarwal, G. Paun, R. R. Valisetty, R. Namburu, A. M. Rajendran, and A. M. Dongare, Atomistic study of deformation and failure behavior in nanocrystalline mg, MRS Advances 1, 3859–3864 (2016).
- Husain et al. [2020] A. Husain, P. La, Y. Hongzheng, and S. Jie, Molecular dynamics as a means to investigate grain size and strain rate effect on plastic deformation of 316 l nanocrystalline stainless-steel, Materials 13, 10.3390/ma13143223 (2020).
- Nikonov [2018] A. Y. Nikonov, Molecular dynamics study of the behavior of single- and polycrystals of BCC Fe under shear loading conditions, AIP Conference Proceedings 2051, 10.1063/1.5083456 (2018), 020213, https://pubs.aip.org/aip/acp/article-pdf/doi/10.1063/1.5083456/13354336/020213_1_online.pdf .
- Guan et al. [2022] X. Guan, A. Liang, and P. Branicio, High pressure shear induced microstructural evolution in nanocrystalline aluminum, Computational Materials Science 203, 111105 (2022).
- Baluc et al. [2003] N. Baluc, R. Schäublin, P. Spätig, and M. Victoria, On the potentiality of using ferritic/martensitic steels as structural materials for fusion reactors, Nuclear Fusion 44, 56 (2003).
- Zinkle and Was [2013] S. Zinkle and G. Was, Materials challenges in nuclear energy, Acta Materialia 61, 735 (2013), the Diamond Jubilee Issue.
- Zinkle and Busby [2009] S. J. Zinkle and J. T. Busby, Structural materials for fission & fusion energy, Materials Today 12, 12 (2009).
- Garner et al. [2000] F. A. Garner, M. B. Toloczko, and B. H. Sencer, Comparison of swelling and irradiation creep behavior of fcc-austenitic and bcc-ferritic/martensitic alloys at high neutron exposure, Journal of Nuclear Materials 276, 123 (2000).
- Thompson et al. [2022] A. P. Thompson, H. M. Aktulga, R. Berger, D. S. Bolintineanu, W. M. Brown, P. S. Crozier, P. J. in ’t Veld, A. Kohlmeyer, S. G. Moore, T. D. Nguyen, R. Shan, M. J. Stevens, J. Tranchida, C. Trott, and S. J. Plimpton, Lammps - a flexible simulation tool for particle-based materials modeling at the atomic, meso, and continuum scales, Computer Physics Communications 271, 108171 (2022).
- Hirel [2015] P. Hirel, Atomsk: A tool for manipulating and converting atomic data files, Computer Physics Communications 197, 212 (2015).
- Ackland et al. [2004] G. J. Ackland, M. I. Mendelev, D. J. Srolovitz, S. Han, and A. V. Barashev, Development of an interatomic potential for phosphorus impurities in -iron, Journal of Physics: Condensed Matter 16, S2629 (2004).
- Hao et al. [2022] J. Hao, L. Casillas-Trujillo, and H. Xu, Using lifetime of point defects for dislocation bias in bcc fe, Current Opinion in Solid State and Materials Science 26, 10.1016/j.cossms.2022.101021 (2022), cited by: 0.
- Li et al. [2023] X. Li, C. Ding, Y. Zhang, Y. Xu, X. Li, X. Wang, Q. Fang, X. Wu, and C. Liu, Vacancy accumulation mechanism at iron grain boundaries: The influence of grain boundary character and its coupling with grain size, Journal of Nuclear Materials 579, 10.1016/j.jnucmat.2023.154386 (2023), cited by: 0.
- Terentyev et al. [2011a] D. Terentyev, K. Vörtler, C. Björkas, K. Nordlund, and L. Malerba, Primary radiation damage in bcc fe and fe-cr crystals containing dislocation loops, Journal of Nuclear Materials 417, 1063 – 1066 (2011a), cited by: 25.
- Li et al. [2012] Y. Li, S. Hu, C. H. Henager Jr., H. Deng, F. Gao, X. Sun, and M. A. Khaleel, Computer simulations of interstitial loop growth kinetics in irradiated bcc fe, Journal of Nuclear Materials 427, 259 – 267 (2012), cited by: 25.
- Hepburn and Ackland [2008] D. J. Hepburn and G. J. Ackland, Metallic-covalent interatomic potential for carbon in iron, Phys. Rev. B 78, 165115 (2008).
- ye Li et al. [2021] J. ye Li, H. cai Xie, W. qing Meng, X. ming Zhang, W. hong Zhao, and G. feng Shi, Evolution mechanism of subsurface defect structure in particle micro-cutting iron–carbon alloy process, Proceedings of the Institution of Mechanical Engineers, Part J: Journal of Engineering Tribology 235, 931 (2021), https://doi.org/10.1177/1350650120928225 .
- Terentyev et al. [2011b] D. Terentyev, N. Anento, A. Serra, V. Jansson, H. Khater, and G. Bonny, Interaction of carbon with vacancy and self-interstitial atom clusters in -iron studied using metallic–covalent interatomic potential, Journal of Nuclear Materials 408, 272 (2011b).
- Granberg et al. [2015] F. Granberg, D. Terentyev, and K. Nordlund, Interaction of dislocations with carbides in bcc fe studied by molecular dynamics, Journal of Nuclear Materials 460, 23 (2015).
- Gunkelmann et al. [2012] N. Gunkelmann, H. Ledbetter, and H. M. Urbassek, Experimental and atomistic study of the elastic properties of Fe-C martensite, Acta Materialia 60, 4901 (2012).
- Chandrasekhar [1943] S. Chandrasekhar, Stochastic problems in physics and astronomy, Rev. Mod. Phys. 15, 1 (1943).
- Kubo [1966] R. Kubo, The fluctuation-dissipation theorem, Reports on Progress in Physics 29, 255 (1966).
- Mason [2015] D. Mason, Incorporating non-adiabatic effects in embedded atom potentials for radiation damage cascade simulations, Journal of Physics: Condensed Matter 27, 145401 (2015).
- Stukowski [2009] A. Stukowski, Visualization and analysis of atomistic simulation data with ovito–the open visualization tool, Modelling and Simulation in Materials Science and Engineering 18, 015012 (2009).
- Larsen et al. [2016] P. M. Larsen, S. Schmidt, and J. Schiøtz, Robust structural identification via polyhedral template matching, Modelling and Simulation in Materials Science and Engineering 24, 055007 (2016).
- Dai [2015] J. S. Dai, Euler–rodrigues formula variations, quaternion conjugation and intrinsic connections, Mechanism and Machine Theory 92, 144 (2015).
- Albou et al. [2010] A. Albou, J. Driver, and C. Maurice, Microband evolution during large plastic strains of stable 110〈112〉 al and al–mn crystals, Acta Materialia 58, 3022 (2010).
- Stukowski et al. [2012] A. Stukowski, V. V. Bulatov, and A. Arsenlis, Automated identification and indexing of dislocations in crystal interfaces, Modelling and Simulation in Materials Science and Engineering 20, 085007 (2012).
- Ni et al. [2011] S. Ni, Y. Wang, X. Liao, S. Alhajeri, H. Li, Y. Zhao, E. Lavernia, S. Ringer, T. Langdon, and Y. Zhu, Grain growth and dislocation density evolution in a nanocrystalline ni–fe alloy induced by high-pressure torsion, Scripta Materialia 64, 327 (2011).
- Zhang et al. [2017b] Y. Zhang, G. J. Tucker, and J. R. Trelewicz, Stress-assisted grain growth in nanocrystalline metals: Grain boundary mediated mechanisms and stabilization through alloying, Acta Materialia 131, 39 (2017b).
- Alaneme and Okotete [2019] K. K. Alaneme and E. A. Okotete, Recrystallization mechanisms and microstructure development in emerging metallic materials: A review, Journal of Science: Advanced Materials and Devices 4, 19 (2019).
- Rohrer [2011] G. S. Rohrer, Grain boundary energy anisotropy: a review, Journal of Materials Science 46, 5881 (2011).
- Mullins [2004] W. W. Mullins, Two‐Dimensional Motion of Idealized Grain Boundaries, Journal of Applied Physics 27, 900 (2004), https://pubs.aip.org/aip/jap/article-pdf/27/8/900/7922977/900_1_online.pdf .
- Ma et al. [2023] P.-W. Ma, D. R. Mason, S. Van Boxel, and S. L. Dudarev, Athermal evolution of nanocrystalline tungsten driven by irradiation, Journal of Nuclear Materials 586, 154662 (2023).
- Castan et al. [2013] C. Castan, F. Montheillet, and A. Perlade, Dynamic recrystallization mechanisms of an Fe-8% Al low density steel under hot rolling conditions, Scripta Materialia 68, 360 (2013).
- Wan et al. [2017] Z. Wan, Y. Sun, L. Hu, and H. Yu, Experimental study and numerical simulation of dynamic recrystallization behavior of TiAl-based alloy, Materials & Design 122, 11 (2017).
- EBRAHIMI et al. [2012] G. EBRAHIMI, A. MALDAR, H. MONAJATI, and M. HAGHSHENAS, Hot deformation behavior of az91 magnesium alloy in temperature ranging from 350°c to 425°c, Transactions of Nonferrous Metals Society of China 22, 2066 (2012).
- Zhang et al. [2013] Y. Zhang, S. Jiang, Y. Liang, and L. Hu, Simulation of dynamic recrystallization of niti shape memory alloy during hot compression deformation based on cellular automaton, Computational Materials Science 71, 124 (2013).
- Klimenkov et al. [2011] M. Klimenkov, E. Materna-Morris, and A. Möslang, Characterization of radiation induced defects in eurofer 97 after neutron irradiation, Journal of Nuclear Materials 417, 124 (2011), proceedings of ICFRM-14.
- Dethloff et al. [2016] C. Dethloff, E. Gaganidze, and J. Aktaa, Microstructural defects in eurofer 97 after different neutron irradiation conditions, Nuclear Materials and Energy 9, 471 (2016).
- Schäublin et al. [2017] R. Schäublin, B. Décamps, A. Prokhodtseva, and J. Löffler, On the origin of primary ½ a0 ¡111¿ and a0 ¡100¿ loops in irradiated fe(cr) alloys, Acta Materialia 133, 427 (2017).
- Humphreys and Hatherly [2004] F. Humphreys and M. Hatherly, Chapter 13 - hot deformation and dynamic restoration, in Recrystallization and Related Annealing Phenomena (Second Edition), edited by F. Humphreys and M. Hatherly (Elsevier, Oxford, 2004) second edition ed., pp. 415–V.
- Wang and Lei [1994] R. Wang and T. Lei, Dynamic recrystallization of ferrite in a low carbon steel during hot rolling in the (f+a) two-phase range, Scripta Metallurgica et Materialia 31, 1193 (1994).
- Tsuji et al. [1998] N. Tsuji, Y. Matsubara, Y. Saito, and T. Maki, Occurrence of dynamic recrystallization in ferritic iron, Journal of the Japan Institute of Metals 62, 967 (1998).
- McQueen [2001] H. McQueen, Dynamic recovery and recrystallization, in Encyclopedia of Materials: Science and Technology, edited by K. J. Buschow, R. W. Cahn, M. C. Flemings, B. Ilschner, E. J. Kramer, S. Mahajan, and P. Veyssière (Elsevier, Oxford, 2001) pp. 2375–2381.
- Sellars [1986] C. Sellars, Modelling of structural evolution during hot working processes. (1986) p. 167 – 187, cited by: 41.
- Ziman [2001] J. Ziman, Electrons and Phonons: The Theory of Transport Phenomena in Solids (Oxford University Press, 2001).
- Nielsen and Martins [2021] C. V. Nielsen and P. A. Martins, Chapter 2 - formability*, in Metal Forming, edited by C. V. Nielsen and P. A. Martins (Academic Press, 2021) pp. 7–107.
- Jiang et al. [2022] J. Jiang, F. Jiang, and M. Zhang, Dynamic recrystallization and precipitation in an al–mg–sc alloy: effect of strain rate, Journal of Materials Research and Technology 19, 1444 (2022).
- Mouritz [2012] A. P. Mouritz, 4 - strengthening of metal alloys, in Introduction to Aerospace Materials (Woodhead Publishing, 2012) pp. 57–90.
- Milošev et al. [2021] I. Milošev, V. Levašič, S. Kovač, T. Sillat, S. Virtanen, V.-M. Tiainen, and R. Trebše, 3 - metals for joint replacement, in Joint Replacement Technology (Third Edition), Woodhead Publishing Series in Biomaterials, edited by P. Revell (Woodhead Publishing, 2021) third edition ed., pp. 65–122.
- Cleaves and Hiegel [1942] H. Cleaves and J. Hiegel, Properties of high-purity iron, Journal of Research of the National Bureau of Standards 28, 643 (1942).
- Causey et al. [2012] R. Causey, R. Karnesky, and C. San Marchi, 4.16 - tritium barriers and tritium diffusion in fusion reactors, in Comprehensive Nuclear Materials, edited by R. J. Konings (Elsevier, Oxford, 2012) pp. 511–549.
- H. K. D. H. Bhadeshia [2006] R. W. K. H. H. K. D. H. Bhadeshia, Steels: Microstructure and Properties, 3rd ed. (Elsevier, Butterworth-Heinemann, Amsterdam ; Boston, 2006).
- Stein [1966] D. Stein, The effect of carbon on the strain-rate sensitivity of iron single crystals, Acta Metallurgica 14, 99 (1966).
- Shu and Wang [2007] X. L. Shu and C. Y. Wang, The motion of dislocation in iron pinning by carbon interstitials, in PRICM 6, Materials Science Forum, Vol. 561 (Trans Tech Publications Ltd, 2007) pp. 1865–1868.
- Sutton and Ballufi [2009] A. Sutton and R. Ballufi, Interfaces in Crystalline Materials, 1st ed., Oxford Classic Texts in the Physical Sciences (Oxford University Press, 2009).
- Wert [1950] C. A. Wert, Diffusion coefficient of c in -iron, Phys. Rev. 79, 601 (1950).
- Kandaskalov et al. [2022] D. Kandaskalov, L. Huang, J. Emo, and P. Maugis, Carbon diffusion in bcc- and bct-fe: Influence of short-range c–c pair interactions studied from first-principles calculations, Materials Chemistry and Physics 286, 126159 (2022).
- Tapasa et al. [2007] K. Tapasa, A. Barashev, D. Bacon, and Y. Osetsky, Computer simulation of carbon diffusion and vacancy–carbon interaction in -iron, Acta Materialia 55, 1 (2007).
- Fu et al. [2008] C.-C. Fu, E. Meslin, A. Barbu, F. Willaime, and V. Oison, Effect of c on vacancy migration in -iron, Solid State Phenomena 139, 157 (2008).
- Jiang and Carter [2003] D. E. Jiang and E. A. Carter, Carbon dissolution and diffusion in ferrite and austenite from first principles, Phys. Rev. B 67, 214103 (2003).
- Domain et al. [2004] C. Domain, C. S. Becquart, and J. Foct, Ab initio study of foreign interstitial atom (c, n) interactions with intrinsic point defects in -fe, Phys. Rev. B 69, 144112 (2004).
- ARGON [1996] A. ARGON, Chapter 21 - mechanical properties of single-phase crystalline media: Deformation at low temperatures, in Physical Metallurgy (Fourth Edition), edited by R. W. CAHN and P. HAASEN† (North-Holland, Oxford, 1996) fourth edition ed., pp. 1877–1955.
- Schmid and Boas [1950] E. Schmid and W. Boas, Plasticity of crystals: With special reference to metals (Citeseer, 1950).
- Barrett et al. [1937] C. Barrett, G. Ansel, and R. Mehl, Slip, twinning and cleavage in iron and silicon ferrite, Trans. ASM 25, 702 (1937).
- Anderson et al. [2017] P. M. Anderson, J. P. Hirth, and J. Lothe, Theory of Dislocations, 3rd Edition (Cambridge University Press, 2017).
- Nemat-Nasser [2002] S. Nemat-Nasser, Experimentally-based micromechanical modeling of metal plasticity with homogenization from micro-to macro-scale properties, in IUTAM Symposium on Micro- and Macrostructural Aspects of Thermoplasticity, edited by O. T. Bruhns and E. Stein (Springer Netherlands, Dordrecht, 2002) pp. 101–113.
- Mason et al. [2021] D. R. Mason, F. Granberg, M. Boleininger, T. Schwarz-Selinger, K. Nordlund, and S. L. Dudarev, Parameter-free quantitative simulation of high-dose microstructure and hydrogen retention in ion-irradiated tungsten, Phys. Rev. Mater. 5, 095403 (2021).
- Mortazavi et al. [2015] N. Mortazavi, M. Esmaily, and M. Halvarsson, The capability of transmission kikuchi diffraction technique for characterizing nano-grained oxide scales formed on a fecral stainless steel, Materials Letters 147, 42 (2015).