Accretion disk wind of Hercules X-1 during the Short High state
Abstract
Hercules X-1 is a nearly edge-on X-ray binary with a warped, precessing accretion disk, which manifests through a 35-day cycle of alternating High and Low flux states. This disk precession introduces a changing line of sight towards the X-ray source, through an ionized accretion disk wind. The sightline variation allows us to uniquely determine how the wind properties vary with height above the disk. All the previous wind measurements were made in the brighter Main High state of Her X-1. Here, we analyze the only Chandra observation during the fainter ‘Short’ High state, and significantly detect blueshifted ionized absorption. We find a column density of cm-2, an ionization parameter /erg cm s= and an outflow velocity of km/s. The properties of the outflow measured during the Short High state are in good agreement with those measured at equivalent precession phases during Main High. We conclude that we are sampling the same wind structure, seen during both Main and Short High, which is precessing alongside with the warped accretion disk every 35 days. Finally, the high spectral resolution of Chandra gratings above 1 keV in this observation enabled us to measure the abundances of certain elements in the outflow. We find Mg/O, Si/O and S/O, whereas in our previous study of Her X-1 with XMM-Newton, we found an over-abundance of N, Ne and Fe compared with O. These peculiar abundance ratios were likely introduced by pollution of the donor by the supernova which created Her X-1.
1 Introduction
Hercules X-1 (hereafter Her X-1, Giacconi et al., 1972) is one of the most complex and fascinating X-ray binaries in the X-ray sky. Fortuitously, its proximity (6.1 kpc, Leahy & Abdallah, 2014) and high intrinsic luminosity ( erg/s) permit detailed X-ray studies and allowed us to understand some of its mysteries. The compact object is a neutron star with a rotation period of 1.24 s (determined from the presence of X-ray pulsations, Tananbaum et al., 1972; Giacconi et al., 1973) and a surface magnetic field of G, estimated from the energy of the cyclotron resonance scattering feature (Truemper et al., 1978; Staubert et al., 2019). The neutron star is fed from an intermediate mass donor with an orbital period of 1.7 days (HZ Her, Davidsen et al., 1972; Bahcall & Bahcall, 1972; Middleditch & Nelson, 1976) through a tilted, twisted and precessing accretion disk (Gerend & Boynton, 1976; Ogilvie & Dubus, 2001), oriented almost edge-on towards us, such that eclipses by HZ Her are observed.
The disk shape and precession manifests in the long-term evolution of Her X-1 flux, by introducing a day cycle of High and Low flux states (Katz, 1973). The cycle begins by a turn-on into the Main High state, during which the inner accretion flow (emitting the majority of X-rays) is directly observable from our line of sight. About 10 days later, the precessing inner edge of the accretion disk starts to obscure the X-ray source. This Low State is followed by a second, fainter Short High state (Fabian, 1973), during which the X-ray source is just barely uncovered by the accretion disk (Scott et al., 2000; Leahy, 2002) and Her X-1 reaches about one third of the maximum Main High state flux. Finally, a second Low State of the 35-day cycle follows, when the X-ray source is again fully covered. For an illustration of these variations, we refer to Fig. 2 of Scott et al. (2000), which shows an average lighturve of the 35-day Her X-1 cycle, obtained by stacking many cycles observed with the RXTE instrument (see also Fig. 4 in this paper for an example of a single cycle).
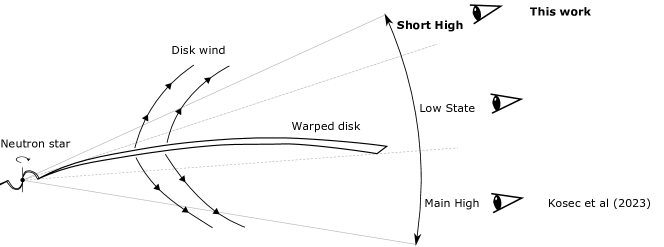
The warped disk precession results in our line of sight passing through different paths through the accretion flow, and specifically at different heights above the warped disk. A unique opportunity is thus provided to us - our line of sight samples and allows us to study any ionized material over a range of heights above the disk. Namely, we are able to study the vertical distribution of the properties of the accretion disk wind of Her X-1. A schematic of this situation is shown in Fig. 1.
Accretion disk winds were detected via Doppler shifted emission or absorption lines in X-ray spectra in both black hole (Kotani et al., 2000; Miller et al., 2006b; Kubota et al., 2007) and neutron star X-ray binaries (Ueda et al., 2001; Miller et al., 2011) and show typical velocities of 100s km/s (for a recent review, see Neilsen & Degenaar, 2023). They appear to be common especially in high inclination soft state black hole systems (Ponti et al., 2012), suggesting an equatorial wind structure. More recently, outflows were also detected in X-ray binaries outside the X-ray band - in the UV, optical and IR bands, and during both hard and soft states (e.g. Muñoz-Darias et al., 2019; Sánchez-Sierras & Muñoz-Darias, 2020; Castro Segura et al., 2022; Muñoz-Darias & Ponti, 2022).
The origin and the launching mechanisms of these phenomena are widely debated - they could be driven by Compton heating of the outer parts of the accretion disk (Begelman et al., 1983; Tomaru et al., 2018), or via magnetic fields (Miller et al., 2006a; Chakravorty et al., 2016; Fukumura et al., 2017), but are unlikely to be driven by radiation pressure alone (Proga & Kallman, 2002). These outflows have potential to drive away significant fractions of the originally accreting mass (e.g. Lee et al., 2002; Kosec et al., 2020) and thus affect the evolution of the X-ray binary (Verbunt, 1993; Ziółkowski & Zdziarski, 2018). However, it is challenging to accurately constrain the wind energetics as in most systems we only observe a single line of sight towards the X-ray source. Therefore, X-ray absorption line spectroscopy gives us only a very limited view of the 3D wind structure (although see Miller et al., 2015a, for an approach using wind re-emission). As Her X-1 uniquely offers a range of sightlines above the accretion disk, it is an ideal source to study disk winds in order to determine their launching mechanisms and measure their energetics.
An accretion disk wind was confirmed in Her X-1 using Main High state XMM-Newton observations by Kosec et al. (2020), but previous UV observations already showed the presence of an ionized outflow within the binary system (Boroson et al., 2001). This outflow was predicted by Schandl & Meyer (1994) and could be the driver of the disk warping (although see Ogilvie & Dubus, 2001, for an alternative radiation-driven warping mechanism). To follow-up on the opportunity to study the vertical structure of a disk wind, we performed a large XMM-Newton and Chandra campaign, densely sampling the wind properties during a single Her X-1 Main High state (Kosec et al., 2023). We found that the wind is weaker and clumpier at greater heights above the disk, and combining the wind measurements with a Her X-1 warped disk model, we produced a 2D map of the wind properties.
Both of the X-ray studies described above were based solely on Main High state observations, where the high flux of Her X-1 results in the highest statistics spectra. However, the fact that the wind is detected in all Main High state observations suggests that the wind is most likely present in Her X-1 at all times. As the outer accretion disk obscures the main X-ray source during the Low States, the detection of an ionized absorber at these periods is challenging. On the other hand, the central source is directly visible again during the Short High state, meaning it should also be possible to see the wind during this state too (Fig. 1).
Additionally, the binary system of Her X-1 and HZ Her is not oriented perfectly edge-on, but has an inclination of (Leahy & Abdallah, 2014), which is also the average inclination of the warped accretion disk. Therefore, our line of sight during at least part of the Short High state could sample lower heights above the warped disk compared with Main High. This may happen because during the Main High, the outer disk quickly moves out of our line of sight right after the Turn-on, whereas during the Short High, different parts of the disk move away slower and remain relatively close to our line of sight for prolonged periods of time. This situation and the position of our line of sight over time with respect to different parts of the warped disk is illustrated in Fig. 2 of Scott et al. (2000) and in Fig. 3 of Leahy (2002). Following the results of the Main High state wind studies, the wind column density is expected to be higher at lower heights above the disk.
Here we study an archival high-spectral resolution Chandra observation of Her X-1 from Nov 2002, which reveals a number of narrow absorption lines, similar to those detected in Her X-1 spectra taken during the Main High state. The structure of this paper is as follows. Section 2 describes our data preparation and Section 3 the spectral modelling methods. In Section 4 we present the results of this study, and in Section 5 we discuss their implications. Throughout the paper, we assume a distance of 6.1 kpc to Her X-1 (Leahy & Abdallah, 2014).
2 Data Reduction and preparation
Chandra (Weisskopf et al., 2002) observed Her X-1 once during its Short High state, on November 3 2002 (observation ID 4375). This is the first time this observation has been studied in detail and published. The observation exposure was 20.4 ks, and the HETG gratings (Canizares et al., 2005) were used to acquire X-ray data in high spectral resolution. The midpoint of the observation was at MJD=52581.414. The data were taken in the continuous clocking (CC) mode and the mean count rate (all instruments summed) was 9.4 ct/s.
The data were downloaded from the TGCAT archive (Huenemoerder et al., 2011) in fully reduced form. We use both Medium Energy Grating (MEG) and High Energy Grating (HEG) instruments, and stack the positive and negative first order spectra for each instrument using the combine_grating_spectra routine in CIAO (Fruscione et al., 2006). We analyzed the data in full spectral resolution without any binning. We also tested our final spectral fit with the optimal binning scheme (Kaastra & Bleeker, 2016), but found no differences in the final results. The HEG and MEG spectra were fitted simultaneously using a cross-calibration constant. The value of this parameter was always very close to 1, indicating % calibration difference between the two instruments. We used HEG data in the energy range between 1 and 9 keV (1.4 to 12.4 Å), and MEG data in the range between 0.62 keV and 5 keV (2.5 to 20Å). These limits were imposed by the instrument calibration and the signal-to-noise.
The spectra were fitted in the spex fitting package version 3.06.01 (Kaastra et al., 1996). All reduced spectra were converted from ogip format into spex format using the trafo routine. We used the Cash statistic (Cash, 1979), which is appropriate for un-binned data, to analyze all spectra. The uncertainties are provided at 1 significance.
3 Spectral modelling
We apply the spectral model from Kosec et al. (2022) to describe the Her X-1 continuum emission during Short High. Fortunately, we are able to make some simplifications to the complex original model due to the different instrument used here. For further details about the individual spectral components, we refer the reader to section 4 of Kosec et al. (2022).
A comt model (Titarchuk, 1994) is used to describe the primary accretion column emission from the X-ray pulsar, and a bb model describes the soft (T keV) reprocessed emission. As our coverage of the soft X-ray band ( keV) is limited, we fix the blackbody temperature to 0.1 keV. We also model Fe line emission in the Fe K band. We use two Gaussian emission lines, a narrow line at 6.4 keV (low ionization Fe), and a medium-width line at 6.7 keV (Fe XXV). A highly broadened (FWHM keV) Fe K line at keV, seen during the Main High state of Her X-1 (Kosec et al., 2022), is not required in our Short High state observation. This is likely a signal-to-noise issue - our Chandra HETG spectrum has much lower statistics in the Fe K band than the Main High state XMM-Newton EPIC-pn spectrum. On the other hand, we do observe a strong excess at 1 keV (the ‘1 keV feature’ seen in the Main High state, e.g. Fürst et al., 2013), which we model with a highly broadened Gaussian emission line. This excess is likely due to a forest of Fe L lines, possibly mixed with Ne IX-X emission. Finally, we also include a broadened emission line at 18.96 Å (0.65 keV) to describe O VIII emission, seen also during the Main High state. The O VIII position is very close to the lower energy limit of our coverage, so we freeze the line wavelength to 18.96 Å. As our band does not cover softer energies than 0.6 keV, we do not need to include any further lines to describe O VII, N VII and N VI emission. Finally, all of the source emission is obscured by Galactic absorption, which is described by the hot model as an almost neutral absorber with a temperature of keV (de Plaa et al., 2004; Steenbrugge et al., 2005). We fit for the column density of this absorber, but set a lower limit of cm-2 (HI4PI Collaboration et al., 2016).
The absorption lines from the disk wind are described with the pion spectral model (Miller et al., 2015b; Mehdipour et al., 2016). pion takes the spectral energy distribution (SED) from the currently loaded continuum spectral model and self-consistently calculates the ionizing balance and the line depths produced by an illuminated, photo-ionized slab of plasma. We use the model to determine the disk wind properties such as its column density, ionization parameter, systematic velocity, and its velocity width.
Additionally, pion can be used to fit for the elemental abundances in the outflow. In Kosec et al. (2023) we fitted for the abundance of N, Ne and Fe, while fixing the abundance of O to 1 (one of the elemental abundances must be fixed as all the disk wind absorption lines are from metals). Here we use the best-fitting abundances from that paper, determined from the higher statistics Main High state XMM-Newton spectra: we fix N/O=3.4, Ne/O=2.3 and Fe/O=2.1. However, the broader energy band in which HETG offers very good spectral resolution (and does not suffer from instrumental issues as EPIC pn on XMM-Newton) allows us to reliably fit for further elemental abundances: we can determine the abundance of Mg, Si and S. We have previously used 3 Chandra HETG spectra to study Her X-1 in the Main High state (Kosec et al., 2023), but were not able to constrain the Mg, S and Si elemental abundances because the wind was weaker in those 3 Chandra observations in comparison with the Short High state exposure analyzed here. The abundances of these three elements are left as free parameters in our spectral fit.
The final model, in symbolic form, is thus: hot x pion x (comt + bb + 4 ga).
4 Results
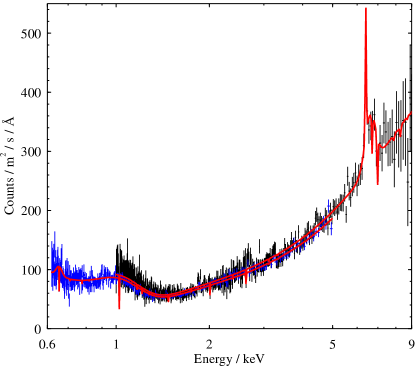
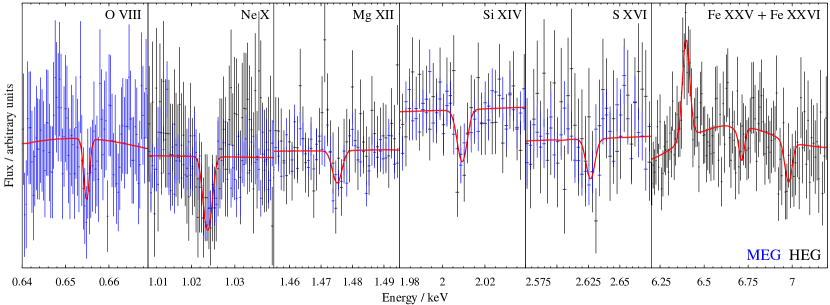
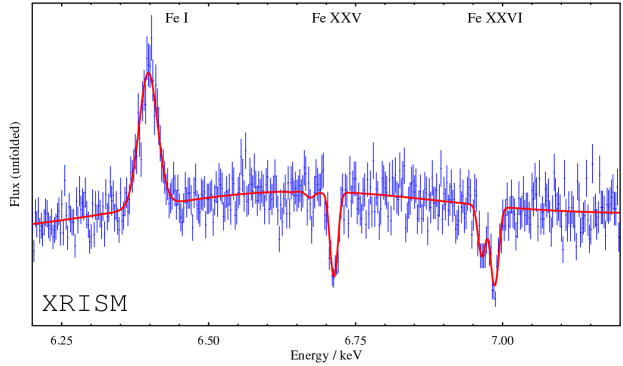
The high-resolution Chandra HETG spectrum reveals a number of absorption lines located near strong Ly elemental transitions of O, Ne, Si and S. The HETG spectrum, focusing on only on the strongest elemental transitions, is shown in Fig. 3. These absorption lines suggest the presence of a highly ionized outflow with a low blueshift/velocity ( km/s). We fit the spectrum with the spectral model described in Section 3. This results in a fit with C-stat=8599 for 7888 degrees of freedom (DoF). A continuum-only spectral fit, where the pion component is omitted, results in fit statistic C-stat=8767 for 7895 DoF. The very large fit statistic improvement of C-stat=168 upon adding the ionized absorber to the baseline spectral fit, even compared to observations during the brighter Main High state (Extended Data Table 1 of Kosec et al., 2023), indicates a very high statistical detection (, Kosec et al., 2018) of the disk wind during this Short High state observation of Her X-1. The best-fitting spectral model is shown in Fig. 2 (which contains the full keV broadband fit) and in Fig. 3 (focusing only on the narrow energy bands around the strongest disk wind absorption lines).
The best-fitting disk wind properties are as follows. We determine a column density of cm-2, an ionization parameter /erg cm s of , a systematic velocity of km/s and a velocity width km/s. The orbital motion-corrected outflow velocity is km/s, determined by following the steps from Kosec et al. (2020). The measured elemental abundances are Mg/O=, Si/O= and S/O=. These results are summarized alongside all the best-fitting continuum parameters in Table 1.
We tested for the multi-phase nature of the disk wind by adding a second pion component to the previous spectral fit. A second ionization component could potentially alter the best-fitting elemental abundances and shift them back towards Solar ratios. However, by fitting this more complex spectral model for a range of pion parameter values, we did not find any significant evidence (C-stat) for a second ionization zone. Similar results were found in the Main High State (Kosec et al., 2023).
| Component | Parameter | Best-fitting value |
|---|---|---|
| Disk | column density | cm-2 |
| wind | /erg cm s | |
| outflow velocity | km/s | |
| velocity width | km/s | |
| Mg/O | ||
| Si/O | ||
| S/O | ||
| C-stat | ||
| Primary | seed temp. | keV |
| Comptonization | electron temp. | keV |
| optical depth | ||
| luminosity | erg/s | |
| Soft blackbody | temperature | 0.1 keV (fixed) |
| luminosity | erg/s | |
| 1 keV | energy | keV |
| feature | FWHM | keV |
| luminosity | erg/s | |
| Fe I | energy | keV |
| FWHM | keV | |
| luminosity | erg/s | |
| Fe XXV | energy | keV |
| FWHM | keV | |
| luminosity | erg/s | |
| O VIII | energy | 0.654 keV (fixed) |
| FWHM | keV | |
| luminosity | erg/s |
5 Discussion and conclusions
We study an archival Short High state observation of Her X-1 taken with the Chandra HETG instrument. The gratings allow us to resolve and detect the same narrow absorption lines from an ionized disk wind that are present in the Main High state observations. We model the absorber with the photo-ionization model pion and determine the wind properties and the abundances of certain elements within the outflow, leveraging the broader energy band of HETG in comparison with XMM-Newton RGS.
To compare the properties of the disk wind during the Short High state observation with our previous study during Main High (Kosec et al., 2023), we determine the current precession phase as well as the time elapsed since the Short High state Rise for the archival Chandra observation. In order to estimate these quantities, we use archival RXTE/ASM observations. A lightcurve of the relevant Her X-1 precession cycle is shown in Fig. 4.
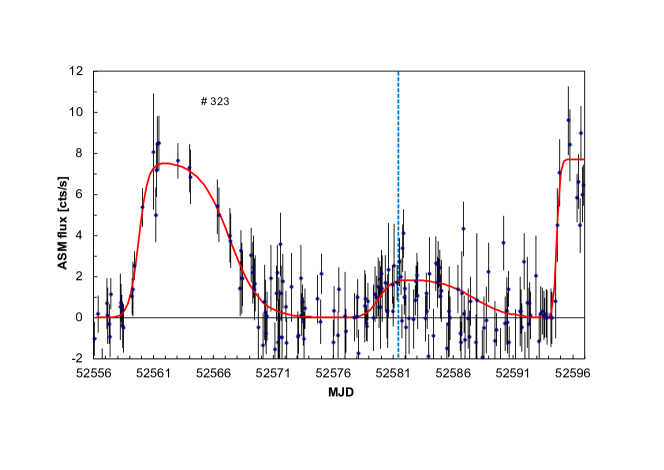
The measurements of the Turn-on (into the Main High state) and the Rise (into the Short High state) are based on formal best fits with a double exponential function, which has been found to produce good fits to 35-day cycle lightcurves of Her X-1 (Staubert et al., 2016). Following the method of Staubert et al. (2016), we determined the Main High Turn-on times for the current (MJD) and the following (MJD) 35-day cycles. We then estimated the precession phase of the Chandra observation to be . To find the phase elapsed since the Short High state Rise, we also determined the Short High Rise time from the Her X-1 lightcurve to be MJD. This means that the Short High Rise occurred at a precession phase of . The mid-point of the Chandra observation hence happened at phase of since Her X-1 rose into the Short High state.
We note that the Rise into the Short High state in Her X-1 does not occur exactly one half of the 35-day cycle after the Main High Turn-on. This is because the binary system is not aligned exactly edge-on towards us, but with a more moderate inclination of about (Leahy & Abdallah, 2014). For this reason, for any comparisons between the Main High and the Short High state wind properties, it is necessary to correctly account for both Main High Turn-ons and Short High Rise times in order to determine the correct equivalent precession phases of both high states. Otherwise, the Short High state properties will be shifted.
In Fig. 5, we compare the best-fitting wind column density and ionization parameter during the Short High with previous measurements made during the Main High state (presented in Kosec et al., 2023). We find that both the column density and the ionization parameter are in good general agreement with wind parameter measurements at equivalent precession phases during the Main High state. This suggests that we are observing the same wind structure which was detected during the Main High state, and that the structure does not vary strongly between the two high states, as it precesses alongside with the warped accretion disk.
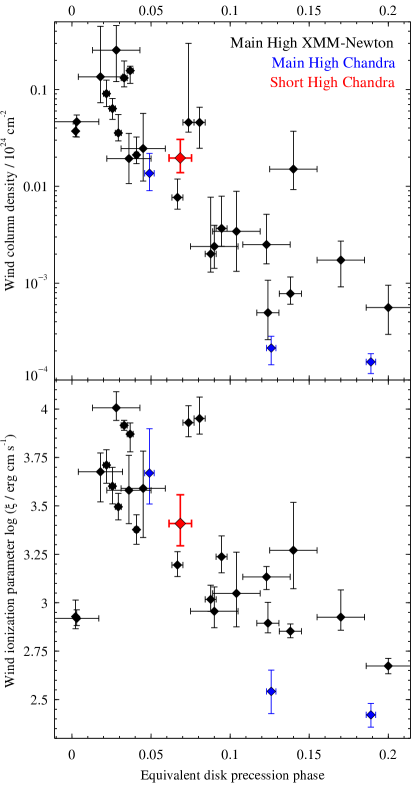
During the Main High, we found that the wind column density decreases with increasing precession phase, i.e. with increasing height above the warped accretion disk (Kosec et al., 2023). In other words, the wind is weakening at greater heights above the disk. It is plausible that the same relationship is followed during the Short High state. This will be probed by our upcoming XMM-Newton and Chandra observation campaign (to occur in 2023).
We can also estimate the location of the outflow during the Short High state observation and compare it with Main High measurements. Following the approach of Kosec et al. (2023), we can determine the maximum distance of the outflow from the ionizing source such as:
| (1) |
where is the ionizing (13.6 eV - 13.6 keV) luminosity. The estimated observed during the Chandra observation is erg/s. Therefore, the maximum distance of the outflow from the neutron star is cm. We compare this value with the maximum distances of the wind from the ionizing source during the Main High state (Fig. 3 of Kosec et al., 2023). We find that the maximum distance of the outflow from the X-ray source is roughly comparable with the maximum distances derived for wind measurements taken around phase during the Main High state.
In addition to the column density and the ionization parameter, we also measure the wind outflow velocity and velocity width. These parameters are again consistent with those measured during Main High. The outflow velocity was observed to vary between 200 and 1000 km/s during the Main High (compared with km/s during Short High), while the velocity width was in most observations measured to be between 70 and 500 km/s (versus km/s during the Short High observation).
Thanks to the Chandra HETG broader bandpass (observed in high-resolution), we are additionally able to measure elemental abundances of certain elements inaccessible to XMM-Newton. Those elements are Mg, Si and S. While technically included in the RGS band, the Mg XII line is not as well detected and resolved in the RGS data as with HETG data, preventing a direct abundance measurement. We find that both Mg and Si are about 50% super-abundant compared to O, while the S/O ratio is as high as 3.
Combining these measurements with previous XMM-Newton results (Kosec et al., 2023) on other elemental abundances (N/O, Ne/O, Fe/O), we find that all the elements are super-abundant compared with O. This is seen at low statistical significance for Mg and Si, but is significant for the remaining 4 elements. These peculiar abundances are presumed to have originated by pollution of the donor by the supernova which created Her X-1 (Jimenez-Garate et al., 2002, 2005). An alternative explanation may be that O is depleted rather than other elements being over-abundant. However, it is not likely that O would be strongly under-abundant since the CNO cycle (presumably operating in the Her X-1 progenitor) will create a strong over-abundance of N and a strong under-abundance of C, without heavily depleting the O abundance (Przybilla et al., 2010). The UV spectra of Her X-1 indeed show over-abundance of N and depletion of C (Boroson et al., 1997). On the other hand, how the heavier elements such as S and Fe become super-abundant by a factor of 2-3, is unclear. We note that Allen et al. (2018) found evidence for non-Solar elemental ratios of certain heavier elements including Mg and Ca in the neutron star X-ray binary GX 13+1. Similarly, Kallman et al. (2009) found an over-abundance of Fe-group elements in the black hole X-ray binary GRO J1655-40 and suggested that these findings are consistent with enrichment by a core-collapse supernova. In any case, further spectroscopic observations (of Her X-1 and other X-ray binaries) are necessary to decrease the currently significant uncertainties on the measured abundances to confirm these findings.
Finally, we also measure the properties of the various prominent emission lines of Her X-1 during Short High. The position of the narrow Fe line is fully consistent with 6.4 keV, i.e. with low ionization Fe (Fe I up to Fe XIII), while the position of the medium-width Fe line is consistent at with Fe XXV. These line energies as well as the line widths are consistent with the lines detected in Her X-1 during Main High (Kosec et al., 2022). The same is found for the width of the O VIII line, and for both the energy and the width of the 1 keV broad residual.
The upcoming XRISM observatory (XRISM Science Team, 2020), expected to be launched in 2023 will revolutionize the X-ray spectroscopic studies of X-ray binaries thanks to its Resolve calorimeter with a resolution of just 5-7 eV (e.g. Tomaru et al., 2020). To investigate how XRISM will be able to improve our measurements of the disk wind in Her X-1, we simulated a brief 10 ks observation of the Short High state using the best-fitting spectral parameters from the Chandra observation used in this work. We used publicly available XRISM simulation files111https://heasarc.gsfc.nasa.gov/docs/xrism/proposals/ assuming the goal 5 eV spectral resolution. The simulated data are shown in Fig. 6, focusing just on the Fe K energy band where XRISM will achieve the best results.
The XRISM statistics are much higher than those of Chandra HETG across the full energy range, in agreement with its superior effective area over Chandra. The simulated spectrum has a count rate of about 45 ct/s. At soft energies (e.g. the Ne X transition at keV), the spectral resolution of XRISM is lower than that of Chandra HETG. The resolutions of the instruments are comparable at medium energies (e.g. around the S XVI transition at 2.6 keV). However, XRISM shines at high energies, particularly in the Fe K band, where it easily resolves individual wind absorption lines, their widths and their shapes. We particularly note that the broadening of the Fe XXV and XXVI absorption lines shown in Fig. 6 is not instrumental but due to the velocity width of the disk wind measured from the Chandra spectral fit.
We performed a spectral fit of this 10 ks XRISM mock simulation. The disk wind is detected over the baseline continuum with a fit improvement of C-stat=507, indicating a much stronger detection than in the longer 20 ks archival Chandra dataset (where C-stat=168 was measured). This indicates that we will be able to detect the wind during Short High and measure its properties in even shorter XRISM snapshots, with exposures possibly as low as 2-3 ks. Such low exposure requirement for measurements will allow us to search for any short-term wind variability.
The wind parameters are also significantly better constrained in the 10 ks XRISM exposure in comparison with Chandra data: the column density will be determined with a precision of cm-2 (10% precision), the ionization parameter /erg cm s will be measured with a precision of 0.04, and the outflow velocity and velocity width with a precision of 20 km/s. The uncertainties on the abundance of Mg and Si will shrink by roughly a third, while the uncertainties on the S abundance will decrease by a factor of 2. Clearly, even very brief XRISM snapshots will allow detailed measurements of the accretion disk wind in Her X-1 and in comparably bright X-ray binaries.
In conclusion, the Chandra observation of Her X-1 during the Short High state reveals the same outflow detected during the Main High. The best-fitting wind properties during Short High are broadly consistent with those determined at an equivalent precession phase during the Main High, after taking into account the delayed Short High state Rise time. By combining the results from both the Main High and the Short High, we will be able to probe the vertical structure of the disk wind of Her X-1 in great detail over a broad range of heights. This will allow us to understand, for the first time, the 3D structure and energetics of such an outflow, inaccessible in other systems with fixed sightlines without full 3D modelling of the wind re-emission. Future observations with XRISM (to be launched in 2023) will allow precision measurements of the Her X-1 wind properties, particularly thanks to its superior resolution in the Fe K band. Her X-1 may thus be the Rosetta stone of X-ray binary accretion disk winds, which will allow us to fully determine their physics, energetics and 3D geometry.
References
- Allen et al. (2018) Allen, J. L., Schulz, N. S., Homan, J., et al. 2018, ApJ, 861, 26, doi: 10.3847/1538-4357/aac2d1
- Bahcall & Bahcall (1972) Bahcall, J. N., & Bahcall, N. A. 1972, ApJ, 178, L1, doi: 10.1086/181070
- Begelman et al. (1983) Begelman, M. C., McKee, C. F., & Shields, G. A. 1983, ApJ, 271, 70
- Boroson et al. (1997) Boroson, B., Blair, W. P., Davidsen, A. F., et al. 1997, ApJ, 491, 903
- Boroson et al. (2001) Boroson, B., Kallman, T., & Vrtilek, S. D. 2001, ApJ, 562, 925, doi: 10.1086/323850
- Canizares et al. (2005) Canizares, C. R., Davis, J. E., Dewey, D., et al. 2005, PASP, 117, 1144, doi: 10.1086/432898
- Cash (1979) Cash, W. 1979, ApJ, 228, 939, doi: 10.1086/156922
- Castro Segura et al. (2022) Castro Segura, N., Knigge, C., Long, K. S., et al. 2022, Nature, 603, 52, doi: 10.1038/s41586-021-04324-2
- Chakravorty et al. (2016) Chakravorty, S., Petrucci, P. O., Ferreira, J., et al. 2016, A&A, 589, A119, doi: 10.1051/0004-6361/201527163
- Davidsen et al. (1972) Davidsen, A., Henry, J. P., Middleditch, J., & Smith, H. E. 1972, ApJ, 177, L97, doi: 10.1086/181060
- Davison & Fabian (1977) Davison, P. J. N., & Fabian, A. C. 1977, MNRAS, 178, 1P, doi: 10.1093/mnras/178.1.1P
- de Plaa et al. (2004) de Plaa, J., Kaastra, J. S., Tamura, T., et al. 2004, A&A, 423, 49, doi: 10.1051/0004-6361:20047170
- Fabian (1973) Fabian, A. C. 1973, Nature, 244, 212, doi: 10.1038/244212a0
- Fruscione et al. (2006) Fruscione, A., McDowell, J. C., Allen, G. E., et al. 2006, in Society of Photo-Optical Instrumentation Engineers (SPIE) Conference Series, Vol. 6270, Society of Photo-Optical Instrumentation Engineers (SPIE) Conference Series, ed. D. R. Silva & R. E. Doxsey, 62701V, doi: 10.1117/12.671760
- Fukumura et al. (2017) Fukumura, K., Kazanas, D., Shrader, C., et al. 2017, Nature Astronomy, 1, 0062
- Fürst et al. (2013) Fürst, F., Grefenstette, B. W., Staubert, R., et al. 2013, ApJ, 779, 69, doi: 10.1088/0004-637X/779/1/69
- Gerend & Boynton (1976) Gerend, D., & Boynton, P. E. 1976, ApJ, 209, 562, doi: 10.1086/154751
- Giacconi et al. (1973) Giacconi, R., Gursky, H., Kellogg, E., et al. 1973, ApJ, 184, 227, doi: 10.1086/152321
- Giacconi et al. (1972) Giacconi, R., Murray, S., Gursky, H., et al. 1972, ApJ, 178, 281, doi: 10.1086/151790
- HI4PI Collaboration et al. (2016) HI4PI Collaboration, Ben Bekhti, N., Flöer, L., et al. 2016, A&A, 594, A116, doi: 10.1051/0004-6361/201629178
- Huenemoerder et al. (2011) Huenemoerder, D. P., Mitschang, A., Dewey, D., et al. 2011, AJ, 141, 129, doi: 10.1088/0004-6256/141/4/129
- Jimenez-Garate et al. (2002) Jimenez-Garate, M. A., Hailey, C. J., den Herder, J. W., Zane, S., & Ramsay, G. 2002, ApJ, 578, 391, doi: 10.1086/342348
- Jimenez-Garate et al. (2005) Jimenez-Garate, M. A., Raymond, J. C., Liedahl, D. A., & Hailey, C. J. 2005, ApJ, 625, 931, doi: 10.1086/426702
- Kaastra & Bleeker (2016) Kaastra, J. S., & Bleeker, J. A. M. 2016, A&A, 587, A151, doi: 10.1051/0004-6361/201527395
- Kaastra et al. (1996) Kaastra, J. S., Mewe, R., & Nieuwenhuijzen, H. 1996, in UV and X-ray Spectroscopy of Astrophysical and Laboratory Plasmas, 411–414
- Kallman et al. (2009) Kallman, T. R., Bautista, M. A., Goriely, S., et al. 2009, ApJ, 701, 865, doi: 10.1088/0004-637X/701/2/865
- Katz (1973) Katz, J. I. 1973, Nature Physical Science, 246, 87, doi: 10.1038/physci246087a0
- Kosec et al. (2020) Kosec, P., Fabian, A. C., Pinto, C., et al. 2020, MNRAS, 491, 3730, doi: 10.1093/mnras/stz3200
- Kosec et al. (2018) Kosec, P., Pinto, C., Walton, D. J., et al. 2018, MNRAS, 479, 3978, doi: 10.1093/mnras/sty1626
- Kosec et al. (2022) Kosec, P., Kara, E., Fabian, A. C., et al. 2022, ApJ, 936, 185, doi: 10.3847/1538-4357/ac897e
- Kosec et al. (2023) —. 2023, Nature Astronomy, 7, 715, doi: 10.1038/s41550-023-01929-7
- Kotani et al. (2000) Kotani, T., Ebisawa, K., Dotani, T., et al. 2000, ApJ, 539, 413, doi: 10.1086/309200
- Kubota et al. (2007) Kubota, A., Dotani, T., Cottam, J., et al. 2007, PASJ, 59, 185, doi: 10.1093/pasj/59.sp1.S185
- Leahy (2002) Leahy, D. A. 2002, MNRAS, 334, 847, doi: 10.1046/j.1365-8711.2002.05547.x
- Leahy & Abdallah (2014) Leahy, D. A., & Abdallah, M. H. 2014, ApJ, 793, 79, doi: 10.1088/0004-637X/793/2/79
- Lee et al. (2002) Lee, J. C., Reynolds, C. S., Remillard, R., et al. 2002, ApJ, 567, 1102, doi: 10.1086/338588
- Mehdipour et al. (2016) Mehdipour, M., Kaastra, J. S., & Kallman, T. 2016, A&A, 596, A65, doi: 10.1051/0004-6361/201628721
- Middleditch & Nelson (1976) Middleditch, J., & Nelson, J. 1976, ApJ, 208, 567, doi: 10.1086/154638
- Miller et al. (2015a) Miller, J. M., Fabian, A. C., Kaastra, J., et al. 2015a, ApJ, 814, 87
- Miller et al. (2011) Miller, J. M., Maitra, D., Cackett, E. M., Bhattacharyya, S., & Strohmayer, T. E. 2011, ApJ, 731, L7
- Miller et al. (2006a) Miller, J. M., Raymond, J., Fabian, A., et al. 2006a, Nature, 441, 953
- Miller et al. (2006b) Miller, J. M., Raymond, J., Homan, J., et al. 2006b, ApJ, 646, 394, doi: 10.1086/504673
- Miller et al. (2015b) Miller, J. M., Kaastra, J. S., Miller, M. C., et al. 2015b, Nature, 526, 542, doi: 10.1038/nature15708
- Muñoz-Darias & Ponti (2022) Muñoz-Darias, T., & Ponti, G. 2022, A&A, 664, A104, doi: 10.1051/0004-6361/202243769
- Muñoz-Darias et al. (2019) Muñoz-Darias, T., Jiménez-Ibarra, F., Panizo-Espinar, G., et al. 2019, ApJ, 879, L4, doi: 10.3847/2041-8213/ab2768
- Neilsen & Degenaar (2023) Neilsen, J., & Degenaar, N. 2023, arXiv e-prints, arXiv:2304.05412, doi: 10.48550/arXiv.2304.05412
- Ogilvie & Dubus (2001) Ogilvie, G. I., & Dubus, G. 2001, MNRAS, 320, 485, doi: 10.1046/j.1365-8711.2001.04011.x
- Ponti et al. (2012) Ponti, G., Fender, R. P., Begelman, M. C., et al. 2012, MNRAS, 422, L11, doi: 10.1111/j.1745-3933.2012.01224.x
- Proga & Kallman (2002) Proga, D., & Kallman, T. R. 2002, ApJ, 565, 455
- Przybilla et al. (2010) Przybilla, N., Firnstein, M., Nieva, M. F., Meynet, G., & Maeder, A. 2010, A&A, 517, A38
- Sánchez-Sierras & Muñoz-Darias (2020) Sánchez-Sierras, J., & Muñoz-Darias, T. 2020, A&A, 640, L3, doi: 10.1051/0004-6361/202038406
- Schandl & Meyer (1994) Schandl, S., & Meyer, F. 1994, A&A, 289, 149
- Scott et al. (2000) Scott, D. M., Leahy, D. A., & Wilson, R. B. 2000, ApJ, 539, 392, doi: 10.1086/309203
- Staubert et al. (1983) Staubert, R., Bezler, M., & Kendziorra, E. 1983, A&A, 117, 215
- Staubert et al. (2016) Staubert, R., Klochkov, D., Vybornov, V., Wilms, J., & Harrison, F. A. 2016, A&A, 590, A91, doi: 10.1051/0004-6361/201527955
- Staubert et al. (2019) Staubert, R., Trümper, J., Kendziorra, E., et al. 2019, A&A, 622, A61, doi: 10.1051/0004-6361/201834479
- Steenbrugge et al. (2005) Steenbrugge, K. C., Kaastra, J. S., Crenshaw, D. M., et al. 2005, A&A, 434, 569, doi: 10.1051/0004-6361:20047138
- Tananbaum et al. (1972) Tananbaum, H., Gursky, H., Kellogg, E. M., et al. 1972, ApJ, 174, L143, doi: 10.1086/180968
- Titarchuk (1994) Titarchuk, L. 1994, ApJ, 434, 570, doi: 10.1086/174760
- Tomaru et al. (2018) Tomaru, R., Done, C., Odaka, H., Watanabe, S., & Takahashi, T. 2018, MNRAS, 476, 1776
- Tomaru et al. (2020) Tomaru, R., Done, C., Ohsuga, K., Odaka, H., & Takahashi, T. 2020, MNRAS, 494, 3413, doi: 10.1093/mnras/staa961
- Truemper et al. (1978) Truemper, J., Pietsch, W., Reppin, C., et al. 1978, ApJ, 219, L105, doi: 10.1086/182617
- Ueda et al. (2001) Ueda, Y., Asai, K., Yamaoka, K., Dotani, T., & Inoue, H. 2001, ApJ, 556, L87
- Verbunt (1993) Verbunt, F. 1993, ARA&A, 31, 93, doi: 10.1146/annurev.aa.31.090193.000521
- Weisskopf et al. (2002) Weisskopf, M. C., Brinkman, B., Canizares, C., et al. 2002, PASP, 114, 1, doi: 10.1086/338108
- XRISM Science Team (2020) XRISM Science Team. 2020, arXiv e-prints, arXiv:2003.04962, doi: 10.48550/arXiv.2003.04962
- Ziółkowski & Zdziarski (2018) Ziółkowski, J., & Zdziarski, A. A. 2018, MNRAS, 480, 1580, doi: 10.1093/mnras/sty1948