Extraction of the neutron structure function from inclusive proton and deuteron deep-inelastic scattering data
Abstract
The available world deep-inelastic scattering data on proton and deuteron structure functions , , and their ratios, are leveraged to extract the free neutron structure function, the ratio, and associated uncertainties using the latest nuclear effect calculations in the deuteron. Special attention is devoted to the normalization of the proton and deuteron experimental datasets and to the treatment of correlated systematic errors, as well as the quantification of procedural and theoretical uncertainties. The extracted dataset is utilized to evaluate the dependence of the Gottfried sum rule and the nonsinglet moments. To facilitate replication of our study, as well as for general applications, a comprehensive DIS database including all recent JLab 6 GeV measurements, the extracted , a modified CTEQ-JLab global PDF fit named CJ15nlo_mod, and grids with calculated proton, neutron and deuteron DIS structure functions at next-to-leading order, are discussed and made publicly available.
I Introduction
Experimental data from deep-inelastic scattering (DIS) of leptons from nucleons have been pivotal in the study of nucleon structure for decades. In particular, DIS structure function measurements using charged lepton and neutrino beams have been used to extract parton distribution functions (PDFs), investigate scaling and scaling violation, and are generally the ubiquitous tool for studying Quantum Chromodynamics (QCD). An experimental difficulty in precision DIS nucleon structure studies is the use of nuclear targets, in particular, employment of deuterium as a surrogate neutron target. Here, Fermi motion, binding, and other nuclear effects in the deuteron render precision neutron measurements difficult, since these may change the shape of the free nucleon structure function. Yet, it is important to have experimental results for both protons and neutrons to separately determine - and -quark distributions at large parton momentum fractions , in order to fully understand the partonic structure of nucleons.
Deuteron nuclear corrections have been a challenge to experiments since the first DIS measurements at the Stanford Linear Accelerator Center (SLAC) in the 1970s Bodek and Ritchie (1981); Arrington et al. (2009, 2012). Recently, a new testing ground has been provided for these corrections through the CTEQ-Jefferson Lab (CJ) global PDF analysis effort Accardi et al. (2010, 2011); Owens et al. (2013); Accardi et al. (2016a), where the neutron extracted with cutting edge nuclear corrections has been assessed simultaneously with other high energy scattering data. The latter include, beside DIS on proton and deuteron targets, large rapidity -boson asymmetries in proton–antiproton collisions at the Tevatron Aaltonen et al. (2009); Abazov et al. (2014), which are sensitive to the to quark PDF ratio at large momentum fraction, and tagged DIS structure functions from the BONuS6 experiment Tkachenko et al. (2014) at Jefferson Lab (JLab), which select an effective neutron target. From agreement among the different datasets and nuclear versus nucleon targets in this more global context Accardi (2015), confidence may be placed in the nuclear corrections procedure applied, and constraints put on the nuclear correction model. This effort culminated in the CJ15 simultaneous PDF and nuclear correction model extraction Accardi et al. (2016a). Global analyses similar in spirit to CJ15 have subsequently been performed by Alëkhin, Kulagin and Petti (AKP) Alekhin et al. (2017a, 2022) and the Jefferson Lab Angular Momentum (JAM) Collaboration Cocuzza et al. (2021), with some important differences that will be discussed below. Deuterium data have thus entered an era where the neutron structure function can be more accurately obtained.
In fact, knowledge of both proton and neutron structure as measured by the corresponding structure functions and , respectively, and associated nucleon PDFs at large is central to a broad range of current scientific endeavors. Many present and planned experiments at JLab and other facilities seek to understand how the structure of bound objects such as nucleons can be described in terms of their fundamental partonic constituents. For example, the limit as is a testing ground for multiple perturbative and nonperturbative QCD predictions for the dependence of PDFs Melnitchouk and Thomas (1996); Isgur (1999); Brodsky et al. (1995); Holt and Roberts (2010); Roberts et al. (2013). In the unpolarized sector, this can be accessed by studying the ratio of -quark to -quark PDFs, which is directly constrained by the ratio of neutron to proton structure functions.
From a different perspective, reliable knowledge of PDFs at large is important for searches for new physics signals in collider experiments. This is especially true if the search involves a region where the rapidity of the measured final state is large, and the reaction is sensitive to convolutions of two PDFs evaluated with one value of being small and the other one large Brady et al. (2012); Accardi et al. (2016b). Furthermore, uncertainties in PDFs at large and low four-momentum transfer squared, , percolate through QCD evolution to affect cross sections at smaller values of the Bjorken- scaling variable (which at leading order in the strong coupling coincides with the parton momentum fraction ) and larger . In fact, nuclear corrections applied to DIS on deuteron targets, which are most prominent in the valence region at large , also impact sea quarks and gluon PDFs over a wider range of , and the achievement of precision in tests of the Standard Model in the electroweak sector will partly depend upon the successful treatment of nuclear corrections Accardi et al. (2021a). From yet another viewpoint, better control of nuclear corrections and a precise knowledge of the ratio at large for non-isoscalarity (the proton and neutron number imbalance) corrections will have a direct, measurable impact on the interpretation of current and future neutrino experiments Sajjad Athar and Morfín (2021), such as NOA Catano-Mur , DUNE Abed Abud et al. (2022), and MINERA Ruterbories et al. (2022), as a large part of the theoretical uncertainty is from the lack of knowledge of the neutrino–nucleus interaction in the large- valence regime.
On the theoretical front, lattice QCD simulations are providing increasingly precise predictions for moments of PDFs Lin et al. (2018), as well as first results for the dependence of PDFs Constantinou et al. (2021), along with structure functions themselves Can et al. (2020); Guzey et al. (2012a), particularly in the valence quark regime. While calculations can nowadays be performed at physical quark masses, control over a range of systematic uncertainties, such as lattice discretization and volume, is still being improved. An important benchmark for these calculations is provided by the first moment of the isovector quark PDF, which can be readily compared to moments calculated with PDFs extracted in global QCD analyses. It is also interesting to more directly compare the lattice moments to experimental data, which can be accomplished by measuring moments of the isovector structure functions, and using the operator product expansion to remove target mass corrections (TMCs). Phenomenological efforts in this direction have been restricted so far to specific experimental data choices Albayrak et al. (2019); Kotlorz et al. (2021), and the full power of the global DIS dataset has not yet been leveraged. Similarly to the moments, neutron structure function data come into play in the experimental determination of the Gottfried sum rule (GSR) Gottfried (1967); Kataev , through which constraints on the light antiquark distributions in the nucleon may be estimated as a complement to recent data from the SeaQuest experiment at Fermilab Dove et al. (2021). Here, again, previous extractions of the GSR have been limited to the analysis of specific datasets Arneodo et al. (1994a); Abbate and Forte (2005); Kotlorz et al. (2021), and the statistical power of the global DIS dataset has not been fully exploited.
The goal of the present work is to apply the CJ deuteron corrections Accardi et al. (2016a) to the large global DIS dataset, including measurements on proton and deuteron targets and their ratios, and to provide an extensive, state-of-the-art, neutron dataset. The extraction of the neutron structure function will be data driven, as much as possible, and the model dependence of the procedure confined to the deuteron to free nucleon ratio,
| (1) |
where the nucleon structure function, , and the per-nucleon structure function of the deuteron, , will be calculated with the PDFs and the nuclear correction model simultaneously fitted in the CJ15 global analysis Accardi et al. (2016a). Special attention will be devoted to the normalization of the and experimental data, and to the treatment of correlated systematic errors, as well the quantification of procedural and theoretical uncertainties. The obtained structure function dataset may be used for comparison to other current and future experimental analyses, as a convenient way to address deuteron nuclear corrections in other PDF extractions, or for other phenomenological analyses. In this paper, the new dataset will be utilized in revisiting several topics, including a new data-driven extraction of the GSR, for which we will provide for the first time the dependence, and an extraction of nonsinglet structure function moments for comparison with recent lattice QCD calculations. We will also discuss neutron excess corrections in DIS on heavy nuclear targets.
The extraction of a neutron structure function dataset is particularly timely given that an increasing number of experiments at JLab and elsewhere are or will soon be providing additional data using a variety of experimental techniques to remove or minimize the need for theoretical deuteron nuclear corrections. The BONuS12 experiment BONuS12 Collaboration (2006) at JLab, for instance, uses a spectator tagging technique pioneered in the 6 GeV era to create an effective, essentially free, neutron target Baillie et al. (2012); Tkachenko et al. (2014). The recently published from the MARATHON experiment Abrams et al. (2022), instead, used a theoretical super-ratio of the EMC effects in the 3H and 3He mirror nuclei from the AKP nuclear model Alekhin et al. (2017a, 2022) to extract with reduced nuclear correction uncertainties. A more general analysis by the JAM Collaboration Cocuzza et al. (2021) fitted simultaneously both the nucleon PDFs and the nuclear (off-shell) effects in the nuclei, which, in contrast to the AKP analysis, accounted for differences in the off-shell effects in the proton and neutron. Nevertheless, having determined the off-shell corrections from a global fit, and the EMC effect in 3H and 3He, one can use these corrections to extract from the MARATHON data the free neutron structure function. Care should be taken, however, to ensure that correlations between nucleon off-shell and higher twist (HT) effects and the relevant PDF parameters are properly taken into account Alekhin et al. (2023).
In addition to these experiments that are directly sensitive to the neutron structure function, precise data on inclusive deuteron and proton structure functions are expected from the JLab E12-10-002 experiment Malace et al. (2010), while the future SoLID program sol (2019) will measure parity-violating electron scattering, which is sensitive to the ratio using only a proton target. More proton and neutron tagging and weak current DIS structure function measurements are discussed at the Electron-Ion Collider Abdul Khalek et al. (2022). Moreover, -asymmetry measurements from RHIC at BNL Adam et al. (2021) and from the LHCb experiment at CERN Chatrchyan et al. (2014, 2012); Aad et al. (2012); Aaij et al. (2015); Khachatryan et al. (2016) are also sensitive to the quark, and will thus further help constrain the neutron structure function when included in a global QCD analysis.
This large and varied neutron structure function and -quark sensitive dataset will enable the neutron data from the precision deuterium extraction presented here to be leveraged in global QCD analyses to better disentangle effects from deuteron nuclear corrections. This should provide accurate knowledge of the neutron structure function, and allow a better understanding of the neutron in the nuclear environment.
The rest of this paper is organized as follows. In Sec. II we discuss how deuteron corrections are studied and constrained in the context of global QCD analyses, with particular attention to the CJ15 analysis that will be leveraged in the extraction of the neutron dataset. We also analyze differences with the recent AKP and JAM analyses, and briefly discuss their possible sources. In Sec. III we present our data-driven neutron extraction strategy and results, with a careful emphasis on experimental and theoretical uncertainties. The data selection criteria and cross-normalization procedure, which is of paramount importance to obtain precise neutron extraction, is also discussed in detail. In Sec. IV we provide several applications of the neutron data obtained in our analysis, including a new extraction of the Gottfried sum with the first-ever evaluation of its dependence, and a new extraction of nonsinglet moments for comparison to lattice QCD calculations. We also provide a new extraction of the ratio for use, for example, in neutron excess corrections. In Sec. V we summarize our results.
A nontrivial part of our work involved the construction of a database of world DIS data on proton and deuteron targets, whose usefulness goes beyond the application presented in this paper. We make public this database, supplemented by the extracted neutron structure function data and by the bin-centered data used in our phenomenological studies (see Appendix A). We also make public the modified set of CJ15 PDF named CJ15nlo_mod used in our analysis, along with structure function grids in LHAPDF format for proton, neutron and deuteron targets calculated at NLO (Appendix B). We provide instructions for using the DIS structure function grids to correct for nuclear (isoscalar) effects in nuclear cross sections in Appendix C.
II Deuteron corrections in global QCD analysis
Parton flavor separation can be most robustly performed through global QCD analysis Jimenez-Delgado et al. (2013); Gao et al. (2018); Kovařík et al. (2020); Ethier and Nocera (2020), which utilizes large collections of data from high-energy collisions sensitive to different underlying PDF combinations. Conversely, the extracted PDFs can be utilized in a perturbative pQCD calculation of the unmeasured free neutron structure function, or, as we will exploit in this article, of the deuteron to isoscalar nucleon structure function ratio, . This program necessitates, however, knowledge of the effects on PDFs of the nucleon binding forces in the deuteron in order to properly extract parton-level information from experiments on deuteron targets Accardi (2015).
Interest in deuteron corrections has recently increased in the global QCD analysis community because these not only impact the ratio at large momentum fractions, but also have important secondary effects on, e.g., the gluon or sea-quark PDFs at smaller values Accardi et al. (2021a). In a global fit, deuteron corrections can be applied at different levels of sophistication. For example, one can utilize data-driven phenomenological ratios to convert deuteron data to nucleon-level data Hou et al. (2021); Ball et al. (2021), parametrize and fit the nuclear deformation of PDFs Bailey et al. (2021); Martin et al. (2009), or utilizing a dynamical model of nuclear interactions to calculate deuteron observables as a double convolution of parton distributions and nucleon wave functions Accardi et al. (2016a); Alekhin et al. (2017a); Kulagin and Petti (2006). In the CJ approach adopted here, we focus on the latter class of corrections.
The CJ Collaboration CJ- (2023a) has performed a series of global QCD analyses of unpolarized PDFs Accardi et al. (2016a); Owens et al. (2013); Accardi et al. (2011, 2010) with the aim of maximally utilizing DIS data at the highest values amenable to perturbative QCD analysis. Special attention has been devoted to deuteron target dynamics, relevant at all energy scales, and to power corrections, such as HTs and TMCs, that become relevant for fixed target experiments probing low values of and invariant final state mass squared, . To separate the -quark and -quark PDFs, the CJ analysis fits DIS data from both hydrogen and deuterium targets. The theoretical description of the latter also requires a careful treatment of nuclear interactions, which modify the bound nucleon structure particularly at large values of at all scales. Since the -quark PDF is well constrained by a variety of , , and scattering data included in the global fit, the -quark PDF extraction is in practice rather sensitive to the neutron structure function, and corrections for nuclear effects in deuterium become a major factor in its accurate determination above . This extraction has, therefore, historically suffered from large uncertainties due to the model dependence of these nuclear effects Holt and Roberts (2010); Roberts et al. (2013).
Beyond deuterium DIS data, the CJ15 PDF analysis Accardi et al. (2016a) studied the impact on the determination of next-to-leading order (NLO) PDFs and their uncertainties from large rapidity charged-lepton Acosta et al. (2005); Abazov et al. (2013, 2015) and -boson asymmetry data Aaltonen et al. (2009); Abazov et al. (2014) from proton-antiproton collision at the Fermilab’s Tevatron collider. It also included, for the first time in a global QCD analysis, the novel JLab BONuS data on the free neutron structure function obtained from backward-spectator proton-tagged DIS on a deuterium target Tkachenko et al. (2014) — a technique utilized to effectively create a free neutron target from deuterium and significantly reduce the nuclear uncertainties that have afflicted previous neutron extractions. These two datasets provide the global fit with critical sensitivity to large- quarks and neutron structure. However, each data type presents positives and negatives within the global QCD fitting context: the -boson asymmetry data exist in the perturbative regime, and are directly sensitive to the quark without the kinematical smearing that affects the decay lepton measurements; however, the dataset is small and statistical reconstruction of the -boson kinematics is needed to maximize the large- reach of the measurements. The tagged DIS data, on the other hand, are more numerous and provide clean neutron data relatively free of deuteron nuclear corrections, but exist in a nonperturbative regime where HT and other effects are of concern. The deuteron DIS data, conversely, are rich in kinematic breadth, formed from numerous accurate measurements spanning decades in and from multiple laboratories and experiments. These data alone would be sufficient to access the neutron structure and -quark PDF — as can successfully be done to high precision for the quark with proton data — were it not for the theoretical nuclear uncertainty associated with extracting neutron structure from deuterium.
These 3 different datasets can then be simultaneously leveraged in the context of global QCD analysis of PDFs to extract the -quark distribution and, at the same time, constrain the deuteron corrections. In the CJ15 analysis Accardi et al. (2016a), for example, the nuclear corrections in the deuteron are performed using a smearing formalism in the weak binding approximation Kulagin et al. (1994, 1995) that accounts for nuclear Fermi motion and binding through deuteron wave functions calculated in many-body theory, and accounts for bound nucleon deformations of the nucleon PDFs by a Taylor expansion in the nucleon off-shellness, with the expansion coefficient fitted to experimental data. The free and bound nucleon structure functions are also corrected for TMC and HT effects. The interplay of -quark sensitive observables on free protons (such as -boson production in collisions) and of DIS data on deuteron targets allows one to disentangle nuclear dynamics and nucleon PDFs in the latter, and to simultaneously constrain both the PDF and off-shell parameters, especially in the large- region where these are poorly known. Tagged deuteron DIS measurements from BONuS then serve to verify the correctness of the deuteron model and, in the future with more statistics expected from the BONuS12 experiment, can put additional constraints on it.
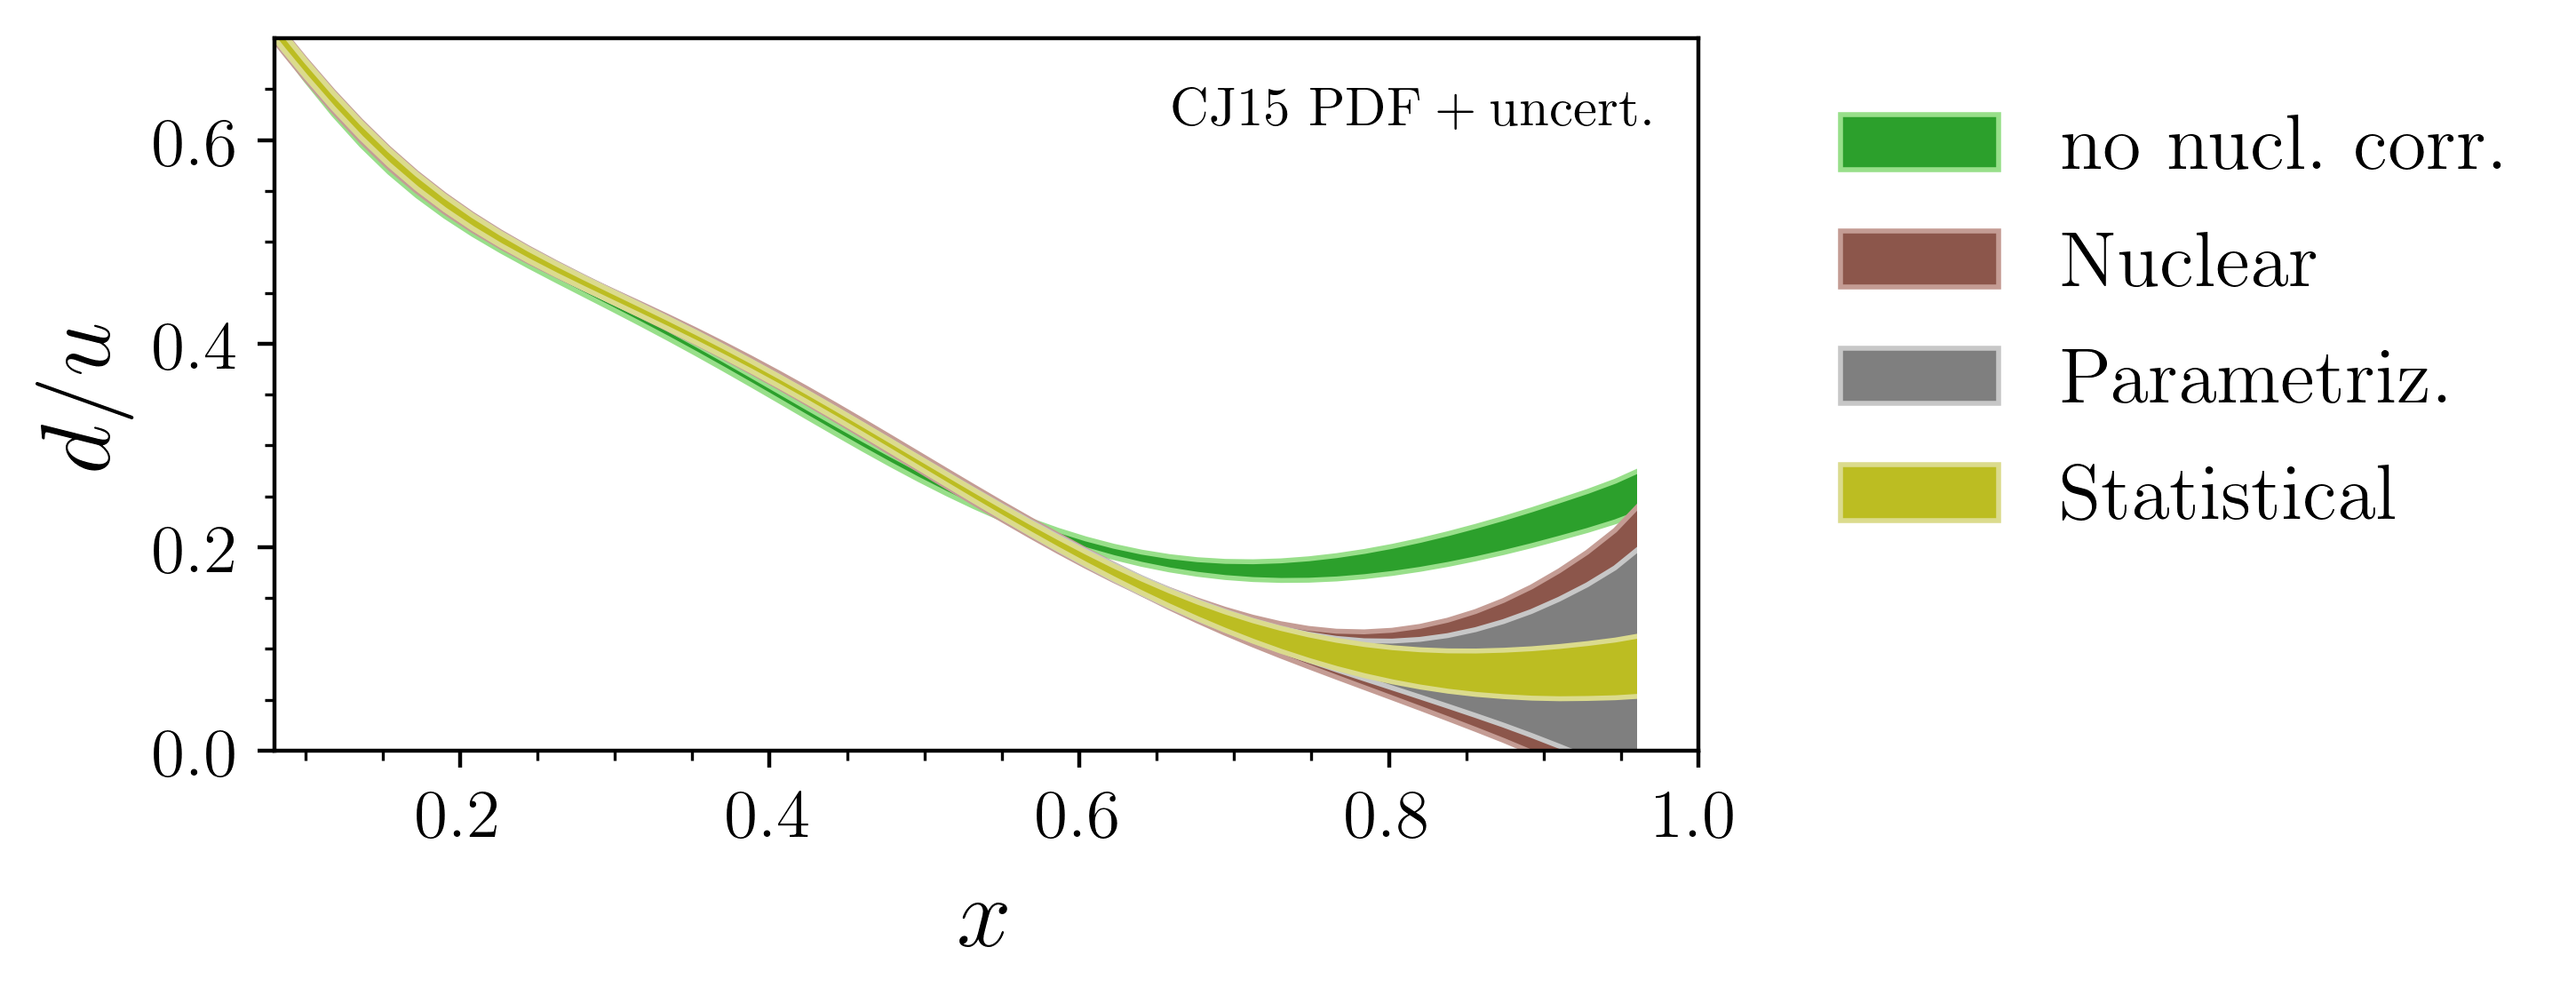
The agreement of data from these three disparate reactions, simultaneously contributing to, and well described within, the fundamental QCD framework of the CJ15 global PDF fit thus provides one not only with an improved knowledge of the -quark PDF, but also with confidence in the ability to access the neutron using the deuteron nuclear corrections deployed in that global analysis. If the nuclear corrections were inadequate beyond expected uncertainties, the three data types would exhibit significant tension within the global fitting framework. The fact that they do not facilitates the neutron dataset provided in this present work, and the global analysis framework enables the necessary evaluation of associated theoretical uncertainties. As an example, the PDF ratio obtained in the CJ15 analysis is displayed in Fig. 1, showing the importance of including nuclear corrections when fitting deuteron target DIS data. The “statistical” PDF uncertainties propagated from the experimental uncertainties are supplemented by an estimate of the theoretical uncertainties due to PDF parametrization choice and the deuteron many-body wave function.
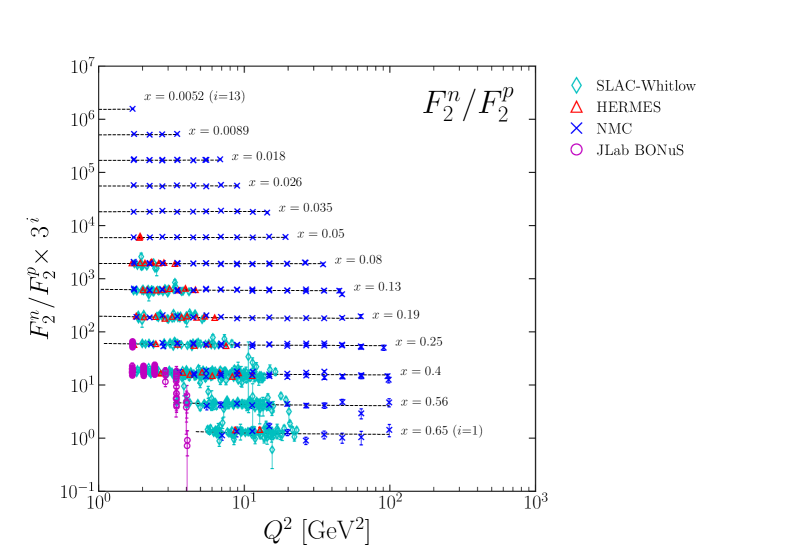
In contrast to the CJ15 analysis, the global fits performed by Alëkhin et al. in 2017 (AKP17) Alekhin et al. (2017a) and revisited in 2021 (AKP21) Alekhin et al. (2022) resulted in marked differences in the fitted off-shell function and the PDF ratio, which is softer than the CJ15 result at and (by construction) tends to 0 as . At the same time, the AKP17/21 neutron structure function, which is indirectly extracted from the measured proton and deuteron data, also differs from the CJ15 result, especially at large where it is actually harder than in the CJ15 case. This can be appreciated from Fig. 2, which compares the calculated ratio to the experimental values obtained by the BONuS Collaboration combining their tagged, quasi-free neutron to deuteron ratio measurements with the world data on proton, , and deuteron, , structure functions. The recent JAM21 global analysis Cocuzza et al. (2021), on the other hand, which considered a dataset similar to those used in the CJ15 and AKP17/21 analyses, along with the 3He/3H cross section ratio from the MARATHON experiment Abrams et al. (2022), finds the , , and ratios that are similar to the present results. The extracted ratios and the isospin-averaged off-shell functions were also consistent with the results of the CJ15 analysis Accardi et al. (2016a), but were less compatible with the AKP off-shell corrections.
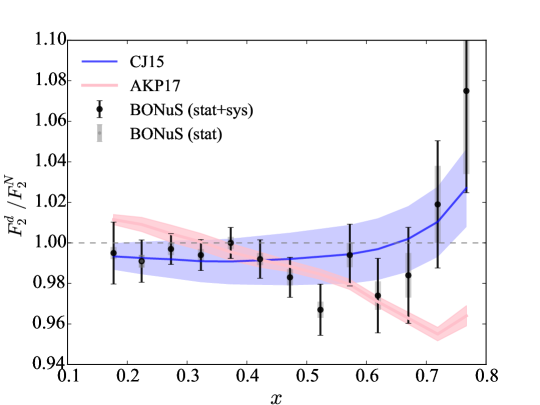
The discrepancy between the deuteron to nucleon ratio calculated in independent global QCD analyses can have multiple sources; among these are the choice of fitted datasets and PDF parametrization, as well as the phenomenological implementation of HT effects, TMCs and nuclear corrections Li et al. (2021); Alekhin et al. (2022, 2023). Tracking down and disentangling from each other their effects is a complex task since they combine nonlinearly. In fact, HT corrections and their interplay with off-shell effects might be of particular relevance to the extraction of the neutron structure function Li et al. (2021). That this may be the case can be appreciated by noticing that the AKP -quark PDF is softer than the CJ15 distribution at large , so that larger HTs are needed to bring the AKP ratio below the CJ15 ratio in Fig. 2.
A comprehensive investigation of the role of various theoretical corrections is outside of the scope of this article, but remains an important objective for future studies. These will be facilitated by the development of new statistical analysis methods, such as the sensitivity method Hobbs et al. (2019), which was utilized in Ref. Accardi et al. (2021a) to distinguish the data-driven features of a global fit from methodological differences in the CJ15 and CT18 PDF global analyses.
III Neutron Structure Function Extraction
The central aim of this paper is to perform a data-driven extraction of a cross-normalized set of neutron structure functions from a set of experiments that measured on both proton and deuteron targets. A secondary aim is to extract neutron to proton ratios from deuteron to proton ratio data, as well as from spectator tagging experiments, such as BONuS, that provide neutron to deuteron ratio measurements.
This program can be accomplished with minimal sensitivity to the theoretical inputs by systematically applying to the data the theoretically calculated correction ratio , as in Eq. (1), across a range of and , effectively converting the measured deuteron structure function (measured alone or as part of a or tagged structure function ratio) into a superposition of free proton and free neutron structure functions. The neutron structure function can then be extracted by suitably subtracting the measured free proton contribution from the observable under consideration. For consistency, the same theoretical calculations utilized for will also be used to cross-normalize data from different experiments and from different targets within one experiment in order to control relative fluctuations in their systematic shifts.
In the present analysis we perform the needed theoretical calculations utilizing the PDFs and deuteron correction model simultaneously fitted in the CJ15 global QCD analysis Accardi et al. (2016a). The choice of CJ15 as a model to calculate the structure functions of free nucleons and to evaluate the nuclear effects in the deuteron affects the neutron data extraction in two places: firstly, the cross-normalization of the experimental proton and deuteron data, and secondly the calculation of the nuclear correction ratio, . As mentioned earlier, a global analysis similar in spirit to CJ15 was performed by AKP in Refs. Alekhin et al. (2017a, 2022), but resulted in marked differences in the PDF ratio and, more importantly for this analysis, in the obtained ratio. These differences would result in a systematic shift of the extracted neutron data if the AKP model were to be adopted instead of the CJ15 model. However, a full evaluation of this systematic effects would require use of the AKP fitting framework, and goes beyond the scope of this paper.
III.1 Proton and deuteron data selection and cross-normalization
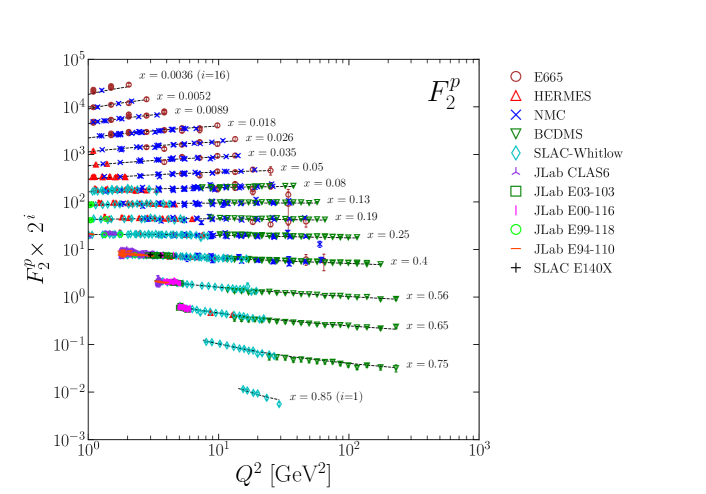
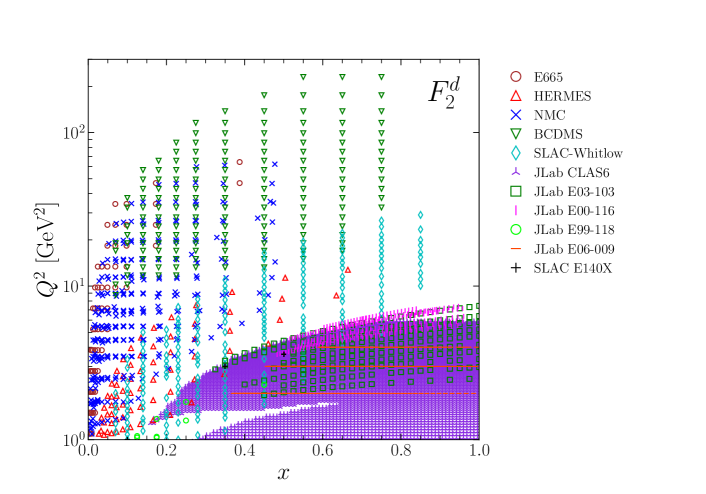
In order to provide a complete neutron dataset over the widest possible kinematic range, we extended the DIS database utilized in the CJ15 global QCD analysis Accardi et al. (2016a) to include all the relevant inclusive measurements from the JLab 6 GeV experimental program. We also revisited correlated errors in the existing CJ15 data collection (such as in the NMC Arneodo et al. (1995) and SLAC Whitlow (1990) datasets), and included data from the SLAC-140x Tao (1994) experiment. This extended and up-to-date DIS database is discussed further in Appendix A.
Our extraction of the neutron structure function (see Sec. III.2 below) requires us to simultaneously manipulate proton and deuteron structure functions measured at the same values of and in order to minimize the size of systematic uncertainties. To this purpose, we select pairs of proton and deuteron data according to the following criteria:
-
1.
proton and deuteron data were measured within the same experiment and at the same beam energy;
-
2.
the corresponding Bjorken- values agree to within an interval ;
-
3.
the values agree to within 1%.
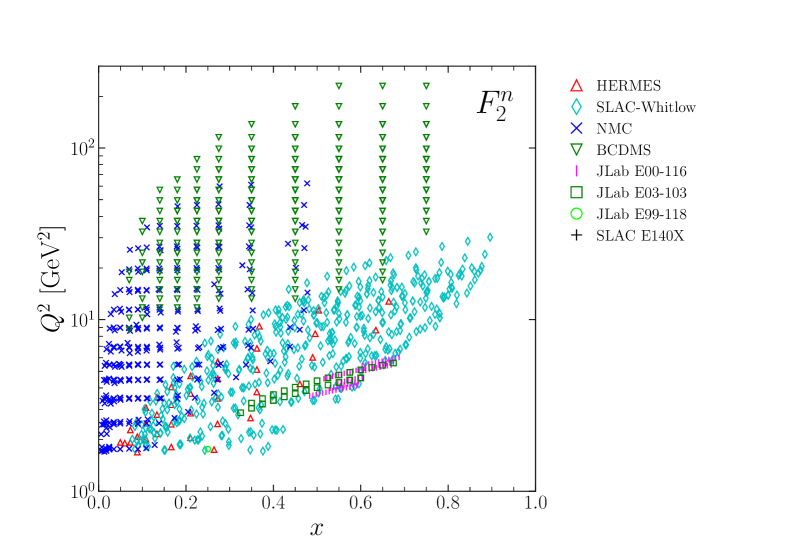
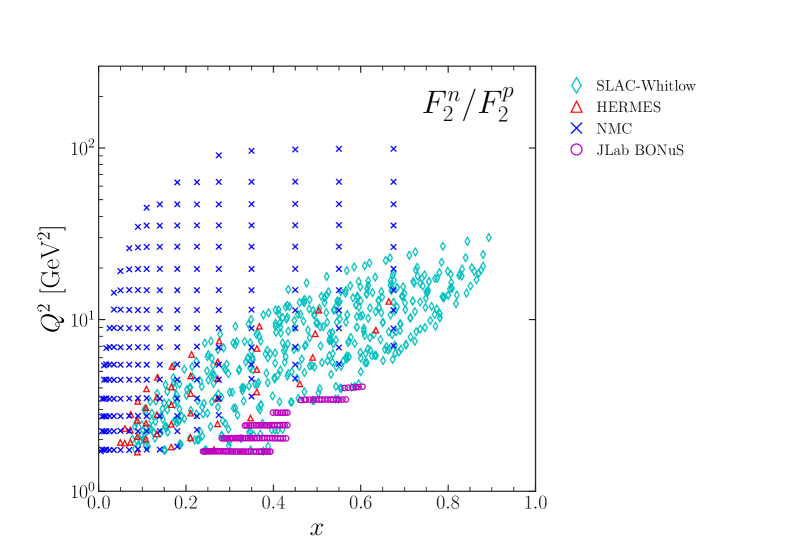
To be consistent with the CJ15 analysis Accardi et al. (2016a), we also require that all selected data satisfy the cut GeV2, which marks the starting scale for QCD evolution of the PDFs, and GeV2 to select DIS events. Note that we increased the cut from 3 GeV2 (used in the CJ15 analysis) to 3.5 GeV2 to better reject the resonance contamination in the large- and low- data. Overall, we obtain 1192 matched proton and deuteron data points covering the range and GeV2, as shown in Fig. 3 and summarized in Table 1. Conversely, no matching of and tagged data is required to extract the neutron-to-proton structure function ratio,
| (2) |
The available ratio data, listed in Table 2, have a smaller multiplicity but also smaller statistical and systematic uncertainties. Their kinematic coverage is illustrated in Fig. 4.
| experiment | (%) | ||
|---|---|---|---|
| *SLAC Whitlow Whitlow (1990) | 478 | 2.1, 1.7 | , |
| SLAC E140x Tao (1994) | 9 | 1.73, 1.73 | , |
| *NMC Arneodo et al. (1997a) | 275 | 2.5, 2.5 | , |
| *BCDMS Benvenuti et al. (1989, 1990) | 254 | 3.0, 3.0 | , |
| *HERMES Airapetian et al. (2011) | 37 | 7.5, 7.5 | , |
| JLab E99-118 V. Tvaskis (2004) | 2 | ||
| JLab E03-103 Seely et al. (2009); Daniel (2007) | 32 | 2.5, 2.5 | , |
| *JLab E00-116 Malace (2006) | 97 | 1.75, 1.75 | , |
| ratio experiment | |||
|---|---|---|---|
| *BONuS Tkachenko et al. (2014) | 115 | 4.5 | |
| *NMC Arneodo et al. (1997b) | 189 | 0.3 | |
| HERMES Airapetian et al. (2011) | 45 | 1.4 | |
| SLAC-Whitlow Whitlow (1990) | 487 | 1.0 |
Each experimental dataset typically provides three groups of uncertainties:
-
1.
A multiplicative overall relative normalization uncertainty . This allows all points in a given dataset to be scaled by a common normalization factor,
(3) where is a normally distributed stochastic variable with zero mean and unit standard deviation.
-
2.
Point-to-point uncorrelated statistical, , and systematic, , uncertainties, for the set’s -th data point . These are summed in quadrature to obtain the total uncorrelated uncertainty, .
-
3.
A number of point-to-point correlated additive systematic uncertainties , with labeling the uncertainty sources, and the number of data points in that dataset. The -th data point can then be shifted by an amount
(4) where are normally distributed stochastic variables with zero mean and unit standard deviation.
The “nuisance parameters” and from each experiment allow data points from proton and deuteron datasets to independently fluctuate within their reported normalization uncertainty, and also, when available, within their correlated uncertainties Kovařík et al. (2020). Note that the NMC experiment also provides information on the cross-correlations between their measurements on proton and on deuteron targets; however, in this analysis we have conservatively treated these two targets as fully uncorrelated, as for all other datasets.
Since we aim at extracting the neutron structure function by subtraction of the proton component from its matched deuteron measurement, it is vital to determine an optimal set of nuisance parameters for all experiments, or in other words to cross-normalize the datasets. In particular, cross-normalization of the proton and deuteron data is needed to avoid large fluctuations in the neutron extraction due to their relative systematic shifts. To accomplish this we choose to fix and of each experiment by comparing the experimental data to a corresponding theoretical value calculated in perturbative QCD at the measured kinematics of each data point. The following function is then minimized with respect to and the parameters of each experiment (exp),
| (5) |
Note that measurements on different targets in a given experiment are here labeled and treated as separate experiments. (Only the NMC reported correlations between different target measurements, but we conservatively consider these as statistically independent.)
The theoretical value for each kinematic point is calculated in perturbative QCD at NLO using the PDFs and the deuteron correction model determined in the CJ15 global analysis. While these are kept fixed, the nuisance parameters and of all experiments are simultaneously fitted. (Note that, in fact, the CJ15 PDFs were fitted to a dataset that also included measurements of jet production and Drell-Yan lepton pair production in hadron-hadron collisions, besides the DIS measurements highlighted in Tables 1 and 2, thus imposing tighter constraints on the nuisance parameters than allowed by DIS data alone.) The obtained normalization parameters are listed in Tables 1 and 2, alongside their fit uncertainty, to be discussed in Sec. III.3. Finally, we define the central value of the cross-normalized data, denoted by the superscript “(0)”, as
| (6) |
where and are the fitted normalization factors and correlated data shifts.
III.2 Neutron and neutron-to-proton ratio extraction
The cross-normalized and data can now be used to extract the neutron structure function, . As noted above, in order to do this we use the deuteron correction factor as in Eq. (1) to remove the nuclear effects from the deuteron data, with the proton and deuteron structure functions computed at NLO in perturbative QCD using the PDFs and nuclear correction model from the CJ15 global QCD analysis Accardi et al. (2016a). The central value of the neutron structure function can then be obtained as
| (7) |
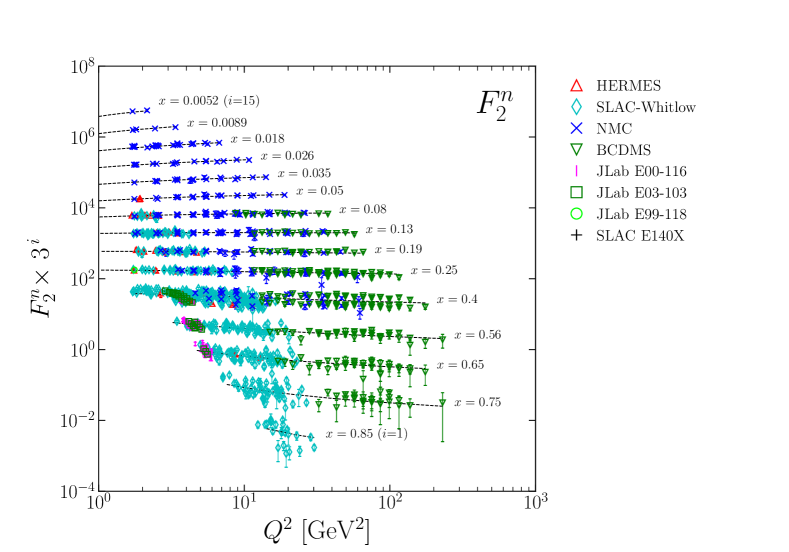
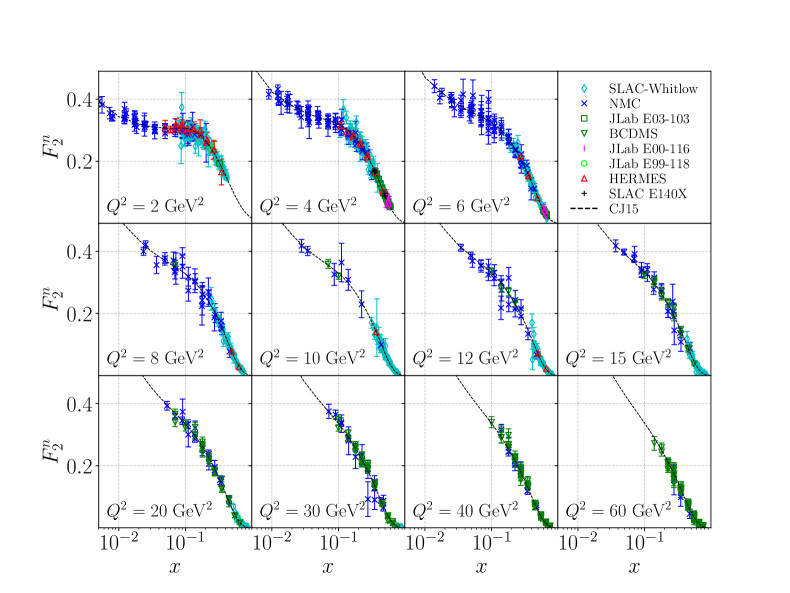
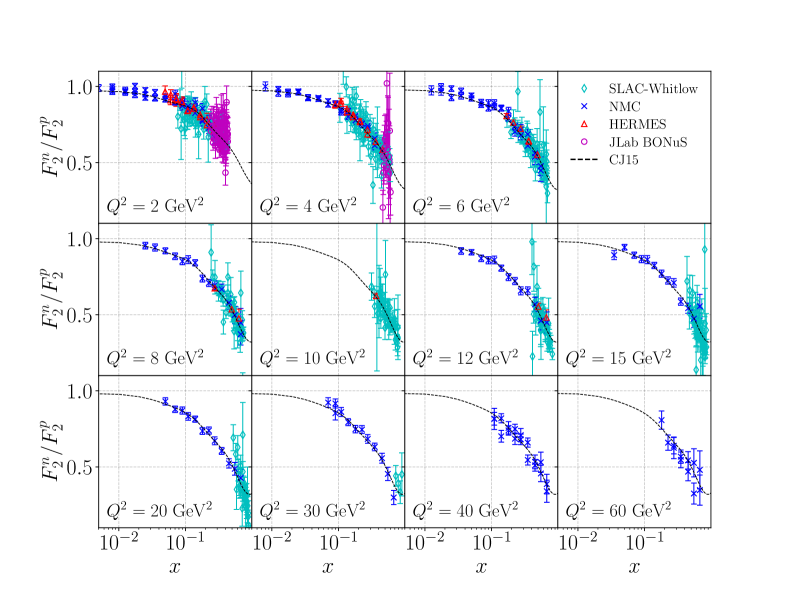
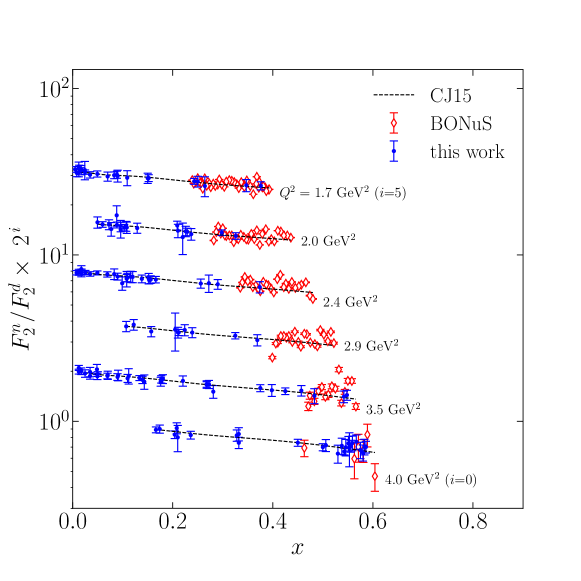
This formula first converts the experimentally measured deuteron data into the sum of free proton and free neutron structure functions, then subtracts from this the experimentally measured proton contribution to obtain the neutron structure function. An alternative approach defining was discarded because it trades a smaller amount of experimental information for a larger amount of theoretical input with its associated uncertainties. Conversely, Eq. (7) minimizes the use of the theoretical model in accordance with our goal of performing a data-oriented neutron extraction. The result is displayed in Fig. 3 as a function of in selected bins, and in Fig. 5 as a function of in selected bins. The uncertainties will be discussed in Sec. III.3 and bin centering will be addressed in Sec. III.4. The and kinematic coverage of the extracted data corresponds to that of the matched and data, as pictured in Fig. 3.
This procedure cannot be directly benchmarked against experimental data for the neutron structure function. However, as a consistency check, we can combine the extracted with the measured deuteron structure function, and compare their ratio to the ratio experimentally measured by the 6 GeV BONuS experiment at JLab via spectator proton tagging Tkachenko et al. (2014). As shown in Fig. 6, the neutron to deuteron ratio extracted as described above agrees with BONuS data, and conversely validates the 6 GeV BONuS analysis.
Analogously to the neutron extraction, the central values of the neutron-to-proton ratio can be obtained from the experimental or ratio data, utilizing the deuteron correction factor from Eq. (1) in analogy with the neutron extraction of Eq. (7),
| (8) |
and
| (9) |
The bin-centered version of the extracted ratio is displayed as a function of in Fig. 4 and as a function of in Fig. 5.
III.3 Uncertainties
The extracted structure function (and the neutron-to-proton ratio) come with uncorrelated experimental uncertainties propagated from the experimental proton and deuteron data (or and ratio data) and with a procedural uncertainty due to data cross-normalization and the treatment of nuclear corrections. More specifically, the procedural uncertainty is due to the determination of the normalization factor , the systematic nuisance parameters , and the use of the deuteron correction factor . These are calculated utilizing the fitted CJ15 PDFs, nuclear corrections, and power corrections, which in turn depend on a number of fitted parameters reflecting the uncertainty of the analyzed experimental data.
The uncertainties in the PDF and other QCD fitting parameters can be propagated into any observable using the Hessian method discussed in Refs. Owens et al. (2013); Pumplin et al. (2002). This involves calculating the quantity of interest utilizing a set of “error PDF sets”, and estimating the uncertainty by comparing the obtained results with the calculation that utilizes the best-fit, or “central”, PDF set. For the purpose of the current analysis, we have used a modified version of the published sets of CJ15 error PDFs that include the higher twist correction parameters needed for structure function calculation in addition to the PDFs and off-shell correction parameters, for a total of 24 fitted parameters Accardi et al. (2016a). Each error set was then scaled along its eigendirection to ensure a more faithful determination of the error band than provided by a straightforward use of the customary Gaussian approximation. This modified PDF set, named CJ15nlo_mod, along with corresponding calculated DIS structure functions are publicly available, see Appendix B.
With the modified PDF set fixed, we have repeated the fit of and and the calculation of with each error PDF set in turn, to obtain a set of 49 () values of , , and , with representing the values obtained with the central CJ15 set and corresponding to the fits obtained with each CJ15 error set. With these, we can evaluate the uncertainties on any quantities of interest. For the nuisance parameters , the symmetric CJ uncertainty is defined as
| (10) |
and nominally produces 90% confidence level uncertainties that corresponds to a “tolerance factor”, see Refs. Accardi et al. (2016a, b) and Appendix B. Other confidence levels can be obtained by scaling the result to the desired value of the tolerance. The resulting uncertainties on the normalization nuisance parameters, listed in Tables 1 and 2, correspond to normalization uncertainties ranging from 0.1% to 0.5%, and are subleading compared to the uncorrelated experimental uncertainties. The uncertainties on the fitted systematic data shifts are similarly subleading.
The discussed sources of procedural uncertainties can be simultaneously accounted for by repeating the data cross-normalization procedure 48 times with each pair of error PDFs, and defining the procedural uncertainty on the cross-normalized data as
| (11) |
This can be (somewhat conservatively) considered to be point-to-point uncorrelated. Finally, the cross-normalized data can be quoted as
| (12) |
with the uncorrelated uncertainty obtained by propagating the experimental value. In the results presented here, these two uncertainties are summed in quadrature.
The evaluation of the procedural uncertainty on follows in a similar manner, with the neutron extraction repeated 48 times in addition to the determination of its central value, discussed in Sec. III.2,
| (13) |
As discussed for the data cross-normalization case, this uncertainty is point-to-point uncorrelated, and quoted in addition to the uncorrelated experimental errors obtained by straightforward propagation of the uncorrelated and uncertainties. We can therefore represent the extracted data points and their uncertainties as
| (14) |
with the results shown in Fig. 3 as a function of in selected bins of . The treatment of the experimental and procedural uncertainties for the neutron-to-proton ratio (see Fig. 4) is analogous to that discussed above for the neutron structure function . This extracted data is publicly available in the database discussed in Appendix A.
III.4 Bin-centered data
Bin-centering of the data in (or ) is not only useful graphically, as in Fig. 5, but also for applications such as the analysis of the Gottfried sum rule or the evaluation of structure function moments, to be discussed in Sec. IV, which are typically performed at fixed values of . We perform bin centering in utilizing the CJ15 structure functions as the underlying model, and defining the bin-centering ratio
| (15) |
where is the nominal center of the bin, for any given structure function or structure function ratio. The bin-centered structure functions can then be calculated by multiplying the values by the bin-centering ratio,
| (16) |
The experimental and procedural uncertainties are propagated from to , for both the proton and neutron structure functions. The bin-centering procedural uncertainty is less than 0.1% and can be safely neglected. Bin centering in can be performed in an analogous way if needed.
IV Applications of neutron data
In this section we discuss several applications of the extracted neutron dataset to the determination of the isovector nucleon structure function, , and its lowest moments, including the Gottfried sum rule.
IV.1 Gottfried sum rule
The Gottfried sum is given by the integral over of the isovector nucleon structure function, , scaled by the factor Gottfried (1967). Since we will be interested also in the shape of the integrand of the Gottfried sum, as well as its saturation as , it is convenient to define the truncated Gottfried integral
| (18) |
so that the Gottfried sum can be expressed as
| (19) |
At leading order (LO) in the strong coupling and leading power in , the structure function can be written in terms of a sum of quark and antiquark PDFs, . In this case the Gottfried sum can be written as
| (20) | |||||
where the integrated antiquark asymmetry is
| (21) |
The constant term in the Gottfried integral (20) arises from the normalization of the valence quark distributions, , equal to 2 or 1 for or quarks in the proton, respectively. If one further assumes that the difference integrates to zero, one arrives at the canonical (“naive”) Gottfried sum rule prediction of Gottfried (1967).
In contrast to many expectations, the value reported by the NMC from an analysis of deep-inelastic muon-hydrogen and muon-deuterium scattering data, Amaudruz et al. (1991); Arneodo et al. (1994b) at GeV2, was significantly lower than the naive flavor symmetric expectation, suggesting a strong violation of the sum rule and the first compelling evidence for . This finding prompted tremendous excitement in the nuclear and particle physics community, and spurred considerable work on both the theoretical Kumano (1998); Geesaman and Reimer (2019) and experimental Baldit et al. (1994); Ackerstaff et al. (1998); Hawker et al. (1998); Towell et al. (2001) fronts to better understand this violation. In particular, since higher order corrections to the Gottfried sum in Eq. (20) from perturbative gluon radiation were found Ross and Sachrajda (1979) to be very small numerically, it suggested that significant nonperturbative effects were likely to be responsible for the asymmetry. Such a nonperturbative effect was in fact predicted Thomas (1983) from chiral symmetry breaking and the associated pion cloud of the nucleon, and has become a standard explanation for the excess of in the proton Salamu et al. (2015); Accardi et al. (2020). A recent analysis also examined the impact of extrapolation methods and higher twist effects on Kotlorz et al. (2021).
The uncertainty on the NMC value for arises from statistical and systematic errors, including from extrapolations of into the unmeasured regions at and . The NMC analysis assumed that effects from nuclear corrections to extracted from inclusive deuterium data were negligible, defining , which assumes that . As discussed in the previous sections, however, nuclear binding and smearing corrections at large Melnitchouk and Thomas (1996); Owens et al. (2013); Alekhin et al. (2017a) and nuclear shadowing at low Badelek and Kwiecinski (1992); Zoller (1992); Melnitchouk and Thomas (1993); Piller et al. (1995) give rise to clear deviations of from unity. In the present analysis, considerable effort has been made to account for the nuclear corrections in the extraction of the neutron , as discussed in Sec. III, and in the following we examine the impact of those corrections on the Gottfried integral.
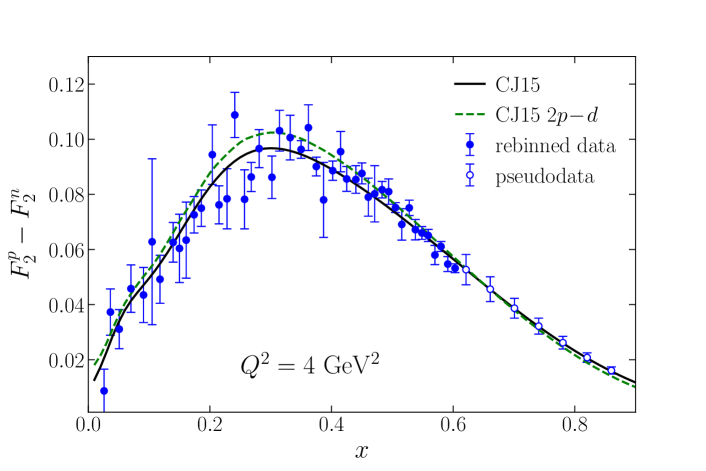
The analysis in Sec. III combined proton and deuteron structure function measurements from SLAC Whitlow (1990); Whitlow et al. (1992), BCDMS Benvenuti et al. (1989, 1990), NMC Arneodo et al. (1995, 1997b, 1997a) and JLab Tkachenko et al. (2014) at a set of fixed values. An illustration of the isovector nucleon structure function data, shifted to a common value of GeV2, is shown in Fig. 7 for the measured range between and . The plot also estimates the effects of neglecting deuteron corrections in the extraction of the neutron structure function by comparing the isovector structure function to the combination of proton and deuteron structure functions. As one can see, deuteron corrections are generally comparable to the experimental uncertainties in the mid- region, and tend to suppress the isovector structure function, or equivalently enhance the neutron structure function.
Computing the integral over all values, as needed for the Gottfried sum [Eq. (19)], requires extrapolating the structure functions beyond the measured region, to and . Although our aim in the combined analysis of the world data is to provide the best possible constraints on the structure functions and their moments, with minimal theoretical bias, such extrapolations will inevitably introduce model dependence into the procedure, especially for the behavior. We will discuss the uncertainties introduced into the extracted functions and moments from both the and extrapolations in the following.
| (GeV2) | |||||||
| 2 | 0.005 | 0.422 | 0.011(6) | 0.175(13) | 0.039(8) | 0.218(16) | 0.228(16) |
| 4 | 0.009 | 0.603 | 0.018(7) | 0.188(19) | 0.011(2) | 0.207(19) | 0.218(20) |
| 6 | 0.014 | 0.690 | 0.025(8) | 0.177(21) | 0.004(0) | 0.195(22) | 0.207(23) |
| 8 | 0.024 | 0.747 | 0.035(7) | 0.199(22) | 0.002(0) | 0.224(22) | 0.236(23) |
| 10 | 0.028 | 0.781 | 0.038(6) | 0.175(31) | 0.001(0) | 0.204(33) | 0.214(31) |
| 12 | 0.035 | 0.819 | 0.045(7) | 0.210(14) | 0.000(0) | 0.245(15) | 0.256(16) |
| 15 | 0.037 | 0.851 | 0.048(7) | 0.189(14) | 0.000(0) | 0.225(14) | 0.237(16) |
| 20 | 0.053 | 0.877 | 0.062(9) | 0.189(10) | 0.000(0) | 0.240(11) | 0.252(13) |
| 30 | 0.072 | 0.896 | 0.077(10) | 0.166(13) | 0.000(0) | 0.232(14) | 0.243(16) |
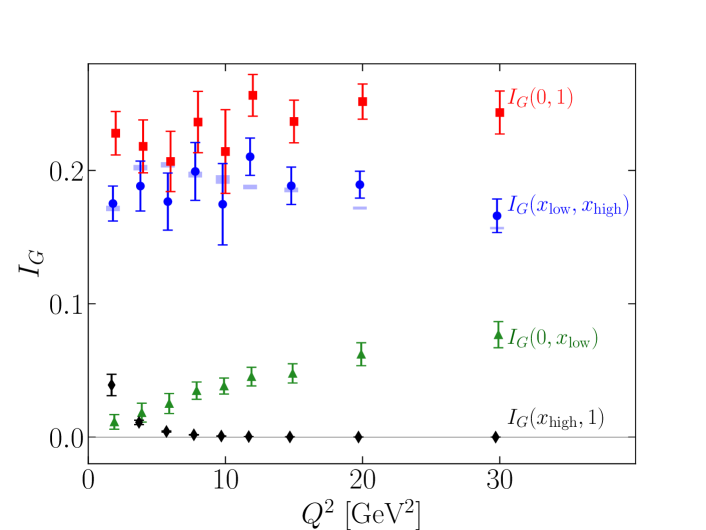
To proceed, we consider the contributions to the total Gottfried integral (19) from individual regions at a fixed value of ,
| (22) |
where and are the lower and upper bounds of the experimental data, both of which vary with (see Table 3). The smallest value of for any of the bins from the NMC data Arneodo et al. (1995, 1997b, 1997a) is . The individual contributions to , along with the total extrapolated moments, are displayed in Fig. 8 for several values between and 30 GeV2. From kinematics one finds that the values of both and increase with increasing . This has the effect of increasing the relative contribution from the extrapolated region at low , and decreasing the relative contribution from the large- extrapolation.
For the measured region , the uncertainties were estimated using Monte Carlo simulations based on the total systematic and statistical errors reported by each experiment, as discussed in Sec. III. At the -th iteration, each data point was shifted by , where is a random number generated by the standard normal distribution, and is the total systematic uncertainty of the -th data point. All points with their statistical uncertainties were then binned in with a bin size . A trapezoid integration method with adaptive step size was used with the rebinned data points to obtain an integral . The mean and standard deviation of were recorded as the central value and total error of , respectively. In practice, the step size was varied between and to check the integral stability, with found to be stable and in good agreement with corresponding analytical results.
For the unmeasured low- region contribution, , we followed previous analyses Arneodo et al. (1995, 1997b, 1997a); Abbate and Forte (2005) by assuming a parametrization for the nonsinglet structure function inspired by Regge theory, with functional form . The parameters and were fitted to data at for each value of . We found good fits to the data with , which also described well the nonsinglet structure function calculated perturbatively with the CJ15 PDFs in the unmeasured region. The corresponding contributions to GSR integrals were then calculated analytically.
At the lowest value, GeV2, the unmeasured region contributes of the total integral. This fraction becomes larger with increasing due to the more restricted range of low- data accessible at the higher values (see Fig. 8), rising up to at GeV2. Since the extrapolated contribution to the Gottfried integral is not negligible, it is important to estimate the systematic uncertainty arising from this component. For this purpose, the value of was varied between 0.5 and 0.7, and the resulting differences in the truncated GSR integral taken as a measure of the systematic uncertainty. A small contribution from the uncertainty in the normalization parameter was also folded into the total error. For all points considered, the magnitude of the uncertainty was found to be of the total integral.
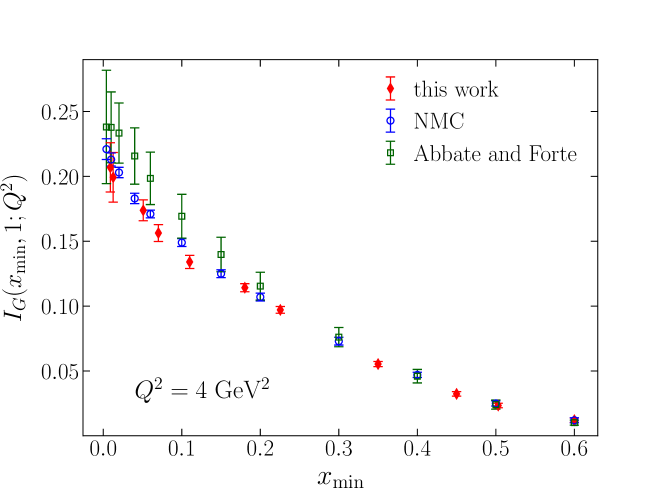
The importance of the low- contribution to the Gottfried integral is also evident in Fig. 9, which shows the dependence of on the lower limit, , of the integration at a fixed value of GeV2. The results are compared with the original extraction from the NMC data analysis Arneodo et al. (1997b, a), as well as from the more recent analysis of Abbate and Forte (AF) Abbate and Forte (2005), and illustrate the saturation of the integral as . While the results from our global reanalysis agree with the previous results at higher values, , at lower our extracted integrals are slightly below both the earlier NMC and AF results. In our analysis we also removed shadowing corrections from the deuterium data, resulting in a 1% – 2% increase of at , and hence a comparable increase in the extracted and a decrease of the isovector and the corresponding integrated value in the same region of .
For the unmeasured large- region, , the inelastic contribution to the integral was evaluated from the CJ15 PDFs Accardi et al. (2016a), as well as an empirical fit that describes structure function data in both the DIS and resonance regions Christy and Bosted (2010); Bosted and Christy (2008). The latter naturally cuts off at values larger than the pion threshold, , where is the minimum mass of the inelastic final state. The former suffers from the “threshold problem” affecting TMC calculations in momentum space Schienbein et al. (2008); Accardi and Qiu (2008); Steffens et al. (2012); Blumlein (2013), and the integrals are limited to . In either case, the elastic contribution to the Gottfried integral was not included. The average of the two calculated values gives the central value of the high- contribution, and their difference provides an estimate of the systematic extrapolation uncertainty.
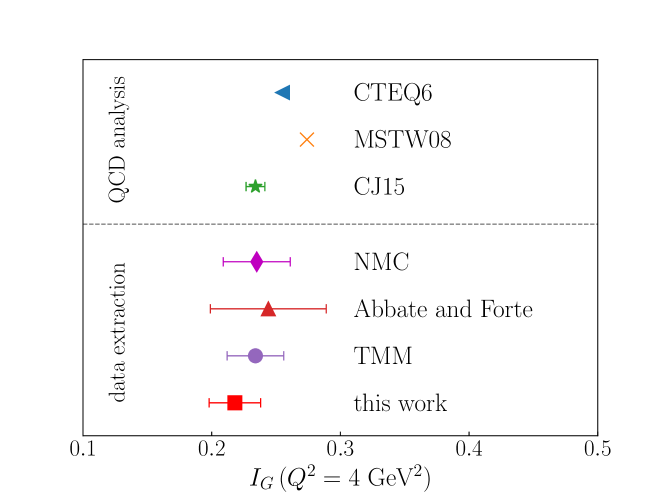
The final results for the contributions to the Gottfried integral from the various regions of are summarized in Table 3. At a reference scale of GeV2, we find the contribution from the region , corresponding to the range given in the NMC analysis Arneodo et al. (1994b), to be , where for notational convenience we suppress the dependence in . This is slightly smaller than the value found in the original NMC data analysis Arneodo et al. (1995), , but is consistent within the uncertainties. It is also compatible with the more recent AF determination Abbate and Forte (2005), , which has a somewhat larger uncertainty. Including the contributions from the extrapolation into the unmeasured regions and , we find the total Gottfried integral at GeV2 to be , which again is slightly smaller than the values extracted from the NMC data alone, Arneodo et al. (1995), or in the AF analysis, Abbate and Forte (2005), or from the recent reanalysis of NMC data with the truncated methods, Kotlorz et al. (2021). A comparison of these data extractions is shown in Fig. 10, along with calculations using global QCD analyses from CJ15, CTEQ6 Pumplin et al. (2002), and MSTW08 Martin et al. (2009). Taken collectively, these latter values appear to slightly overestimate the data extractions.
To estimate the higher twist contributions to the Gottfried integral, we compare the results using the CJ15 calculation including and neglecting the subleading corrections to the structure functions. We find effects for of the order 0.1%, so that to a good approximation we can use Eq. (20) to convert our extracted value to an integrated LO flavor asymmetry in the proton of at GeV2, which is slightly larger than the NMC result Arneodo et al. (1995), but consistent within the quoted uncertainties. It is also somewhat larger than the integrated asymmetry extracted from the E866 Drell-Yan data Towell et al. (2001) (which were used to constrain the ratio) when combined with the parametrization of from the CTEQ5 global QCD analysis Lai et al. (2000), . Our reanalysis of the neutron structure function data therefore suggests a stronger violation of SU(2) flavor asymmetry in the proton sea than reported in the previous studies.
Within the chiral effective field theory framework of Refs. Salamu et al. (2015, 2019), in which the nonperturbative sea in the proton is generated from pseudoscalar pion loops, an integrated asymmetry of would correspond to an average multiplicity in the quantum fluctuation of a proton to a and neutron state of . In comparison, a smaller value of as obtained from the E866 analysis Towell et al. (2001) would correspond to a multiplicity of . The larger deviation from the Gottfried sum rule observed in our analysis implies therefore a larger pion cloud than that suggested by the previous studies.
IV.2 Nonsinglet moments
In recent years developments in lattice QCD have enabled precision calculations of moments of PDFs from first principles Lin et al. (2018); Constantinou et al. (2021). Comparison of the calculated nonsinglet quark distribution moments can be made with moments extracted from experimental data, providing a valuable test of the lattice methodology and various high order corrections, as well as of QCD itself. The nonsinglet moment of the and quark PDFs accessible to lattice QCD is given by
| (23) |
which corresponds to the difference between the momentum carried by and quarks in the proton, computed at some resolution scale usually set by the lattice spacing. For a direct comparison between the calculated PDF moments and those extracted from experiment, we consider the Nachtmann moment of the structure function of the nucleon , which accounts for kinematical target mass effects associated with higher spin operators,
| (24) |
where is the Nachtmann scaling variable Nachtmann (1973); Greenberg and Bhaumik (1971), with . We neglect the small difference between the proton and neutron masses, by setting the nucleon mass to GeV.
Using the same rebinned and datasets used in the GSR analysis and deploying the integration technique described in the previous section to the integral in Eq. (18), we then extract the nonsinglet moments,
| (25) |
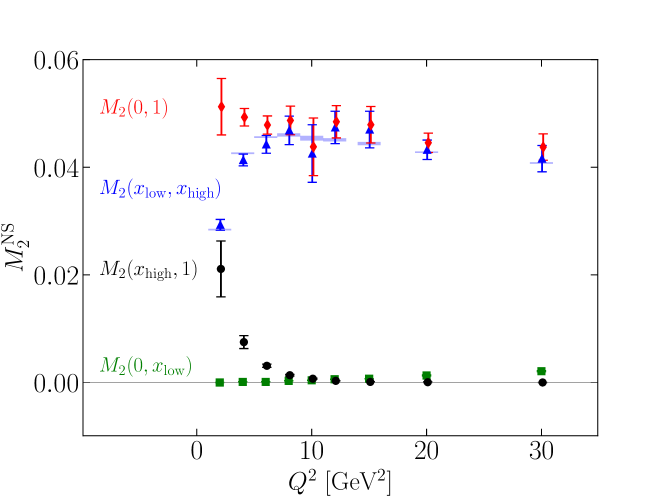
from the world DIS data. To gauge the relative contribution of the measured and extrapolation regions to the full moment, we also compute the truncated moments by restricting the integration in Eq. (24) to the interval. The results, including the contributions from each of the integration regions, are shown in Fig. 11 as a function of and listed in Table 4. The low- extrapolation region gives a negligible contribution to the moments, while the contribution from the large- region increases with decreasing ; indeed, the unmeasured large- interval widens as becomes smaller. As with the GSR, the extracted moments are only weakly dependent on , suggesting a possibly large cancellation between the proton and neutron HT components.
| (GeV2) | HT (%) | ||||||
| 2 | 0.005 | 0.408 | 0.0000(0) | 0.0293(10) | 0.0211(52) | 0.0513(53) | 3.7 |
| 4 | 0.009 | 0.603 | 0.0001(0) | 0.0414(11) | 0.0075(12) | 0.0493(16) | 1.1 |
| 6 | 0.014 | 0.690 | 0.0001(0) | 0.0442(16) | 0.0031(3) | 0.0479(17) | 0.5 |
| 8 | 0.024 | 0.747 | 0.0003(0) | 0.0467(26) | 0.0014(2) | 0.0487(27) | 0.3 |
| 10 | 0.028 | 0.791 | 0.0004(0) | 0.0425(52) | 0.0007(1) | 0.0438(54) | 0.2 |
| 12 | 0.035 | 0.819 | 0.0006(0) | 0.0474(30) | 0.0003(0) | 0.0485(30) | 0.2 |
| 15 | 0.037 | 0.851 | 0.0007(0) | 0.0470(34) | 0.0001(0) | 0.0479(34) | 0.2 |
| 20 | 0.053 | 0.877 | 0.0013(1) | 0.0433(18) | 0.0001(1) | 0.0446(18) | 0.1 |
| 30 | 0.072 | 0.896 | 0.0021(1) | 0.0416(25) | 0.0000(0) | 0.0438(25) | 0.1 |
Within the QCD factorization approach, the nonsinglet Nachtmann moment can be related to the nonsinglet moment of the quark PDFs by dividing out the perturbative Wilson coefficient, and subtracting possible HT contributions,
| (26) |
where to the Wilson coefficient Weigl and Melnitchouk (1996). We can estimate the size of HT contribution by calculating the CJ15-calculated with and without HT corrections, reporting the relative effect in Table 4. We find that the HT contribution is typically smaller than the extracted data uncertainty, and becomes comparable to this only at the lowest value.
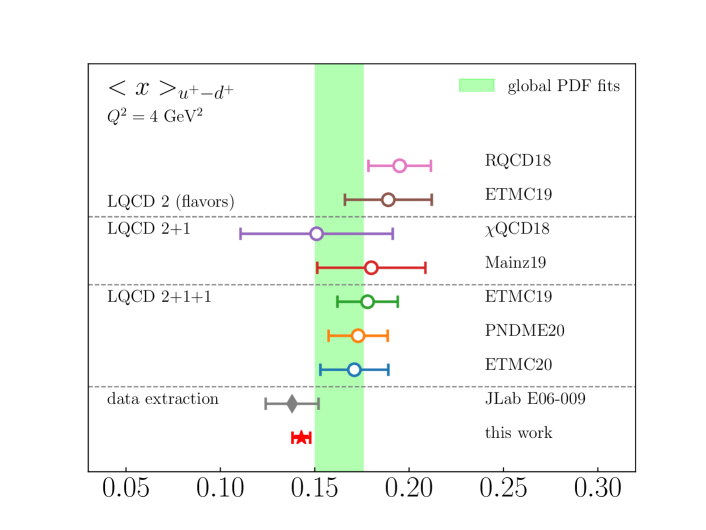
In particular, at GeV2 the HT contribution is negligible compared to the extraction uncertainties, and inverting Eq. (26) we find at this scale. This result is shown in Fig. 12 compared with a recent experimental extraction from precision proton and deuteron structure function data from the E06-009 experiment at JLab Albayrak et al. (2019), and with various lattice QCD calculations as reviewed in Refs. Lin et al. (2018); Constantinou et al. (2021). In addition, our extracted moment is also compared with an average of PDF nonsinglet moments using PDFs parametrizations from recent global QCD analyses, using Eq. (23) directly. The corresponding numerical values of all the moments are given in Table 5.
| data extractions | lattice QCD envelope | ||||
| this work | E06-009 | =2 | =2+1 | =2+1+1 | |
| 0.143(5) | 0.138(14) | 0.189(23) | 0.160(49) | 0.173(21) | |
| global PDF analyses | |||||||
| MMHT2014 | CJ15 | NNPDF3.1 | CT18 | JAM21 | ABMP2016 | HERAPDF2.0 | Combined |
| 0.151(4) | 0.152(2) | 0.152(3) | 0.156(7) | 0.157(2) | 0.167(4) | 0.188(3) | 0.156 |
In the analysis of the E06-009 data Albayrak et al. (2019), nuclear corrections were removed from the deuteron data by adopting the same nuclear convolution model as that utilized here, but using as input the phenomenological structure functions that were fitted directly to inclusive DIS data Christy and Bosted (2010). The E06-009 analysis also considered the elastic contribution to the nonsinglet moment and resulted in a value of . With the elastic contribution removed, this would be reduced by 3% to , which is well within the quoted uncertainties. As can be appreciated from Fig. 12, the E06-009 moment is consistent with that found in our analysis, albeit with a larger uncertainty.
The nonsinglet PDF moments extracted from experimental data appear systematically below those from lattice QCD calculations. This is clear from the comparisons in Fig. 12, where recent lattice QCD moments Bali et al. (2019); Yang et al. (2018); Harris et al. (2019); Alexandrou et al. (2020a, b); Mondal et al. (2020) have been extrapolated to the physical pion mass, as reviewed in Ref. Constantinou et al. (2021). The small tension with the data extraction may be indicative of residual unaccounted for systematic effects in the lattice extraction of the PDF moments.
The nonsinglet moments obtained from an average of recent global QCD analyses, namely, the ABMP16 Alekhin et al. (2017b), CJ15 Accardi et al. (2016a), CT18 Hou et al. (2021), HERAPDF2.0 Abramowicz et al. (2015), JAM19 Sato et al. (2020), MMHT2014 Harland-Lang et al. (2015), and NNPDF3.1 Ball et al. (2017) PDF parametrizations, are compared in Fig. 12 with some recent lattice QCD simulations Lin et al. (2018); Constantinou et al. (2021), and extractions from data. How to average observables calculated from different global PDF fits is an open question Butterworth et al. (2016); Accardi et al. (2016b), and in this analysis we quote the median of the individual central values as the central value of the combined moment, and asymmetric standard deviations from the median as systematic errors. The statistical uncertainties on the individual calculations do not vary substantially, and a simple average represents these well. The averaged result is found to be , with the error band in Fig. 12 representing the sum in quadrature of the statistical and systematic uncertainties.
The phenomenological results thus obtained from the global QCD analyses lie between the DIS data extraction and the lattice QCD calculations. This may suggest that DIS data are in mild tension with the DY and jet data from proton-proton collisions that have been included in the global analyses to complement the DIS data. On the other hand, the tension between lattice simulations and phenomenological results may be milder than that indicated by comparison with the data extractions alone.
V Conclusions
We have performed a detailed reanalysis of the world’s inclusive DIS data, simultaneously obtained on protons and deuterons, to extract the structure function of the free neutron. To account for the nuclear effects in the deuteron, we have consistently applied the nuclear correction calculation from the CJ15 global QCD analysis Accardi et al. (2016a), which includes calculated nuclear smearing and, in order to minimize the theoretical uncertainties, fitted nucleon off-shell corrections. Special attention has been devoted to the normalization of the proton and deuteron experimental datasets and to the treatment of correlated systematic errors, as well as the quantification of procedural and theoretical uncertainties. The data themselves have been carefully cross-normalized and shifted point-by-point, as allowed by the correlated systematic uncertainties, which turns out to be essential for minimizing the uncertainties in the extracted .
As applications of the extracted neutron structure function dataset, we considered a re-evaluation of the Gottfried sum rule, including for the first time its dependence, and extracted the nonsinglet moment which provides an experimental benchmark for precision lattice QCD simulations. In both cases, we have carefully evaluated the statistical and systematic uncertainties. The dependence was found to be rather flat, within the uncertainties, indicating strong cancellations of higher-twist power corrections for the proton and neutron.
A comprehensive database including the world data on DIS on proton and deuteron targets, as well as the extracted neutron structure function and neutron-to-proton ratio, is publicly available (see Appendix A). To facilitate replication of our study and a comparison with other nuclear correction models, as well as for general applications, we also provide precomputed grids in LHAPDF format for calculating the modified CJ15 PDFs used in our study, named CJ15nlo_mod, and the corresponding DIS structure functions (see Appendix B). As a demonstration of the use of the DIS structure function grids, we illustrate neutron excess correction ratios for neutral and charged current DIS on nuclear targets (see Appendix C). We expect these resources will be useful in future phenomenological applications requiring data on the neutron structure function.
Acknowledgements.
We thank J. Arrington, R. Bhalerao, M. E. Christy, M. Constantinou, H.-W. Lin, J. Morfin, E. Segarra, and A. Schmidt for useful discussions and communications. This work was supported by U.S. Department of Energy contract DE-AC05-06OR23177, under which Jefferson Science Associates LLC manages and operates Jefferson Lab, DOE contracts DE-SC0008791, DE-AC02-05CH11231, and DE-FG02-88ER40410, and NSF grants number 1913257 and 2209995. The work of WM was partially supported by the University of Adelaide and the Australian Research Council through the Centre of Excellence for Dark Matter Particle Physics (CE200100008).Appendix A The CTEQ-JLab DIS database
Starting from the existing experimental datasets used in the CJ15 global QCD analysis, we constructed a comprehensive database of unpolarized DIS measurements with proton and deuteron targets, along with the neutron target structure functions extracted in this paper.
The experimental observables included in the database are:
-
•
the structure functions, and their and ratios,
-
•
the longitudinal to transverse cross section ratio ,
-
•
the reduced cross section ,
where is the lepton inelasticity, and , with the incident lepton energy and the energy transfer in the target rest frame. The reduced cross section datasets were extracted from experimental cross sections according to
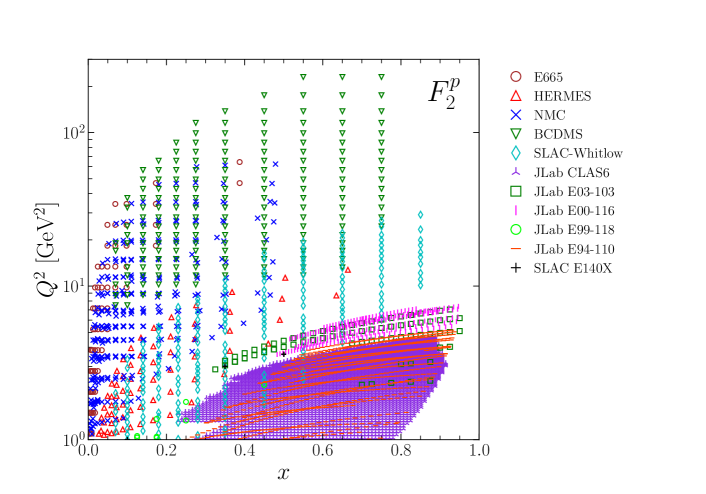
For the first time we have also included the full DIS datasets from the JLab 6 GeV program, which expanded the kinematic coverage in the high- region (see Figs. 13 and 14 below). A list of included experiments and observables is shown in Table 6. The and data points were extracted, respectively, from the matched proton and deuteron data and from the measured and ratios (see Sec. III.1). Extensive efforts were made to collect details of normalization, and correlated and uncorrelated systematic uncertainties on all the datasets.

All datasets are maintained in a public GitHub repository CJ- (2023b) in both Excel and plain text formats (the latter compatible with the CJ15 fitting package). A 5-digit identifier is assigned to each dataset, and the content, references, source of uncertainties, and related calculations are documented in each README file.
| Experiment | extracted | extracted | |||
| SLAC-Whitlow Whitlow (1990) | |||||
| SLAC-E140 Dasu et al. (1994) | |||||
| SLAC-E140x Tao (1994) | |||||
| NMC Arneodo et al. (1997a, b) | |||||
| BCDMS Benvenuti et al. (1989, 1990) | |||||
| JLab E06-009 Albayrak (2011) | |||||
| JLab E94-110 Liang et al. (2022); Christy et al. (2004) | |||||
| JLab E03-103 Seely et al. (2009); Daniel (2007) | |||||
| JLab E99-118 V. Tvaskis (2004); Tvaskis et al. (2010, 2007) | |||||
| JLab JLCEE96 Niculescu (1999) | |||||
| JLab E00-116 Malace (2006); Malace et al. (2009) | |||||
| JLab CLAS6 Osipenko et al. (2003a, 2006, b, 2005) | |||||
| JLab BONuS Tkachenko et al. (2014); Griffioen et al. (2015) | |||||
| HERA I+II Abramowicz et al. (2015) | |||||
| HERMES Airapetian et al. (2011) | |||||
| E665 Kotwal (1995) |
Appendix B The CJ15nlo_mod PDF and structure function grids
The careful evaluation of theoretical uncertainties in the extraction of the neutron structure functions in the main text necessitated the repeated evaluation of NLO structure functions using a modified version of the 49 member strong CJ15nlo PDF set, which represents uncertainties stemming from variations of 19 PDF parameters, 2 off-shell parameters, and 3 HT parameters Accardi et al. (2016a) with a nominal 90% confidence level Accardi et al. (2016a). As a result of this effort we present here the CJ15nlo_mod set of PDFs, as well as a corresponding set of calculated DIS structure functions.
The modification of the published CJ15 PDF error set was needed to take care of deviations from the assumed Gaussian behavior of PDFs and observables around the fitted parameter values in the least constrained regions of parameter space, such as for observables sensitive to the quark at large values. We have for example observed non-negligible deviations from the assumed quadratic behavior of the function in the parameter subspace spanned by the power correction parameters, that in turn is correlated with the quark parameters governing its large momentum behavior. As a result, the curvature of the function in the vicinity of the minimum is typically underestimated by the eigenvalues of the numerically evaluated Hessian matrix, which then does not faithfully capture the global fit uncertainties. One consequence of relevance for the present paper, is that the uncertainties of the ratio calculated with the master formula (10) and the published error PDF set, are typically smaller than those displayed in the figures of Ref. Accardi et al. (2016a) that, for simplicity, used the Hessian approximation for the structure function ratios.
In order to compensate for the observed deviations from the expected Gaussian behavior, we have then followed the procedure discussed in Refs. Accardi et al. (2021a); Hunt-Smith et al. (2022). Namely, we have rescaled the CJ15nlo PDF error sets along each eigendirection to ensure that they produce a in the fitted datasets compared to the best fit CJ15nlo PDF set. The rescaling factors are close to 1 in the majority of the cases, except indeed for the least constrained eigendirections, but produce non-negligible effects, for example, for the evaluation of the uncertainties of the ratio. Further discussion of Gaussian deviations and possible remedies can be found in the aforementioned references.
Finally, to facilitate the reproduction of our results, as well as for general use, we have made publicly available on the CJ website CJ- (2023a) the modified 49-member CJ15nlo_mod PDF set, as well as the corresponding proton, neutron and deuteron CJ15nlo_mod_SF structure functions, as precomputed grids on the CJ collaboration’s web page. All grids are provided in LHAPDF format Buckley et al. (2015) for easy Python and C access, and will soon be submitted for inclusion in the official LHAPDF website LHA (2023). The neutral current structure functions are presented both with and without TMC and HT corrections. The neutral current structure function and the charged current structure functions are only available at leading twist, since the CJ15 fit lacked the data to constrain their power corrections. The indexing of structure functions within each LHAPDF grid follows the conventions laid out for the inclusive DIS studies presented in Ref. Abdul Khalek et al. (2022) and is explicitly discussed in Ref. txg (2023).
Appendix C Isoscalar corrections with CJ15_mod structure functions
When comparing the experimentally measured lepton-nucleus cross sections for different nuclear targets, a correction to account for the proton and neutron number imbalance (or target non-isoscalarity) is often necessary to isolate dynamical nuclear effects that go beyond the trivial difference between the proton and neutron scattering cross section contributions. This process has been widely discussed in the literature, and we briefly rederive it here before discussing the use of the CJ15nlo_mod proton and neutron structure functions, described in Appendix B, for calculating the needed correction factor.
For a nucleus with protons and neutrons, the nuclear effects in the lepton-nucleus cross section can be quantified by considering the ratio
| (27) |
of the nuclear cross section to the sum of free proton and free neutron cross sections, denoted by and , respectively. (The subscript label the nucleus under consideration, rather than the specific atomic number.) It is then straightforward to obtain
| (28) |
where the so-called “isospin correction factor,”
| (29) |
only depends on the ratio of free neutron to free proton cross sections. Note that the denominator of the right hand side of Eq. (28) is just a scaled, isospin-symmetric free nucleon target cross section. By analogy, one can then interpret
| (30) |
as an isospin-symmetrized nuclear cross section, with providing the conversion from the measured to the isoscalar cross section, . Having thus removed the trivial nuclear effects due to the number imbalance of protons and neutrons in a given nucleus, one can compare and contrast nuclear effects in different nuclei on the same footing, such as in the double ratios of the symmetrized cross sections for nuclei and .
In practice, the cross section ratio data are often converted to structure function ratios, , before applying the isoscalarity corrections, under the assumption that the longitudinal to transverse cross section ratio is independent of the nuclear target. Repeating the derivation above, one can see that the isoscalar correction factor would analogously apply to the nuclear structure function. However, one should keep in mind that, while a relatively small effect, the independence assumption for the longitudinal to transverse ratio may not be accurate at large and low values Guzey et al. (2012b); Tvaskis et al. (2010); Niculescu (1999).
Experimentally, in the absence of free neutron targets, the nuclear modification ratio (27) is often approximated by the “nuclear EMC ratio,”
| (31) |
of the per-nucleon nuclear and deuteron cross sections, with the isoscalar correction applied to the numerator (although sometimes this correction is not applied). A nonzero nuclear modification in the deuteron, , was recently observed by the BONuS Collaboration Griffioen et al. (2015), with further precision measurements planned BONuS12 Collaboration (2006), and shown to be non-negligible especially at large values of (see also Fig. 2). The neutron data extracted in Ref. Griffioen et al. (2015) obviate the need for using deuteron targets as proxies for the combination of free proton and neutron targets, enabling one to directly measure and fully expose the nuclear effects in the nuclear target.
The CJ15nlo_mod proton and neutron structure functions obtained in this work (see Appendix B) can be directly used to calculate the isoscalar correction factor at any and . Indeed, for events with not too large lepton energy loss, one can approximate
| (32) |
and obtain
| (33) |
which depends only on the ratio. (Note that the CJ15 PDF fit from which the CJ15nlo_mod is derived assumes isoscalar, multiplicative higher twist corrections. For determination of one can therefore use the leading-twist structure functions that were perturbatively calculated at NLO using the CJ15nlo_mod PDF sets. This is important when dealing with charged current DIS data, which were not included in the CJ15 analysis.)
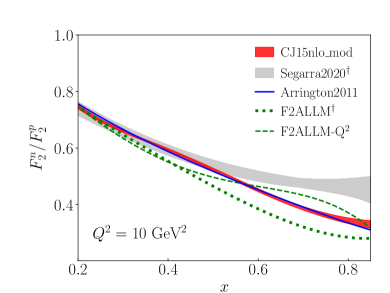
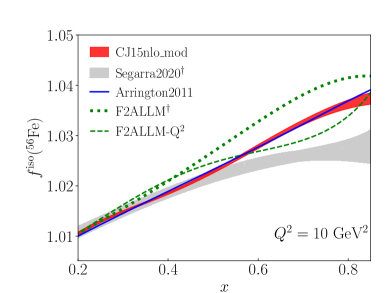
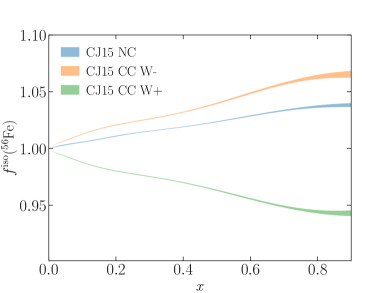
In Fig. 15, the CJ15_mod ratio is compared to several widely used empirical fits. F2ALLM Abramowicz and Levy fitted data prior to 1997 above the resonance region, and is provided with and without dependence. Arrington2011 Arrington et al. (2012) used a similar deuteron smearing and off-shell corrections as CJ15 and results in a similar ratio. Segarra2020 Segarra et al. (2020) assumed a universal modification of nucleons in short-range correlated (mostly neutron-proton) pairs, and included recent light nuclear target data, as well as data from heavy nuclei, in their fits. In general, the ratio from all these models are in good agreement at small , but show large systematic deviations at large stemming from the adopted neutron extraction procedure. Among the considered fits and parametrizations, CJ15nlo_mod is the only -dependent model that also provides a rigorous uncertainty estimation. The isoscalar correction factor for 56Fe in Fig. 15 is calculated using Eq. (33) with different ratio models, and reveals a model dependence of the order of 10% at large values of .
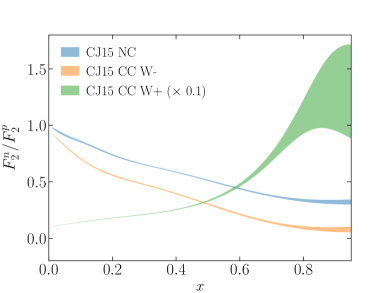
The neutron to proton ratio may also be utilized in accounting for neutron excess effects in neutrino-nucleus scattering. In contrast to electron scattering, here the neutrino-neutron cross section is actually larger than the neutrino-proton cross section. The charged current (CC) neutron to proton ratio , calculated using CJ15 PDFs, is shown in Fig. 16 for exchange ( and ) and exchange ( and ). At leading order, those two ratios are related using isospin symmetry by
| (34) |
In the limit, one finds
| (35) |
which can be compared with the corresponding neutral current ratio, . The isoscalar corrections calculated with are of the same order as those from the NC case, as shown on the right panel of Fig. 16.
At large the ratio is essentially a shifted down version of the NC ratio, and decreases towards zero following the behavior of the fitted ratio. Conversely, the ratio for exchange grows rapidly as ; this growth is tamed if the ratio tends to a finite limit, as in the CJ15 fit. The structure function ratio therefore seems to be a particularly sensitive probe of the large- behavior of the and quark PDFs and of the nucleon’s nonperturbative structure. It could be measured in reactions with a positron beam at JLab12 Accardi et al. (2021b) and at the Electron-Ion Collider Abdul Khalek et al. (2022), or in processes at high-energy neutrino facilities Petti (2022).
References
- Bodek and Ritchie (1981) A. Bodek and J. L. Ritchie, Phys. Rev. D 23, 1070 (1981).
- Arrington et al. (2009) J. Arrington, F. Coester, R. J. Holt, and T.-S. H. Lee, J. Phys. G: Nucl. Part. Phys. 36, 025005 (2009).
- Arrington et al. (2012) J. Arrington, J. G. Rubin, and W. Melnitchouk, Phys. Rev. Lett. 108, 252001 (2012).
- Accardi et al. (2010) A. Accardi, M. E. Christy, C. E. Keppel, W. Melnitchouk, P. Monaghan, J. G. Morfín, and J. F. Owens, Phys. Rev. D 81, 034016 (2010).
- Accardi et al. (2011) A. Accardi, W. Melnitchouk, J. F. Owens, M. E. Christy, C. E. Keppel, L. Zhu, and J. G. Morfin, Phys. Rev. D 84, 014008 (2011).
- Owens et al. (2013) J. F. Owens, A. Accardi, and W. Melnitchouk, Phys. Rev. D 87, 094012 (2013).
- Accardi et al. (2016a) A. Accardi, L. T. Brady, W. Melnitchouk, J. F. Owens, and N. Sato, Phys. Rev. D 93, 114017 (2016a).
- Aaltonen et al. (2009) T. Aaltonen et al., Phys. Rev. Lett. 102, 181801 (2009).
- Abazov et al. (2014) V. M. Abazov et al., Phys. Rev. Lett. 112, 151803 (2014), [Erratum: Phys. Rev. Lett. 114, 049901 (2015)].
- Tkachenko et al. (2014) S. Tkachenko et al., Phys. Rev. C 89, 045206 (2014), [Addendum: Phys. Rev. C 90, 059901 (2014)].
- Accardi (2015) A. Accardi, PoS DIS2015, 001 (2015), arXiv:1602.02035 [hep-ph] .
- Alekhin et al. (2017a) S. I. Alekhin, S. A. Kulagin, and R. Petti, Phys. Rev. D 96, 054005 (2017a).
- Alekhin et al. (2022) S. I. Alekhin, S. A. Kulagin, and R. Petti, Phys. Rev. D 105, 114037 (2022).
- Cocuzza et al. (2021) C. Cocuzza, C. E. Keppel, H. Liu, W. Melnitchouk, A. Metz, N. Sato, and A. W. Thomas, Phys. Rev. Lett. 127, 242001 (2021).
- Melnitchouk and Thomas (1996) W. Melnitchouk and A. W. Thomas, Phys. Lett. B 377, 11 (1996).
- Isgur (1999) N. Isgur, Phys. Rev. D 59, 034013 (1999).
- Brodsky et al. (1995) S. J. Brodsky, M. Burkardt, and I. Schmidt, Nucl. Phys. B441, 197 (1995).
- Holt and Roberts (2010) R. J. Holt and C. D. Roberts, Rev. Mod. Phys. 82, 2991 (2010).
- Roberts et al. (2013) C. D. Roberts, R. J. Holt, and S. M. Schmidt, Phys. Lett. B 727, 249 (2013).
- Brady et al. (2012) L. T. Brady, A. Accardi, W. Melnitchouk, and J. F. Owens, J. High Energy Phys. 2012, 19 (2012).
- Accardi et al. (2016b) A. Accardi et al., Eur. Phys. J. C 76, 471 (2016b).
- Accardi et al. (2021a) A. Accardi, T. J. Hobbs, X. Jing, and P. M. Nadolsky, Eur. Phys. J. C 81, 603 (2021a).
- Sajjad Athar and Morfín (2021) M. Sajjad Athar and J. G. Morfín, J. Phys. G 48, 034001 (2021).
- (24) E. Catano-Mur, arXiv:2206.03542 [hep-ex] .
- Abed Abud et al. (2022) A. Abed Abud et al., (2022), arXiv:2203.06100 [hep-ex] .
- Ruterbories et al. (2022) D. Ruterbories et al., Phys. Rev. Lett. 129, 021803 (2022).
- Lin et al. (2018) H.-W. Lin et al., Prog. Part. Nucl. Phys. 100, 107 (2018).
- Constantinou et al. (2021) M. Constantinou et al., Prog. Part. Nucl. Phys. 121, 103908 (2021).
- Can et al. (2020) K. U. Can et al., Phys. Rev. D 102, 114505 (2020).
- Guzey et al. (2012a) V. Guzey et al., Phys. Rev. C 86, 045201 (2012a).
- Albayrak et al. (2019) I. Albayrak et al., Phys. Rev. Lett. 123, 022501 (2019).
- Kotlorz et al. (2021) A. Kotlorz, D. Kotlorz, and O. V. Teryaev, Int. J. Mod. Phys. A 36, 1 (2021).
- Gottfried (1967) K. Gottfried, Phys. Rev. Lett. 18, 1174 (1967).
- (34) A. L. Kataev, arXiv:hep-ph/0311091 .
- Dove et al. (2021) J. Dove et al., Nature 590, 561 (2021), [Erratum: Nature 604, E26 (2022)].
- Arneodo et al. (1994a) M. Arneodo et al., Phys. Rev. D 50, R1 (1994a).
- Abbate and Forte (2005) R. Abbate and S. Forte, Phys. Rev. D 72, 117503 (2005).
- BONuS12 Collaboration (2006) BONuS12 Collaboration, Proposal for Jefferson Lab Hall B Experiment E12-06-113 (2006).
- Baillie et al. (2012) N. Baillie et al., Phys. Rev. Lett. 108, 142001 (2012), [Erratum: Phys. Rev. Lett. 108, 199902 (2012)].
- Abrams et al. (2022) D. Abrams et al., Phys. Rev. Lett. 128, 132003 (2022).
- Alekhin et al. (2023) S. I. Alekhin, S. A. Kulagin, and R. Petti, Phys. Rev. D 107, L051506 (2023).
- Malace et al. (2010) S. Malace et al., Proposal for Jefferson Lab Hall C Experiment E12-10-002 (2010).
- sol (2019) SoLID: Updated Preliminary Conceptual Design Report (2019).
- Abdul Khalek et al. (2022) R. Abdul Khalek et al., Nuclear Physics A 1026, 122447 (2022).
- Adam et al. (2021) J. Adam et al., Phys. Rev. D 103, 012001 (2021).
- Chatrchyan et al. (2014) S. Chatrchyan et al., Phys. Rev. D 90, 032004 (2014).
- Chatrchyan et al. (2012) S. Chatrchyan et al., Phys. Rev. Lett. 109, 111806 (2012).
- Aad et al. (2012) G. Aad et al., Phys. Rev. D 85, 072004 (2012).
- Aaij et al. (2015) R. Aaij et al., J. High Energy Phys. 08, 039 (2015).
- Khachatryan et al. (2016) V. Khachatryan et al., Eur. Phys. J. C 76, 469 (2016).
- Jimenez-Delgado et al. (2013) P. Jimenez-Delgado, W. Melnitchouk, and J. F. Owens, J. Phys. G 40, 093102 (2013).
- Gao et al. (2018) J. Gao, L. Harland-Lang, and J. Rojo, Phys. Rep. 742, 1 (2018).
- Kovařík et al. (2020) K. Kovařík, P. M. Nadolsky, and D. E. Soper, Rev. Mod. Phys. 92, 045003 (2020).
- Ethier and Nocera (2020) J. J. Ethier and E. R. Nocera, Ann. Rev. Nucl. Part. Sci. 70, 43 (2020).
- Hou et al. (2021) T.-J. Hou et al., Phys. Rev. D 103, 014013 (2021).
- Ball et al. (2021) R. D. Ball, E. R. Nocera, and R. L. Pearson, Eur. Phys. J. C 81, 37 (2021).
- Bailey et al. (2021) S. Bailey, T. Cridge, L. A. Harland-Lang, A. D. Martin, and R. S. Thorne, Eur. Phys. J. C 81, 341 (2021).
- Martin et al. (2009) A. D. Martin, W. J. Stirling, R. S. Thorne, and G. Watt, Eur. Phys. J. C 63, 189 (2009).
- Kulagin and Petti (2006) S. A. Kulagin and R. Petti, Nucl. Phys. A765, 126 (2006).
- CJ- (2023a) https://www.jlab.org/cj/ (accessed: Sept 2023a).
- Acosta et al. (2005) D. Acosta et al., Phys. Rev. D 71, 051104 (2005).
- Abazov et al. (2013) V. M. Abazov et al., Phys. Rev. D 88, 091102 (2013).
- Abazov et al. (2015) V. M. Abazov et al., Phys. Rev. D 91, 032007 (2015), [Erratum: Phys. Rev. D 91, 079901 (2015)].
- Kulagin et al. (1994) S. A. Kulagin, G. Piller, and W. Weise, Phys. Rev. C 50, 1154 (1994).
- Kulagin et al. (1995) S. A. Kulagin, W. Melnitchouk, G. Piller, and W. Weise, Phys. Rev. C 52, 932 (1995).
- Griffioen et al. (2015) K. A. Griffioen et al., Phys. Rev. C 92, 015211 (2015).
- Melnitchouk et al. (2005) W. Melnitchouk, R. Ent, and C. Keppel, Phys. Rep. 406, 127 (2005).
- Li et al. (2021) S. Li, A. Accardi, and I. Fernando, in “Exploring QCD with Tagged Processes”, Paris, 11-22 Oct 2021 (2021).
- Hobbs et al. (2019) T. J. Hobbs, B.-T. Wang, P. M. Nadolsky, and F. I. Olness, Phys. Rev. D 100, 094040 (2019).
- Arneodo et al. (1995) M. Arneodo et al., Phys. Lett. B 364, 107 (1995).
- Whitlow (1990) L. W. Whitlow, Ph.D. thesis, Stanford University (1990).
- Tao (1994) L. Tao, Ph.D. thesis, The American Unversity (1994).
- Arneodo et al. (1997a) M. Arneodo et al., Nucl. Phys. B483, 3 (1997a).
- Benvenuti et al. (1989) A. C. Benvenuti et al., Phys. Lett. B 223, 485 (1989).
- Benvenuti et al. (1990) A. Benvenuti et al., Phys. Lett. B 237, 592 (1990).
- Airapetian et al. (2011) A. Airapetian et al., J. High Energy Phys. 2011, 126 (2011).
- V. Tvaskis (2004) V. Tvaskis, Ph.D. thesis, Amsterdam University (2004).
- Seely et al. (2009) J. Seely et al., Phys. Rev. Lett. 103, 202301 (2009).
- Daniel (2007) A. Daniel, Ph.D. thesis, University of Houston (2007).
- Malace (2006) S. Malace, Ph.D. thesis, Hampton University (2006).
- Arneodo et al. (1997b) M. Arneodo et al., Nucl. Phys. B487, 3 (1997b).
- Pumplin et al. (2002) J. Pumplin, D. R. Stump, J. Huston, H.-L. Lai, P. Nadolsky, and W.-K. Tung, J. High Energy Phys. 2002, 12 (2002).
- Amaudruz et al. (1991) P. Amaudruz et al., Phys. Rev. Lett. 66, 2712 (1991).
- Arneodo et al. (1994b) M. Arneodo et al., Phys. Rev. D 50, R1 (1994b).
- Kumano (1998) S. Kumano, Phys. Rep. 303, 183 (1998).
- Geesaman and Reimer (2019) D. F. Geesaman and P. E. Reimer, Rep. Prog. Phys. 82, 46301 (2019).
- Baldit et al. (1994) A. Baldit et al., Phys. Lett. B 332, 244 (1994).
- Ackerstaff et al. (1998) K. Ackerstaff et al., Phys. Rev. Lett. 81, 5519 (1998).
- Hawker et al. (1998) E. A. Hawker et al., Phys. Rev. Lett. 80, 3715 (1998).
- Towell et al. (2001) R. S. Towell et al., Phys. Rev. D 64, 052002 (2001).
- Ross and Sachrajda (1979) D. A. Ross and C. T. Sachrajda, Nucl. Phys. B149, 497 (1979).
- Thomas (1983) A. W. Thomas, Phys. Lett. 126B, 97 (1983).
- Salamu et al. (2015) Y. Salamu, C.-R. Ji, W. Melnitchouk, and P. Wang, Phys. Rev. Lett. 114, 122001 (2015).
- Accardi et al. (2020) A. Accardi, C. E. Keppel, S. Li, W. Melnitchouk, G. Niculescu, I. Niculescu, and J. F. Owens, Phys. Lett. B 801, 135143 (2020).
- Badelek and Kwiecinski (1992) B. M. Badelek and J. Kwiecinski, Nucl. Phys. B370, 278 (1992).
- Zoller (1992) V. R. Zoller, Phys. Lett. B 279, 145 (1992).
- Melnitchouk and Thomas (1993) W. Melnitchouk and A. W. Thomas, Phys. Rev. D 47, 3783 (1993).
- Piller et al. (1995) G. Piller, W. Ratzka, and W. Weise, Z. Phys. A 352, 427 (1995).
- Whitlow et al. (1992) L. Whitlow, E. Riordan, S. Dasu, S. Rock, and A. Bodek, Phys. Lett. B 282, 475 (1992).
- Christy and Bosted (2010) M. E. Christy and P. E. Bosted, Phys. Rev. C 81 (2010).
- Bosted and Christy (2008) P. E. Bosted and M. E. Christy, Phys. Rev. C 77 (2008).
- Schienbein et al. (2008) I. Schienbein et al., J. Phys. G 35, 053101 (2008).
- Accardi and Qiu (2008) A. Accardi and J.-W. Qiu, J. High Energy Phys. 07, 090 (2008).
- Steffens et al. (2012) F. M. Steffens, M. D. Brown, W. Melnitchouk, and S. Sanches, Phys. Rev. C 86, 065208 (2012).
- Blumlein (2013) J. Blumlein, Prog. Part. Nucl. Phys. 69, 28 (2013).
- Lai et al. (2000) H. L. Lai, J. Huston, S. Kuhlmann, J. Morfin, F. I. Olness, J. F. Owens, J. Pumplin, and W. K. Tung, Eur. Phys. J. C 12, 375 (2000).
- Salamu et al. (2019) Y. Salamu, C.-R. Ji, W. Melnitchouk, A. W. Thomas, and P. Wang, Phys. Rev. D 99, 014041 (2019).
- Nachtmann (1973) O. Nachtmann, Nucl. Phys. B63, 237 (1973).
- Greenberg and Bhaumik (1971) O. W. Greenberg and D. Bhaumik, Phys. Rev. D 4, 2048 (1971).
- Weigl and Melnitchouk (1996) T. Weigl and W. Melnitchouk, Nucl. Phys. B465, 267 (1996).
- Bali et al. (2019) G. Bali, S. Collins, M. Göckeler, R. Rödl, A. Schäfer, and A. Sternbeck, Phys. Rev. D 100, 014507 (2019).
- Yang et al. (2018) Y.-B. Yang, J. Liang, Y.-J. Bi, Y. Chen, T. Draper, K.-F. Liu, and Z. Liu, Phys. Rev. Lett. 121, 212001 (2018).
- Harris et al. (2019) T. Harris, G. von Hippel, P. Junnarkar, H. B. Meyer, K. Ottnad, J. Wilhelm, H. Wittig, and L. Wrang, Phys. Rev. D 100, 034513 (2019).
- Alexandrou et al. (2020a) C. Alexandrou et al., Phys. Rev. D 101, 034519 (2020a).
- Alexandrou et al. (2020b) C. Alexandrou, S. Bacchio, M. Constantinou, J. Finkenrath, K. Hadjiyiannakou, K. Jansen, G. Koutsou, H. Panagopoulos, and G. Spanoudes, Phys. Rev. D 101, 094513 (2020b).
- Mondal et al. (2020) S. Mondal, R. Gupta, S. Park, B. Yoon, T. Bhattacharya, and H.-W. Lin, Phys. Rev. D 102, 054512 (2020).
- Alekhin et al. (2017b) S. I. Alekhin, J. Blümlein, S. Moch, and R. Placakyte, Phys. Rev. D 96, 014011 (2017b).
- Abramowicz et al. (2015) H. Abramowicz et al., Eur. Phys. J. C 75, 580 (2015).
- Sato et al. (2020) N. Sato, C. Andres, J. J. Ethier, and W. Melnitchouk, Phys. Rev. D 101, 074020 (2020).
- Harland-Lang et al. (2015) L. A. Harland-Lang, A. D. Martin, P. Motylinski, and R. S. Thorne, Eur. Phys. J. C 75, 204 (2015).
- Ball et al. (2017) R. D. Ball et al., Eur. Phys. J. C 77, 663 (2017).
- Butterworth et al. (2016) J. Butterworth et al., J. Phys. G 43, 023001 (2016).
- CJ- (2023b) https://github.com/JeffersonLab/CJ-database (accessed: Sept 2023b).
- Dasu et al. (1994) S. Dasu et al., Phys. Rev. D 49, 5641 (1994).
- Albayrak (2011) I. H. Albayrak, Ph.D. thesis, Hampton University (2011).
- Liang et al. (2022) Y. Liang et al., Phys. Rev. C 105, 065205 (2022).
- Christy et al. (2004) M. E. Christy et al., Phys. Rev. C 70, 015206 (2004).
- Tvaskis et al. (2010) V. Tvaskis et al., Phys. Rev. C 81, 055207 (2010).
- Tvaskis et al. (2007) V. Tvaskis et al., Phys. Rev. Lett. 98, 142301 (2007).
- Niculescu (1999) M. I. Niculescu, Ph.D. thesis, Hampton University (1999).
- Malace et al. (2009) S. P. Malace et al., Phys. Rev. C 80, 035207 (2009).
- Osipenko et al. (2003a) M. Osipenko et al., Phys. Rev. D 67, 092001 (2003a).
- Osipenko et al. (2006) M. Osipenko et al., Phys. Rev. C 73, 045205 (2006).
- Osipenko et al. (2003b) M. Osipenko et al., (2003b), arXiv:hep-ex/0309052 .
- Osipenko et al. (2005) M. Osipenko et al., (2005), arXiv:hep-ex/0507098 .
- Kotwal (1995) A. V. Kotwal, Ph.D. thesis, Harvard University (1995).
- Hunt-Smith et al. (2022) N. T. Hunt-Smith, A. Accardi, W. Melnitchouk, N. Sato, A. W. Thomas, and M. J. White, Phys. Rev. D 106, 036003 (2022).
- Buckley et al. (2015) A. Buckley, J. Ferrando, S. Lloyd, K. Nordström, B. Page, M. Rüfenacht, M. Schönherr, and G. Watt, Eur. Phys. J. C 75, 132 (2015).
- LHA (2023) https://lhapdf.hepforge.org/ (accessed: Sept 2023).
- Abdul Khalek et al. (2022) R. Abdul Khalek et al., Nucl. Phys. A1026, 122447 (2022).
- txg (2023) https://jeffersonlab.github.io/txgrids (accessed: Sept 2023).
- Guzey et al. (2012b) V. Guzey, L. Zhu, C. E. Keppel, M. E. Christy, D. Gaskell, P. Solvignon, and A. Accardi, Phys. Rev. C 86, 045201 (2012b).
- (143) H. Abramowicz and A. Levy, arXiv:hep-ph/9712415 [hep-ph] .
- Segarra et al. (2020) E. P. Segarra, A. Schmidt, T. Kutz, D. W. Higinbotham, E. Piasetzky, M. Strikman, L. B. Weinstein, and O. Hen, Phys. Rev. Lett. 124, 092002 (2020).
- Accardi et al. (2021b) A. Accardi et al., Eur. Phys. J. A 57, 261 (2021b).
- Petti (2022) R. Petti, Phys. Lett. B 834, 137469 (2022).