Optical and spin coherence of Er3+ in epitaxial CeO2 on silicon
Abstract
Solid-state atomic defects with optical transitions in the telecommunication bands, potentially in a nuclear spin free environment, are important for applications in fiber-based quantum networks. Erbium ions doped in CeO2 offer such a desired combination. Here we report on the optical homogeneous linewidth and electron spin coherence of Er3+ ions doped in CeO2 epitaxial film grown on a Si(111) substrate. The long-lived optical transition near 1530 nm in the environmentally-protected 4f shell of Er3+ shows a narrow homogeneous linewidth of 440 kHz with an optical coherence time of 0.72 at 3.6 K. The reduced nuclear spin noise in the host allows for Er3+ electron spin polarization at 3.6 K, yielding an electron spin coherence of 0.66 (in the isolated ion limit) and a spin relaxation of 2.5 ms. These findings indicate the potential of Er3+:CeO2 film as a valuable platform for quantum networks and communication applications.
1 Introduction
Rare-earth (RE) ions in dielectric solid-state hosts provide a promising platform for developing quantum memories [1, 2, 3] in quantum repeaters [1, 4] for use in quantum communication networks because of their unique combination of stationary matter qubits and flying photon qubits provided by transitions in their uniquely environmentally protected 4f shell electrons. This spin-photon interface [1, 5] is characterized by long-lived spin states with a long coherence time [5] and narrow optical homogeneous linewidth [6, 7]. These unique properties of RE ions have been explored to demonstrate quantum memories in atomic vapor using the DLZC (Duan, Lukin, Cirac and Zoller) protocol, [8] and in solids, using electromagnetically induced transparency [2, 3], photon-echo [2, 3] and atomic frequency comb [9, 10]. Progress has also been made in realizing entanglement distribution [11] and quantum transduction [12, 13]. All these demonstrations are enabled by a combination of RE ion and crystalline host properties.
The implementation of quantum networks for quantum communication applications demands the realization of entanglement distribution of quantum information over long distances. Thus, it is desirable for the matter qubits/nodes to be able to interface with telecommunication C-band photons to leverage the existing optical fiber networks providing minimum optical loss. Trivalent erbium ions (Er3+) embedded in rare-earth oxides have to optical transitions in the telecom C-band and, thus, have gained attention as a candidate system aimed at developing telecom-compatible quantum memories needed in quantum repeaters. Approaches have been explored to store information in Er3+ long-lived optical transitions using photon-echo techniques [2, 4, 14] with retrieval efficiencies up to 40%, [15] but with fidelities of recalled states well below the classical limit of 1/2 and no-cloning limit of 2/3 [16]. These figures-of-merit are critical to prevent eavesdropping in quantum communication networks and enable acceptable levels of quantum error correction in distributed fault-tolerant quantum computing. Therefore, long storage times and efficient retrieval of states with high fidelity are essential for quantum memories. The optical storage times are limited by the optical coherence time, typically less than 1 s [2, 4, 14], below the proposed requirement for quantum repeater based long-distance quantum networks [17]. The use of Er3+ spin states has emerged as a promising alternative to store photon information with much longer storage times, [18, 19] where a collective spin relaxation in the atomic ensemble is used as a local memory and reconverted to a photon through a collective interference effect [4]. Therefore, it is critical to realize long-lived spin states with coherence times orders of magnitude longer than the optical excited state lifetime for efficient optical control of the spin state and for subsequently suitable long-term quantum state storage [5, 18].
As a Kramer’s ion, the intrinsic non-zero electronic magnetic moment of Er3+ poses an intrinsic limit on the electronic spin relaxation and, therefore, the spin coherence. In addition, the presence of fluctuating magnetic field noise induced by the intrinsic electronic and nuclear spins in host materials further reduces the spin coherence [20]. In some spin qubit-host systems, approaches have been to taken to engineer the nuclear spin bath density through isotopic purification of the host material [5, 21, 22, 23], reduction of unintended spin defects during synthesis, and optimization of defect creation [5] and even isotopic doping processes using 167Er [24] to improve upon coherence properties of the targeted spin qubits. Alternatively, finding host materials with low natural abundant isotopes of non-zero nuclear spins is another viable pathway towards improving spin properties by minimizing spin noise in the host for network applications [5, 25]. An electron spin coherence time of 23 ms has been reported for Er3+ at 10 mK in CaWO4, which has a low nuclear spin environment with only 14% of 183W isotope of natural abundant tungsten with nuclear spin of contributing to the spin noise in the host [26].
To this end, cerium dioxide (CeO2) with cerium contributing zero nuclear spin and oxygen carrying only 0.04% (17O), is a promising potential host for quantum spin systems with a theoretically predicted coherence time up to 47 ms [5, 25]. Recently, we demonstrated the molecular beam epitaxy of single-crystal Er-doped CeO2 films on Si(111) substrates and the doping dependence on Er3+ optical and spin linewidths [27]. In this work, we make use of these films with low doping levels (3 parts-per-million (ppm)) to explore the intrinsic optical homogeneous linewidths and electron spin coherence of Er3+ in CeO2. Using two pulse photon-echo measurements, we demonstrate that the Er3+ ions have long-lived optical states with a narrow homogeneous linewidth of 440 kHz and optical coherence of 0.72 s at 3.6 K. Temperature dependent data suggests that the homogeneous linewidth could be 200 kHz at millikelvin temperatures with optical coherence 1.6 s, indicating the promising potential of Er3+ in CeO2 providing a usefully long optical quantum memory. Moreover, the reduced magnetic field noise from a low nuclear spin environment in the CeO2 film enables electron spin polarization with a slow spin-lattice relaxation, thereby enabling access to the electron spin dynamics even at 3.6 K, which is not observable in other, well studied, host materials including Y2SiO5, YVO4, CaWO4 [28, 29, 30]. As demonstrated here, the Er3+ ions in CeO2 show a spin coherence time at the isolated ion limit with a spin relaxation time 2.5 ms, indicating the potential for millisecond scale spin coherence.
The narrow optical homogeneous linewidth could enable a path towards integration with nanophotonic cavities to drive Er3+ optical transitions coherently at even individual ion level to explore time-dependent spectral diffusion [7], critical for entanglement distribution for quantum repeaters. Therefore, the combined narrow optical homogeneous linewidth and long spin relaxation time indicates the potential of such an Er-doped CeO2 platform in providing attributes necessary for efficient optical control of long-lived and coherent spin states for the development of quantum memories.
2 Results
Er3+ energy structure: crystal field split levels
The Er3+ doped CeO2 sample was epitaxially grown on Si (111) substrate using molecular beam epitaxy (MBE, details in Materials and Methods). A total thickness of 936 nm of single crystal CeO2 with a fluorite structure unit cell was grown and doped with a natural abundance of Er3+ isotopes, comprising 77% nuclear-spin-zero even isotopes 166Er3+ and 23% of the odd isotope 167Er3+ with nuclear spin . The total Er3+ concentration is estimated to be 3 ppm based on Er beam flux, and detailed information on growth and structural characterization can be found in prior work [27].
Er3+ ions have 11 electrons in the 4f shell that lead to the first two spin-orbit split multiplets as and . These multiplets are further split into multiple levels due to the presence of a crystal field. Given the cubic symmetry of the crystal field in CeO2 [31, 27], the and multiplets split into 5 levels, labeled respectively as to and to , in the order from the lowest to highest energy, as shown in Fig. 1(a) [31]. and are two-fold degenerate states with effective spin that transform into irreducible representations and . The higher three Z levels ( to ) are four-fold degenerate with effective spin that transform into irreducible representation .
The crystal field split levels of Er3+ are probed through temperature and power dependent photoluminescence (PL) measurements with Er3+ ions excited by a 1473 nm laser, with photon energy higher than transition, and a spectrometer resolution of 20 GHz resolution (0.16 nm, 84 eV). This resolution is sufficient to resolve crystal field split transitions that are typically in the hundreds of GHz to THz range [32]. At 3.6 K, PL occurs primarily from to all the Z levels due to the rapid non-radiative relaxation of electrons from higher Y levels to level. Four emission peaks are observed in Fig.1(b). These are identified to be to transitions as marked with black arrows. The lack of emission from the level may be due to its small transition dipole moment. The higher Y levels are probed by altering the Boltzmann distribution of electrons through increasing the sample temperature from 3.6 K to 150 K shown in Fig. 1(b). Higher Y level transitions are thus identified based on their temperature dependent behavior and their energy separation between each other. With continued increase of temperature, higher Y levels get populated. We observe clearly the to levels. The level transitions may be shorter than 1500 nm and thus not collected in the measurement setup, see the Supplementary Information Section S1 (SI.S1). The intensity of emission from these identified to levels also matches the expected behavior from a Boltzmann distribution of electrons at these temperatures (see SI.S2). The table shown in Fig. 1(c) summarizes the energy structure of the to and to levels.
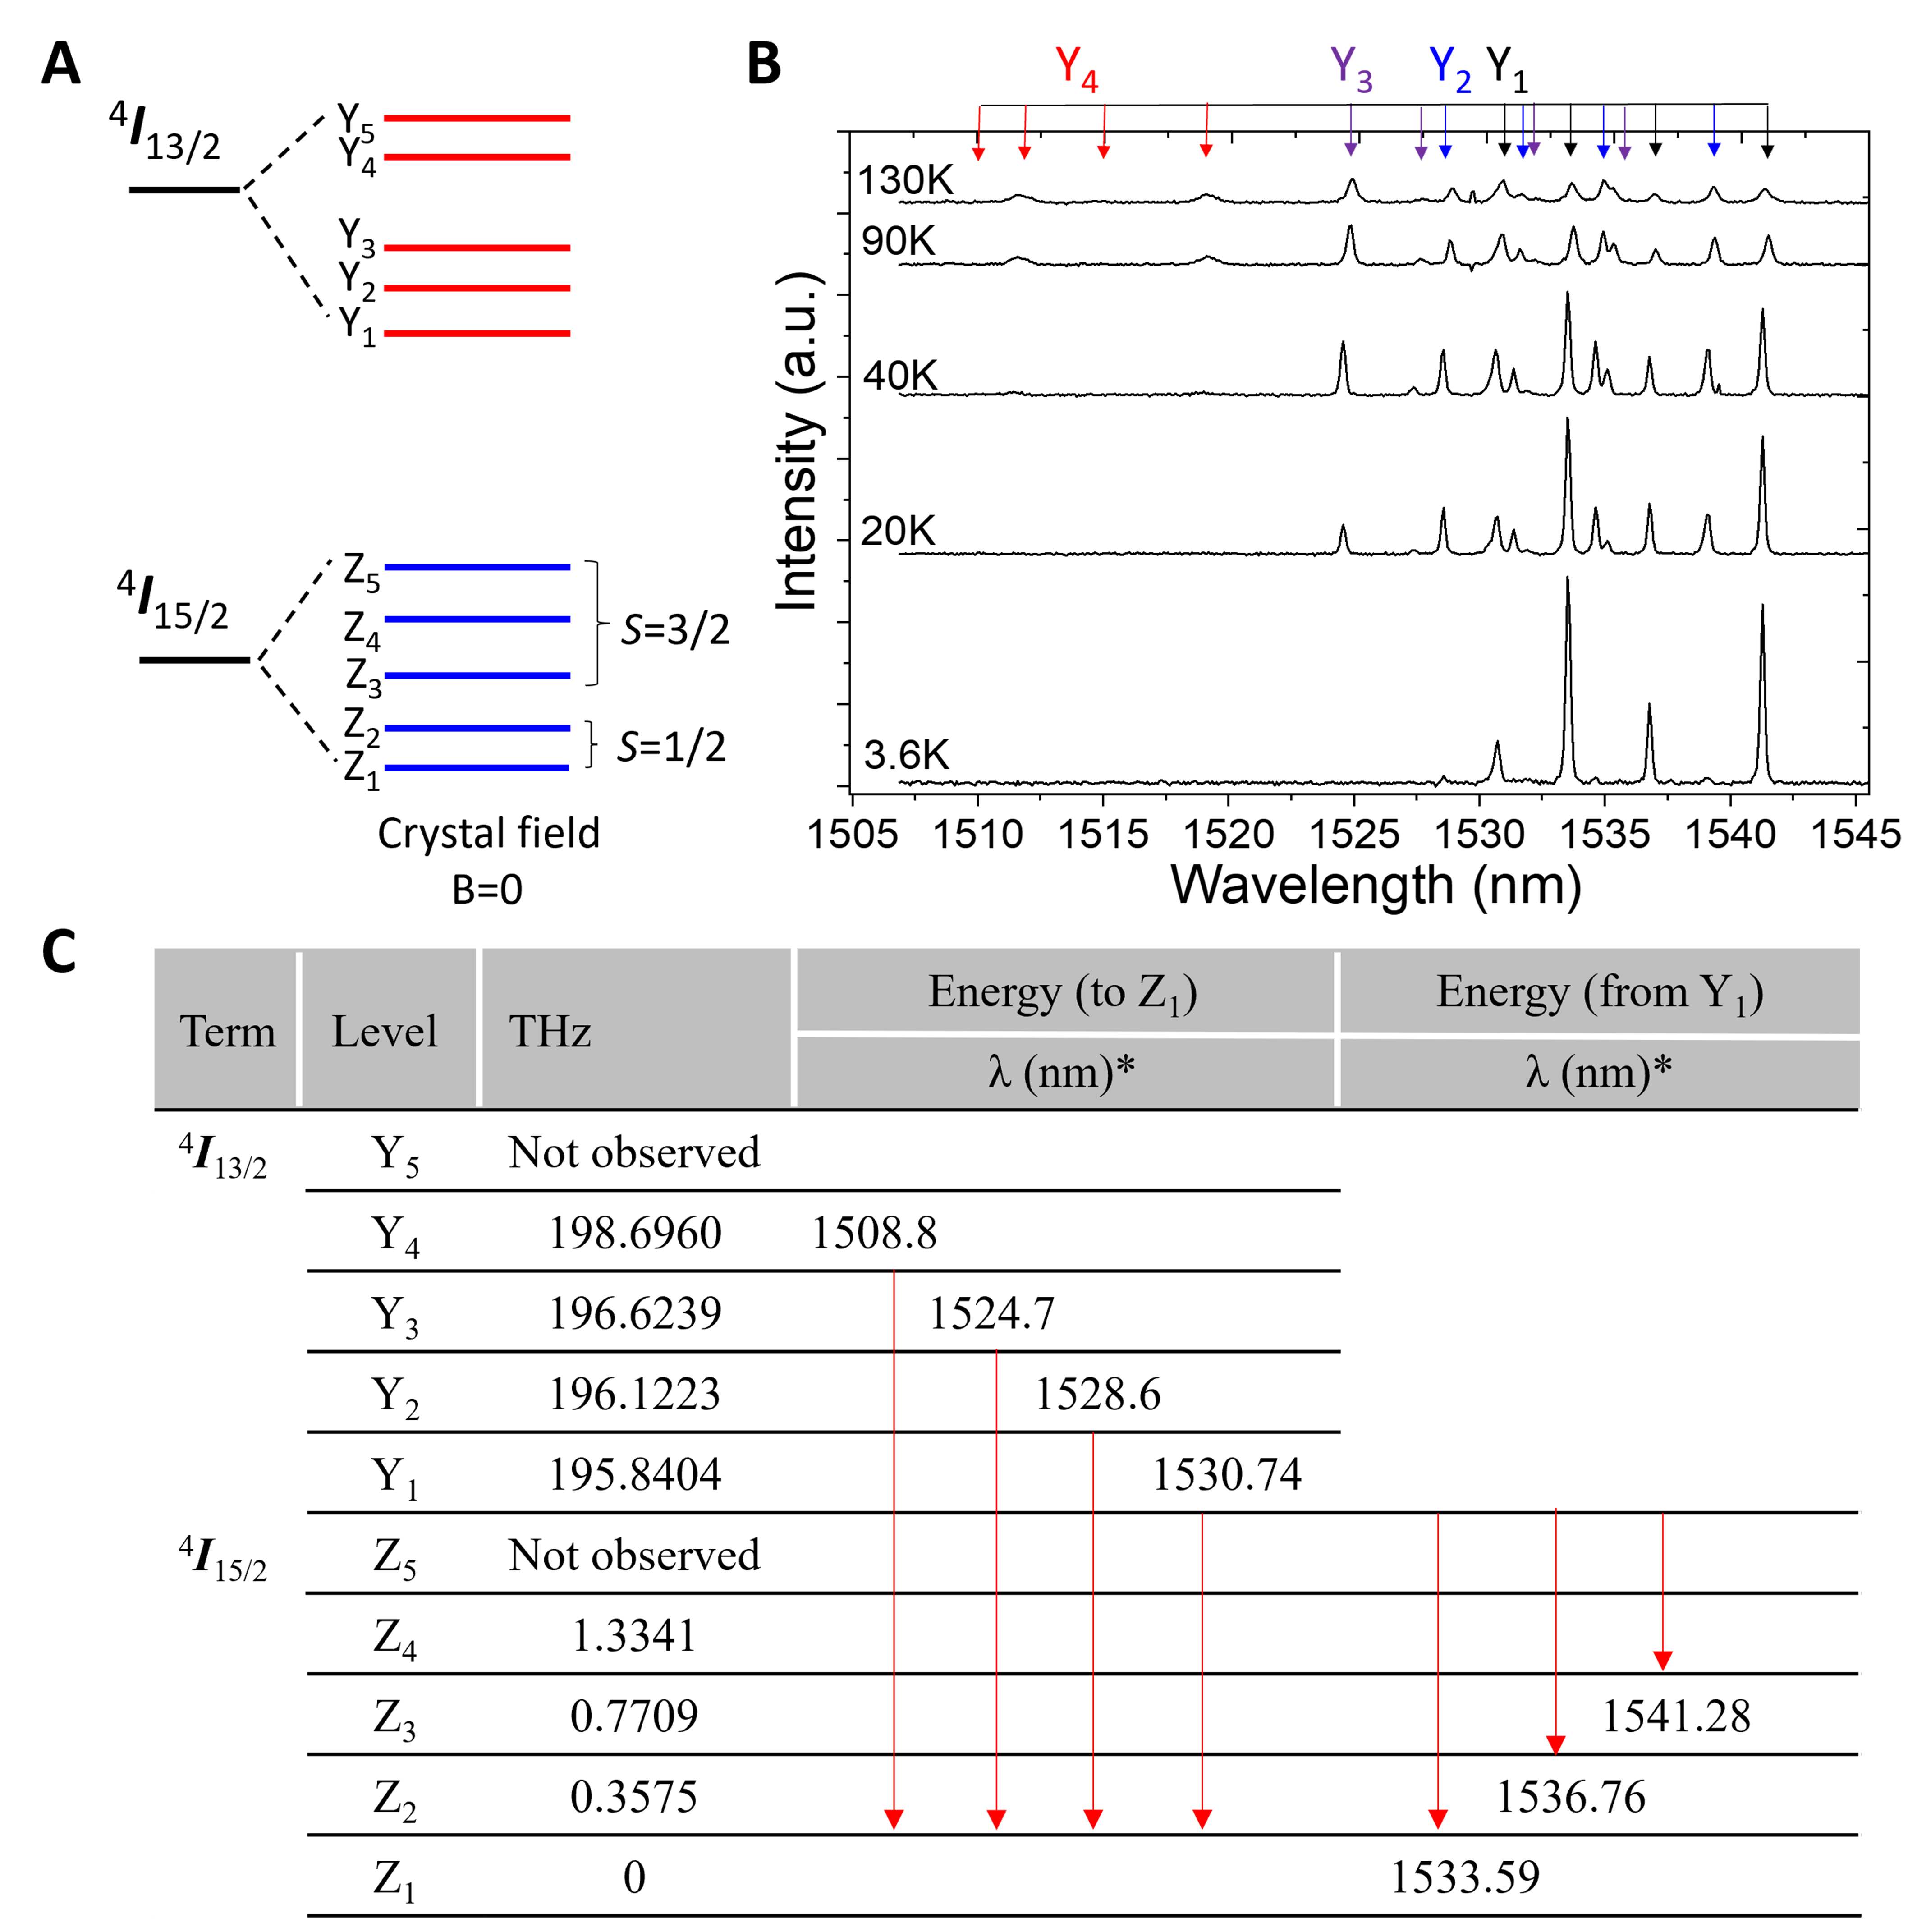
The transition is found to be at 1530.74 nm (195.84 THz). The level is separated from the level by 1.13 meV (281.9 GHz). Similarly, the level is separated from the level by 1.51 meV (357.5 GHz). In this study, we focus on the transition at 1530.74 nm because this transition allows for optical control of the electronic spin ground state ( level). As shown later, this transition also has a narrow optical homogeneous linewidth. All studies on optical homogeneous linewidth, on electron spin coherence and relaxation, are carried out at 3.6 K. Given the energy separation between the and , there is % electron population of the level due to Boltzmann statistics. Thus, in all optical measurements resonantly addressing the transition, one can treat the system as an effective two-level system involving only level and ignore the population of electrons at higher Z levels. However, for spin measurements, the population of the level becomes more significant and magnifies in the study of spin relaxation dynamics of level, as will be discussed later.
Optical coherence of Er3+ emission
With the identification of the crystal field split levels of the transition, we focus on the transition to probe the inhomogeneous and homogeneous linewidths. The inhomogeneous linewidth is probed using photoluminescence excitation spectroscopy (PLE), the measured spectrum is shown in Fig.2(a). It is obtained using the optical pulse sequence schematically shown in the inset of Fig.2(a) (details see Materials and Methods) while scanning the laser frequency across the transition with a step size of 0.625 GHz. The Lorentzian fit to the data indicates an inhomogeneous linewidth of GHz (0.07 nm or 37 eV), comparable to other MBE grown Er3+ doped in other rare-earth oxide films such as Y2O3 and TiO2[33, 34]. Compared with Er3+ ions in other bulk low nuclear spin bath host materials, such as YSO (Y2SiO5), Y2O3, and CaW, the observed linewidth is around a factor of ten higher [35, 36]. This is likely due to the relative high density of threading dislocations and unintended defects in the epitaxial CeO2 film on Si originating from the 0.5% lattice mismatch strain [27]. The observed signal is dominantly from 166Er ions. The emission from the 23% of 167Er is buried under the observed broad inhomogeneous peak. Therefore, we are unable to resolve the hyperfine splitting from 167Er.
Besides inhomogeneous linewidth, the homogeneous linewidth is another important figure-of-merit for an optical transition. One can extract the homogeneous linewidth through the measurement of optical coherence () where [37], and we do so via two-pulse photon-echo (PE) measurement to probe the homogeneous linewidth. Fig.2(b) shows the measured integrated echo intensity as a function of at 3.6 K using the pulse sequence schematically shown in the inset (details in Materials and Methods and SI.S3). The data show a single exponential decay envelope of the photon echo amplitude modulated with an oscillating beat pattern. The beating pattern indicates that we are coherently addressing of a superposition of two transitions in a three-level system with the energy separation of two of the levels being within the bandwidth of the optical pulse. The red line is a fit to the data considering a single exponential decay with an added frequency of oscillation . The data indicate an optical coherence ns with homogeneous linewidth kHz and a beating period of ns ( MHz). The observed beating frequency is within the bandwidth of the optical pulse and also found to be consistent with the Zeeman splitting of the level due to earth’s magnetic field at around 0.35 G. This suggests that the beating might be from the effect of earth’s magnetic field lifting the degeneracy of level.
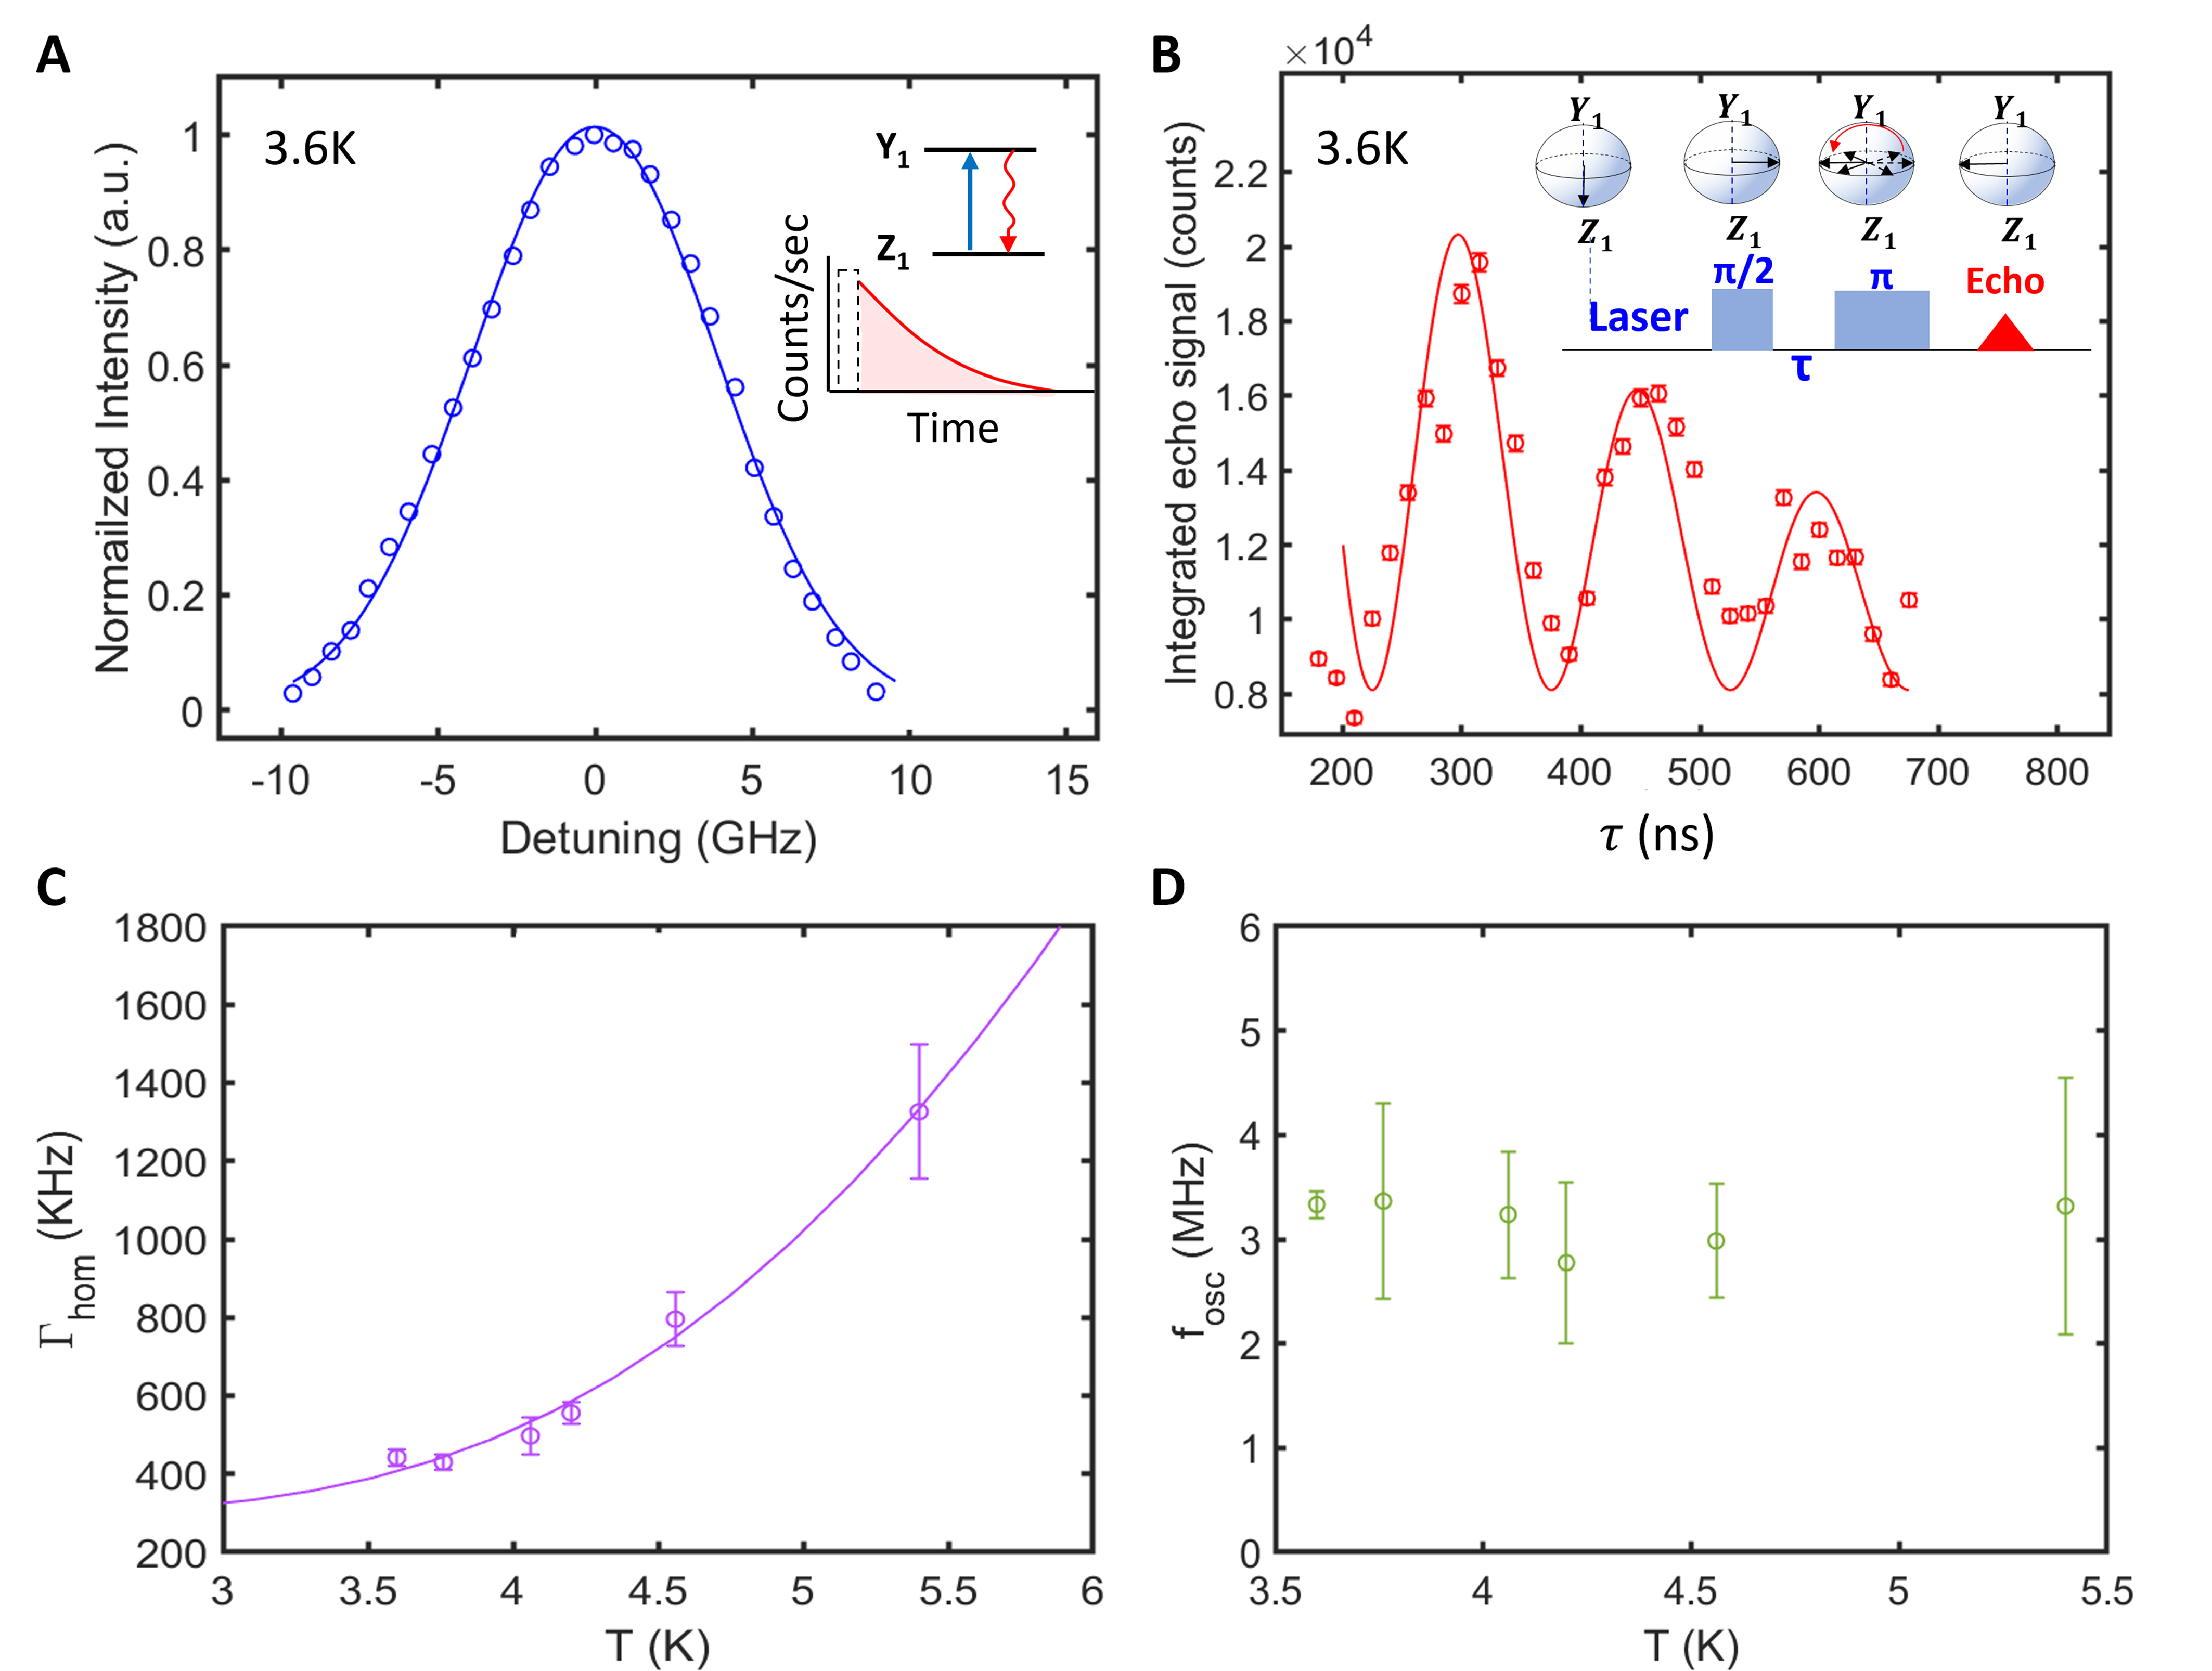
The observed homogeneous linewidth, kHz, at 3.6 K without any externally applied magnetic field is orders of magnitude higher compared to the lifetime-limited Hz given the 3.4 ms radiative lifetime [27] of the transition. To probe the dephasing processes, temperature dependent measurements of is carried out using two pulse PE to gain insights into the dephasing mechanisms occurring in the material, with temperatures ranging from 3.6 K to 5.5 K. Fig.2(c) shows the extracted as a function of temperature. The beat frequency extracted from all temperatures is shown in Fig. Fig.2(d). The beat frequency is independent of temperature which is consistent with its origin being from the Zeeman splitting of the level induced by the earth’s magnetic field. At these measured temperatures, two phonon processes contribute to dephasing: (a) coupling to two-level systems (TLS) [38, 39, 40] (b) Orbach process phonon effects [41, 42] with a homogeneous linewidth of the following form:
| (1) |
where is the linewidth at 0 K, is the coefficient for coupling to TLS, is the Boltzmann constant.
In the probed temperature range, the increase in is dominated by Orbach relaxation. The solid line is the fit to the data using Eq.1 with meV. The extracted is consistent with the energy separation between the to level obtained from PL measurements. Of the total linewidth broadening, kHz is due an Orbach process at 3.6 K with the remaining 300 kHz of broadening coming from the combined contribution of and direct phonon coupling, . The is typically in the range of a few to tens of kHz/K [43, 44, 41] for rare-earth ions in oxides. One can thus deduce that is most likely 200 kHz. This suggests that the dominant dephasing process might be from spectral diffusion due to ion-ion dipolar interactions given the short ensemble average Er-Er separation in the sample (14 nm, estimated from the Er concentration) or a fluctuating field induced by background charge and defects as well as strain in the film. It is worth noting that the sample studied here is grown without any optimization. One can further improve on the homogeneous linewidth by optimizing growth to reduce strain and minimize defects. There is also the path of reducing the concentration of Er3+ to minimize ion-ion dipolar interaction induced spectral diffusion. Besides this, one can also improve the homogeneous linewidth by applying moderate magnetic field to reduce the coupling of TLS to the dipole moment of Er3+ [35, 41]. This can lead to lower tunneling rate, thus reducing the magnetic noise caused by TLS. The field can also freeze Er spin flip-flop processes to reduce fluctuating magnetic field induced spectral diffusion and thus extend optical coherence.
The obtained homogeneous linewidth kHz at 3.6 K suggests that a viable path exists for further engineering the light-matter interaction via integrating Er ions in a cavity with a suitable quality factor to enhance the radiative transition rate through Purcell effect close to its optical coherence limit [45, 46]. Further improvement on the homogeneous linewidth through growth optimization and reduction of spectral diffusion and phonon mediated dephasing at millikelvin temperature with external magnetic field can aid in reaching sub-kHz homogeneous linewidths towards radiative-lifetime limited coherent photon generation, which are needed coherent optical control of the Er spin states.
Er3+ electron spin coherence
The optical coherence study discussed earlier indicates that Er3+ ions in CeO2 show a narrow optical homogeneous linewidth with promising potential of providing up to several microseconds of optical coherence at millikelvin temperatures. For the application and use of Er3+ as the spin-photon interface needed for quantum memory, the Er3+ electron spin coherence is the other important figure-of-merit. Next, we move on to study the Er3+ electron spin behavior. We use a X-band (9.7 GHz) pulsed electron paramagnetic resonance (EPR) spectrometer to study spin coherence and relaxation. Fig. 3 (a) shows the measured spin echo response as a function of the static magnetic field. The data are taken with the delay between the (12 ns) and (24 ns) pulses at 100 ns. The resultant spectrum shows the expected resonance from nuclear-spin-zero even isotopes 166Er3+ (primary peak) along with the hyperfine levels of 23% of the 167Er3+ with nuclear spin (smaller secondary peaks), consistent with results in prior work [27]. Seven of the eight hyperfine peaks are spectrally clearly resolved with one of the hyperfine resonance hiding under the primary resonance peak at T. The measured spectrum is fit using Zeeman and hyperfine terms while also accounting for the second-order perturbation effects from the large nuclear spin of 167Er3+. The extracted g value is , consistent with the CW EPR work reported in prior work [27]. The g value matches theoretical estimates and reported values for Er3+ in CeO2 nanocrystals ([31, 47]). The obtained linewidth of the resonance of Er3+ spin is mT( MHz), consistent with CW results[27]. This result confirms the expected EPR resonance of Er3+ ion in a crystal with cubic crystal field symmetry.
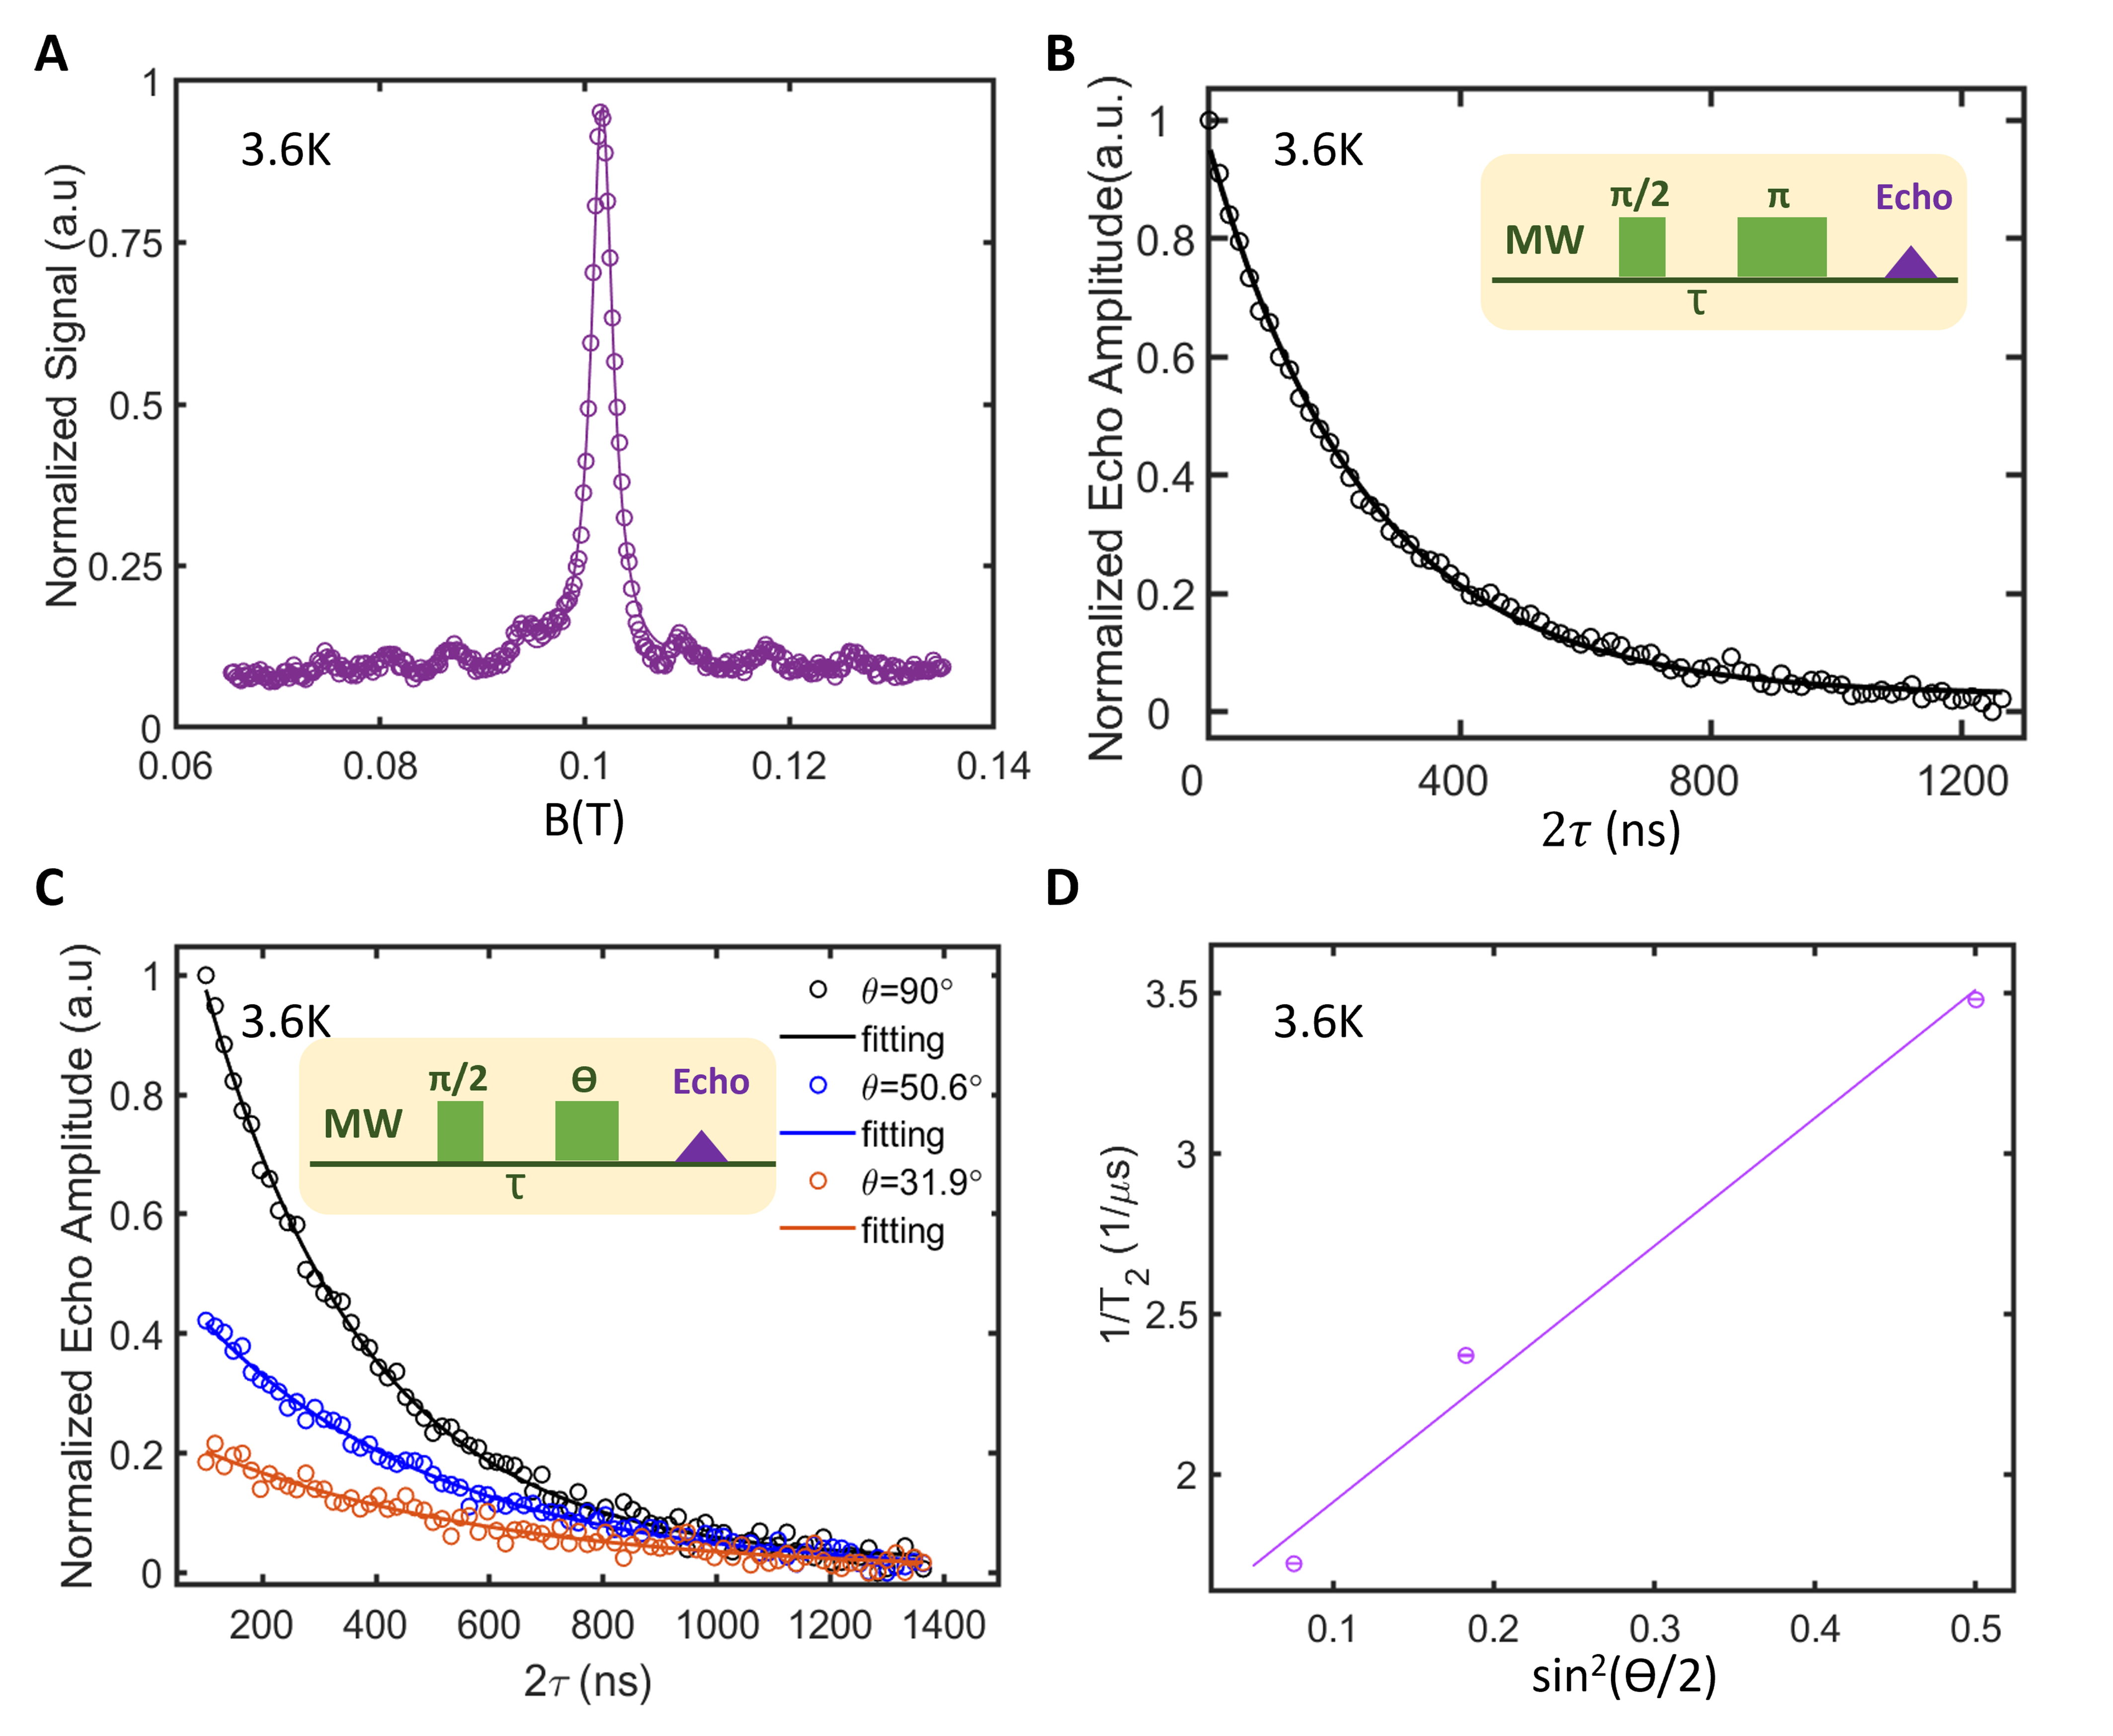
The Er3+ spin coherence time, , is probed via Hahn-echo measurement. The magnetic field is tuned to its resonance at T, the resonance of the primary peak shown in Fig. 3 (a) under the applied 9.7 GHz microwave frequency. The echo signal is predominantly from the 166Er electrons with only 3.6% of the signal from the 167Er electrons. Fig. 3 (b) shows the measured spin echo signal collected as a function of the delay () between the - and the -pulse at 3.6 K. From the fit of (black curve in Fig. 3 (b)), one obtains . The spin is typically limited by the phonon induced dephasing at such elevated temperatures and Er-Er spin dipolar interactions. The Er-Er dipolar spin interaction shifts the spin resonance. These shifts fluctuate and spectral diffusion occurs because of the random spin orientation resulting from spin-lattice interactions or spin diffusion. The dipolar interaction between spins magnifies itself in the spin echo decay through so-called instantaneous diffusion [48, 49]. The spin coherence can be written as where represents the contribution from instantaneous diffusion. To understand the dominant dephasing mechanics, we carry out instantaneous diffusion measurements [48] to probe and decouple the Er-Er spin dipolar interactions. A generalized Hahn echo sequence () is performed on Er spins while the angle, and hence the fidelity, of the second inversion pulse is varied [48, 49]. The second pulse inhibits the decoupling of the probed spins’ mutual dipolar interactions, resulting in decoherence through instantaneous diffusion. The echo signal (SE) is thus proportional to the exponential of the averaged inversion pulse fidelity and is given by [48]:
| (2) |
Thus, is proportional and one have the following equation for where N is the total number of spins per and is the Bohr magnon,
| (3) |
In the instantaneous diffusion measurements, the angle of the second rotation pulse is varied by tuning the power of the microwave pulse (supplementary Section S4), while keeping the pulse length unchanged so that one rotates the same ensemble of spin within the second pulse. Fig. 3 (c) shows the measured echo intensity as a function of with three different rotation angles . A reduction of rotation angle reduces spin flips induced by the microwave pulse, hence, reduces instantaneous diffusion. Er spin increased from to . The inverse of the extracted obtained through the single exponential fit is shown in Fig. 3 (d). Following Eq. 3, the slope of the linear fit to the data in Fig. 3 (d) yields the density of probed Er spins to be , ppm. To estimate the overall concentration of Er, we need to take into account the fraction of probed Er out of the entire ensemble. The linewidth of the spin resonance is mT () MHz, around 8.3 times larger than the bandwidth of the rotation pulse. This indicates that only 12% of the spins within the inhomogeneous distribution are probed. Therefore, the estimated total concentration of the Er spin is ppm, within a factor of 2 of the Er concentration estimated from Er flux used during MBE growth. The intercept of the linear fit provides an estimate on the spin coherence at the single isolated ion limit with . Thus, the measured in Fig. 3 (b) is largely limited by the Er-Er spin dipolar interaction induced instantaneous diffusion and could thus be improved by a reduction of Er concentration. With the generalized echo sequence reducing instantaneous diffusion, the spin homogeneity contributed by the bath is kHz. The deduced spin coherence at the single isolated ion limit is probably limited by the phonon induced dephasing and spectral diffusion induced by interaction with other defects in the film. Further work on studying spin at lower temperature to further probe the nature of dephasing dynamics is underway.
Er3+ electron spin relaxation
The limit on spin coherence is set by the spin relaxation. One can probe the spin relaxation mechanism to obtain an upper limit on the spin . The spin relaxation time is probed by first applying a -pulse to inverse the population of spin-up and spin-down electron states, and then reading out the relaxation of spin-up to spin-down using the two-pulse Haho-echo sequence (schematically shown in Fig.4(a), details see Methods and Materials). By varying the delay time, , between the inversion pulse and the -pulse, one can then map out the spin relaxation dynamics. Fig. 4 (a) shows the measured spin echo signal as a function of measured at 3.6 K. The data indicates the presence of two spin relaxation channels with a short spin relaxation ms and a long relaxation ms. The two observed decay processes might come from the electron depopulation of the spin level to its nearby level, resulting in a sampling of electron population between three active states. EPR is an inductive detection method that is sensitive to the population of ground states. At 3.6 K, there is thermal population of both and levels given the small energy separation of 1.51 meV (357.5 GHz). The added Zeeman splitting further aids in reducing the energy barrier between spin-up and spin-down levels. Possible depopulation of spin-up level to spin level, mediated by phonon processes, can thus be detected by pulsed EPR.
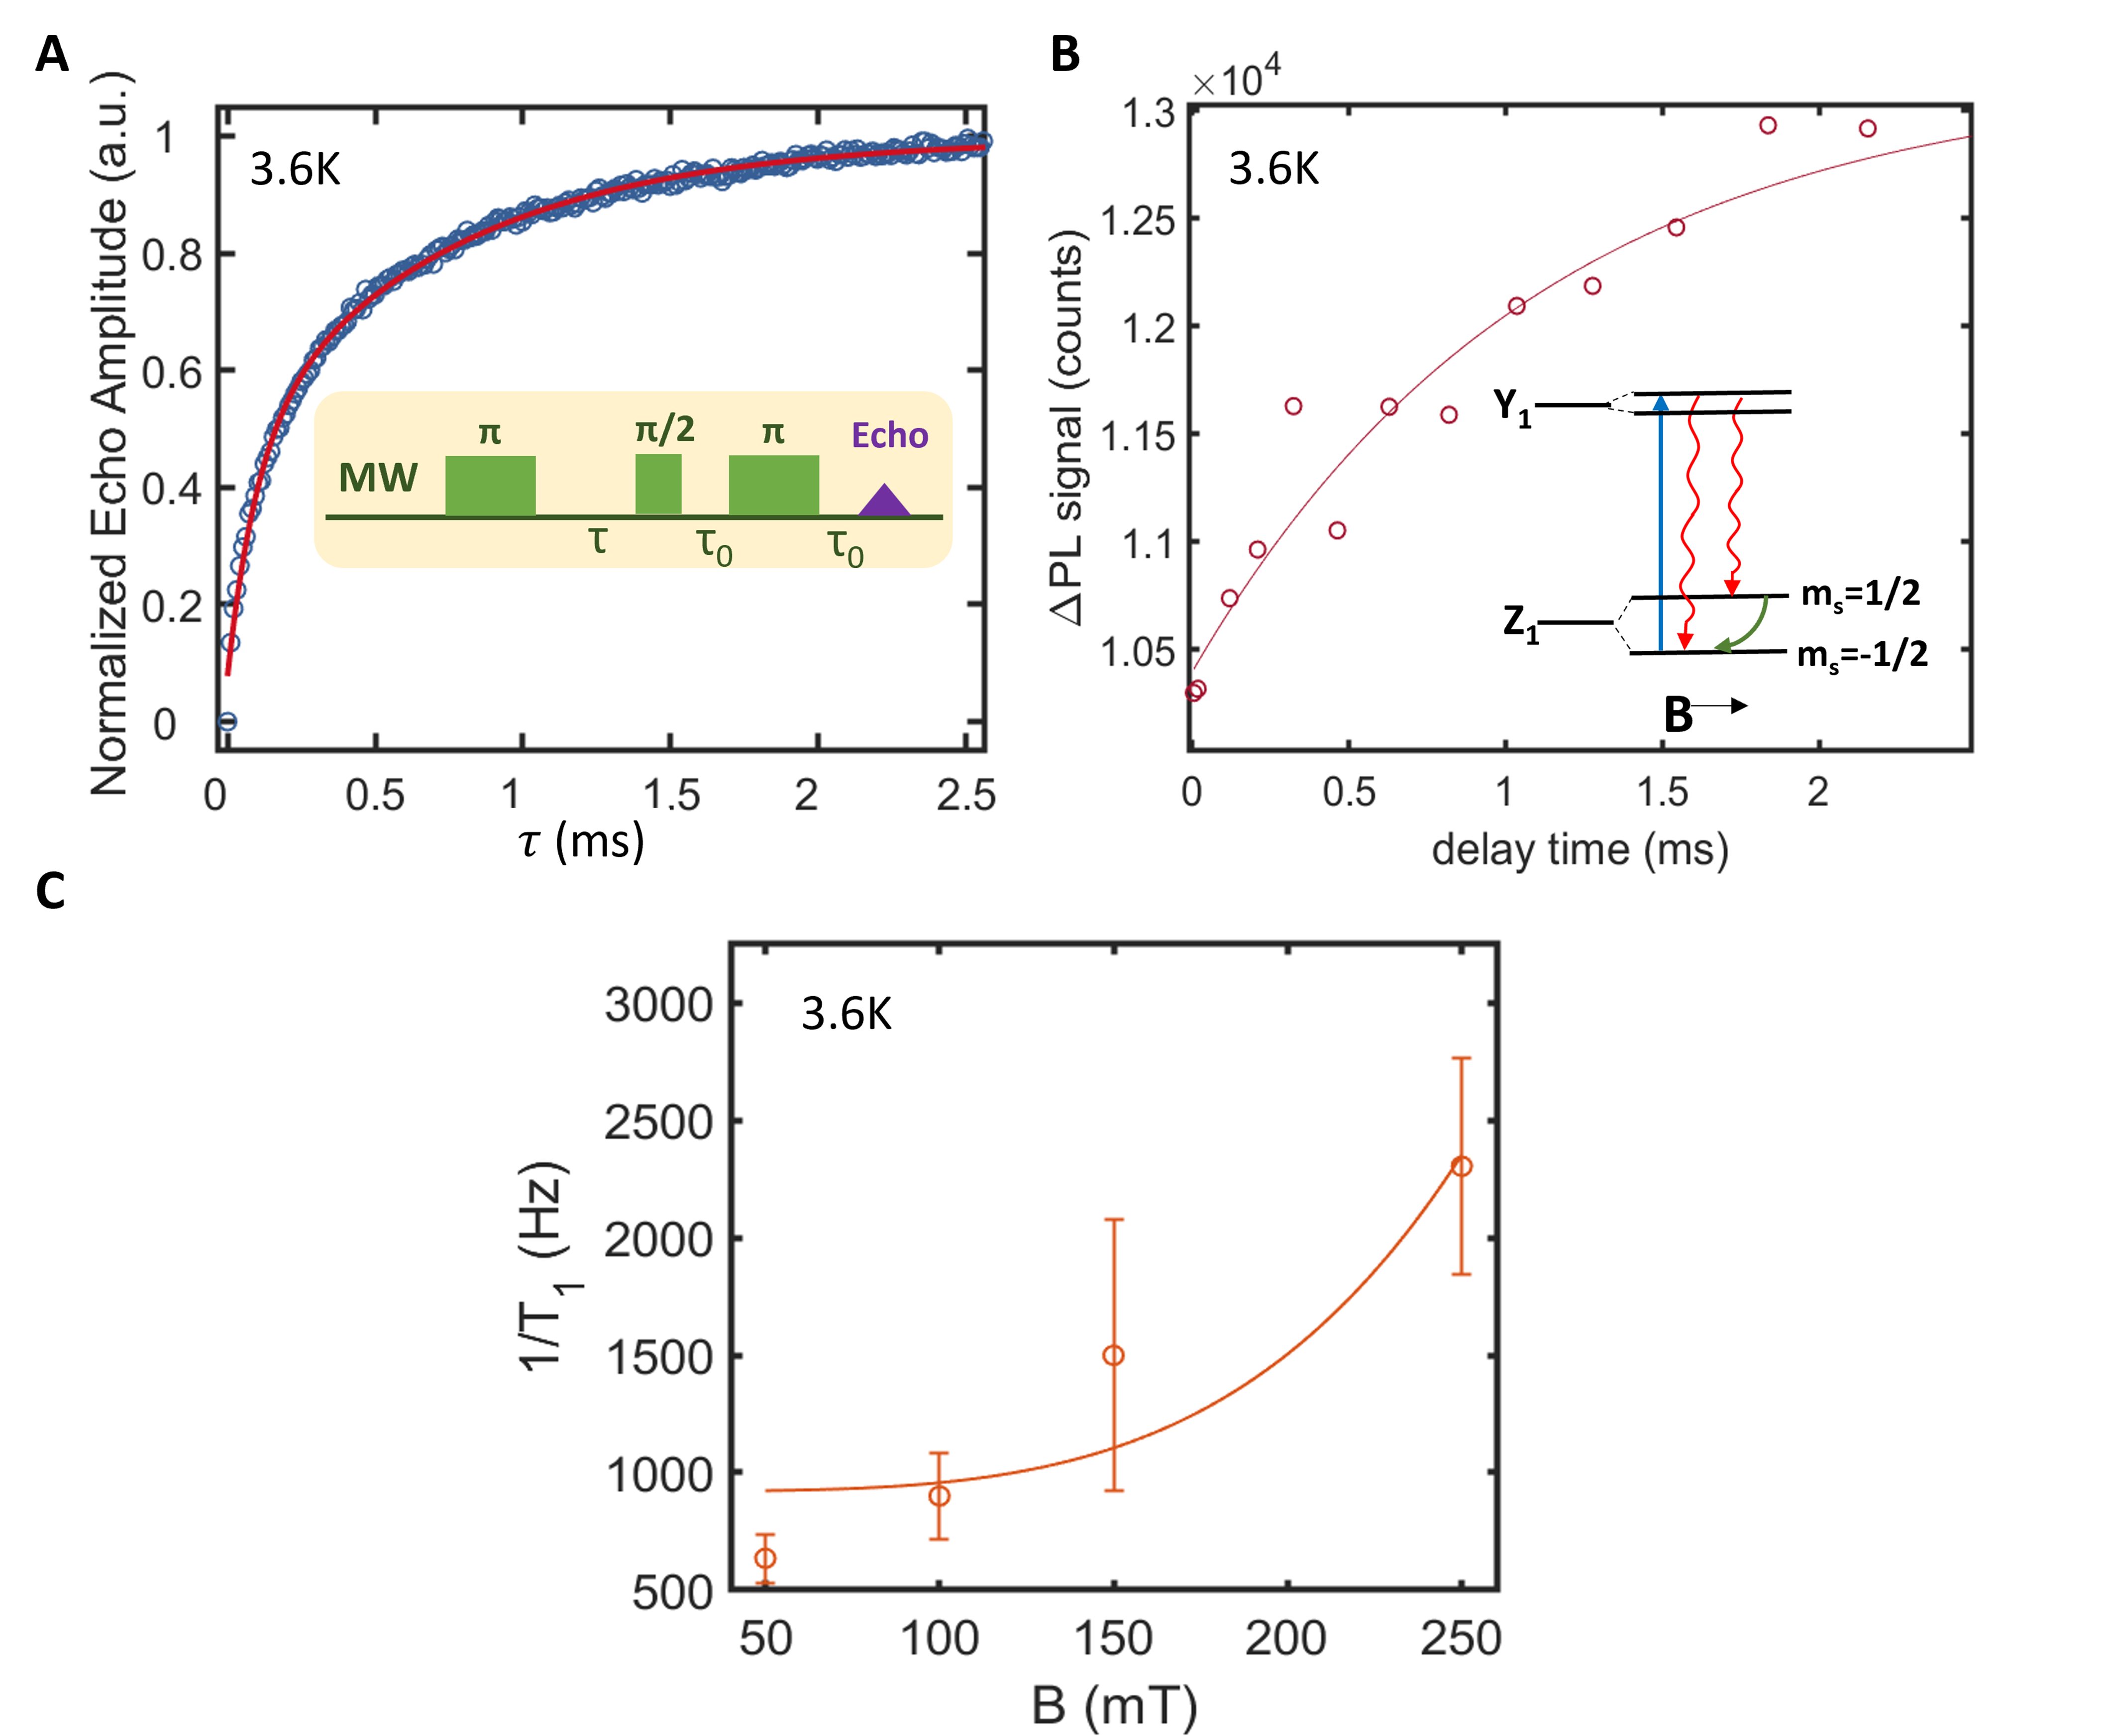
To further probe the origin of the observed double exponential decay dynamics, we carry out optical measurements of spin relaxation of the level at 3.6 K. We apply a 100 mT magnetic field parallel to the direction, with orientation chosen to be the same as that used in the pulsed EPR measurements. A Zeeman splitting of 9.46 GHz between the spin-up and spin-down state of the level is induced, estimated based on the effective g value extracted from data shown in Fig. 3(a). Given that the spin is shorter compared to the optical lifetime of the transition, the optical measurement of spin cannot be done using typical spectral hole-burning method [50, 51], where one can fully polarizes the spins through the cumulative optical excitation processes. Here we use a two pulse optical based ’pump-probe’ scheme to probe the spin relaxation from spin up to spin down state that magnifies in population inversion recovery of the spin down states. We first apply a short 100 optical pulse resonant to the transition between spin down state and the spin up state (inset of Fig.4 to drive the electrons occupying spin-down states to the excited state, creating an initial state occupation where the population of the spin-up state is higher than that of spin-down. A second pulse of 100 is applied after a delay, , to probe the recovery of the spin-down state occupation due to spin relaxation. A reference measurement without the second excitation pulse is taken to sample the photon emission into collection window from optical decay of the level to both spin states after the first optical pulse as the background signal for subtraction (details in SI.S5).
Figure 4(b) shows the measured difference of the PL signal, , collected during the collection window with and without the second optical pulse as a function of between the two optical pulses. The spin recovery from spin-up to spin-down through spin relaxation is evidenced by the increasing with increasing . The data shows a single exponential decay (fitting, solid line) indicating a spin relaxation time for the Zeeman split spin-up to spin-down state of ms. The measured value is consistent with the long resolved in the pulsed EPR shown in Fig.4(a). The observed single exponential decay in optical measurement of spin relaxation of level also suggests that the short of 0.11 ms observed in pulsed EPR measurement is most likely coming from the phonon mediated depopulation of electrons from spin up level to level.
At this temperature, the spin relaxation time of the ground state is limited by phonon-mediated processes, including direct, Raman and Orbach processes [52]. One can further extend the relaxation time by tuning the magnetic field to control the direct coupling process, which can be suppressed with lower magnetic field by reducing the number of phonon modes that can couple to the Zeeman split states as [53]:
| (4) |
where is the energy difference between the two spin sub-levels under magnetic field , is Boltzmann’s constant and is Planck’s constant. Figure 4(c) shows the measured spin time as a function of the magnitude of the applied magnetic field. We measure with B-field at 50 mT, 100 mT, 150 mT and 250 mT. The values are extracted from measured data (see SI.S5) using the same two optical pulse sequence. We observe an extension of from ms to ms when reducing the field strength from 100 mT to 50 mT, and similarly a reduction of to ms at an elevated field of 250 mT. The solid line shown is a fit to the data using Eq.4 with the Raman and Orbach processes treated as a constant in the fitting. The fitting suggests that one can further extend the spin to 2.5 ms at 3.6 K. The observed spin in the single-ion limit is 0.66 , much less than the observed spin , possibly due to magnetic and electric noise from Er spin flip induced spectral diffusion and defects present in the film. One could further extend both spin and by freezing out the spin-flip induced dephasing at moderate fields and freezing out higher order phonon effects at millikelvin temperatures.
3 Conclusion
Our work on Er-doped CeO2 hightlights the potential of this material system as a robust optical quantum memory platform owing to its narrow linewidth and long-lived optically addressable electron spin, enabled by the low nuclear spin host environment. The observed homogeneous linewidth of 440 kHz for the transition and electron spin relaxation time of 2.5 ms at 3.6 K indicate the feasibility of using collective electron spin relaxation as a local quantum memory for quantum repeaters. The narrow homogeneous linewidth of 440 kHz also demonstrates the potential for integrating Er3+ with nanophotonic cavities to achieve Purcell enhancement and near Fourier transformation-limited single-photon emission. This would allow for coherently driven optical transitions at a desired rate to address individual ions [45, 54] and examine the time-dependent spectral diffusion of individual Er3+ ions in the host [7], a critical step towards entanglement distribution needed for quantum repeaters. The significant reduction in the concentration of nuclear magnetic moments in CeO2 compared to that of other hosts, such as Y2SiO5 and YAG, could open a path towards not only long-lived coherent Er3+ electron spin states, but also long-lived nuclear spins in isotopically enriched 167Er to enable long storage times on the scale of seconds, using both collective relaxation modes of nuclear spin ensembles [18] and individual nuclear spin states [55, 56].
The Er3+ spin ensemble coherence value reported here is largely limited by the ion-ion dipolar interaction. As indicated by the instantaneous diffusion measurements, in the single-ion limit, the Er3+ spin coherence is around 0.66 . One can be further improve spin coherence by lowering the temperature below the explored 3.6 K in this work to millikelvin temperature. One can also further improve coherence by using higher magnetic fields to freeze spin-flip induced dephasing. The MBE growth of Er-doped oxides also enables the control of Er doping levels and optimization of material quality in minimizing defects and dislocations in the film to reach high quality single crystal CeO2 thereby reducing spectral diffusion and improving on both optical and spin properties. It can also enable growth of CeO2 thin films with controlled delta doping of Er to create structures compatible with integration with nanophotonic cavities, either within the oxide or hybrid structures integrated with other dielectric materials. The sample studied here is grown without growth optimization yet already demonstrates appreciable spin relaxation ( 2.5 ms) and narrow optical homogeneous linewidths (440 kHz). Continued growth optimization employing slower growth rates—with a lower oxygen pressure [57] to suppress formation of dislocations and further reduce unintended defect concentrations in the film—has the potential to significantly reach narrower homogeneous linewidths and longer spin coherence and relaxation. Thus, Er3+ in CeO2, an oxide host with a very low nuclear spin environment, could emerge as a versatile platform for highly coherent light–matter quantum interfaces for developing quantum communication applications.
4 Materials and Methods
Sample and growth
The Er-doped CeO2 film studied here is grown on silicon (111)0.5∘ using molecular beam epitaxy. Single crystal CeO2 is grown at a sample temperature of with a growth rate of 312.1 nm/hr under oxygen pressure of 4.9e-6 torr and Ce/ flux ratio . The grown CeO2 layer is 936.3 nm thick with Er-doped through the entire grown layer with an estimated Er concentration of 3ppm, based on the Erbium flux delivered during growth [27]. Details on growth condition and structural characterization of as-grown films can be found in Ref.[27]. The as-grown sample is directly used for all the measurements shown here without any post-growth processing.
Optical pulse sequences for optical measurements
All optical data shown in the main text are collected at 3.6 K with Er emission collected using time gating method. For PLE measurements (Fig. 2(a)), 1.5 ms long optical pulse with wavelength tuned across transition is used to excite the Er ions. A collection window of 7 ms after the excitation pulse is used to collect the emission from Er ions. The collection window is chosen based on the optical lifetime of the transition (3.4 ms, Ref. [27]) to enable needed signal-to-noise. For photon echo measurements (Fig.2(b) and (c)), 10 ns -pulse followed with a 20 ns -pulse after a delay is used. The laser is set to be resonant with the transition with laser power tuned to reach needed and pulse area (see SI.S3). The shortest possible pulse enabled by our instrumentation is used to minimize dephasing during the excitation process. Data are collected with ranging from 180 ns to 700 ns. Details on instrumentation for all optical measurements are captured in SI.S1 and SI.S3.
Pulsed EPR measurements
X-Band (9.7 GHz) EPR experiments are taken using an ELEXSYS E580 spectrometer (Bruker Biospin, Ettlingen, Germany) that is equipped with a dielectric ring resonator (Bruker ER 4118X-MD5). The Er-doped CeO2 film on Si samples are diced to a size of 4 mm x 2.5 cm and mounted into a quartz tube suspended in the center of the dielectric ring resonator contained in a flow cryostat (Oxford Instruments CF935) with pumped liquid helium. The data shown in the manuscript are obtained at 3.6K with temperature controlled by an ITX temperature controller (Oxford Instruments). For spin echo field sweep (Fig.3(a)), two-pulse Hahn echo sequence is applied with a 12 ns -pulse followed by a 24 ns -pulse with a fixed delay of 100 ns. The pulse length is chosen for the shorted achievable length to cover large size of Er spin ensemble. For spin coherence measurement (Fig.3(b)), the same Hahn echo sequence is used with a varying delay ranging from 100 ns to 1300 ns. For spin relaxation measurement (Fig.4(a)), three-pulse population inversion sequence is used where a 24 ns -pulse is followed by a two-pulse Hahn echo sequence with varying time delay . The two-pulse Hahn echo sequence used here is composed of a 12 ns -pulse followed by a 24 ns -pulse with a fixed delay of 100 ns.
5 Acknowledgements
The authors would like to thank Dr. Jonathan Marcks and Dr. Yeghishe Tsaturyan for helpful discussions. This work was primarily funded (J.Z., M.T.S., F. J. H., D. D. A.) by the U.S. Department of Energy, Office of Science, Basic Energy Sciences, Materials Sciences and Engineering Division, including support for optical and spin characterization studies. The sample growth (I.M., G.D.G., S.G.) along with additional support for cryo-optical measurements (G.D.G., A.M.D.) was funded by Q-NEXT, a U.S. Department of Energy Office of Science National Quantum Information Science Research Centers under Award Number DE-FOA-0002253. The EPR work in the Chemical Sciences and Engineering Division was supported by the U.S. Department of Energy, Office of Science, Office of Basic Energy Sciences, Division of Chemical Sciences, Geosciences, and Biosciences, through Argonne National Laboratory under Contract No. DE-AC02-06CH11357.
Funding:
U.S. Department of Energy, Office of Science, Basic Energy Sciences, Materials Sciences and Engineering Division U.S. Department of Energy, Office of Science, National Quantum Information Science Research Centers U.S. Department of Energy, Office of Science, Office of Basic Energy Sciences, Division of Chemical Sciences, Geosciences, and Biosciences
Author contribution
J.Z. conceived the experiments and performed the data analysis. J.Z. and G.D.G. carried out the optical measurements. I. M. carried out the growth of the sample with assistance from G.D.G. M.T.S. and A.M.D. helped carry out the fridge and optical echo measurements. J.K.B., J.N., and O.G.P. helped carry out the pulsed EPR measurements. All authors contributed to the manuscript.
Competing interests:
All authors declare they have no competing interests.
Data and materials availability
All data are available in the main text or the supplementary materials.
References
- Awschalom et al. [2018] David D Awschalom, Ronald Hanson, Jörg Wrachtrup, and Brian B Zhou. Quantum technologies with optically interfaced solid-state spins. Nature Photonics, 12(9):516–527, 2018. ISSN 1749-4893. doi: 10.1038/s41566-018-0232-2. URL https://doi.org/10.1038/s41566-018-0232-2.
- Lvovsky et al. [2009] Alexander I Lvovsky, Barry C Sanders, and Wolfgang Tittel. Optical quantum memory. Nature Photonics, 3(12):706–714, 2009. ISSN 1749-4893. doi: 10.1038/nphoton.2009.231. URL https://doi.org/10.1038/nphoton.2009.231.
- Heshami et al. [2016] Khabat Heshami, Duncan G. England, Peter C. Humphreys, Philip J. Bustard, Victor M. Acosta, Joshua Nunn, and Benjamin J. Sussman. Quantum memories: emerging applications and recent advances. Journal of Modern Optics, 63(20):2005–2028, 2016. doi: 10.1080/09500340.2016.1148212. URL https://doi.org/10.1080/09500340.2016.1148212.
- Sangouard et al. [2011] Nicolas Sangouard, Christoph Simon, Hugues de Riedmatten, and Nicolas Gisin. Quantum repeaters based on atomic ensembles and linear optics. Rev. Mod. Phys., 83:33–80, Mar 2011. doi: 10.1103/RevModPhys.83.33. URL https://link.aps.org/doi/10.1103/RevModPhys.83.33.
- Wolfowicz et al. [2021] Gary Wolfowicz, F Joseph Heremans, Christopher P Anderson, Shun Kanai, Hosung Seo, Adam Gali, Giulia Galli, and David D Awschalom. Quantum guidelines for solid-state spin defects. Nature Reviews Materials, 6(10):906–925, 2021. ISSN 2058-8437. doi: 10.1038/s41578-021-00306-y. URL https://doi.org/10.1038/s41578-021-00306-y.
- Kinos et al. [2021] Adam Kinos, David Hunger, Roman Kolesov, Klaus Mølmer, Hugues de Riedmatten, Philippe Goldner, Alexandre Tallaire, Loic Morvan, Perrine Berger, Sacha Welinski, Khaled Karrai, Lars Rippe, Stefan Kröll, and Andreas Walther. Roadmap for rare-earth quantum computing, 2021.
- Ourari et al. [2023] Salim Ourari, Łukasz Dusanowski, Sebastian P Horvath, Mehmet T Uysal, Christopher M Phenicie, Paul Stevenson, Mouktik Raha, Songtao Chen, Robert J Cava, Nathalie P de Leon, and Jeff D Thompson. Indistinguishable telecom band photons from a single Er ion in the solid state. Nature, 620(7976):977–981, 2023. ISSN 1476-4687. doi: 10.1038/s41586-023-06281-4. URL https://doi.org/10.1038/s41586-023-06281-4.
- Duan et al. [2001] L.-M. Duan, M D Lukin, J I Cirac, and P Zoller. Long-distance quantum communication with atomic ensembles and linear optics. Nature, 414(6862):413–418, 2001. ISSN 1476-4687. doi: 10.1038/35106500. URL https://doi.org/10.1038/35106500.
- Craiciu et al. [2019] Ioana Craiciu, Mi Lei, Jake Rochman, Jonathan M Kindem, John G Bartholomew, Evan Miyazono, Tian Zhong, Neil Sinclair, and Andrei Faraon. Nanophotonic Quantum Storage at Telecommunication Wavelength. Physical Review Applied, 10(1):1, 2019. ISSN 2331-7019. doi: 10.1103/PhysRevApplied.12.024062. URL https://doi.org/10.1103/PhysRevApplied.12.024062.
- Dutta et al. [2023] Subhojit Dutta, Yuqi Zhao, Uday Saha, Demitry Farfurnik, Elizabeth A Goldschmidt, and Edo Waks. An Atomic Frequency Comb Memory in Rare-Earth-Doped Thin-Film Lithium Niobate. ACS Photonics, 10(4):1104–1109, apr 2023. doi: 10.1021/acsphotonics.2c01835. URL https://doi.org/10.1021/acsphotonics.2c01835.
- Lago-Rivera et al. [2021] Dario Lago-Rivera, Samuele Grandi, Jelena V Rakonjac, Alessandro Seri, and Hugues de Riedmatten. Telecom-heralded entanglement between multimode solid-state quantum memories. Nature, 594(7861):37–40, 2021. ISSN 1476-4687. doi: 10.1038/s41586-021-03481-8. URL https://doi.org/10.1038/s41586-021-03481-8.
- Bartholomew et al. [2020] John G Bartholomew, Jake Rochman, Tian Xie, Jonathan M Kindem, Andrei Ruskuc, Ioana Craiciu, Mi Lei, and Andrei Faraon. On-chip coherent microwave-to-optical transduction mediated by ytterbium in YVO4. Nature Communications, 11(1):3266, 2020. ISSN 2041-1723. doi: 10.1038/s41467-020-16996-x. URL https://doi.org/10.1038/s41467-020-16996-x.
- O’Brien et al. [2014] Christopher O’Brien, Nikolai Lauk, Susanne Blum, Giovanna Morigi, and Michael Fleischhauer. Interfacing superconducting qubits and telecom photons via a rare-earth-doped crystal. Phys. Rev. Lett., 113:063603, Aug 2014. doi: 10.1103/PhysRevLett.113.063603. URL https://link.aps.org/doi/10.1103/PhysRevLett.113.063603.
- Lauritzen et al. [2010] Björn Lauritzen, Ji ří Minář, Hugues de Riedmatten, Mikael Afzelius, Nicolas Sangouard, Christoph Simon, and Nicolas Gisin. Telecommunication-wavelength solid-state memory at the single photon level. Phys. Rev. Lett., 104:080502, Feb 2010. doi: 10.1103/PhysRevLett.104.080502. URL https://link.aps.org/doi/10.1103/PhysRevLett.104.080502.
- Dajczgewand et al. [2014] Julián Dajczgewand, Jean-Louis Le Gouët, Anne Louchet-Chauvet, and Thierry Chanelière. Large efficiency at telecom wavelength for optical quantum memories. Opt. Lett., 39(9):2711–2714, May 2014. doi: 10.1364/OL.39.002711. URL https://opg.optica.org/ol/abstract.cfm?URI=ol-39-9-2711.
- Huo et al. [2018] Meiru Huo, Jiliang Qin, Jialin Cheng, Zhihui Yan, Zhongzhong Qin, Xiaolong Su, Xiaojun Jia, Changde Xie, and Kunchi Peng. Deterministic quantum teleportation through fiber channels. Science Advances, 4(10):eaas9401, 2018. doi: 10.1126/sciadv.aas9401. URL https://www.science.org/doi/abs/10.1126/sciadv.aas9401.
- Razavi et al. [2009] M. Razavi, M. Piani, and N. Lütkenhaus. Quantum repeaters with imperfect memories: Cost and scalability. Phys. Rev. A, 80:032301, Sep 2009. doi: 10.1103/PhysRevA.80.032301. URL https://link.aps.org/doi/10.1103/PhysRevA.80.032301.
- Rančić et al. [2018] Miloš Rančić, Morgan P Hedges, Rose L Ahlefeldt, and Matthew J Sellars. Coherence time of over a second in a telecom-compatible quantum memory storage material. Nature Physics, 14(1):50–54, 2018. ISSN 1745-2481. doi: 10.1038/nphys4254. URL https://doi.org/10.1038/nphys4254.
- Probst et al. [2015] S. Probst, H. Rotzinger, A. V. Ustinov, and P. A. Bushev. Microwave multimode memory with an erbium spin ensemble. Phys. Rev. B, 92:014421, Jul 2015. doi: 10.1103/PhysRevB.92.014421. URL https://link.aps.org/doi/10.1103/PhysRevB.92.014421.
- Chirolli and Burkard [2008] Luca Chirolli and Guido Burkard. Decoherence in solid-state qubits. Advances in Physics, 57(3):225–285, may 2008. doi: 10.1080/00018730802218067. URL https://doi.org/10.1080%2F00018730802218067.
- Anderson et al. [2022] Christopher P. Anderson, Elena O. Glen, Cyrus Zeledon, Alexandre Bourassa, Yu Jin, Yizhi Zhu, Christian Vorwerk, Alexander L. Crook, Hiroshi Abe, Jawad Ul-Hassan, Takeshi Ohshima, Nguyen T. Son, Giulia Galli, and David D. Awschalom. Five-second coherence of a single spin with single-shot readout in silicon carbide. Science Advances, 8(5):eabm5912, 2022. doi: 10.1126/sciadv.abm5912. URL https://www.science.org/doi/abs/10.1126/sciadv.abm5912.
- Bourassa et al. [2020] Alexandre Bourassa, Christopher P Anderson, Kevin C Miao, Mykyta Onizhuk, He Ma, Alexander L Crook, Hiroshi Abe, Jawad Ul-Hassan, Takeshi Ohshima, Nguyen T Son, Giulia Galli, and David D Awschalom. Entanglement and control of single nuclear spins in isotopically engineered silicon carbide. Nature Materials, 19(12):1319–1325, 2020. ISSN 1476-4660. doi: 10.1038/s41563-020-00802-6. URL https://doi.org/10.1038/s41563-020-00802-6.
- Balasubramanian et al. [2009] Gopalakrishnan Balasubramanian, Philipp Neumann, Daniel Twitchen, Matthew Markham, Roman Kolesov, Norikazu Mizuochi, Junichi Isoya, Jocelyn Achard, Johannes Beck, Julia Tissler, Vincent Jacques, Philip R Hemmer, Fedor Jelezko, and Jörg Wrachtrup. Ultralong spin coherence time in isotopically engineered diamond. Nature Materials, 8(5):383–387, 2009. ISSN 1476-4660. doi: 10.1038/nmat2420. URL https://doi.org/10.1038/nmat2420.
- Tawara et al. [2017] Takehiko Tawara, Giacomo Mariani, Kaoru Shimizu, Hiroo Omi, Satoru Adachi, and Hideki Gotoh. Effect of isotopic purification on spectral-hole narrowing in 167er3+ hyperfine transitions. Applied Physics Express, 10(4):042801, mar 2017. doi: 10.7567/APEX.10.042801. URL https://dx.doi.org/10.7567/APEX.10.042801.
- Kanai et al. [2022] Shun Kanai, F. Joseph Heremans, Hosung Seo, Gary Wolfowicz, Christopher P. Anderson, Sean E. Sullivan, Mykyta Onizhuk, Giulia Galli, David D. Awschalom, and Hideo Ohno. Generalized scaling of spin qubit coherence in over 12,000 host materials. Proceedings of the National Academy of Sciences, 119(15):e2121808119, 2022. doi: 10.1073/pnas.2121808119. URL https://www.pnas.org/doi/abs/10.1073/pnas.2121808119.
- Dantec et al. [2021] Marianne Le Dantec, Miloš Rančić, Sen Lin, Eric Billaud, Vishal Ranjan, Daniel Flanigan, Sylvain Bertaina, Thierry Chanelière, Philippe Goldner, Andreas Erb, Ren Bao Liu, Daniel Estève, Denis Vion, Emmanuel Flurin, and Patrice Bertet. Twenty-three–millisecond electron spin coherence of erbium ions in a natural-abundance crystal. Science Advances, 7(51):eabj9786, 2021. doi: 10.1126/sciadv.abj9786. URL https://www.science.org/doi/abs/10.1126/sciadv.abj9786.
- Grant et al. [2023] Gregory G. Grant, Jiefei Zhang, Ignas Masiulionis, Swarnabha Chattaraj, Kathryn E. Sautter, Sean E. Sullivan, Rishi Chebrolu, Yuzi Liu, Jessica B. Martins, Jens Niklas, Sumit Dibos, Alan M. Kewalramani, John W. Freeland, Jianguo Wen, Oleg G. Poluektov, F. Joseph Heremans, David D. Awschalom, and Supratik Guha. Optical and microstructural characterization of er3+ doped epitaxial cerium oxide on silicon. Submitted, 2023.
- Raha et al. [2020] Mouktik Raha, Songtao Chen, Christopher M Phenicie, Salim Ourari, Alan M Dibos, and Jeff D Thompson. Optical quantum nondemolition measurement of a single rare earth ion qubit. Nature Communications, 11(1):1605, 2020. ISSN 2041-1723. doi: 10.1038/s41467-020-15138-7. URL https://doi.org/10.1038/s41467-020-15138-7.
- Welinski et al. [2019] Sacha Welinski, Philip J. T. Woodburn, Nikolai Lauk, Rufus L. Cone, Christoph Simon, Philippe Goldner, and Charles W. Thiel. Electron spin coherence in optically excited states of rare-earth ions for microwave to optical quantum transducers. Phys. Rev. Lett., 122:247401, Jun 2019. doi: 10.1103/PhysRevLett.122.247401. URL https://link.aps.org/doi/10.1103/PhysRevLett.122.247401.
- Xie et al. [2021] Tian Xie, Jake Rochman, John G. Bartholomew, Andrei Ruskuc, Jonathan M. Kindem, Ioana Craiciu, Charles W. Thiel, Rufus L. Cone, and Andrei Faraon. Characterization of for microwave to optical transduction. Phys. Rev. B, 104:054111, Aug 2021. doi: 10.1103/PhysRevB.104.054111. URL https://link.aps.org/doi/10.1103/PhysRevB.104.054111.
- Ammerlaan and de Maat-Gersdorf [2001] C A J Ammerlaan and I de Maat-Gersdorf. Zeeman splitting factor of the Er3+ ion in a crystal field. Applied Magnetic Resonance, 21(1):13–33, 2001. ISSN 1613-7507. doi: 10.1007/BF03162436. URL https://doi.org/10.1007/BF03162436.
- Liu and Jacquier [2005] Guokui Liu and Bernard Jacquier. Spectroscopic Properties of Rare Earths in Optical Materials. Springer Berlin, Heidelberg, 2005. ISBN 3540238867.
- Singh et al. [2020] Manish Kumar Singh, Abhinav Prakash, Gary Wolfowicz, Jianguo Wen, Yizhong Huang, Tijana Rajh, David D Awschalom, Tian Zhong, and Supratik Guha. Epitaxial Er-doped Y2O3 on silicon for quantum coherent devices. APL Materials, 8(3):31111, mar 2020. ISSN 2166-532X. doi: 10.1063/1.5142611. URL https://doi.org/10.1063/1.5142611.
- Dibos et al. [2022] Alan M. Dibos, Michael T. Solomon, Sean E. Sullivan, Manish K. Singh, Kathryn E. Sautter, Connor P. Horn, Gregory D. Grant, Yulin Lin, Jianguo Wen, F. Joseph Heremans, Supratik Guha, and David D. Awschalom. Purcell enhancement of erbium ions in tio2 on silicon nanocavities. Nano Letters, 22(16):6530–6536, 2022. doi: 10.1021/acs.nanolett.2c01561. URL https://doi.org/10.1021/acs.nanolett.2c01561. PMID: 35939762.
- Sun et al. [2002] Y Sun, C.W Thiel, R.L Cone, R.W Equall, and R.L Hutcheson. Recent progress in developing new rare earth materials for hole burning and coherent transient applications. Journal of Luminescence, 98(1):281–287, 2002. ISSN 0022-2313. doi: https://doi.org/10.1016/S0022-2313(02)00281-8. URL https://www.sciencedirect.com/science/article/pii/S0022231302002818. Proceedings of the Seventh International Meeting on Hole Burning, Single Molecules and Related Spectroscopies: Science and Applications.
- Stevenson et al. [2022] Paul Stevenson, Christopher M. Phenicie, Isaiah Gray, Sebastian P. Horvath, Sacha Welinski, Austin M. Ferrenti, Alban Ferrier, Philippe Goldner, Sujit Das, Ramamoorthy Ramesh, Robert J. Cava, Nathalie P. de Leon, and Jeff D. Thompson. Erbium-implanted materials for quantum communication applications. Phys. Rev. B, 105:224106, Jun 2022. doi: 10.1103/PhysRevB.105.224106. URL https://link.aps.org/doi/10.1103/PhysRevB.105.224106.
- Abella et al. [1966] I. D. Abella, N. A. Kurnit, and S. R. Hartmann. Photon echoes. Phys. Rev., 141:391–406, Jan 1966. doi: 10.1103/PhysRev.141.391. URL https://link.aps.org/doi/10.1103/PhysRev.141.391.
- P. w. Anderson and c. M. Varma [1972] B. I. Halperin P. w. Anderson and c. M. Varma. Anomalous low-temperature thermal properties of glasses and spin glasses. The Philosophical Magazine: A Journal of Theoretical Experimental and Applied Physics, 25(1):1–9, 1972. doi: 10.1080/14786437208229210. URL https://doi.org/10.1080/14786437208229210.
- Huber et al. [1984] D. L. Huber, M. M. Broer, and B. Golding. Low-temperature optical dephasing of rare-earth ions in glass. Phys. Rev. Lett., 52:2281–2284, Jun 1984. doi: 10.1103/PhysRevLett.52.2281. URL https://link.aps.org/doi/10.1103/PhysRevLett.52.2281.
- Flinn et al. [1994] G. P. Flinn, K. W. Jang, Joseph Ganem, M. L. Jones, R. S. Meltzer, and R. M. Macfarlane. Sample-dependent optical dephasing in bulk crystalline samples of :. Phys. Rev. B, 49:5821–5827, Mar 1994. doi: 10.1103/PhysRevB.49.5821. URL https://link.aps.org/doi/10.1103/PhysRevB.49.5821.
- Könz et al. [2003] Flurin Könz, Y. Sun, C. W. Thiel, R. L. Cone, R. W. Equall, R. L. Hutcheson, and R. M. Macfarlane. Temperature and concentration dependence of optical dephasing, spectral-hole lifetime, and anisotropic absorption in . Phys. Rev. B, 68:085109, Aug 2003. doi: 10.1103/PhysRevB.68.085109. URL https://link.aps.org/doi/10.1103/PhysRevB.68.085109.
- Sun et al. [2012] Y. Sun, C. W. Thiel, and R. L. Cone. Optical decoherence and energy level structure of 0.1%:. Phys. Rev. B, 85:165106, Apr 2012. doi: 10.1103/PhysRevB.85.165106. URL https://link.aps.org/doi/10.1103/PhysRevB.85.165106.
- Serrano et al. [2022] Diana Serrano, Senthil Kumar Kuppusamy, Benoît Heinrich, Olaf Fuhr, David Hunger, Mario Ruben, and Philippe Goldner. Ultra-narrow optical linewidths in rare-earth molecular crystals. Nature, 603(7900):241–246, 2022. ISSN 1476-4687. doi: 10.1038/s41586-021-04316-2. URL https://doi.org/10.1038/s41586-021-04316-2.
- Fukumori et al. [2020] Rikuto Fukumori, Yizhong Huang, Jun Yang, Haitao Zhang, and Tian Zhong. Subkilohertz optical homogeneous linewidth and dephasing mechanisms in : ceramics. Phys. Rev. B, 101:214202, Jun 2020. doi: 10.1103/PhysRevB.101.214202. URL https://link.aps.org/doi/10.1103/PhysRevB.101.214202.
- Dibos et al. [2018] A. M. Dibos, M. Raha, C. M. Phenicie, and J. D. Thompson. Atomic source of single photons in the telecom band. Phys. Rev. Lett., 120:243601, Jun 2018. doi: 10.1103/PhysRevLett.120.243601. URL https://link.aps.org/doi/10.1103/PhysRevLett.120.243601.
- Zhong et al. [2018] Tian Zhong, Jonathan M. Kindem, John G. Bartholomew, Jake Rochman, Ioana Craiciu, Varun Verma, Sae Woo Nam, Francesco Marsili, Matthew D. Shaw, Andrew D. Beyer, and Andrei Faraon. Optically addressing single rare-earth ions in a nanophotonic cavity. Phys. Rev. Lett., 121:183603, Oct 2018. doi: 10.1103/PhysRevLett.121.183603. URL https://link.aps.org/doi/10.1103/PhysRevLett.121.183603.
- Rakhmatullin et al. [2014] R. M. Rakhmatullin, I. N. Kurkin, V. V. Pavlov, and V. V. Semashko. Epr, optical, and dielectric spectroscopy of er-doped cerium dioxide nanoparticles. physica status solidi (b), 251(8):1545–1551, 2014. doi: https://doi.org/10.1002/pssb.201451116. URL https://onlinelibrary.wiley.com/doi/abs/10.1002/pssb.201451116.
- Salikhov et al. [1981] K.M Salikhov, S.A Dzuba, and A.M Raitsimring. The theory of electron spin-echo signal decay resulting from dipole-dipole interactions between paramagnetic centers in solids. Journal of Magnetic Resonance (1969), 42(2):255–276, 1981. ISSN 0022-2364. doi: https://doi.org/10.1016/0022-2364(81)90216-X. URL https://www.sciencedirect.com/science/article/pii/002223648190216X.
- Eichhorn et al. [2019] Tim R. Eichhorn, Claire A. McLellan, and Ania C. Bleszynski Jayich. Optimizing the formation of depth-confined nitrogen vacancy center spin ensembles in diamond for quantum sensing. Phys. Rev. Mater., 3:113802, Nov 2019. doi: 10.1103/PhysRevMaterials.3.113802. URL https://link.aps.org/doi/10.1103/PhysRevMaterials.3.113802.
- Car et al. [2019] B. Car, L. Veissier, A. Louchet-Chauvet, J.-L. Le Gouët, and T. Chanelière. Optical study of the anisotropic erbium spin flip-flop dynamics. Phys. Rev. B, 100:165107, Oct 2019. doi: 10.1103/PhysRevB.100.165107. URL https://link.aps.org/doi/10.1103/PhysRevB.100.165107.
- Hastings-Simon et al. [2008] S. R. Hastings-Simon, B. Lauritzen, M. U. Staudt, J. L. M. van Mechelen, C. Simon, H. de Riedmatten, M. Afzelius, and N. Gisin. Zeeman-level lifetimes in . Phys. Rev. B, 78:085410, Aug 2008. doi: 10.1103/PhysRevB.78.085410. URL https://link.aps.org/doi/10.1103/PhysRevB.78.085410.
- Abragam and Bleaney [1986] A Abragam and B Bleaney. Electron paramagnetic resonance of transition ions. Oxford, 1986.
- Lutz et al. [2016] Thomas Lutz, Lucile Veissier, Charles W. Thiel, Rufus L. Cone, Paul E. Barclay, and Wolfgang Tittel. Modification of phonon processes in nanostructured rare-earth-ion-doped crystals. Phys. Rev. A, 94:013801, Jul 2016. doi: 10.1103/PhysRevA.94.013801. URL https://link.aps.org/doi/10.1103/PhysRevA.94.013801.
- Kindem et al. [2020] Jonathan M Kindem, Andrei Ruskuc, John G Bartholomew, Jake Rochman, Yan Qi Huan, and Andrei Faraon. Control and single-shot readout of an ion embedded in a nanophotonic cavity. Nature, 580(7802):201–204, 2020. ISSN 1476-4687. doi: 10.1038/s41586-020-2160-9. URL https://doi.org/10.1038/s41586-020-2160-9.
- Jiang et al. [2009] L. Jiang, J. S. Hodges, J. R. Maze, P. Maurer, J. M. Taylor, D. G. Cory, P. R. Hemmer, R. L. Walsworth, A. Yacoby, A. S. Zibrov, and M. D. Lukin. Repetitive readout of a single electronic spin via quantum logic with nuclear spin ancillae. Science, 326(5950):267–272, 2009. doi: 10.1126/science.1176496. URL https://www.science.org/doi/abs/10.1126/science.1176496.
- Lee et al. [2013] Sang-Yun Lee, Matthias Widmann, Torsten Rendler, Marcus W Doherty, Thomas M Babinec, Sen Yang, Moritz Eyer, Petr Siyushev, Birgit J M Hausmann, Marko Loncar, Zoltán Bodrog, Adam Gali, Neil B Manson, Helmut Fedder, and Jörg Wrachtrup. Readout and control of a single nuclear spin with a metastable electron spin ancilla. Nature Nanotechnology, 8(7):487–492, 2013. ISSN 1748-3395. doi: 10.1038/nnano.2013.104. URL https://doi.org/10.1038/nnano.2013.104.
- Nishikawa et al. [2002] Yukie Nishikawa, Noburu Fukushima, Naoki Yasuda, Kohei Nakayama, and Sumio Ikegawa. Electrical properties of single crystalline ceo2 high-k gate dielectrics directly grown on si (111). Japanese Journal of Applied Physics, 41(4S):2480, apr 2002. doi: 10.1143/JJAP.41.2480. URL https://dx.doi.org/10.1143/JJAP.41.2480.