Variations of the HCO+, HCN, HNC, N2H+ and NH3 deuterium fractionation in high-mass star-forming regions
Abstract
We use spectra and maps of the and DCO+, DCN, DNC, lines and ortho- and para-NH2D lines, obtained with the IRAM-30m telescope, as well as observations of their hydrogenated isotopologues to study deuteration processes in five high-mass star-forming regions. The temperature was estimated from CH3CCH lines, also observed with the IRAM-30m telescope, and from NH3 lines, observed with the 100-m radio telescope in Effelsberg, as well as using the integrated intensity ratios of the H13CN and HN13C lines and their main isotopologues. Applying a non-LTE radiative transfer model with RADEX, the gas density and the molecular column densities were estimated. D/H ratios are 0.001–0.05 for DCO+, 0.001–0.02 for DCN, 0.001–0.05 for DNC and 0.02–0.4 for NH2D. The D/H ratios decrease with increasing temperature in the range of 20–40 K and slightly vary at densities cm-3. The deuterium fraction of is 0.008–0.1 at temperatures in the range of 20–25 K and at a density of cm-3. We also estimate relative abundances and find for DCO+ and DNC, for and for NH2D. The relative abundances of these species decrease with increasing temperature. However, the DCN/H2 ratio is almost constant (). The observational results agree with the predictions of chemical models (although in some cases there are significant differences).
keywords:
ISM: abundances – ISM: molecules – Stars: formation – Stars: massive – astrochemistry1 Introduction
Our knowledge of high-mass star formation (HMSF) and early evolution of massive stars is still far from being satisfactory. The HMSF regions are rare and are located at large distances, hence understanding the involved physical and chemical processes is important (e.g., Tan et al., 2014). One of the questions is related to deuterium fractionation in these regions.
The deuterium fraction is a ratio of abundances of a deuterated molecule and its hydrogenated counterpart. The observed abundance of deuterated molecules in star-forming regions is higher than the initial D/H ratio (Oliveira et al., 2003). The abundance of deuterium in interstellar molecules increases because the forward reaction (deuteration) occurs without a thermal barrier, while the reverse reaction (removal of D) has an energy barrier (e.g., Turner, 2001):
| (1) | |||||
| (2) | |||||
| (3) |
Reaction (1) is efficient at temperatures of 10–30 K, while reactions (2), (3) are efficient at temperatures up to 80 K. At densities above 105 cm-3and temperatures below 10 K, the freezing out of gaseous species onto grain surfaces, such as CO, also causes deuteration enhancement due to the depletion of reactions between CO and the ions in (1), (2) and (3) (e.g., Caselli et al., 1999).
There are chemical models that describe the formation of deuterated molecules (Turner, 2001; Roueff et al., 2007; Albertsson et al., 2013; Sipilä et al., 2015, 2019). , DCO+, DNC and NH2D are mainly formed via the low temperature pathway (1), while DCN can be formed at high temperatures via the reactions (2) and (3). The reaction (1) with H at temperatures around 30 K begins to proceed in the reverse direction, and the deuterium fraction decreases with increasing temperature.
This effect of deuterium fractionation is observed in low-mass as well as in high-mass star-forming regions. The varies with temperature and can be used as an evolutionary indicator. For instance, Crapsi et al. (2005) have carried out a survey of and towards 31 low-mass starless cores using the IRAM-30m telescope. They recognized that high deuterium fractionation of characterise the most evolved, or "prestellar", starless cores. For massive star-forming regions, Fontani et al. (2011) observed rotational transitions of and and derived the deuterium fraction in 27 cores, with the IRAM-30m telescope. They concluded that the -to- column density ratio can be used as an evolutionary indicator. Moreover, for the same regions in Fontani et al. (2014, 2015) they have estimated NH2D/NH3 and DNC/HNC. (NH3) is on average above 0.1 and does not change significantly with evolutionary phase. For DNC/HNC, they have found no statistically significant differences among the three evolutionary groups of objects such as high-mass starless cores (HMSCs), high-mass protostellar objects (HMPOs) and ultracompact HII regions (UCHIIs). Additionally, Sakai et al. (2012) found that the DNC/HNC ratio does not depend only on the current kinetic temperature towards 18 massive clumps (IRDCs and HMPOs), by using the Nobeyama Radio Observatory 45 m telescope. With a chemical model, they suggested that the DNC/HNC ratio also depends on history in their starless-core phase, such as its duration time.
Gerner et al. (2015) observed a sample of 59 high-mass star-forming regions with different evolutionary phases: starting with IRDCs via HMPOs to hot molecular cores (HMCs) and finally UCHIIs regions. They found that the D/H ratios of DNC, DCO+, and show decreasing trends with evolutionary stages, despite high standard deviations of ratios within individual stages. However, DCN/HCN shows maxima in the HMC phase. Also was only detected in a few IRDCs and HMPOs. Trofimova et al. (2020) have undertaken a survey of 60 massive star forming regions in DCN, DNC, DCO+, , by using the 20-m Onsala radio telescope. The was detected only in two sources, other deuterated molecules were detected in about 1/3 of the sources. They have found that the abundances relative to H2 of DCN and DNC and the DCN/HCN ratio are almost constant at temperatures of 15–55 K, while DCO+/H2 decreases with increasing temperature. Using the Mopra-22m and the IRAM-30m telescopes, Wienen et al. (2021) observed NH2D at 86 and 110 GHz towards over 900 high-mass clumps discovered by the APEX Telescope Large Area Survey of the Galaxy (ATLASGAL). They did not find a correlation between the NH3 deuteration and evolutionary relevant physical tracers such as rotational temperature.
There are few mapping surveys to study the deuterium fractionation. For instance, using the IRAM-30m telescope, Feng et al. (2019) have imaged two high-mass protostellar clumps that show different evolutionary stages in IRDC G28.34+0.06. They have found that the deuteration of is more efficient than that of HCO+, HCN, and HNC. The deuterations are favoured towards the chemically younger clump with its colder and denser environment. The NH2D abundance is almost independent of environmental differences. Pillai et al. (2012) obtained maps of the ortho-(110–111) and (4–3) lines with the James Clerk Maxwell Telescope (JCMT), and (3–2) and dust continuum with the Submillimeter Array (SMA) in the DR21 filament of Cygnus X. The H2D+ emission is widely associated with dust emission and , however the H2D+ peaks are offset from the dust and (3–2) peaks. Tan et al. (2013) obtained maps of (3–2) and DCO+(3–2) emissions from four IRDCs using ALMA. In addition, Coutens et al. (2014) detected the HDO and HO transitions with the Herschel/HIFI instrument, the IRAM 30-m telescope, and the CSO towards the HMSF region G34.26+0.15. The radial variation of the deuterium fraction was determined using a 1D non-LTE radiative transfer code. The HDO/H2O ratio is estimated to be in the hot core (200 K) and in the colder envelope (100 K). In a recent study, Redaelli et al. (2021) performed ALMA mapping observations of the continuum emission at 0.8 mm and of the ortho-(110–111) towards the two infrared-dark massive clumps. They found that ortho- is an ideal tracer of cold ( K) and dense ( cm-3) gas.
In this work, we study the physical and chemical conditions of high-mass star-forming regions, using observations with the IRAM-30m radio telescope and the 100-m radio telescope in Effelsberg. We investigate the spatial distribution of abundances, temperature and density. We also wish to compare observational results with model predictions. We use the integrated intensity ratios of the HCN and HNC lines and their bearing isotopologues as temperature indicator. Assuming optically thin molecular emission we estimate the gas density and the molecular column densities using a non-LTE radiative transfer model applying the RADEX code. We derive and discuss abundances of the deuterated molecules DCO+, DCN, DNC, and NH2D as functions of gas properties such as temperature and density. We also discuss the spatial distribution of molecules. To obtain abundances, we derive H2 column densities from SCUBA dust emission. Previous works were mainly based on single-dish pointing surveys, while our study is one of the first including maps to study the deuterium fractionation in HMSF regions.
2 Observations and data reduction
2.1 Observations at the 30-m radio telescope of the Institut de Radioastronomie Millimétrique (IRAM)
In September 2019, with the 30-m radio telescope of the Institut de Radioastronomie Millimétrique (IRAM), we observed five massive star forming regions at wavelengths of 2 and 3–4 mm (in the framework of the project 041-19). The sources are selected from the sample of a previous survey conducted at Onsala (Trofimova et al., 2020), possessing a relatively strong emission in the lines of deuterated molecules and having different gas temperatures. The list of sources is given in Table 1. The source position list is mainly based on a galactic H2O maser catalogue (Palagi et al., 1993; Valdettaro et al., 2001; Ladeyschikov et al., 2019). The L1287 source position is associated with the IRAS 00338+6312. For S187 the central position corresponds to the submillimetre dust emission peak and the N2H+ peak (Zinchenko et al., 2009) associated with the massive pre-main-sequence star S187H (Zavagno et al., 1994). Table 2 contains the list of the observed molecular lines with some spectroscopic parameters. Only one source, DR21(OH), was observed at 110 GHz in the para-NH2D line due to limited observing time. Transition frequencies and upper level energies are taken from The Cologne Database for Molecular Spectroscopy (CDMS)111http://cdms.de (Müller et al., 2005).
| Source | RA(J2000) | Dec(J2000) | Note | ||
| (km s-1) | (kpc) | ||||
| L1287 | 00:36:47.5 | 63:29:02.1 | -17.7 | 0.9a | G121.30+0.66, IRAS 00338+6312 |
| S187 | 01:23:15.4 | 61:49:43.1 | -14.0 | 1.4b | G126.68–0.81, IRAS 01202+6133 |
| S231 | 05:39:12.9 | 35:45:54.0 | -16.6 | 1.6c | G173.48+2.45, IRAS 05358+3543 |
| DR21(OH) | 20:39:00.6 | 42:22:48.9 | -3.8 | 1.5d | G81.72+0.57 |
| NGC7538 | 23:13:44.7 | 61:28:09.7 | -57.6 | 2.7e | G111.54+0.78, IRAS 23116+6111 |
| Distances to sources are quoted from aRygl et al. (2010), bRusseil et al. (2007), cBurns et al. (2015), dRygl et al. (2012), | |||||
| eMoscadelli et al. (2009) | |||||
| Molecule | Transition | Rest frequency | |
|---|---|---|---|
| (MHz) | (K) | ||
| NH3 | 23694.495 | 23.4 | |
| 23722.634 | 64.9 | ||
| 23870.128 | 123.5 | ||
| DCO+ | 72039.354 | 3.5 | |
| 144077.319 | 10.4 | ||
| DCN | 72414.694 | 3.5 | |
| 144828.002 | 10.4 | ||
| DNC | 76305.699 | 3.7 | |
| 152609.744 | 10.9 | ||
| 77109.243 | 3.7 | ||
| 154217.011 | 11.1 | ||
| CH3CCH | 85442.601 | 77.3 | |
| 85450.766 | 41.2 | ||
| 85455.667 | 19.5 | ||
| 85457.300 | 12.3 | ||
| NH2D ortho | 85926.278 | 20.7 | |
| para | 110153.594 | 21.3 | |
| H13CN | 86339.921 | 4.1 | |
| H13CO+ | 86754.288 | 4.2 | |
| HN13C | 87090.825 | 4.2 | |
| HCN | 88631.602 | 4.3 | |
| HCO+ | 89188.525 | 4.3 | |
| HNC | 90663.568 | 4.4 | |
| CH3CCH | 153790.772 | 101.9 | |
| 153805.461 | 65.8 | ||
| 153814.276 | 44.1 | ||
| 153817.215 | 36.9 |
The full beam width at half maximum at the observed frequencies ranged from to . Antenna temperatures were converted to the main beam brightness temperature , using the main beam efficiency , which was determined by the Ruze’s formula in accordance with the IRAM recommendations222https://publicwiki.iram.es/Iram30mEfficiencies and ranged from 0.72 to 0.82. The minimum system noise temperatures were K in the 3 mm range and K in the 2 mm range.
Observations were carried out in the on-the-fly (OTF) mode over a mapping area of a in total power mode. The reference position was chosen with a shift of in right ascension. In some extended sources, i.e. DR21(OH) and NGC7538, two partially overlapping areas were observed. The pointing accuracy was checked periodically by observations of nearby continuum sources.
2.2 Observations at the Max-Planck-Institut für Radiostronomie with the Effelsberg 100-m radio telescope
On 9 December 2019 we observed with the 100-m telescope near Effelsberg (Germany) the H2O maser transition at a frequency of 22 GHz, as well as the ammonia inversion lines (1,1), (2,2) and (3,3). The full beam width at half maximum was . The measurements were carried out by the method of continuous mapping using a -band receiver in a secondary focus with a dual bandwidth of 300 MHz, including the H2O lines in one band and NH3 in the other band. maps were obtained at a scanning rate of 20 per second in right ascension; intervals between scans were 15. The reference position was shifted by +15 in azimuth. Weather conditions included light rain with low wind speeds (2 m s-1).
The results are presented in the main beam temperature scale . The source NGC7027 was used for calibration with a flux density of 4.7 Jy at 22 GHz, taking into account the annual change since 1990 (Ott et al., 1994).
2.3 Archival data
Ammonia emission from L1287 was taken from observations with the Effelsberg-100m telescope in 1995 (Zinchenko et al., 1997). We used ammonia observations towards the interstellar filament WB 673 with the Effelsberg-100m telescope in 2019 from Ryabukhina et al. (2022). Also we used data from the KEYSTONE survey with the 100 m Green Bank Telescope mapping ammonia emission across giant molecular clouds (Cygnus X North, NGC7538) from Keown et al. (2019). The column densities were adopted from observations with the 20-m OSO telescope and the 15-m SEST telescope (Pirogov et al., 2003). The continuum data are obtained with the James Clerk Maxwell telescope (JCMT)-SCUBA at 850 (Di Francesco et al., 2008) as the dust distribution indicator.
2.4 Data reduction
The GILDAS/CLASS software333http://www.iram.fr/IRAMFR/GILDAS was used for data reduction. All datasets were smoothed to the same spatial resolution of 40. The spectra were fitted with Gaussian profiles using the LMFIT package (Newville et al., 2014). In the analysis, integrated intensity was obtained from the Gaussian profile area with their errors as the fit errors. For the spectra with hyperfine structure we assume that the widths of all components are equal, and the spacings between them are known. This allows us to determine the optical depth of the main group of hyperfine components, . Assuming that the ratios of hyperfine components correspond to LTE conditions, the optical depth of the main line can be determined from the ratio of the observed main and satellite line intensities:
| (4) |
where is the main-beam temperature, is the ratio of the satellite and main line strengths using the statistical weights. We adopted and for the inner and outer satellites of NH and o-NH2D(111–101) respectively. For H13CN and DCN, we used for the and hyperfine components, and for the and components.
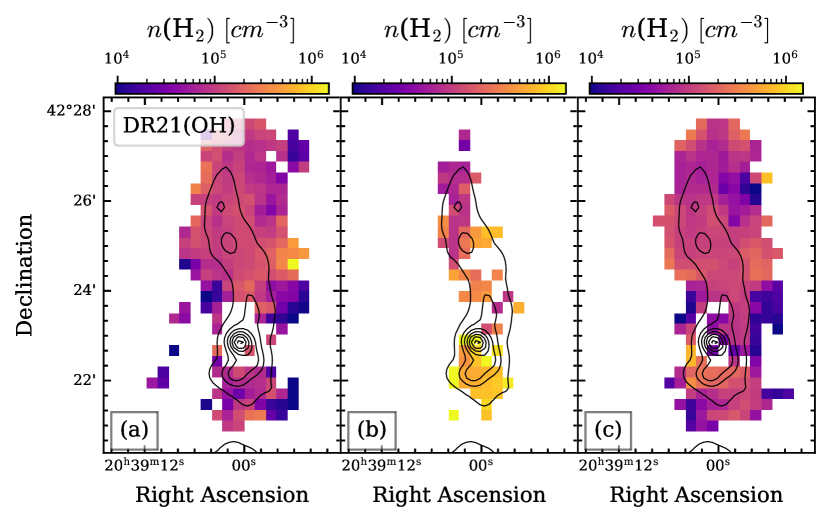
It should be noted that two velocity components at and km s-1are observed in the source DR21(OH) (see details in Schneider et al., 2010). In the reduction, the components were separated, and only the km s-1component has been used for the analysis, since it is stronger and is detected throughout the source.
3 Results
3.1 Maps and spectra
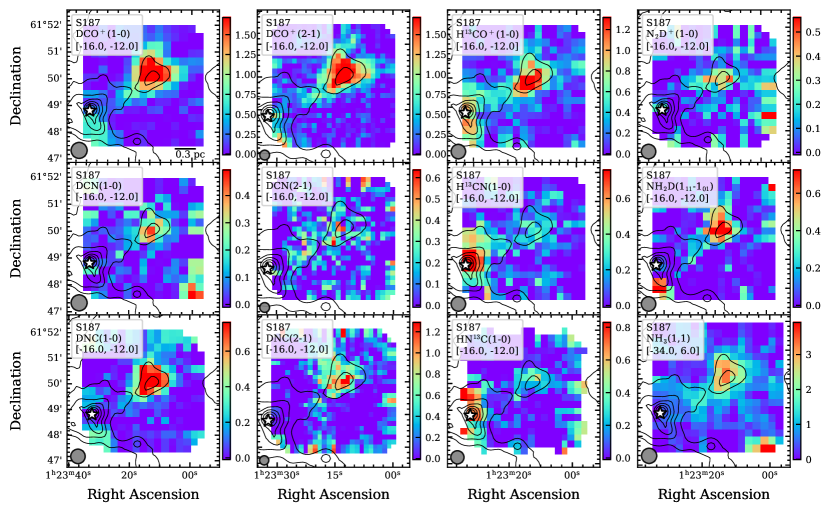
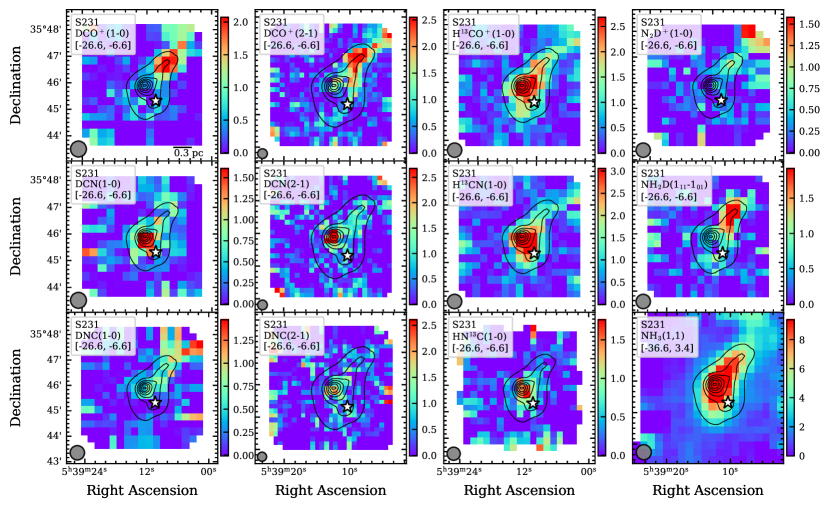
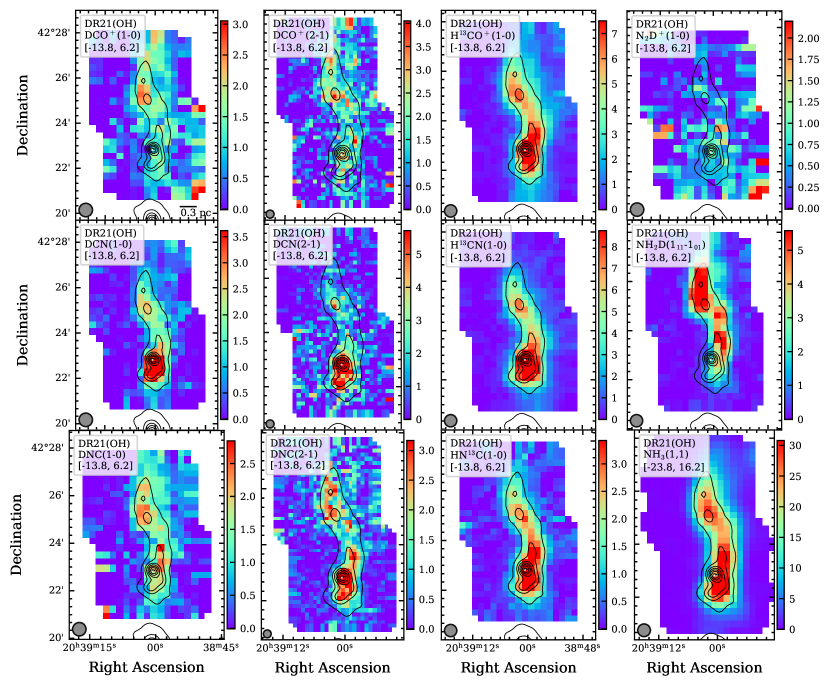
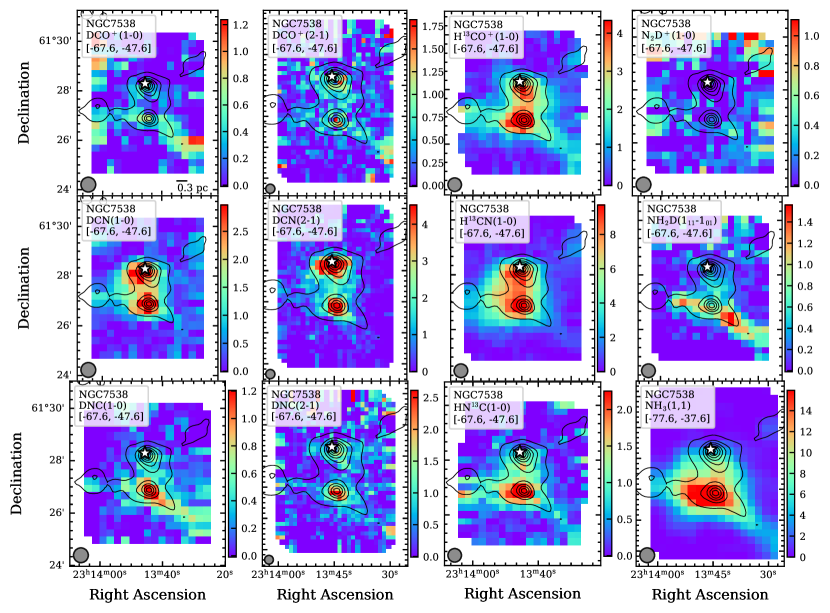
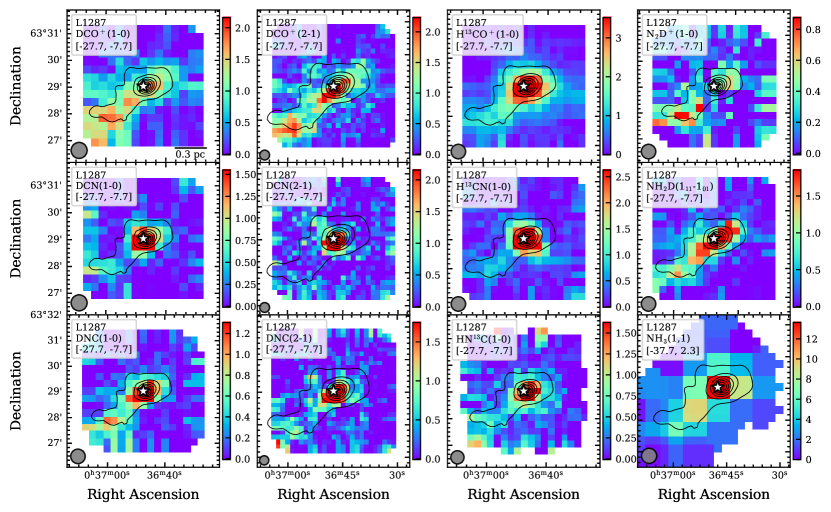
In Figs. 1 and 12 of the Appendix we show the integrated intensity maps to compare the spatial distribution of molecules. The dust and thus the gas column density distribution are represented by the 850 SCUBA continuum emission. In general, all hydrogenated molecules show emission peaks at a position coincident with the main dust emission peak and the IRAS source position. The deuterated molecules present various distributions. DCN, unlike DNC, DCO+ and NH2D, shows emission peaks consistent with the hydrogenated isotopologues. In DR21(OH) and NGC7538, the DCN emission is stronger than DCO+ and DNC, but in L1287, S231 and S187, DCO+ provides the strongest emission from a deuterated molecule. Notably, in S187, the NH2D line demonstrates stronger emission by a factor of than NH3, but it is located at the edge of the map. Additionally, the emissions are weak and not detected in NGC7538.
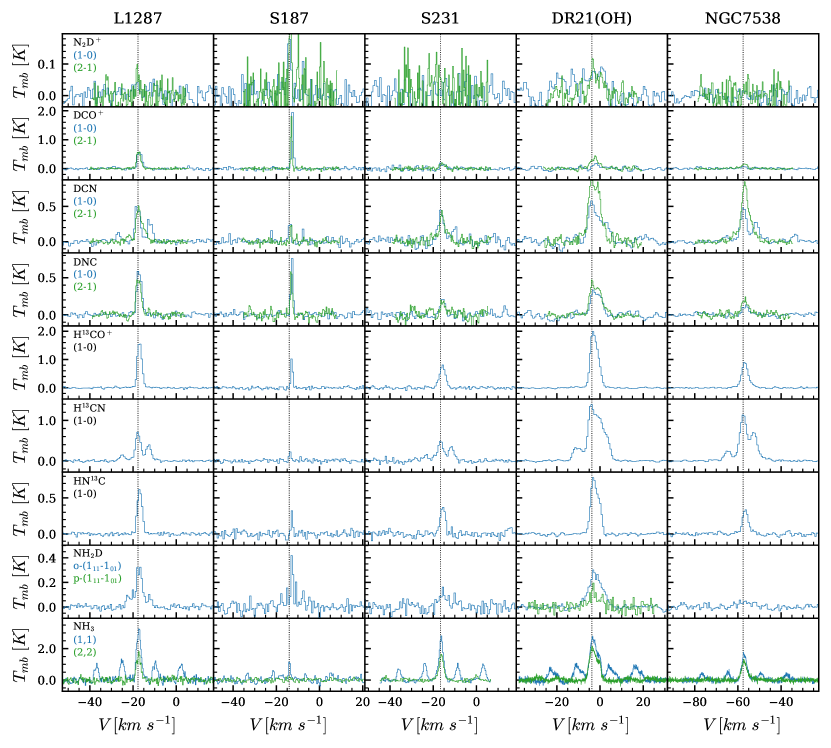
In Fig. 2 we show the spectra extracted at the 850 main dust continuum peak. For HCO+, HCN and HNC, the lines are affected by self-absorption, thus lines are analysed in this paper. In DR21(OH) both velocity components mentioned above (see sect. 2.4) can be seen. The line widths are from 1 km s-1, towards S187, to 3 km s-1, towards DR21(OH). In S187 the line width is comparable to the velocity resolution. In general, the hydrogenated molecular lines show stronger emission by a factor of , but in S187, to the contrary, the deuterated isotopologue lines are stronger. In addition, we also estimated the main line optical depth from the hyperfine structure of DCN(1–0) and H13CN(1–0). The optical depths at the emission peaks were found to be low, . Furthermore, the main line optical depths of o-NH2D(111–101) and NH3(1,1) at the emission peaks are .
As a future perspective, we plan to investigate the kinematics and dynamics of the gas.
3.2 Kinetic temperature from observations of CH3CCH
In Askne et al. (1984) and Bergin et al. (1994) it was shown that the rotational temperature of CH3CCH gives a good estimate of the gas kinetic temperature at gas density cm-3 (transitions and were considered). This is explained by the fact that, due to the low dipole moment ( = 0.78 D), the CH3CCH molecule is easily thermalized under such conditions. Gas densities in our sources are above this threshold. Thus, the CH3CCH lines in our data can be a good gas kinetic temperature indicator. Rotational (and, accordingly, kinetic) temperature is determined from the rotation diagram method. It is assumed here that the emission is optically thin and the background radiation can be neglected.
The rotational diagrams were constructed using the and transitions of the CH3CCH molecule. To estimate the rotational temperature, we smooth the and line maps to the same angular resolution of 40. The K-ladder spectra were fitted with Gaussian profiles, assuming that the widths of all components are equal, and the spacings between them are known.
3.3 Kinetic temperature from NH3 observations
Ammonia inversion transitions have a complex hyperfine structure with several components grouped in five lines, a central one as well as inner and outer satellites (see the lowest row of spectra in Fig. 2). Optical depths and rotational temperatures were determined using the methods described in Ho & Townes (1983). The spectra were fitted with Gaussian profiles. In the (1,1) transition line widths of all hyperfine components were assumed to be equal, and the spacings between them are known. As described in section 2.4, the optical depth is derived from the ratio of the observed main and satellite line intensities according to Eq. (4).
Thus, the rotational temperature can be obtained from the ratio of the main groups component intensities of the (1,1) and (2,2) transitions using the equation (Ho & Townes, 1983):
| (5) | |||
The kinetic temperature values were obtained using the equation from Tafalla et al. (2004):
| (6) |
3.4 Kinetic temperature from the integrated intensity HCN/HNC ratio
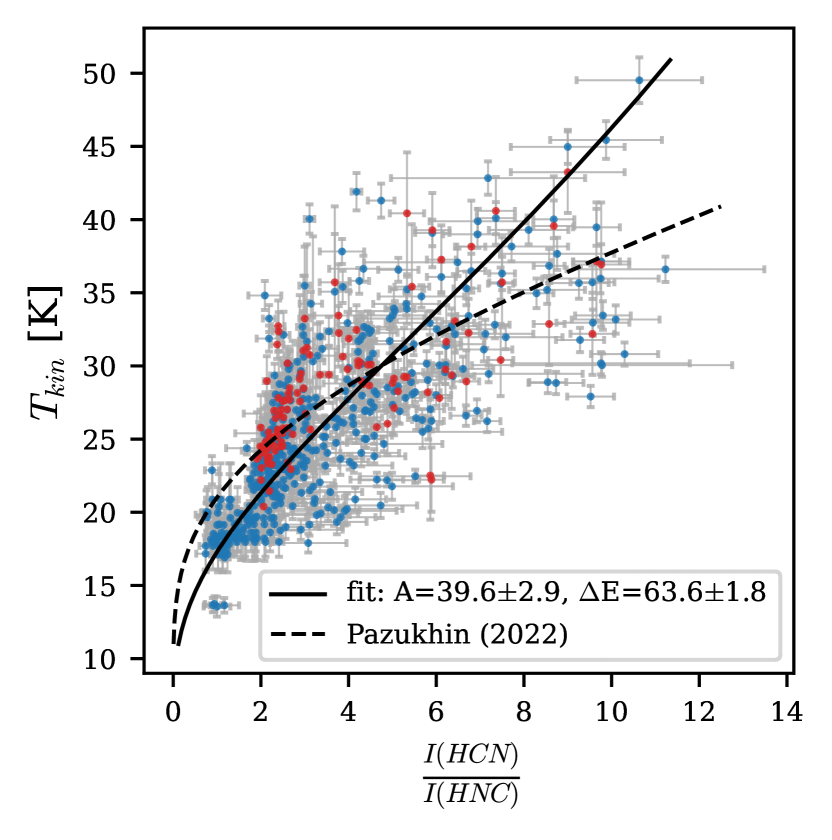
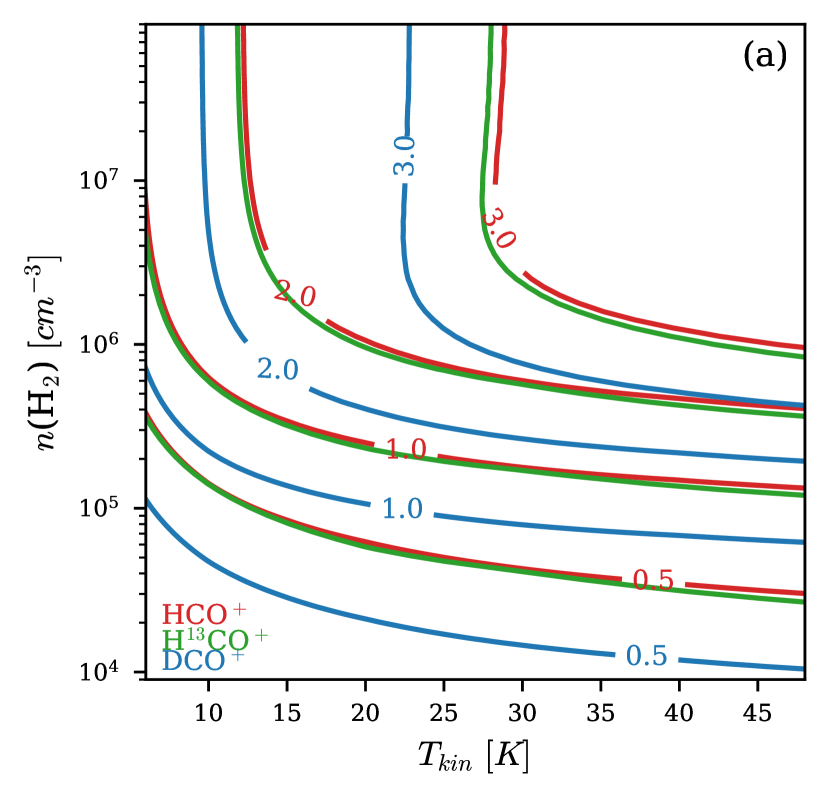
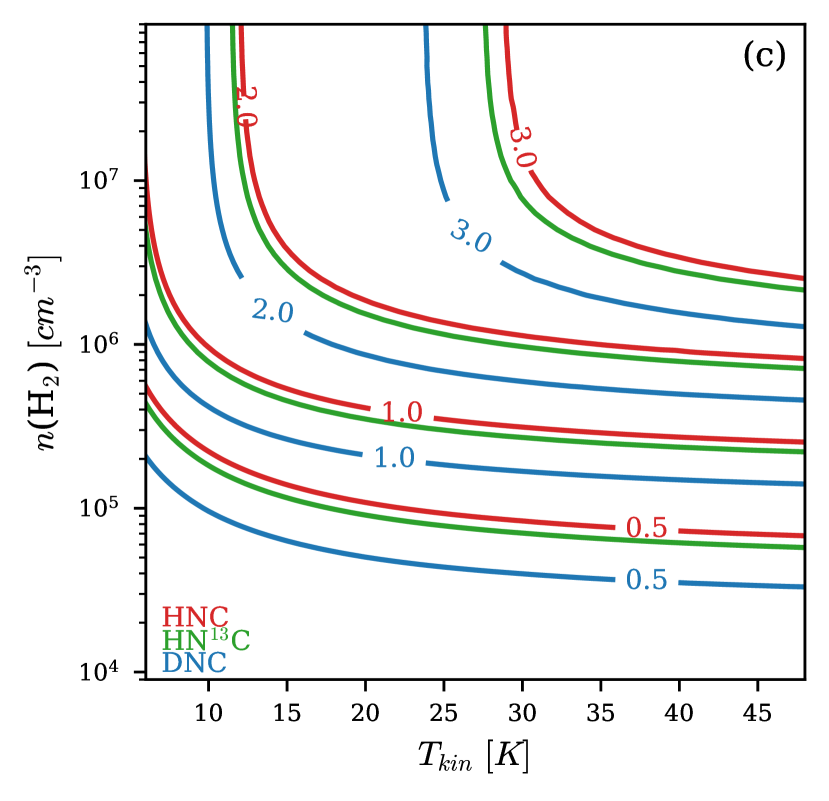
It is known that the HCN/HNC abundance ratio strongly depends on the kinetic temperature (e.g., Hirota et al., 1998). In Hacar et al. (2020) it was proposed to use the intensity ratio of the HCN to HNC line as a temperature indicator based on observations of the integral shaped filament in Orion. Following Pazukhin et al. (2022), we found a correlation between the integrated intensity ratio H13CN/HN13C and the kinetic temperature expressed in terms of the Boltzmann distribution (see Fig. 3, left panel). We use the following equation as a temperature indicator:
| (7) |
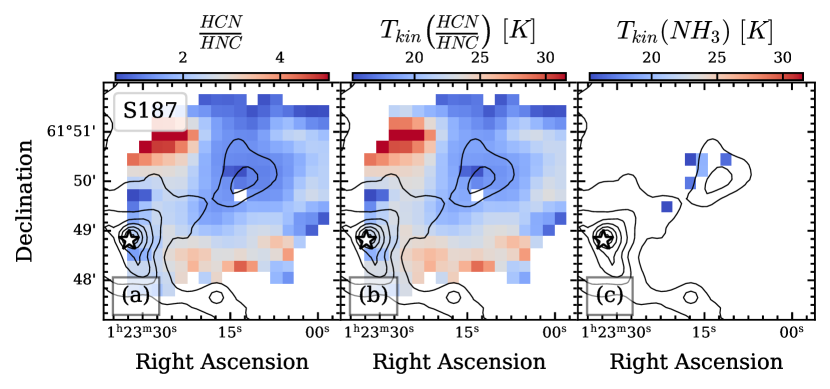
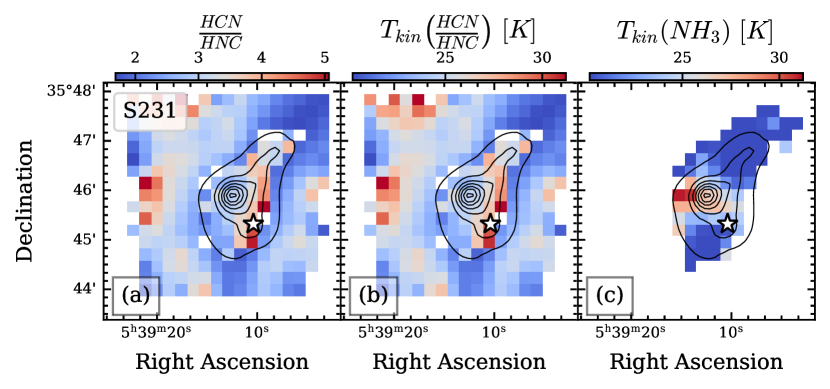
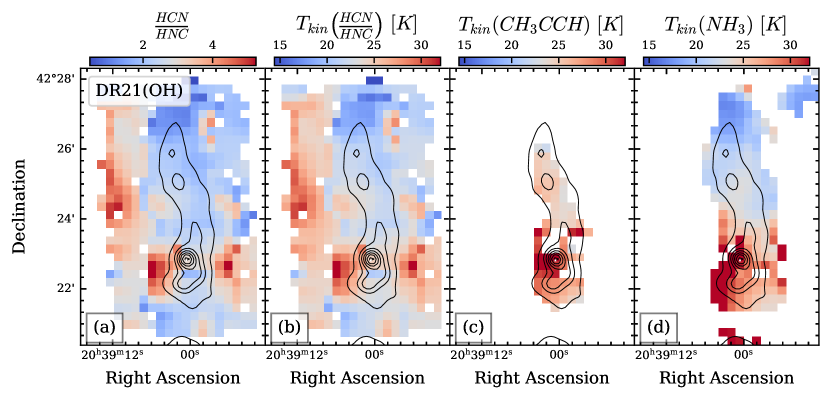
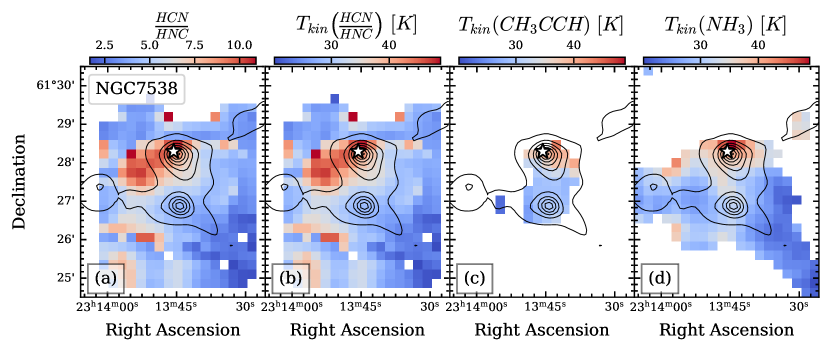
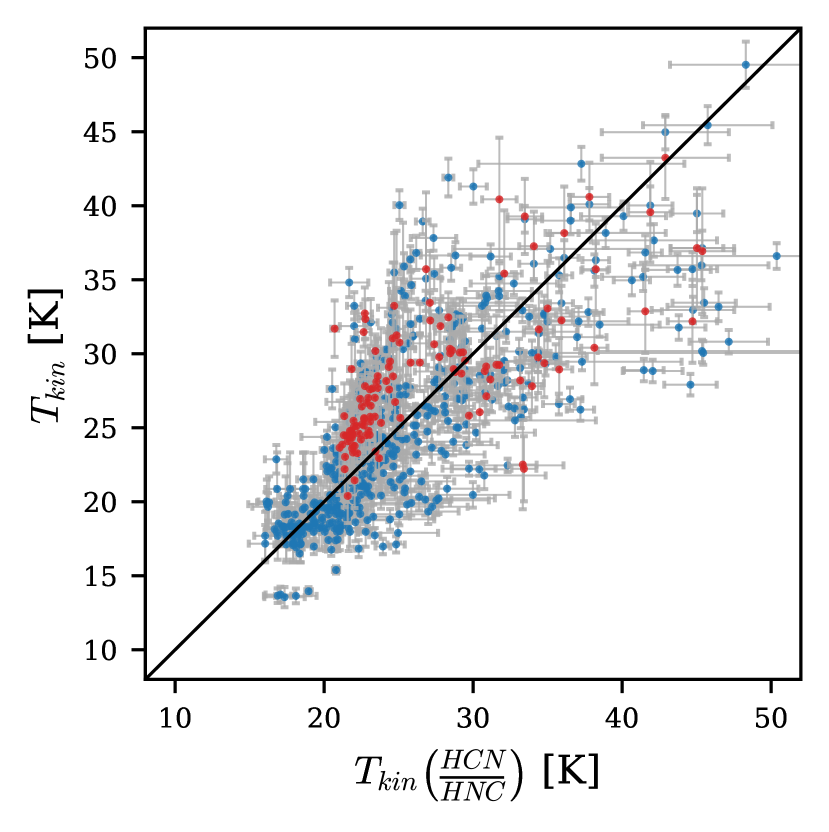
As can be seen in Fig. 3, this fit is somewhat different from that found in Pazukhin et al. (2022). The difference can be explained by a larger dataset as compared to the previous work by Pazukhin et al. (2022). Figure 3(right) shows the kinetic temperature obtained from the NH3 and CH3CCH transitions in comparison with the temperatures estimated from the integrated intensity ratios H13CN and HN13C lines and their main isotopologues. In general, the Tkin(HCN/HNC) values show a good agreement with the estimates derived from the CH3CCH and NH3 lines in the range of 20 to 40 K with deviations of K.
We further expanded the temperature maps by combining the observational data from isotopologues H13CN and HN13C with observations from the main isotopologues, as suggested by Beuther et al. (2022). In those source regions where the H13CN or HN13C lines become too weak, the intensity ratio of the main isotopologues is used.
Figs. 5 and 13 in the Appendix represent the temperature maps. The HCN/HNC maps demonstrate a good agreement with the estimates derived from the CH3CCH and NH3 lines. The temperature gradient is clearly visible, with both low-temperature and high-temperature regions being traceable. Temperature peaks coincide spatially with both the dust continuum emission and the IR source position. In addition, the maps extend beyond the temperature maps derived from the CH3CCH and NH3 lines. The Tkin(HCN/HNC) of individual objects are discussed in Sect. 3.7.
3.5 Non-LTE analysis
Assuming non-LTE and optically thin molecular emission, the gas density and the molecular column density can be estimated using the off-line RADEX code (van der Tak et al., 2007). Energy levels, statistical weights, Einstein A-coefficients and collision rate coefficients were taken from the Leiden Atomic and Molecular Database (LAMDA)444https://home.strw.leidenuniv.nl/~moldata/ (Schöier et al., 2005). Also collisional data were adopted from the BASECOL database555https://basecol.vamdc.eu (Dubernet et al., 2013). For D and H isotopologues, we used collision coefficients calculated for DCO+–H2 and HCO+–p-H2 by Denis-Alpizar et al. (2020), HCN–p-H2 and HNC–p-H2 by Hernández Vera et al. (2017), NH3–p-H2 by Bouhafs et al. (2017), NH2D–p-H2 by Daniel et al. (2014) and –p-H2 by Balança et al. (2020).
We determined integrated intensity ratios of the and lines of DCO+, DCN, DNC and compared them with calculated model values from RADEX. We built model grids with kinetic temperatures in the range K, H2 volume densities in the range cm-3, and total column densities of 1012 cm-2. At this column density the optical depths are low in all lines, so that line intensity ratios do not vary, if column densities were actually smaller. Note that estimates of the H2 volume densities decrease with increasing optical depth of the and transitions. Thus, we use model intensity ratios of optically thin lines, which weakly depend on the column density at cm-2. To derive H we estimated the following chi-squared minimum:
| (8) |
where and are the 2–1/1–0 ratios from observations and models, is the sum of squared rms noise of and lines, and are the kinetic temperatures from observations and models and is the uncertainty of . The volume densities H were found from the average value for the condition (95 per cent confidence level), and the errors were found from the standard deviation.
Only for DCO+ and NH2D native data files are available in the LAMDA database. In cases of DCN, DNC and N2D+ the data files of their hydrogenated isotopologues were used. This can lead to biases in the density estimates. Indeed, in Fig. 4 we show that the density estimates with the HCO+ data file are higher than the estimates with the DCO+ data file by a factor of 3. Hence, to improve the results for DCN and DNC we modified the molecular data files by substituting the frequencies, energy levels and Einstein A-coefficients for the deuterated isotopologues. The data for the 13C isotopologues were also appended. We suppose that the difference in the estimates is due not only to collision rate coefficients, but also to these parameters. The results of our substitution are shown in Fig. 4.

As mentioned above all maps were smoothed to 40 and to the same grid size. After that, using the integrated line intensity, the kinetic temperature and calculated (H2), the column density was obtained for each pixel in the map. In the analysis we use only the kinetic temperature derived from the integrated intensity ratios of HCN and HNC isotopologue lines (see sect. 3.4). Since the line ratios of the 12C to 13C bearing isotopologues indicate that HCO+, HCN, HNC lines are optically thick, the lines of their optically thin isotopologues H13CN, HN13C were used. To do this, the obtained values of the column densities of optically thin isotopologues were multiplied by a coefficient obtained from the carbon isotope ratio (Yan et al., 2023), where is the Galactocentric distance in kpc. For (NH3) and (NH2D), we assumed ortho-to-para ratios of 1 and 3, respectively, which correspond to the nuclear spin statistical weights. To derive (NH3) and values we use the mean value of H of DCO+, DCN, DNC.
3.6 H2 column density
We derived H2 column densities from dust maps obtained with the SCUBA Legacy Catalogue at and a resolution of . The maps were smoothed to resolution to provide an optimal match with the IRAM-30m and Effelsberg-100m data. Following Hildebrand (1983), the H2 column density is related to the dust emission by:
| (9) |
where is the gas-to-dust ratio, is the Planck function, is the observed flux, is the beam solid angle, is the dust temperature, is the mass of a hydrogen atom and is the mean molecular weight of the interstellar medium. The dust opacities used were at (Ossenkopf & Henning, 1994). Then, the column density values, in cm-2, are derived using the equation in useful units (Kauffmann et al., 2008):
| (10) |
where is the observed flux in , is the beam size in arcsec and is the wavelength in mm.
To derive the H2 column density we assumed that is 20 K based on results from Pazukhin et al. (2022). They compared the gas kinetic temperature with the dust temperature, which was taken from the open database666http://www.astro.cardiff.ac.uk/research/ViaLactea according to data from the Herschel telescope (Marsh et al., 2015, 2017). The values were in the range 18–25 K and no significant correlation between the gas and dust temperatures was found.
In addition, we estimated the mean density based on the measured N(H2), assuming as the source size the FWHM of the continuum emission and Gaussian source profile. These mean densities are given in Sect. 3.7.
3.7 Individual objects
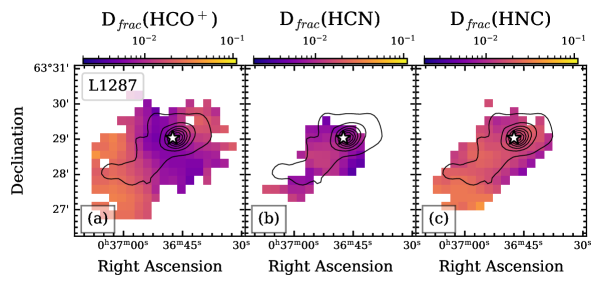
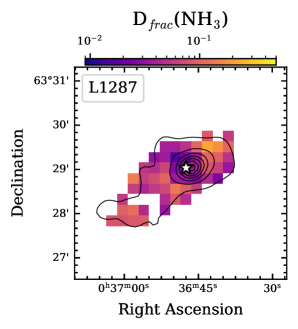
3.7.1 L1287
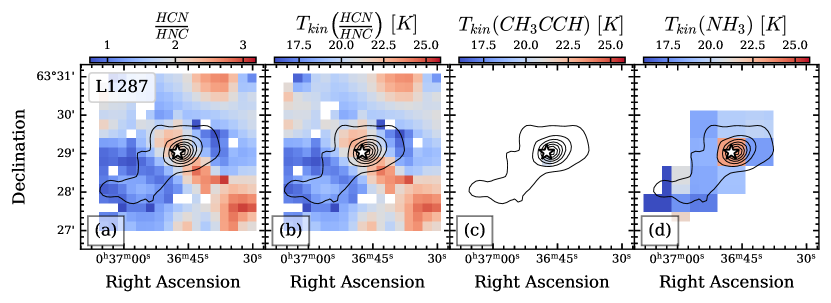
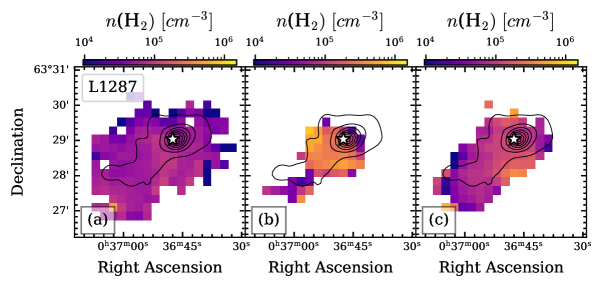
The kinetic temperature at the dust emission peak is K and decreases to K towards the southeast along the dust emission ridge (Figure 5). The gas density at the centre is cm-3and slightly decreases to southeast as well as the temperature (Figure 6). Based on dust emission the mean density is cm-3, with a source size of 0.2 pc.
The minimum value of the deuterium fraction for , HCN and HNC is observed towards the center. The are 0.006–0.02 for , 0.008–0.01 for HCN, 0.015–0.02 for HNC and decrease with rising temperature (Figure 7). The (NH3) values are 0.03–0.1 (Figure 8).
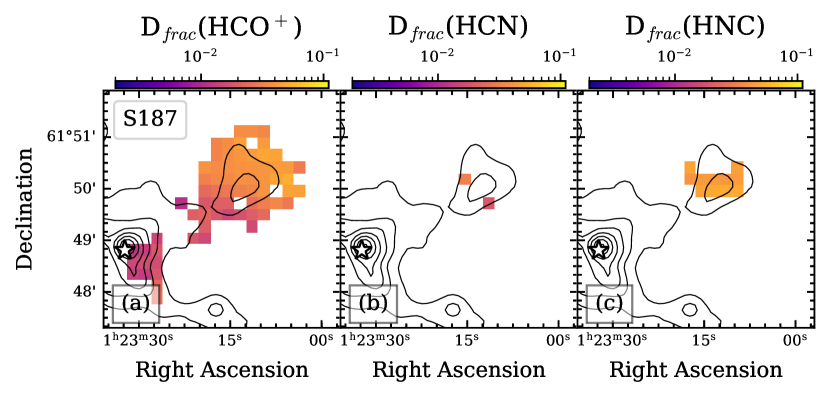
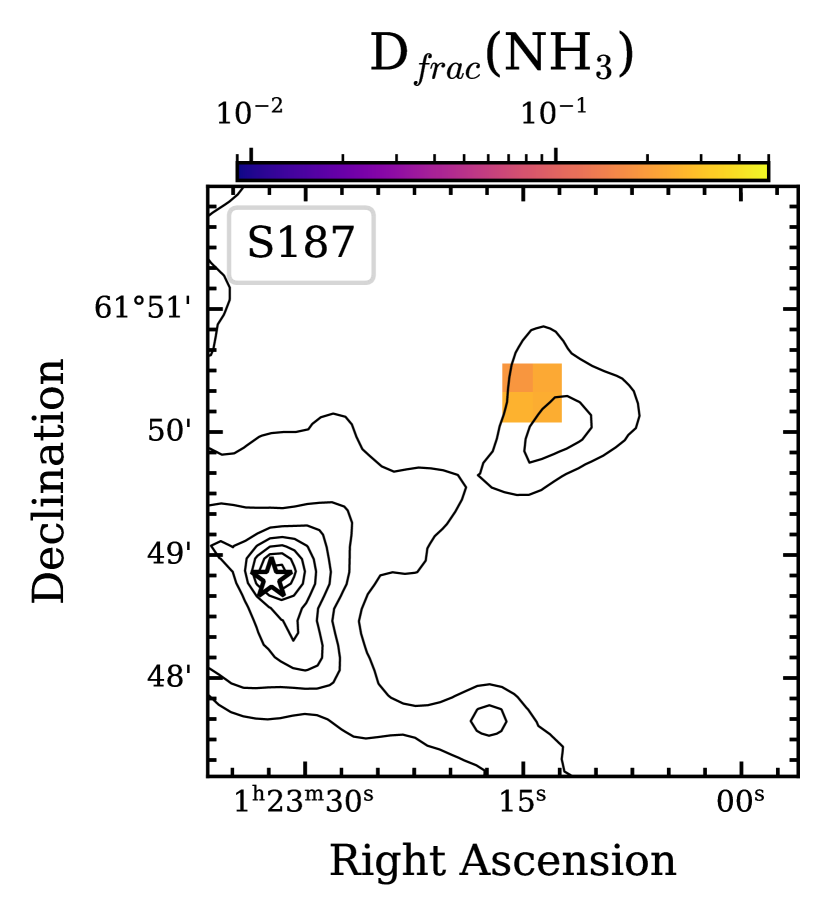
3.7.2 S187
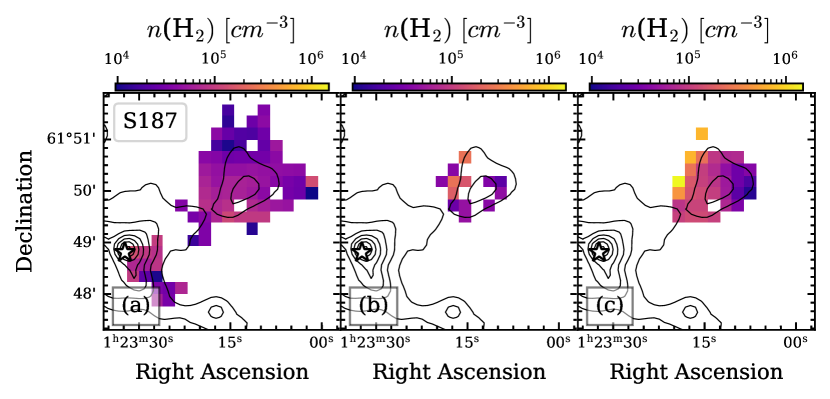
The kinetic temperature towards the central dust emission peak is K and increases to K at the IRAS source position (Figure 13). The gas density towards the IRAS source position is cm-3and is close to the value at the centre position (Figure 14). The mean density is cm-3, determined towards the central dust emission peak, with a size of 0.3 pc.
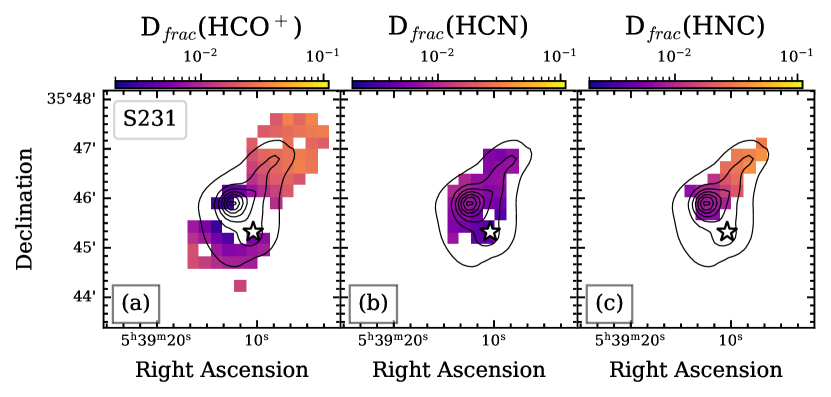
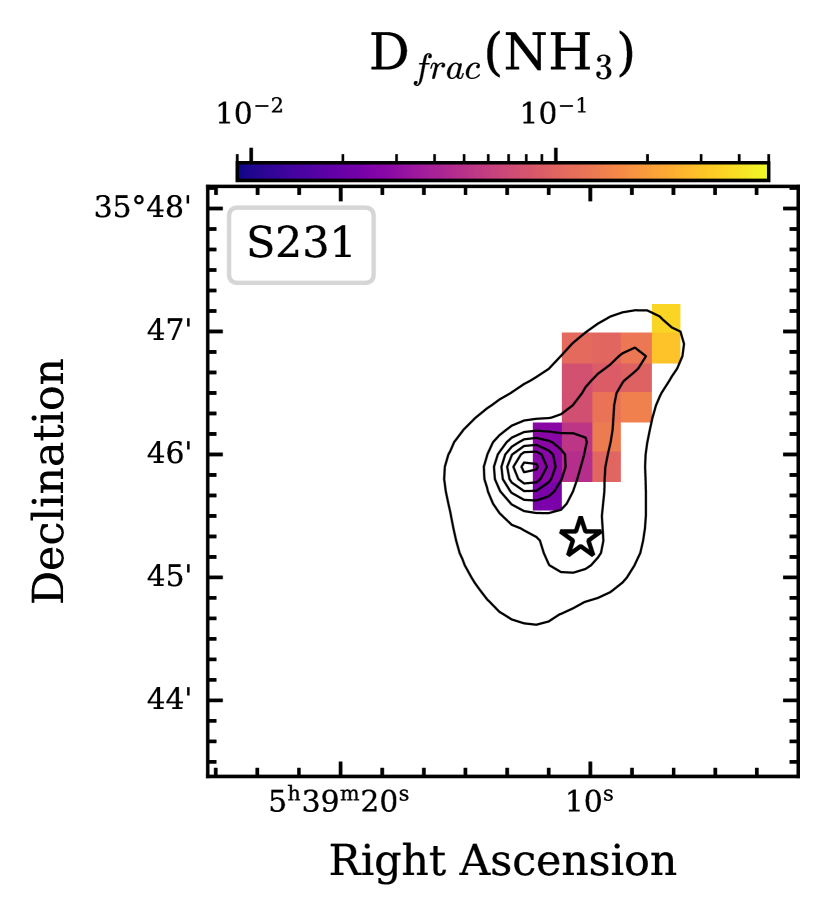
3.7.3 S231
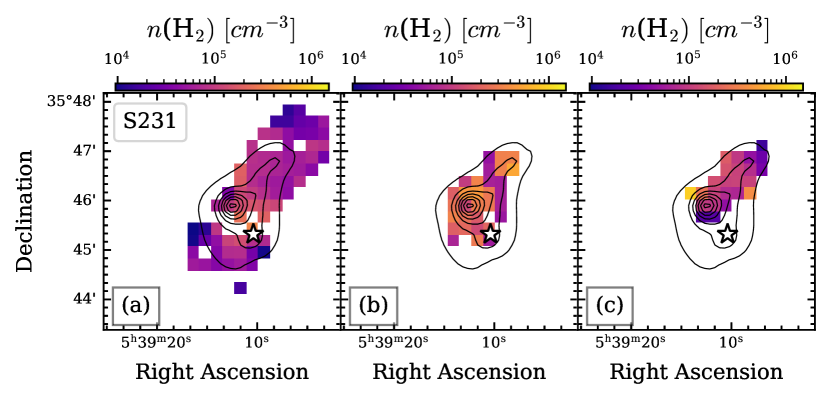
The kinetic temperature at the IRAS source position is 26–30 K. It is close to the value at the central dust emission peak and decreases to K to the northwest along the dust emission distribution (Figure 13). The gas density at the centre is cm-3, almost throughout the entire region where we see dust emission (Figure 14). The mean density is cm-3, with a source size of 0.4 pc.
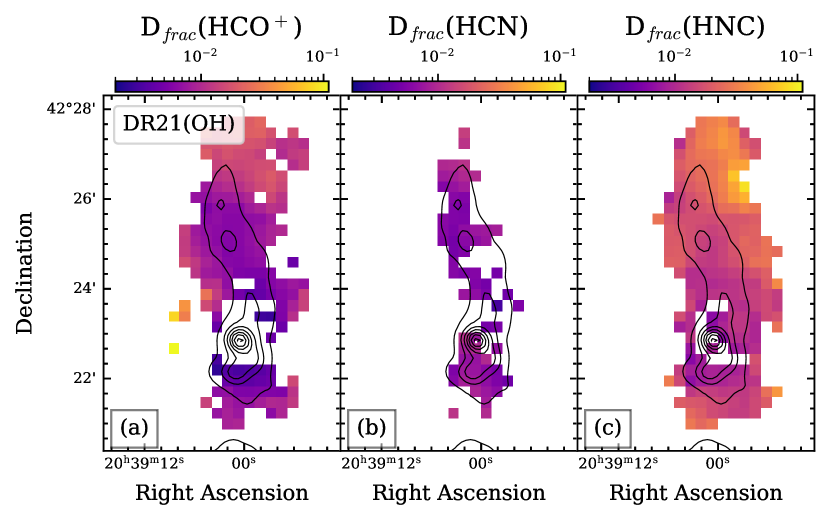
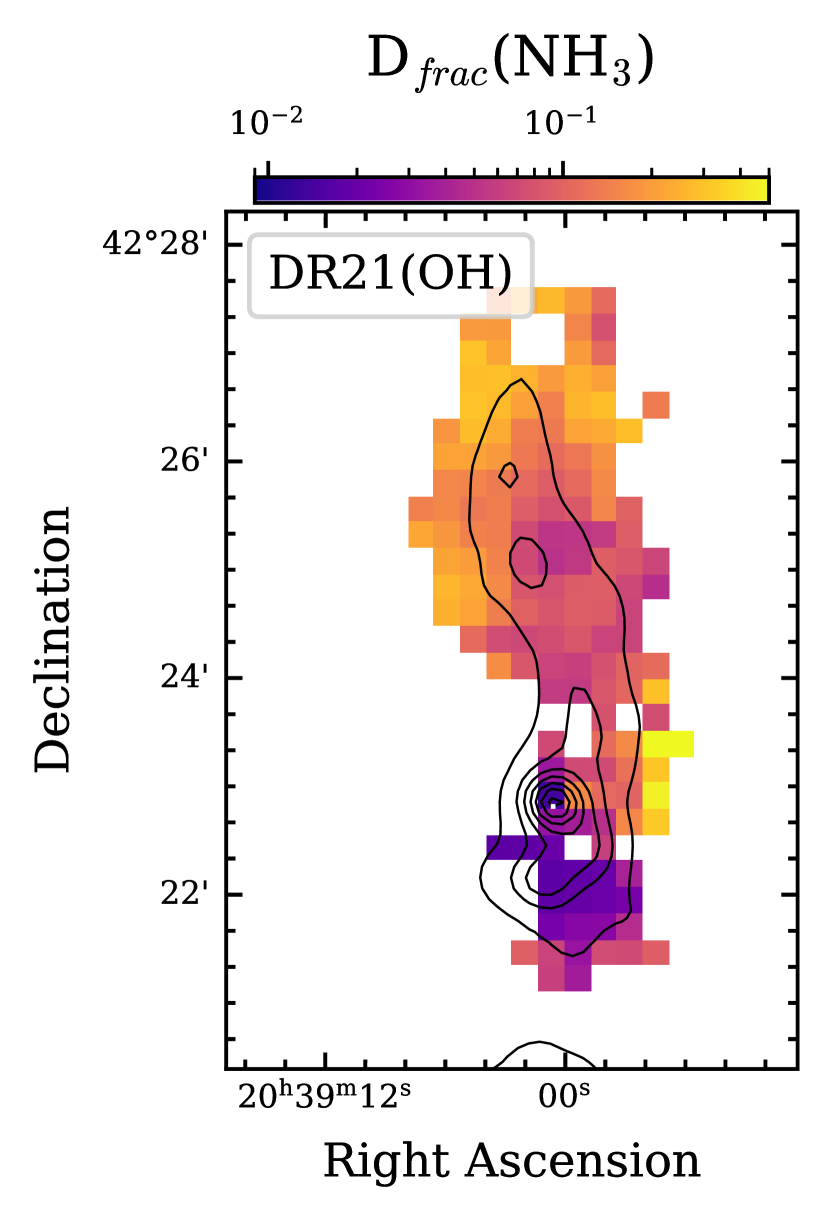
3.7.4 DR21(OH)
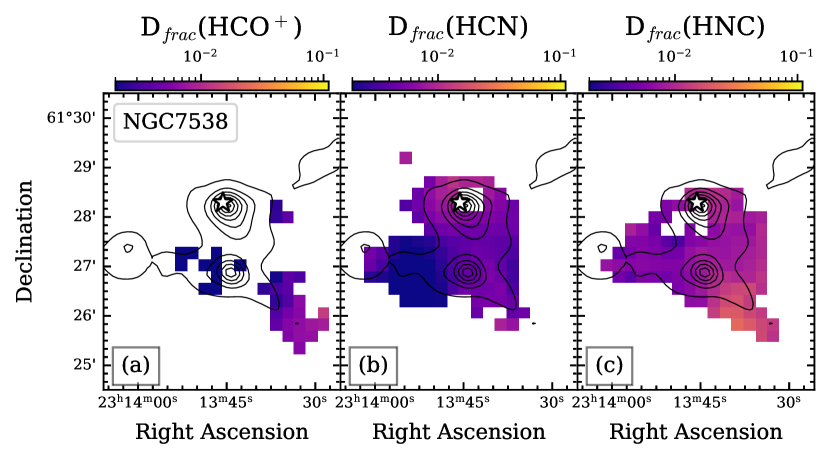
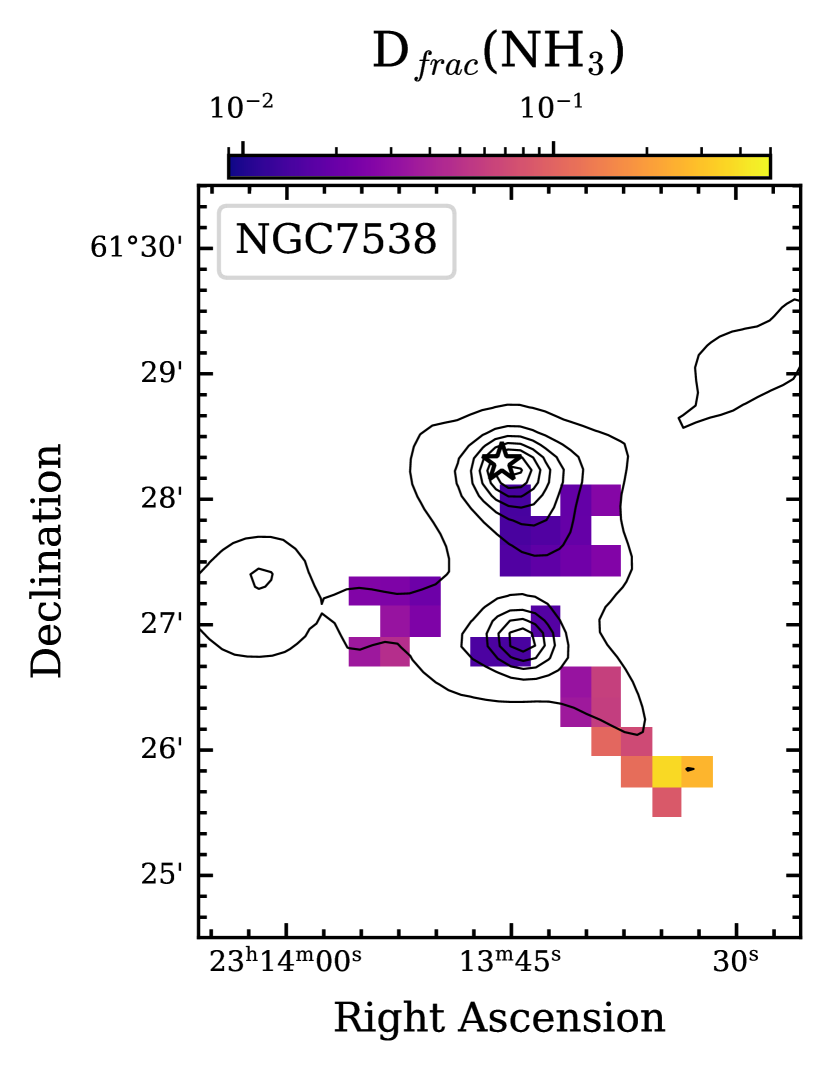
3.7.5 NGC7538
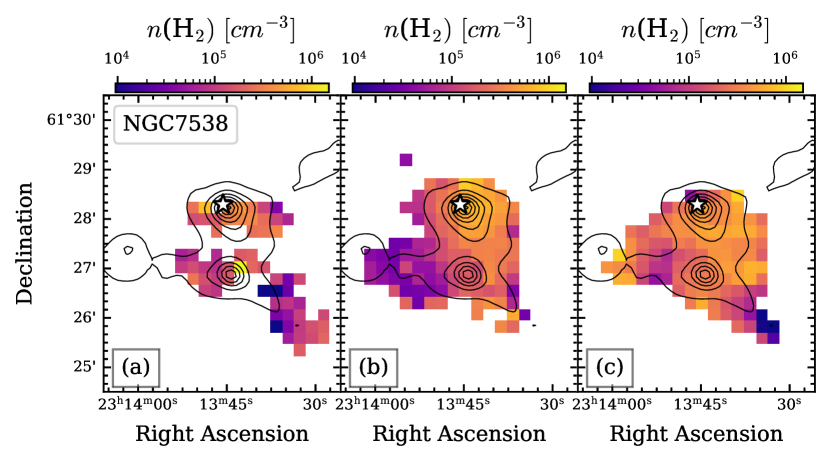
The kinetic temperature at the IRAS source position is K, at the dust peak in the south it is 30 K and decreases to K to the southwest (Figure 13). The gas density at the dust emission peaks is cm-3and decreases to cm-3as well as temperature (Figure 14). The mean densities to the north and south peak are cm-3, with a source size of 0.6 pc.
There are few D/H values for observed towards the centre. The values are 0.008 at the dust emission peaks for HNC and increase to 0.02; the D/H values of NH3 are 0.02–0.3 and decrease with rising temperature. The values are 0.002–0.005 almost throughout the map. The mean is 0.005 in the lower temperature region (Figs. 15, 16).
3.8 Dependence of deuteration on physical parameters
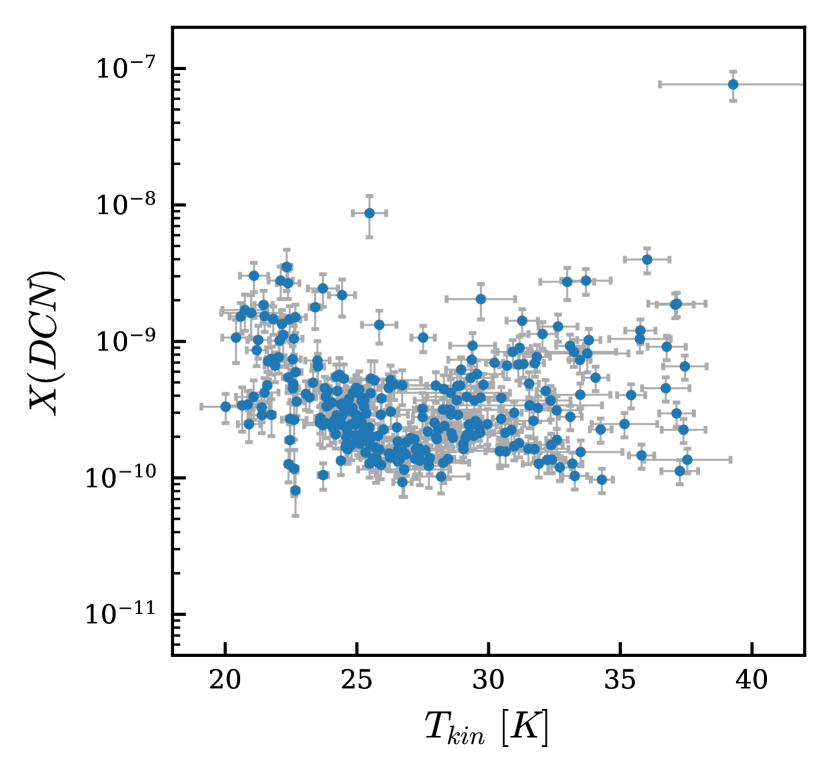
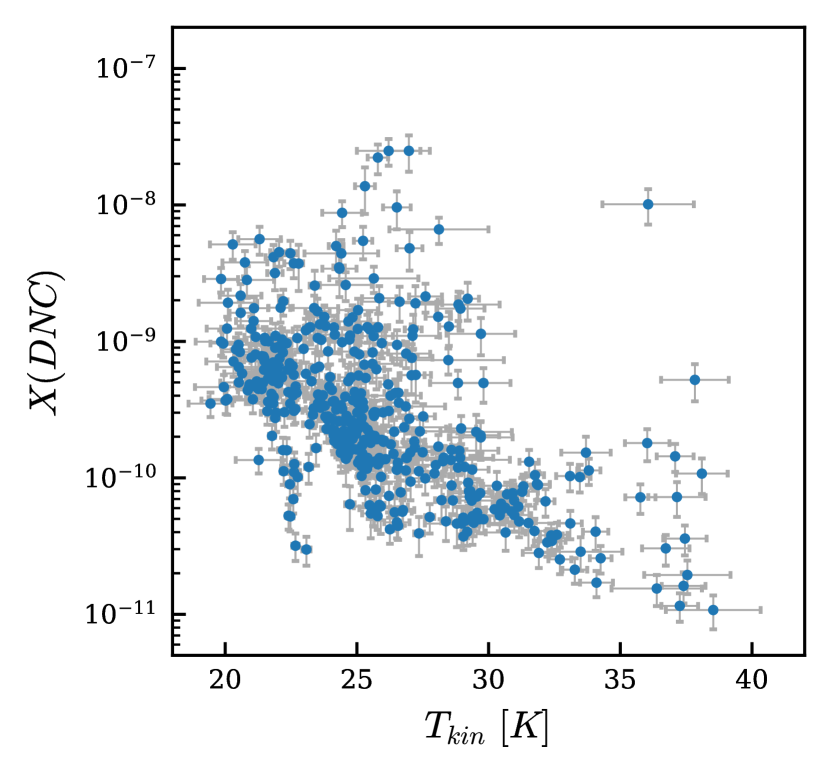
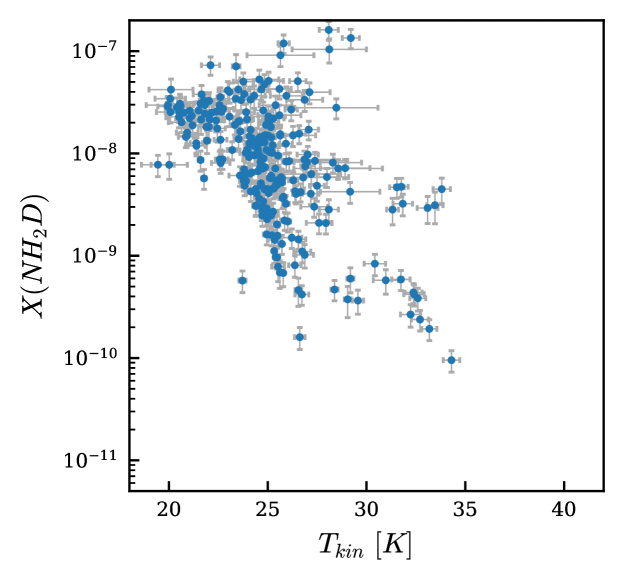
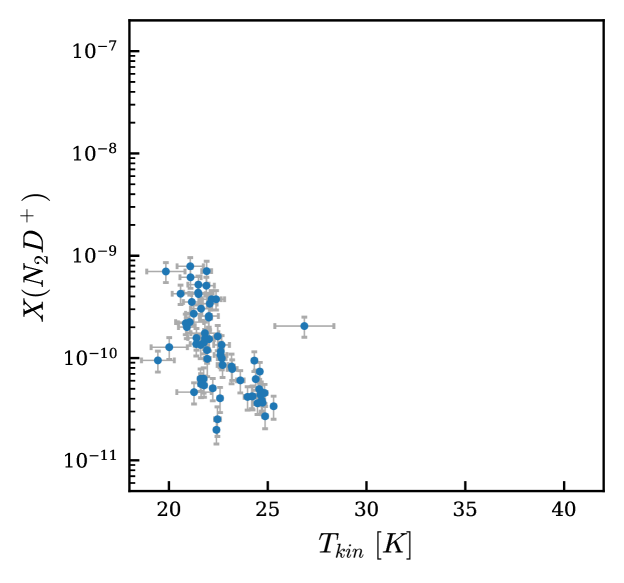
We determined abundances of the deuterated molecules relative to H2 (Figure 9). These relative abundances are for DCO+ and DNC, for and for NH2D. The relative abundances of these species decrease with increasing temperature. However, the DCN/H2 ratio is almost constant ().
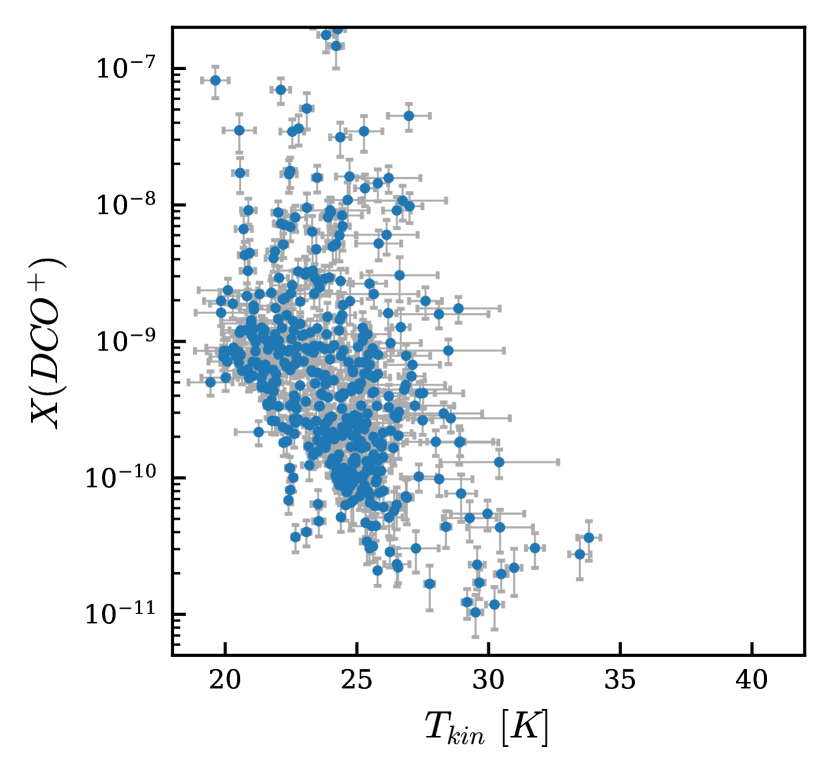
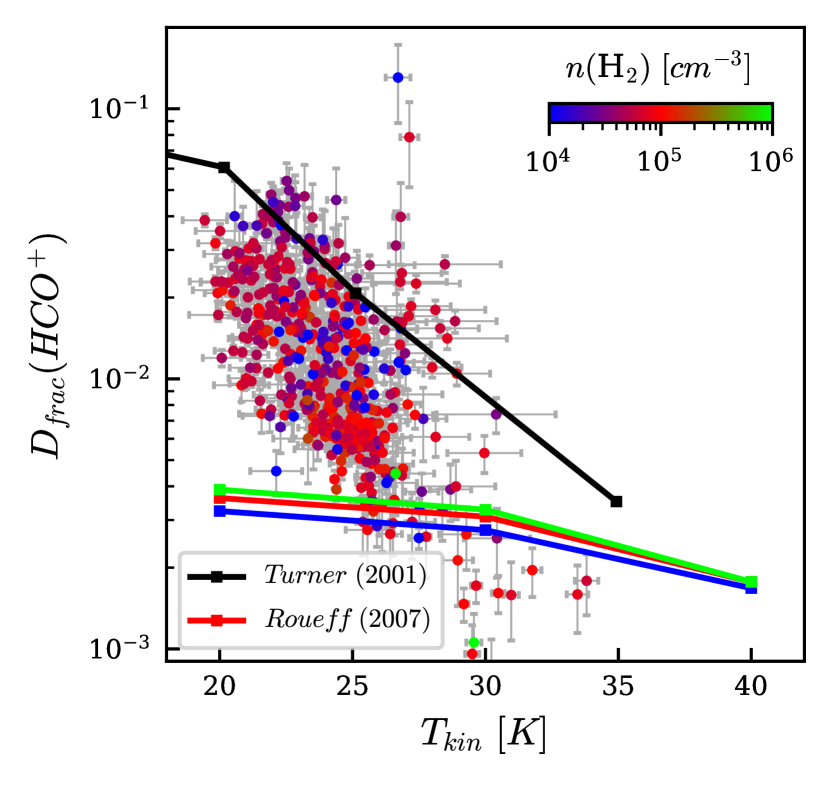
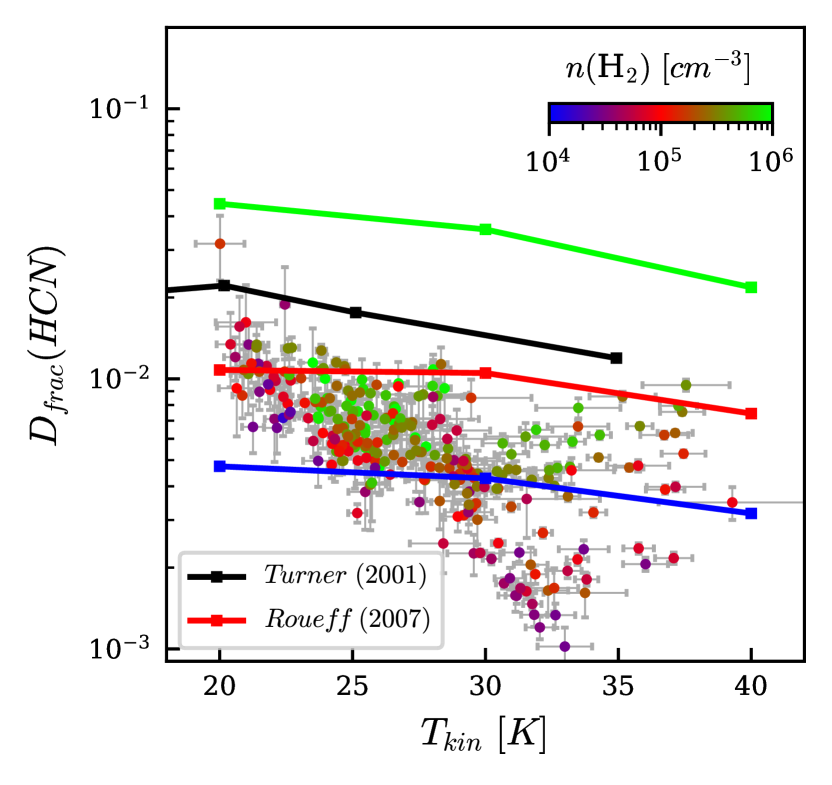
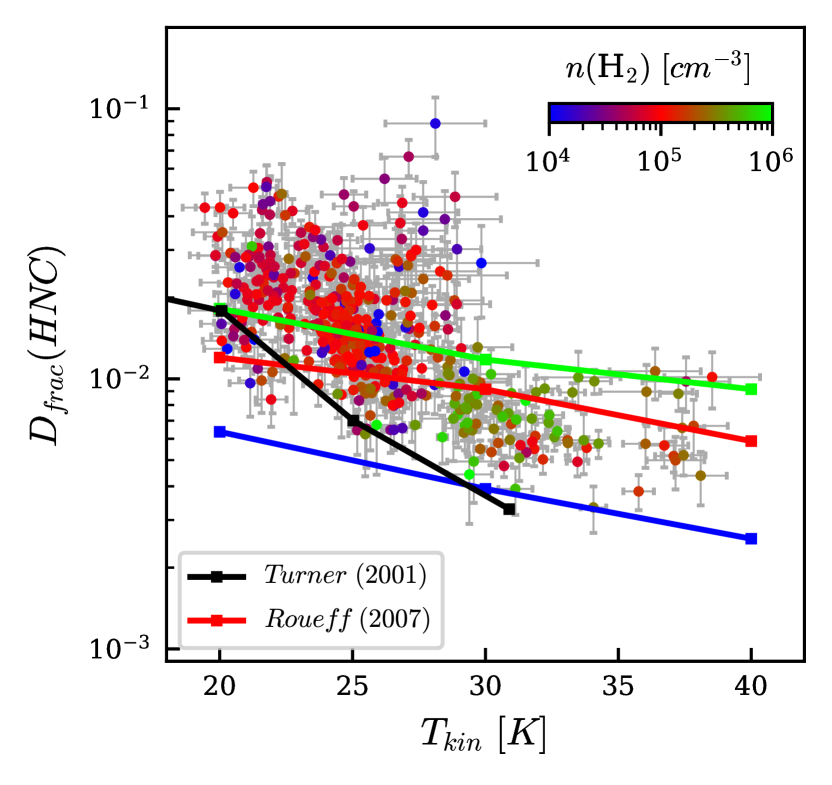
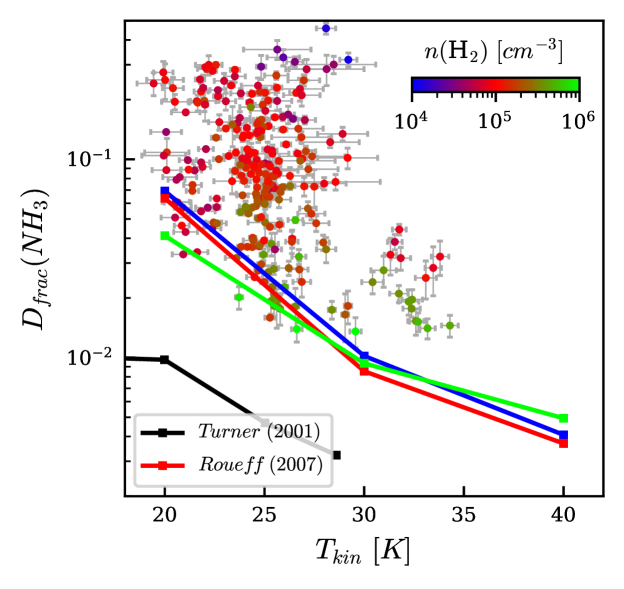
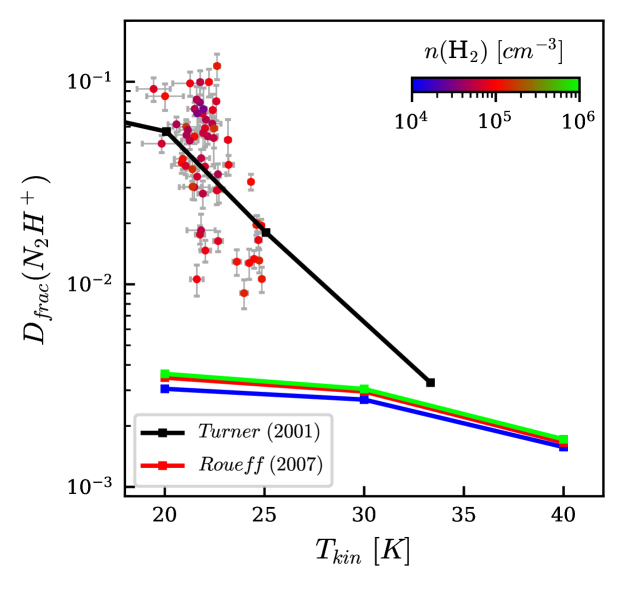
In Fig. 10 we show the correlation of the deuterium fraction, the kinetic temperature and the volume density. We also show model predictions by Roueff et al. (2007) and Turner (2001) (see details in section 4.3). We estimate Spearman’s rank correlation777https://docs.scipy.org/doc/scipy/reference/generated/scipy.stats.spearmanr.html coefficient of D/H ratios, and . We define the correlation as "strong" (), "moderate" () and "weak" ().
The deuterium fraction of HCO+ is in the range from 0.001 to 0.05. The and are "strong" anticorrelated at a temperature 20–30 K. The and are "weak" anticorrelated at a volume density of cm-3. The obtained values are consistent with the model predictions by Turner (2001). The model values by Roueff et al. (2007) are decreasing more slowly compared to the observational data.
HCN. The deuterium fraction of HCN is in the range of 0.001–0.02. The and are "strong" anticorrelated. The correlation of and is "moderate". The is in the range of cm-3. The obtained values agree with the models data with densities cm-3.
HNC. The deuterium fraction of HNC is in the range of 0.002–0.05. The and values are "strong" anticorrelated at a temperature of 20–40 K and cm-3. The obtained values agree with the model curves.
The deuterium fraction of NH3 decreases from 0.4 to 0.02. The - values are "moderate" anticorrelated, while - are "strong" anticorrelated. The obtained values are higher than the model predictions by Turner (2001). The model values by Roueff et al. (2007) agree with the observational data.
There are few D/H values for . The deuterium fraction of is 0.008–0.1 at temperatures 20–25 K, at a density cm-3. The observed values show similar trends to the model by Turner (2001), but are larger than those of the model by Roueff et al. (2007).
4 Discussions
4.1 Comparison of the different estimates of the H2 volume density
We obtained the H2 volume densities using both the dust continuum emission and non-LTE analysis. The densities derived from the molecular excitation analysis ( cm-3) are on average an order of magnitude higher than the mean densities ( cm-3). This is a typical situation (e.g., Zinchenko et al., 1994, 1998), which can be probably explained by the small-scale clumpiness in the sources.
4.2 The ortho-to-para ratio of NH2D
To derive the total column density of NH2D we were using o-NH2D lines assuming the o-/p- ratio of 3:1. The p-NH2D line at 110 GHz was also detected in DR21(OH). We decided to verify whether the assumption is correct. For this, integrated intensity o-/p- ratios were obtained, and as a result, the mean value is 2.6, with a standard deviation of 0.7. Fontani et al. (2015) found similar results for high-mass star-forming samples covering different evolutionary phases. They compared integrated intensities and derived a mean value of . Wienen et al. (2021) determined a median ortho-to-para column density ratio of from the ATLASGAL survey. They also derived this value from integrated intensity ratio. This resulted in a mean value of , which is close to our results. Additionally, Sipilä et al. (2019) constructed models for deuterium and spin-state chemistry for the purpose to model the low-temperature environment in starless and pre-stellar cores. They found, the models presented an NH2D ortho-to-para ratio of 2.
4.3 Comparison of deuteration with other results
Here we review some of the modelling and observational main work, and highlight the differences with our results. To study the chemistry of deuterated species Turner (2001) used a model, containing 9930 reactions and 610 species. The model described the dependence of the molecular D/H ratios upon temperature, density, ionization rate, extinction, epoch, and elemental abundances. At temperature 20–35 K and density 105 cm-3the predicted molecular D/H ratios are shown in Fig. 10. Roueff et al. (2005) presented a steady state model of the gas-phase chemistry. At temperature 20–50 K and density 105 cm-3the molecular D/H ratios decrease from 0.1 to 0.002 for the discussed species. After that in Roueff et al. (2007) the abundance ratios were analysed as functions of temperature and density for the “standard” low-metal set, which leads to best results for dark cold clouds, and the “warm-core” set, in which higher values of heavy elements are used to account for partial evaporation of grain mantles. These “warm-core” models are illustrated in Fig. 10.
Albertsson et al. (2013) calculated the deuterium fractionation model and simulated it in diverse interstellar sources. For prestellar objects the model predicted 0.01–1 for DCO+/HCO+ and /, as well as 0.001–0.01 for DCN/HCN, DNC/HNC and NH2D/NH3. The DCO+ and values are greater than our results. Also the model prediction of NH2D/NH3 is less than our observational data. Sipilä et al. (2015) developed the gas-grain models and the deuterium fraction of ammonia was 0.1 after 105 yr at a density of 105 cm-3and a temperature of 15 K. Sipilä et al. (2019) presented a chemical model for deuterium chemistry. They found that the highest ammonia D/H ratios were 0.1–1 at cm-3and after 105 yr.
Sakai et al. (2012) conducted a survey towards 18 massive clumps. For the five high-mass protostellar objects at temperature 25 K the mean DNC/HNC ratio was 0.0095. Fontani et al. (2011) found that / and are slightly anti-correlated. The mean decreases from 0.26 in the HMSCs to 0.04 in the HMPOs and UCHIIs. Their results in the HMSCs with temperature below 20 K are greater than our observed data. Fontani et al. (2014) observed DNC(1–0) and HN13C(1–0) towards 22 massive star-forming cores. They found an average (HNC) of 0.01 with no significant correlation between the three evolutionary groups of sources. Fontani et al. (2015) observed NH2D and NH3 towards previously observed massive star-forming regions. (NH3) was 0.01–1 at temperature 10–30 K and does not change significantly from the earliest to the most evolved phases. Additionally, for S231, values of 0.498 and 0.191 were found.
Gerner et al. (2015) observed a sample of 59 sources including different evolutionary groups. They found D/H ratios of 0.0004–0.02 for DCO+, 0.003–0.03 for DCN, 0.001–0.02 for DNC and 0.001–0.01 for . They also reported that the D/H ratios of DNC, DCO+ and decrease with time. DCN/HCN peaks at the HMC stage. They also modelled and observed relative abundances to H2. The observed values were of (DCO+), (DCN), (DNC) and (), mainly close to the model results. However, the model values of () were less then indicated by observations of the infrared dark cloud phase (IRDC). Our obtained relative abundances are greater by an order of magnitude.
Feng et al. (2019) obtained maps towards young high-mass star-forming clumps in G28.34+0.06. As the temperature decreases from 20 to 14 K, the molecular D/H ratios become 0.03–0.06 for , 0.004–0.006 for DCO+, 0.006–0.01 for DCN, 0.008–0.013 for DNC and 0.01–0.005 for NH2D. Our estimates at 20 K are greater then these results. Trofimova et al. (2020) have carried out a survey of 60 massive star forming regions (including our sources) of DCN, DNC, DCO+, , by using the 20-m Onsala radio telescope. The CH3CCH transitions were used to estimate the rotational temperature. For L1287, they obtained 0.065 for DCO+ and 0.017 for DCN at 34.4 K, 0.007 for DCN at 40.2 K in S231, 0.01 for DCN at 29.6 K in DR21(OH), 0.007 for DCN at 47.7 K in NGC7538. These values are comparable to our results. However, our estimates of temperature are 10 K less than theirs in L1287 and S231.
Wienen et al. (2021) observed a sample of high-mass clumps discovered by the ATLASGAL survey covering various evolutionary phases of massive star formation. The NH2D-to-NH3 column density ratios range from 0.007 to 1.6. They did not find a correlation between the NH3 deuteration and evolutionary tracer such as rotational temperature in the range 10–25 K. Li et al. (2022) observed NH2D at 110 GHz towards 50 Galactic massive star-forming regions. An excitation temperature of 18.75 K was used to calculate column densities. The range of deuterium fractionation encompasses values from 0.043 to 0.0006. The D/H ratio is 0.043 in DR21 and 0.015 in NGC7538. These results are close to our results. We summarise the observed D/H values and the results of previous works in Fig. 11.

5 Conclusions
Using observations with the IRAM-30m radio telescope and the 100-m radio telescope in Effelsberg, we have obtained the spatial distributions of the and DCO+, DCN, DNC, lines and ortho- and para-NH2D lines in five high-mass star-forming regions. We have derived deuterium fractions as functions of gas properties such as temperature and density. This has been combined with H2 column densities from SCUBA dust continuum maps.
The results are as follows:
-
1.
The deuterated molecules suggest different spatial distributions. DCN, unlike DNC, DCO+ and NH2D, shows emission peaks consistent with the hydrogenated isotopologues. Notably, in S187, the NH2D line demonstrates stronger emission by a factor of than NH3, but it is located at the edge of the map. The emission is weak in most of the sources.
-
2.
The kinetic temperature was estimated from CH3CCH and NH3 lines, as well as using the integrated intensity ratios of the H13CN and HN13C lines and their main isotopologues. The Tkin(HCN/HNC) maps show a good agreement with the estimates derived from the CH3CCH and NH3 lines in the range of 20 to 40 K. Using the =2–1/1–0 integrated line ratios and the Tkin(HCN/HNC) with the RADEX code, we have estimated the gas density. Densities are cm-3.
-
3.
The abundances relative to H2 are for DCO+ and DNC, for and for NH2D. The relative abundances of these species decrease with increasing temperature. However, the DCN/H2 ratio is almost constant ().
-
4.
We calculated the total column density of deuterated molecules and their hydrogenated isotopologues to determine the deuterium fraction. The are 0.001–0.05 for DCO+, 0.001–0.02 for DCN, 0.001–0.05 for DNC and 0.02–0.4 for NH2D. The D/H ratios decrease with increasing temperature in the range of 20–40 K and slightly vary at cm-3. The deuterium fraction of is 0.008–0.1 in the temperature range of 20–25 K and at the density cm-3.
In addition, we compared those results with the model predictions and observations from the literature (see Figs. 10, 11). The observational results agree with the predictions of chemical models (although in some cases there are significant differences). The values range is mostly consistent with those found in other works.
-
5.
In DR21(OH), para-NH2D at 110 GHz and ortho-NH2D at 86 GHz were detected. We derived the integrated intensity ortho-to-para ratio of NH2D. As a result, the mean value is 2.6, with standard deviation 0.7.
Acknowledgements
This study was supported by the Russian Science Foundation grant No. 22-22-00809. The research is based on observations made by the 041-19 project with the 30-m telescope, as well as observations with the 100-m MPIfR telescope (Max-Planck-Institut für Radioastronomie) in Effelsberg. IRAM is supported by INSU/CNRS (France), MPG (Germany) and IGN (Spain). We acknowledge the staff of both observatories for their support in the observations. The authors are grateful to the anonymous reviewer for useful comments that improved the quality of the manuscript.
Data Availability
The original data obtained with IRAM-30m are available under the IRAM Data Archive. The data underlying this article will be shared on reasonable request to the corresponding author.
References
- Albertsson et al. (2013) Albertsson T., Semenov D. A., Vasyunin A. I., Henning T., Herbst E., 2013, ApJS, 207, 27
- Askne et al. (1984) Askne J., Hoglund B., Hjalmarson A., Irvine W. M., 1984, A&A, 130, 311
- Astropy Collaboration et al. (2022) Astropy Collaboration et al., 2022, ApJ, 935, 167
- Balança et al. (2020) Balança C., Scribano Y., Loreau J., Lique F., Feautrier N., 2020, MNRAS, 495, 2524
- Bergin et al. (1994) Bergin E. A., Goldsmith P. F., Snell R. L., Ungerechts H., 1994, ApJ, 431, 674
- Beuther et al. (2022) Beuther H., et al., 2022, A&A, 665, A63
- Bouhafs et al. (2017) Bouhafs N., Rist C., Daniel F., Dumouchel F., Lique F., Wiesenfeld L., Faure A., 2017, MNRAS, 470, 2204
- Burns et al. (2015) Burns R. A., Imai H., Handa T., Omodaka T., Nakagawa A., Nagayama T., Ueno Y., 2015, MNRAS, 453, 3163
- Caselli et al. (1999) Caselli P., Walmsley C. M., Tafalla M., Dore L., Myers P. C., 1999, ApJ, 523, L165
- Coutens et al. (2014) Coutens A., et al., 2014, MNRAS, 445, 1299
- Crapsi et al. (2005) Crapsi A., Caselli P., Walmsley C. M., Myers P. C., Tafalla M., Lee C. W., Bourke T. L., 2005, ApJ, 619, 379
- Daniel et al. (2014) Daniel F., Faure A., Wiesenfeld L., Roueff E., Lis D. C., Hily-Blant P., 2014, MNRAS, 444, 2544
- Denis-Alpizar et al. (2020) Denis-Alpizar O., Stoecklin T., Dutrey A., Guilloteau S., 2020, MNRAS, 497, 4276
- Di Francesco et al. (2008) Di Francesco J., Johnstone D., Kirk H., MacKenzie T., Ledwosinska E., 2008, ApJS, 175, 277
- Dubernet et al. (2013) Dubernet M. L., et al., 2013, A&A, 553, A50
- Feng et al. (2019) Feng S., Caselli P., Wang K., Lin Y., Beuther H., Sipilä O., 2019, ApJ, 883, 202
- Fontani et al. (2011) Fontani F., et al., 2011, A&A, 529, L7
- Fontani et al. (2014) Fontani F., Sakai T., Furuya K., Sakai N., Aikawa Y., Yamamoto S., 2014, MNRAS, 440, 448
- Fontani et al. (2015) Fontani F., Busquet G., Palau A., Caselli P., Sánchez-Monge Á., Tan J. C., Audard M., 2015, A&A, 575, A87
- Gerner et al. (2015) Gerner T., Shirley Y. L., Beuther H., Semenov D., Linz H., Albertsson T., Henning T., 2015, A&A, 579, A80
- Hacar et al. (2020) Hacar A., Bosman A. D., van Dishoeck E. F., 2020, A&A, 635, A4
- Harris et al. (2020) Harris C. R., et al., 2020, Nature, 585, 357
- Hernández Vera et al. (2017) Hernández Vera M., Lique F., Dumouchel F., Hily-Blant P., Faure A., 2017, MNRAS, 468, 1084
- Hildebrand (1983) Hildebrand R. H., 1983, QJRAS, 24, 267
- Hirota et al. (1998) Hirota T., Yamamoto S., Mikami H., Ohishi M., 1998, ApJ, 503, 717
- Ho & Townes (1983) Ho P. T. P., Townes C. H., 1983, ARA&A, 21, 239
- Hunter (2007) Hunter J. D., 2007, Computing in Science and Engineering, 9, 90
- Kauffmann et al. (2008) Kauffmann J., Bertoldi F., Bourke T. L., Evans N. J. I., Lee C. W., 2008, A&A, 487, 993
- Keown et al. (2019) Keown J., et al., 2019, ApJ, 884, 4
- Ladeyschikov et al. (2019) Ladeyschikov D. A., Bayandina O. S., Sobolev A. M., 2019, AJ, 158, 233
- Li et al. (2022) Li Y., Wang J., Li J., Liu S., Luo Q., 2022, MNRAS, 512, 4934
- Marsh et al. (2015) Marsh K. A., Whitworth A. P., Lomax O., 2015, MNRAS, 454, 4282
- Marsh et al. (2017) Marsh K. A., et al., 2017, MNRAS, 471, 2730
- Moscadelli et al. (2009) Moscadelli L., Reid M. J., Menten K. M., Brunthaler A., Zheng X. W., Xu Y., 2009, ApJ, 693, 406
- Müller et al. (2005) Müller H. S. P., Schlöder F., Stutzki J., Winnewisser G., 2005, Journal of Molecular Structure, 742, 215
- Newville et al. (2014) Newville M., Stensitzki T., Allen D. B., Ingargiola A., 2014, LMFIT: Non-Linear Least-Square Minimization and Curve-Fitting for Python, Zenodo, doi:10.5281/zenodo.11813
- Oliveira et al. (2003) Oliveira C. M., Hébrard G., Howk J. C., Kruk J. W., Chayer P., Moos H. W., 2003, ApJ, 587, 235
- Ossenkopf & Henning (1994) Ossenkopf V., Henning T., 1994, A&A, 291, 943
- Ott et al. (1994) Ott M., Witzel A., Quirrenbach A., Krichbaum T. P., Standke K. J., Schalinski C. J., Hummel C. A., 1994, A&A, 284, 331
- Palagi et al. (1993) Palagi F., Cesaroni R., Comoretto G., Felli M., Natale V., 1993, A&AS, 101, 153
- Pazukhin et al. (2022) Pazukhin A. G., Zinchenko I. I., Trofimova E. A., Henkel C., 2022, Astron. Rep., 66, 1302
- Pillai et al. (2012) Pillai T., Caselli P., Kauffmann J., Zhang Q., Thompson M. A., Lis D. C., 2012, ApJ, 751, 135
- Pirogov et al. (2003) Pirogov L., Zinchenko I., Caselli P., Johansson L. E. B., Myers P. C., 2003, A&A, 405, 639
- Redaelli et al. (2021) Redaelli E., Bovino S., Giannetti A., Sabatini G., Caselli P., Wyrowski F., Schleicher D. R. G., Colombo D., 2021, A&A, 650, A202
- Roueff et al. (2005) Roueff E., Lis D. C., van der Tak F. F. S., Gerin M., Goldsmith P. F., 2005, A&A, 438, 585
- Roueff et al. (2007) Roueff E., Parise B., Herbst E., 2007, A&A, 464, 245
- Russeil et al. (2007) Russeil D., Adami C., Georgelin Y. M., 2007, A&A, 470, 161
- Ryabukhina et al. (2022) Ryabukhina O. L., Kirsanova M. S., Henkel C., Wiebe D. S., 2022, MNRAS, 517, 4669
- Rygl et al. (2010) Rygl K. L. J., Brunthaler A., Reid M. J., Menten K. M., van Langevelde H. J., Xu Y., 2010, A&A, 511, A2
- Rygl et al. (2012) Rygl K. L. J., et al., 2012, A&A, 539, A79
- Sakai et al. (2012) Sakai T., Sakai N., Furuya K., Aikawa Y., Hirota T., Yamamoto S., 2012, ApJ, 747, 140
- Schneider et al. (2010) Schneider N., Csengeri T., Bontemps S., Motte F., Simon R., Hennebelle P., Federrath C., Klessen R., 2010, A&A, 520, A49
- Schöier et al. (2005) Schöier F. L., van der Tak F. F. S., van Dishoeck E. F., Black J. H., 2005, A&A, 432, 369
- Sipilä et al. (2015) Sipilä O., Harju J., Caselli P., Schlemmer S., 2015, A&A, 581, A122
- Sipilä et al. (2019) Sipilä O., Caselli P., Harju J., 2019, A&A, 631, A63
- Tafalla et al. (2004) Tafalla M., Myers P. C., Caselli P., Walmsley C. M., 2004, A&A, 416, 191
- Tan et al. (2013) Tan J. C., Kong S., Butler M. J., Caselli P., Fontani F., 2013, ApJ, 779, 96
- Tan et al. (2014) Tan J. C., Beltrán M. T., Caselli P., Fontani F., Fuente A., Krumholz M. R., McKee C. F., Stolte A., 2014, Protostars and Planets VI, pp 149–172
- Trofimova et al. (2020) Trofimova E. A., Zinchenko I. I., Zemlyanukha P. M., Thomasson M., 2020, Astron. Rep., 64, 244
- Turner (2001) Turner B. E., 2001, ApJS, 136, 579
- Valdettaro et al. (2001) Valdettaro R., et al., 2001, A&A, 368, 845
- Virtanen et al. (2020) Virtanen P., et al., 2020, Nature Methods, 17, 261
- Wienen et al. (2021) Wienen M., Wyrowski F., Walmsley C. M., Csengeri T., Pillai T., Giannetti A., Menten K. M., 2021, A&A, 649, A21
- Yan et al. (2023) Yan Y. T., et al., 2023, A&A, 670, A98
- Zavagno et al. (1994) Zavagno A., Deharveng L., Caplan J., 1994, A&A, 281, 491
- Zinchenko et al. (1994) Zinchenko I., Forsstroem V., Lapinov A., Mattila K., 1994, A&A, 288, 601
- Zinchenko et al. (1997) Zinchenko I., Henning T., Schreyer K., 1997, A&AS, 124, 385
- Zinchenko et al. (1998) Zinchenko I., Pirogov L., Toriseva M., 1998, A&AS, 133, 337
- Zinchenko et al. (2009) Zinchenko I., Caselli P., Pirogov L., 2009, MNRAS, 395, 2234
- van der Tak et al. (2007) van der Tak F. F. S., Black J. H., Schöier F. L., Jansen D. J., van Dishoeck E. F., 2007, A&A, 468, 627
Appendix A Figures
This section contains additional figures for S187, S231, DR21(OH) and NGC7538. Figure 12 illustrates the integrated intensity maps. Figure 13 shows the kinetic temperature maps. Figure 14 represents the volume gas density H maps. Figures 15 and 16 visualise maps of the deuterium fraction for HCO+, HCN, HNC and NH3.