Self-similarity of turning avalanches in schooling fish
Abstract
Groups of animals are observed to transmit information across them with propagating waves or avalanches of behaviour. These behavioral cascades often display scale-free signatures in their duration and size, ranging from activating a single individual to the whole group, signatures that are commonly related to critical phenomena from statistical physics. A particular example is given by turning avalanches, where large turns in the direction of motion of individuals are propagated. Employing experimental data of schooling fish, we examine characteristics of spontaneous turning avalanches and their dependency with schools of different number of individuals. We report self-similar properties in the avalanche duration, size and inter-event time distributions, as well as in the avalanche shape. We argue that turning avalanches are a result of collective decision-making processes to select a new direction to move. They start with the group having low speed and decreasing the coordination, but once a direction is chosen, speed increases and coordination is restored. We report relevant boundary effects given by wall interactions and by individuals at the border of the group. We conclude investigating spatial and temporal correlations using the concept of aftershocks from seismology. Contrary to earthquakes, turning avalanches display statistically significant clustered events only below a given time scale and follow an Omori law for aftershocks with a faster decay rate exponent than that observed in real earthquakes.
I Introduction
A fascinating and controversial hypothesis in biology is that some systems may operate close to a critical point from statistical physics, separating an ordered from a disordered state of the system [1, 2, 3]. Biological systems at a critical point are believed to posses functional advantages such as optimality in signal detection, storing and processing, large correlations in coordinated behaviour and widest spectrum of possible responses [4, 5, 6]. Criticality is often associated to scale invariance, exemplified by power-law distributions lacking relevant characteristic scales besides natural cut-offs [7, 1, 2]. In particular, this is observed for systems exhibiting spatiotemporal activity in the form of cascades or avalanches with variable duration and size, which at the critical point are distributed as power laws with anomalously large variance. There has been evidence of criticality signatures in many different biological systems, ranging from neural activity and brain networks, gene regulatory networks, collective behaviour of cells or collective motion [4, 5, 8].
The field of collective motion, in particular, studies the group movement patterns exhibited by social organisms, such as flocks of birds, fish schools, insect swarms, herds of mammals and human crowds [9, 10]. In this context, analytical and experimental studies of moving animal groups suggest the existence of phase transitions between phases of coherent and incoherent motion [11, 12, 13, 14, 15]. Moreover, groups of animals can transmit information across the group in the form of propagating waves or avalanches of behaviour, as occurs in fish schools [16, 17, 18, 19, 20, 21, 22, 23], honeybees [24], bird flocks [25], sheep herds [26] or macaque monkeys [27]. Such behavioural cascades are typically represented by behavioral shifts in the speed, acceleration or heading of individuals, and can be generated from responses to the detection of predators or sources of food, or even arise spontaneously. From a physical perspective, they can be related to critical systems with large susceptibility, but from a biological point of view they can occur when individuals follow the behaviour of others without regarding their own information [28]. Avalanche dynamics can transition from being supercritical with local changes propagating through the entire group, critical with changes propagating at all possible scales of the system, or subcritical with changes remaining local [29]. There is evidence that the state of criticality can be regulated by moving animal groups [27, 20, 21].
An example of behavioural cascades is given by turning avalanches [22], consisting in the propagation across the group of large changes in the heading direction of individuals, where large is defined comparing to a predefined turning threshold. Studying schooling fish of the species black neon tetra Hyphessobrycon herbertaxelrodi [22], the duration and size distributions of turning avalanches were observed to display scale-free signatures and fulfill a scaling relationship for different turning thresholds, resembling a critical system. In addition, the scale-free nature of turning avalanches was related to the presence of leadership structures, where leaders were identified as individuals displaying an unusually large probability to start a turning avalanche [22].
Here we study empirically spontaneous turning avalanches in schooling fish considering the effects of schools with different numbers of individuals. We first revise the definition of turning avalanches from individual turning rates and analyze basic avalanche metrics. We explore their statistical distributions and the dependency with schools of different number of individuals, finding robust scale-free distributions for the size, duration and time between avalanches. The scaling of the distributions as a function of the turning threshold and the number of individuals in the school is related to the density of avalanches in time, which allows to collapse the distributions for a fixed avalanche density. Next, we investigate how avalanches are triggered in space, time and by individual initiators. We also explore the dynamical evolution of avalanches and its relation with the state of the school. Finally, we analyze spatial and temporal correlations in avalanches borrowing the concept of aftershocks from seismology.
II Experimental data
We employ schooling fish of the species black neon tetra (Hyphessobrycon herbertaxelrodi), a small freshwater fish of average body length 2.5 cm that has a strong tendency to form cohesive, highly polarized and planar schools [30]. The experiments, performed at the Scientific and Technological Centers UB (CCiTUB), University of Barcelona (Spain), consisted in schools of and individuals freely swimming in a square tank of side cm with a water column of cm of depth, resulting in an approximately two-dimensional movement. Videos of the fish movement were recorded with a digital camera at 50 frames per second, with a resolution of pixels per frame, the side of the tank measuring pixels. Digitized individual trajectories were obtained from the video recordings using the open source software idtracker.ai [31]. Invalid values returned by the program caused by occlusions were corrected in a supervised way, semi-automatically interpolating with spline functions (now incorporated in the Validator tool from version 5 of idtracker.ai). For better accuracy, we projected the trajectories in the plane of the fish movement, warping the tank walls of the image into a proper square (for details see Ref. [32]). We smoothed the trajectories with a Gaussian filter with , truncating the filter at [33]. Individual velocities and accelerations were obtained from the Gaussian filter using derivatives of the Gaussian kernel.
We discarded recordings where fish stop for prolonged periods. We implement this quantitatively applying a Gaussian filter with to the mean speed of individuals and discarding sequences that go below a given threshold . The remaining experiments we analyze consist in 6 independent recordings (performed on different days and with different individuals) of fish during min (90000 frames), 3 recordings of fish during min, 3 recordings of fish during min and 3 recordings of fish during min (180000 frames). The data with fish was previously used in Ref. [32].
III Avalanche definition and basic observables
Behavioral avalanches in fish have been defined measuring changes of different quantities. Here we follow Ref. [22], where cascades were computed in terms of large changes in the heading of individuals, defined by their velocity vector. In order to remove the dependency with the experimental frame rate of the recordings, we measure the changes in time of the heading in terms of the turning rate , defined as the absolute value of the angular velocity, i.e.
| (1) |
where and are the instantaneous velocity and acceleration of an individual respectively, and is the modulus of the instantaneous velocity. See Appendix A for a derivation of this expression. We consider the absolute value due to symmetry in the turning direction. Notice also that this definition operates in continuous time and is defined, once velocity and acceleration are computed, for a single frame, in contrast to the turning angle used in Ref. [22].
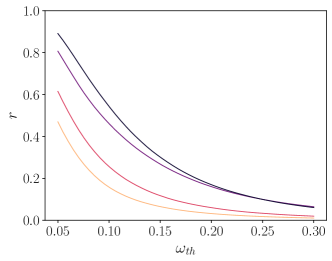
In Fig. 1a we show the probability density function (PDF) of the turning rate , observed in schools of different number of individuals . Here and in the following, we work in natural units of pixels and frames for distance and time, respectively. In addition, error bands in the PDF plots are calculated from the standard deviation of a Bernoulli distribution with the probability given by the fraction of counts in each bin of the numerical PDF [34]. As we can see, schools of different number of individuals show essentially the same behavior in their turning rate distributions. Most of the time, the turning rate is very small and uniformly distributed, corresponding to fish swimming locally in a straight trajectory. In rare instances, however, large turning rates can be observed, in which individuals swiftly rearrange their headings and reorient their direction of motion. Inspired by avalanche behavior in condensed matter physics [35], we introduce a turning threshold separating small from large turns. Considering an active fish as one with a turning rate , we introduce the dynamical variable defined as the number of active fish observed at frame . Then, sequences of consecutive frames in which (i.e. in which there is at least one active fish) define a turning avalanche. In the Supplemental Material Video 1 we show some examples of large turning avalanches for a school of fish 111See Supplemental Material at http://link.aps.org/supplemental/ XXX for supplemental videos and figures..
The most basic characterization of turning avalanches is given by the duration and size of avalanches, and by their inter-event time . An avalanche starting at frame has duration if the sequence of dynamic variables fulfills , for , and . The size of an avalanche is given by the total number of active fish in whole duration of the avalanche, i.e. . The inter-event time between two consecutive avalanches is given by the number of frames between the end of one avalanche and the start of the next one, that is, by a sequence fulfilling , for , and , where indicates the last frame of the first avalanche [37].
The effects of the turning threshold in avalanches can be measured with the activity rate , defined as the probability that a randomly chosen frame belongs to an avalanche. We compute it as the ratio between the number of frames with activity and the total number of frames in the experimental series. As we can see from Fig. 1b, for fixed the activity rate decreases with the turning threshold , since by increasing we are decreasing the turning rates that we consider large and we find less frames with . On the other hand, increasing the number of individuals at fixed results in an increase of the activity rate. We can interpret this as a school with larger number of individuals has a higher probability for any of them to display a large turning rate.
IV Statistical distributions
In Ref. [22] the statistical distributions of duration and size for turning avalanches were studied for different turning thresholds and for schools of fixed number of individuals , using recordings of short duration of 12000 frames (corresponding to 10 minutes). The results obtained were compatible with long-tailed power-law distributions of the form:
| (2) |
The scaling exponents and were estimated using an approach inspired by the finite-size scaling method [38], leading to the average values and .
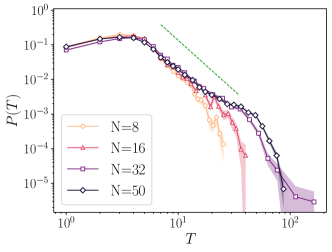
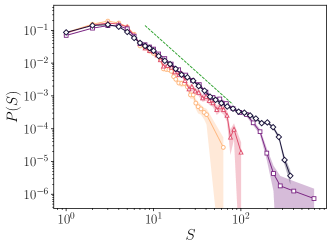
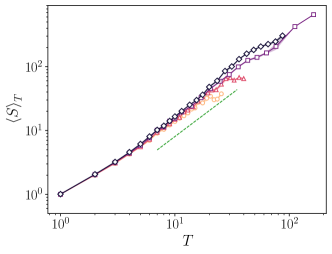
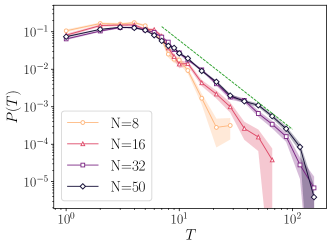
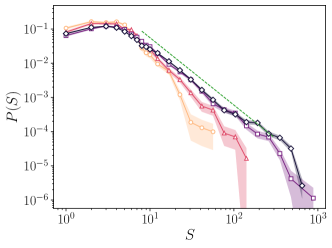
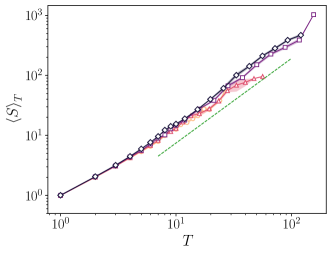
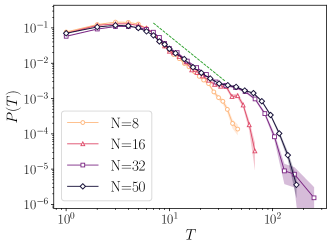
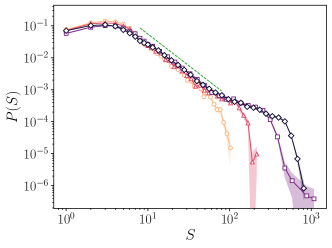
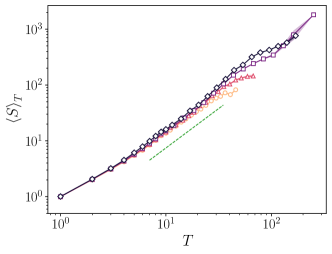
With the larger statistics of our experiments, for a fixed turning threshold and for schools of different number of individuals , we show the duration and size distributions in Figs. 2a and 2b, respectively. We find that both PDFs show the same power-law scaling behavior for intermediate values of the corresponding variables, limited by a peak for low values and a fast decaying (exponential) tail. Interestingly, distributions for schools of different number of individuals collapse onto the same functional form with the exception of the exponential tail, which can be interpreted in terms of finite size effects, as larger schools tend to create avalanches of larger duration and size. The average exponents, obtained from a linear regression in double logarithmic scale in the scaling region, take the values and , which are statistically compatible with the ones obtained in Ref. [22]. Different values of lead to similar average exponents (e.g and for , see Supplemental Material Fig. S1). The size and duration of individual avalanches are not independent, as we can check by plotting the average size of avalanches of duration , see Fig. 2c. From this figure we can observe a superlinear behavior
| (3) |
with . The value of can be related to the exponents of the duration and size distributions as [39, 22]
| (4) |
Our experimental value is fully compatible with the theoretical prediction for (experimental and theoretical prediction for , see Supplemental Material Fig. S1c).
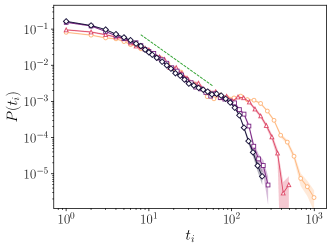
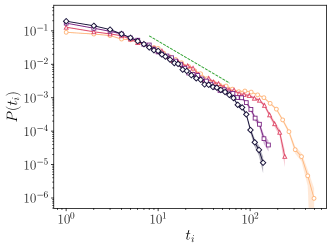
Finally, in Fig. 2d we show the PDF of the inter-event time for and for schools of different number of individuals . We find again an intermediate scale-free region, limited between the small time behavior and an exponentially decreasing tail. Here also plots for different number of individuals collapse on the same functional form, with the exception of the fast decaying tail. A fit to the form
| (5) |
in the scaling region leads to an average exponent . The value of this exponent is independent of the value of the turning threshold (see Supplemental Material Fig. S1d). It is noteworthy that the behavior of the decaying tails with is reversed with respect to the duration and size PDFs, with larger number of individuals leading to smaller inter-event times. This observation is consistent with the behavior of the activity rate , as schools with larger number of individuals have a higher probability to be in an avalanche.
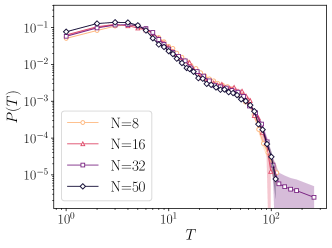
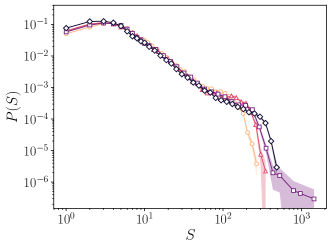
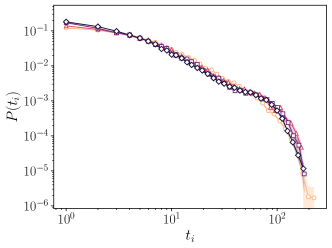
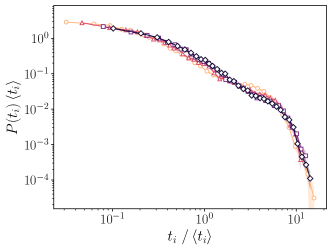
The dependency of the exponential tails in the duration and size distributions with the turning rate threshold reported on Ref. [22] and with the school size observed here, suggests the possibility of a relationship between and resulting in avalanches with equivalent distributions. In order to test for this hypothesis, we select the threshold that, for each value of , leads to a fixed activity rate . From Fig. 1b we estimate, for , for , respectively. We plot the resulting distributions in Figs 3a, 3b and 3c for the duration , size and inter-event time , respectively. In a system with no temporal correlations in the activity of individuals, a fixed activity rate results in duration and inter-event time distributions collapsing onto the same functional, exponential forms, see Appendix B. Surprisingly, even if this is not the case for empirical turning avalanches in schooling fish, both the duration and inter-event time distributions achieve a data collapse at fixed . On the other hand, the size distributions do not collapse perfectly, possibly because correlations in the turning rates of individuals at a given frame, which results in more active individuals in an avalanche frame for schools of larger number of individuals. Interestingly, also in the uncorrelated case the size distributions are not expected to collapse, see Appendix B.
On a similar note, for avalanches in different contexts, it has been found that the inter-event time distributions can be collapsed into a scaling form [40, 41],
| (6) |
where is a universal scaling function, and the only characteristic scale is the average inter-event time . In Fig. 3d we show this sort of collapse for a turning threshold ; as we can see, it also applies to turning avalanches in schooling fish. This reveals self-similar behaviour typical from critical systems, with the inter-event time distributions only differing in their average value for schools of different number of individuals. In the uncorrelated case, this collapse is also recovered, but now only in the limit of a large average inter-event time, see Appendix B.
V Avalanche triggering
In this Section we explore whether avalanches are triggered in some preferential points in space or time, as well as by particular individuals in the group. Here and in the following sections we show results for avalanches in a school of individuals, which have the longest recording time, and a turning threshold .
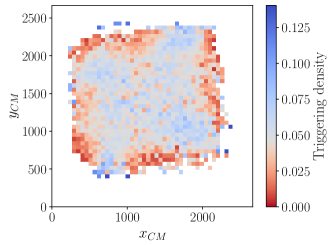
A plausible hypothesis is that avalanches are more frequently triggered near the tank walls due to boundary effects. These could arise when fish are approaching a wall and need to perform a large turn in order to avoid colliding with it. To check this hypothesis we consider the position for the center of mass (CM) of the school, defined as
| (7) |
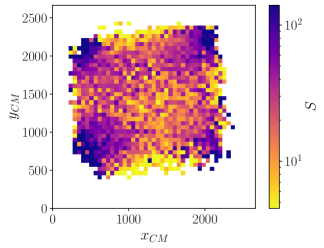
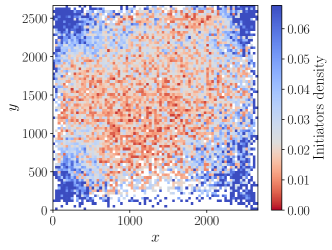
where are the positions of the fish at a given instant of time. We define the triggering location of an avalanche as the position of the CM at the first frame of the avalanche, and study the distribution of these triggering locations on the surface of the tank. Because fish do not swim uniformly all around the tank, in order to extract a statistically significant density of triggering locations we normalize their counts against the counts of all observed positions of CM along the time evolution of the school. We show this in Fig. 4a, where the axis orientations correspond to the tank walls. The grey region in the colormap, separating the low density (red) and high density (blue) values, corresponds to the expected density in the absence of correlations, which we calculate from the total counts of triggering locations divided by the total counts of positions of CM. As we can see in this plot, the distribution of avalanches in the tank is quite homogeneous, although there is a slight tendency for avalanches to occur away from the walls. However, if we display the average size of avalanches generated at the different triggering locations, we obtain a different picture, Fig. 4b, in which avalanches of larger sizes tend to occur more frequently near the tank corners. This observation suggests that interactions with the tank walls indeed promote the emergence of large turning avalanches, resulting in important orientation rearrangements of the school.
Since larger avalanches seem to be originating from interactions with the walls, we explore whether these interactions are responsible for the features of the fast decaying tails observed in the duration and size distributions. To do so, we measure the statistical distributions of avalanches with triggering locations away from the walls, which we restrict to occur inside the square positioned at the center of the tank with side , where is the side of the tank, see Supplemental Material Fig. S2. Although we have limited statistics, particularly for schools of small number of individuals, we obtain distributions that have longer power law regions with the same characteristic exponents as in the unrestricted case.
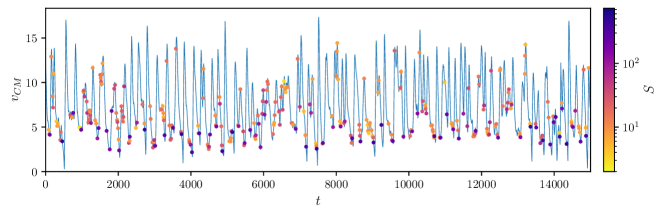
To understand temporal triggerings of avalanches, we study how the avalanche starting time relates to the group dynamics represented by the center of mass speed , which is defined as
| (8) |
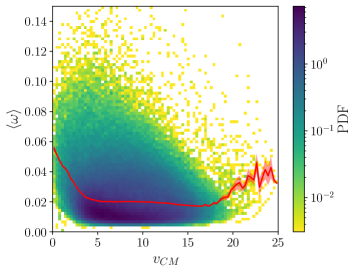
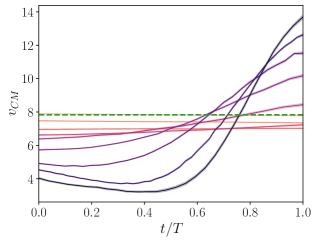
The center of mass speed is characterised for having oscillations due to a burst-and-coast mechanism of the individuals [42, 43, 44], with increases associated to an active phase powered by the fish muscles and decreases coming from a passive gliding phase. In Fig. 4c we plot, for a time window of 5 min, the temporal evolution of the center of mass speed as the blue line. We mark with dots avalanches triggered at the corresponding time and speed , color-code by their size . We only consider avalanches that propagated to individuals other than the ones active in the first frame of the avalanche. As we can observe, while small size avalanches tend to be randomly distributed over different values of , large avalanches are more often located near the minima of the speed, even when the minimum changes across time. We notice that this behavior does not originate from small speeds being related to large turning rates, because we find the turning rate is inversely related to the speed only for and appears to be independent for larger speeds (see Supplemental Material Fig. S3). Instead, this suggests that large avalanches may emerge from turnings related to decision-making processes occurring at the onset of the active phase of the burst-and-coast mechanism [45, 43, 46].
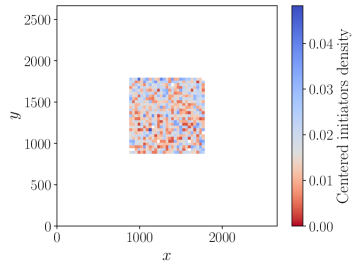
Apart from the spatiotemporal triggering of avalanches, we can study how avalanches are triggered at the individual level within the school considering avalanche initiators, defined as the individuals that are active on the first frame of the avalanche. Previously it was observed that some individuals have a probability larger than random fluctuations to be initiators [22]. Here instead we focus on the location of individual initiators within the experimental tank and inside the school. Again, we have to keep in mind that individuals are not located uniformly around the tank at the start of an avalanche. Therefore, in order to extract a statistically significant density of initiators locations within the group, we normalize their counts against the counts of the positions of all individuals at the onset time of the avalanche. We show the resulting plot in Fig. 4d. We find that initiators tend to accumulate near the tank walls, and particularly at the corners. This is compatible with the idea that large turning avalanches are promoted by interactions with the tank walls.
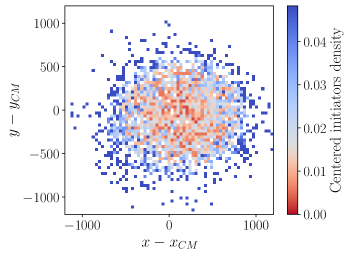
In order to explore the natural relative position of avalanche initiators within the school, we select individuals that do not have relevant interactions with the tank walls. We define centered individuals as those that are positioned in the central square of the tank with side , where is the side of the tank. If we plot the density of the positions of centered initiators within the tank normalised by the positions of all centered individuals at the onset time of an avalanche (see Supplemental Material Fig. S4), indeed we see a uniform pattern that confirms the idea that centered individuals do not experience significant interactions with the tank walls. We study the relative position of centered initiators within the school in Fig. 4e, where we plot the density of the positions of centered initiators normalized against all centered individuals at the triggering time of the avalanche in the center of mass reference frame. In this plot the -coordinate is directed along the direction of motion of the center of mass. As we can see, initiators of avalanches away from the tank walls accumulate on the boundary of the school and without any preferred direction along the movement of the group.
VI Dynamical evolution of avalanches
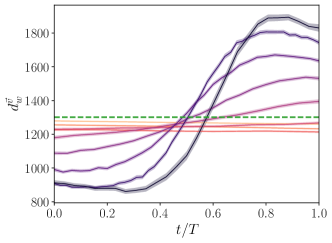
In this Section we examine characteristics of the school evolution during the development of an avalanche. In Ref. [22] it was suggested that turning avalanches were related to changes of the global orientation of the school, accompanied by an increase in the group speed and a decrease and a delayed increase of the global order. Here we further test these claims in a more systematic way. In order to compare avalanches with different sizes , we first normalize the temporal evolution of the avalanche by its duration , and then average the dynamics over groups of avalanches with similar sizes.
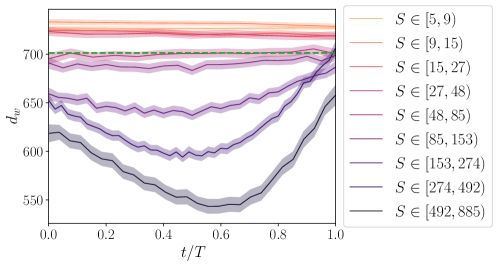
First, we investigate the speed of the group given by the center of mass speed, , defined in Eq. (8). We show how it evolves during a turning avalanche, averaged for different sizes , in Fig. 5a. For comparison, we plot the average value over the whole experiment as the green dashed horizontal line. We observe that avalanches tend to start below the average , and that avalanches of small size do not alter the school speed noticeably. On the other hand, larger size avalanches tend to originate at lower values of and increase the school speed during their evolution.
As a second characteristic of the school we consider the global order measured in terms of the polarization [12],
| (9) |
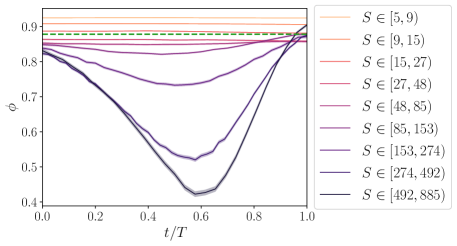
which tends to if the school is ordered and all individuals move in the same direction, and takes a value close to zero if the school is disordered and fish move in random and independent directions [12]. We show its evolution within an avalanche in Fig. 5b. Small size avalanches tend to start in highly polarized configurations and do not change significantly the level of order. Contrarily, large avalanches tend to start with less ordered configurations than the average and further reduce the order as the avalanche spreads. However, at later stages this trend is reversed and the school recovers a highly ordered state.
To gain further information about the possible role of the walls, we study the dynamical evolution of avalanches with respect to the distance to the tank walls. We define the directed wall distance as the distance from the center of mass of the school to the tank walls along the direction of the velocity of the center of mass. For a square tank, this distance is defined as
| (10) | ||||
where the positions and velocities refer to the center of mass, is the Heaviside step function, which discriminates the forward and backward motion, is the side of the tank, and the two terms in the function refer to the walls on the and coordinates, respectively. We plot the evolution of this quantity during turning avalanches in Fig. 5c. As we can observe, small size avalanches do not alter the directed wall distance. On the other hand, large avalanches tend to start closer to the wall and end at higher directed distances. This indicates that large turning avalanches typically produce a large change of the group orientation from facing a nearby wall to facing a farther away wall. We have also studied the evolution of the distance to the nearest wall, which we refer as the minimum wall distance ,
| (11) |
We observe (see Supplemental Material Fig. S5) that this quantity decreases and has a minimum for large avalanche sizes, indicating that during the avalanche evolution the school tends to approach the closest wall, to later move away from it.
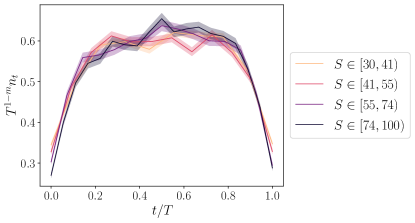
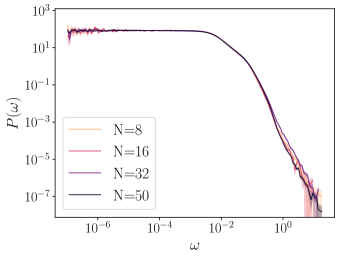
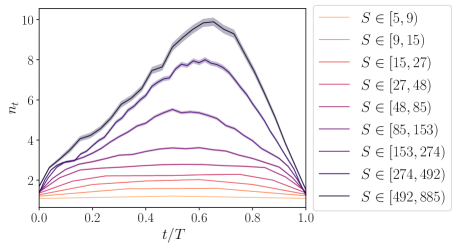
Finally, in Fig. 5d we consider the avalanche shape , defined by the number of active individuals at each frame of a turning avalanche [47]. As we can see, the avalanche shape shows a convex form, with small values at the beginning and the end, and a maximum in between, with a larger value for larger sizes. Many scale-free avalanche systems exhibit a collapse behavior in the avalanche shape given by the scaling relation
| (12) |
where is the exponent relating the average avalanche size with the duration , Eq. 3 [48, 6, 47, 39]. In the case of turning avalanches, this scaling behavior is recovered in avalanches within the power-law scaling regime of the size distribution, as shown in Fig. 6. In this plot we use the value numerically obtained.
VII Aftershock correlations
Another important aspect in avalanche behavior is the presence of correlations, namely, whether the occurrence of an avalanche induces the occurrence of other avalanches, such that they appear clustered in space and/or time [41]. The idea of correlations and clustering in avalanches is closely linked to the concept of main events and aftershocks in seismology [49]. In this context, aftershocks are typically smaller events that occur after a main event in nearby locations and stand-out from the background noise. A relevant result here is the observation of the Omori law, which states that the probability rate to observe an aftershock at a given time after a main event, follows the distribution
| (13) |
where , and are constants, with [50].
In seismology, earthquakes are quantified by their magnitude, which is a measure related to the logarithm of the energy released. Analogously, for turning avalanches we can introduce the magnitude as
| (14) |
where is the size of the avalanche. Considering the observed size distribution from Eq. (2), magnitudes for turning avalanches follow the distribution
| (15) |
with , which is analogous to the well-known Gutenberg-Richter law for earthquakes [51].
In order to classify events (either earthquakes or avalanches) into main events and aftershocks, it is commonly employed the method proposed by Baiesi and Paczuski [52, 53]. This method is based in the definition of the proximity in space-time-magnitude domain from an event to a previous (in time) event [52, 54, 55]. Assuming that events are ordered in time, , the proximity is defined as
| (16) |
where is the time interval between events and , is the spatial distance between the events locations, is the fractal dimension of the set of events positions and is the Gutenberg-Richter law for event , which in our case is given by Eq. (15). In the context of turning avalanches, we have to consider two facts: (i) Avalanches have a finite duration that is comparable to the inter-event time between consecutive avalanches. We therefore consider , , as the number of frames between the end of avalanche and the start of avalanche ; (b) During an avalanche, the school moves. We thus consider the distance , , as the distance between the center of mass of the school at the end of avalanche and the center of mass of the school at the beginning of avalanche . Additionally, the distribution of the positions of the center of mass at the start of avalanches does not seem to show a fractal structure, so we use here .
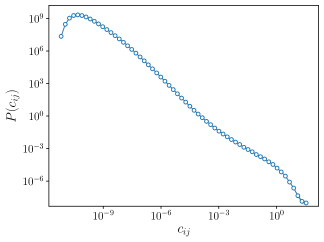
The proximity is a measure of the expected number of events of magnitude to occur, looking backward in time from event within a time interval and distance , in the absence of correlations, in such a way that the time and position of previous avalanches behave as independent Poisson processes [52]. Thus, the lower the value of the proximity, the more unlikely the events and should have occurred by chance and the higher the probability that they are correlated. For this reason, one can define the correlation of event to a previous event as [52]
| (17) |
In Fig. 7a we show the PDF of the correlations for all pairs of turning avalanches with magnitudes (i.e. of size ). As it is observed in earthquakes, this distribution has a power-law tail spanning more than ten orders of magnitude [52, 53].
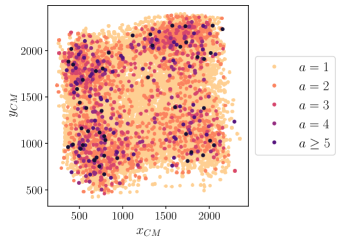
Using the correlations or the proximity , every event can be associated to a nearest neighbour or parent , defined as the event in the past () that maximizes the correlation or minimizes the proximity with , namely , (, ). This proximity is denoted the nearest-neighbour proximity , its time interval and the spatial distance . The set of events with the same parent are considered the aftershocks of that parent. In Fig. 7b we examine the distribution of the triggering locations of parents depending on their number of aftershocks . We find a possible influence of the tank walls, as parents with larger number of aftershocks tend to be located nearer the corners.
In addition, we consider the measure of clustering proposed within this framework in Ref. [54]. This formalism is based in the rescaled time and rescaled space [54, 55], defined as
| (18) | ||||
| (19) |
where is the parent of event and such that
| (20) |
In real earthquakes, it is observed that the joint distribution of and is bimodal. One mode corresponds to background events, and is compatible with a random (Poisson) distribution of times and positions of events. The other mode, on the other hand, corresponds to clustered events occurring closer in space and time [55].
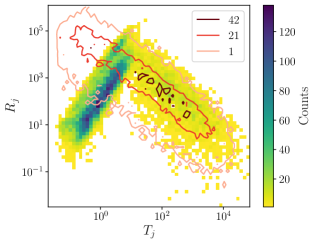
In Fig. 7c we show the joint distribution of and for turning avalanches in terms of a color density plot. In the same figure, we display in terms of a contour plot the joint distribution obtained for randomized data, in which avalanche positions, inter-event times and magnitudes have been shuffled. We find that the experimental data shows clearly two modes in the distribution. In one mode, for large values of , increasing the rescaled time results in a decrease of the rescaled space . This is almost identical to the distribution obtained for the shuffled data, indicating that it corresponds essentially to background, uncorrelated noise. The other mode occurs for smaller values of and displays the opposite behaviour, increasing the rescaled time results in a higher rescaled space . This behaviour is different from the background noise and corresponds to clustered (correlated) avalanches.
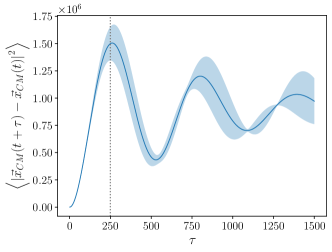
We can understand the time scale separation between the modes taking into account that turning avalanches take place inside a school that is moving around the tank. The school typically performs a recurrent movement on the tank, visiting a given point in the tank with some average period. We can quantitatively analyse this behaviour looking at the mean square displacement of the position of the center of mass, which measures the average displaced distance of the group in time starting from any point in the trajectory (see Supplemental Material Fig. S6). The first maximum occurs around frames and corresponds to the average time the school needs to perform a half-turn around the tank and becomes maximally separated from its initial position. Aftershocks with a lower time interval show an increase in their spatial distance, as the school is moving away from the parent location. After this time and up to very large time intervals, the school may return towards the parent position and we can find aftershocks occurring at lower spatial distances. However, these tend to occur rather randomly and can not be distinguished from random events. This highlights a major difference with earthquakes, where significant correlations can occur in the same location at widely separate instants of time.
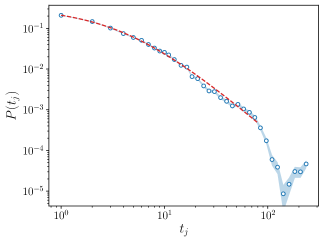
Finally, we examine the Omori law displaying the distribution for the time interval between parents and aftershocks in Fig. 7d. The distribution is computed considering the sequences of aftershocks for each parent, shifting the sequences to set each parent at a common time zero, and stacking all sequences in a single common sequence [56]. From the above reasons, we only consider time intervals below that correspond to significant correlated aftershocks. A least-squares fitting of the empirical data to the Omori law given by Eq. (13) (green dashed line), yields the parameters and . This indicates a value , implying a faster decay rate of aftershocks than in earthquakes.
VIII Discussion
In this paper we have presented an empirical analysis of spontaneous behavioral cascades in schooling fish considering turning avalanches, where large turns in the direction of motion of individuals are propagated across the group. We have analyzed different avalanche metrics, employing tools from avalanche behavior in condensed matter physics and seismology.
At the level of the probability distributions of simple observables, such as avalanche duration, size and inter-event times, we have found clear evidence of scale-free behavior, with distributions showing long tails compatible with a power-law form, as well as scaling relations and a data collapse for a fixed activity rate of the school, relating schools with different number of individuals and the turning threshold defining the avalanche. In addition, the inter-event times display a simple scaling behaviour normalizing by its mean, which has been previously observed in other avalanche systems. Another common observable in avalanche behaviour is given by the avalanche shape, which also exhibits a data collapse given by a scaling relationship with the duration.
The presence of such scale-free signatures can be interpreted in terms of the fish school operating in the vicinity of a critical point. A possible advantage for the school to be near a critical point is efficient collective decision-making and transfer of information across the group. In this regard, we can understand turning avalanches as a process where fish decide collectively the direction to follow. For this reason, it is not surprising we find that large avalanches tend to occur at the onset of the active phase of the burst-and-coast mechanism of the fish locomotion, where decision-making processes to change the direction are believed to occur [45, 43, 46]. In the process of deciding a new collective direction, coordination and group order decreases. However, once a new direction is chosen, speed increases and coordination emerges again. A similar result was found in the phenomenon of collective U-turns, which consists on directional switches for fish swimming in a ring shaped tank [57, 18]. We argue that collective U-turns can be understood as a particular example of turning avalanches.
Boundary effects represented by interactions with the tank walls or by a distinct behaviour of individuals at the border of the group are commonly disregarded in the context of animal collective motion. Here we report significant effects of the tank walls in avalanche behavior. Thus, while the walls do not promote a larger number of avalanches, avalanches in their vicinity tend to have larger sizes and result in correlated avalanche clusters, giving rise to a larger number of aftershocks. This can occur as an obstacle in the movement of the school, such as a tank wall, may disrupt the movement of the group and precipitate the need to decide the subsequent direction [58], which will be necessarily away from the tank walls. Interestingly, however, these large avalanches induced by the tank walls affect mostly the exponential tail of the duration, size and inter-event time distributions, showing that the intermediate scale-free behavior of these distributions is not promoted by the walls, but rather it is an intrinsic property of the turning avalanche mechanisms. In addition, we find boundary effects from individuals at the border of the group, as these are the preferred positions for the initiators of large turning avalanches. This is compatible with previous results that found these positions were related to higher social influence [17, 59].
Our results also connect the separate disciplines of seismology and animal collective motion, analyzing spatial and temporal correlations in turning avalanches employing the concept of aftershocks. Earthquakes, which are a manifestation of the underlying properties of the Earth’s crust, can manifest significant correlations at widely separated time intervals in a given location. However, in turning avalanches of schooling fish we only found significant clustered and correlated events below a time interval corresponding to a half-turn of the school around the tank. This may point to a fundamental property related to lack of collective memory for larger time scales [13]. In addition, we found the probability rate to observe correlated aftershocks after a main event in turning avalanches followed an Omori law with a decay rate exponent , which is significantly faster than in earthquakes ().
We believe our work represents a relevant contribution to the long-standing question of criticality, in particular to animal collective motion and in general to biological systems. Analysis of large data sets of experimental data reporting evidences of criticality have been scarce and are necessary to further elucidate this topic.
Acknowledgements.
We acknowledge financial support from the Spanish MCIN/AEI/10.13039/501100011033, under Projects No. PID2019-106290GB-C21, No. PID2019-106290GB-C22, No. PID2022-137505NB-C21, and No. PID2022-137505NB-C22. A. P. acknowledges a fellowship from the Secretaria d’Universitats i Recerca of the Departament d’Empresa i Coneixement, Generalitat de Catalunya, Catalonia, Spain. We thank P. Romanczuk, H. J. Herrmann, and E. Vives for helpful comments. A.P., M.C.M. and R.P.S. designed the study. E.G. and D.M. acquired the empirical data. D.M. and A.P. processed the empirical data. A.P. and R.P.S. analysed the empirical data. A.P., M.C.M. and R.P.S. analysed the results. A.P. and R.P.S. wrote the paper. All authors commented on the manuscript.Appendix A Turning rate formula
The turning rate is defined as the rate of change of the orientation of the velocity of an individual with time, i.e.
| (21) |
Consider the velocity vector in two instants of time, and . The change of orientation is given by
| (22) |
In the limit , , we have
| (23) | |||||
where is the fish acceleration. Then we can write
| (24) | |||||
recovering the expression for the turning rate in Eq. (1).
Appendix B Duration and inter-event time distributions in the absence of turning rate correlations
Following Ref. [22], we can consider a null model of avalanche behavior in schooling fish in which individuals perform random uncorrelated turning rates, extracted from the empirical distribution . In this case, the probability that, at a given frame, a fish performs a turning rate larger than a threshold (i.e. a fish is active) is given by
| (25) |
while the probability that, at a given frame, at least one fish in a school of individuals performs a turning rate larger than (i.e. there is at least one active fish) is
| (26) |
In this null model, an avalanche of duration implies consecutive frames with at least an active fish, followed by a frame with no active fish. Thus the duration distribution has the normalized form
| (27) |
An inter-event time consists, analogously, of consecutive frames with no active fish, followed by a frame with at least one active fish. Therefore the inter-event time distribution has the form
| (28) |
Finally, the size distribution can be estimated as follows [22]: At each frame during an avalanche, the average number of active fish is , where the normalization factor accounts for the fact that at least one fish was active in the frame considered. Thus, an avalanche of duration has an average size . Transforming the duration distribution Eq. (28), we then have [22]
| (29) |
In all cases, we recover distributions with an exponentially decaying form.
Now, the activity rate , defined as the probability that a randomly chosen frame belongs to an avalanche, is equal to the probability that in a randomly chosen frame there is at least one active fish. This trivially implies
| (30) |
That is, the duration and inter-event time distributions depend only on the activity rate, and can be made to collapse for different values of and leading to the same value of . On the other hand, the size distribution depends additionally on and and thus cannot be made to collapse by fixing .
For the inter-event time distribution Eq. (28), we can write, in the limit of small ,
| (31) |
From Eq. (28), . Thus, from Eq. (28), we have
| (32) |
recovering the scaling relation Eq. (6) with , in the limit of large .
Interestingly, the activity rate in this null model follows the empirical behavior shown in Fig. 1b, as is a growing function of and a decreasing function of .
References
- Stanley [1987] H. E. Stanley, Introduction to Phase Transitions and Critical Phenomena (Oxford University Press, New York, 1987).
- Binney et al. [1992] J. J. Binney, N. J. Dowrick, A. J. Fisher, and M. E. J. Newman, The Theory of Critical Phenomena: An Introduction to the Renormalization Group (Oxford University Press, 1992).
- Yeomans [1992] J. M. Yeomans, Statistical Mechanics of Phase Transitions (Clarendon Press, 1992).
- Muñoz [2018] M. A. Muñoz, Colloquium: Criticality and dynamical scaling in living systems, Reviews of Modern Physics 90, 031001 (2018).
- Mora and Bialek [2011] T. Mora and W. Bialek, Are Biological Systems Poised at Criticality?, Journal of Statistical Physics 144, 268 (2011).
- Beggs and Timme [2012] J. Beggs and N. Timme, Being Critical of Criticality in the Brain, Frontiers in Physiology 3 (2012).
- Binder [1981] K. Binder, Finite size scaling analysis of ising model block distribution functions, Zeitschrift für Physik B Condensed Matter 43, 119 (1981).
- Romanczuk and Daniels [2022] P. Romanczuk and B. C. Daniels, Phase Transitions and Criticality in the Collective Behavior of Animals - Self-Organization and Biological Function, in Order, Disorder and Criticality (WORLD SCIENTIFIC, 2022) pp. 179–208.
- Vicsek and Zafeiris [2012] T. Vicsek and A. Zafeiris, Collective motion, Physics Reports 517, 71 (2012).
- Sumpter [2010] D. J. T. Sumpter, Collective Animal Behavior (Princeton University Press, 2010).
- Toner and Tu [1998] J. Toner and Y. Tu, Flocks, herds, and schools: A quantitative theory of flocking, Physical Review E 58, 4828 (1998).
- Vicsek et al. [1995] T. Vicsek, A. Czirók, E. Ben-Jacob, I. Cohen, and O. Shochet, Novel Type of Phase Transition in a System of Self-Driven Particles, Physical Review Letters 75, 1226 (1995).
- Couzin et al. [2002] I. D. Couzin, J. Krause, R. James, G. D. Ruxton, and N. R. Franks, Collective Memory and Spatial Sorting in Animal Groups, Journal of Theoretical Biology 218, 1 (2002).
- Buhl et al. [2006] J. Buhl, D. J. T. Sumpter, I. D. Couzin, J. J. Hale, E. Despland, E. R. Miller, and S. J. Simpson, From Disorder to Order in Marching Locusts, Science 312, 1402 (2006).
- Tunstrøm et al. [2013] K. Tunstrøm, Y. Katz, C. C. Ioannou, C. Huepe, M. J. Lutz, and I. D. Couzin, Collective States, Multistability and Transitional Behavior in Schooling Fish, PLoS Computational Biology 9, e1002915 (2013).
- Brown et al. [2006] C. Brown, K. N. Laland, and J. Krause, eds., Fish Cognition and Behavior, Fish and Aquatic Resources Series No. 11 (Blackwell Pub, Oxford ; Ames, Iowa, 2006).
- Rosenthal et al. [2015] S. B. Rosenthal, C. R. Twomey, A. T. Hartnett, H. S. Wu, and I. D. Couzin, Revealing the hidden networks of interaction in mobile animal groups allows prediction of complex behavioral contagion, Proceedings of the National Academy of Sciences 112, 4690 (2015).
- Lecheval et al. [2018] V. Lecheval, L. Jiang, P. Tichit, C. Sire, C. K. Hemelrijk, and G. Theraulaz, Social conformity and propagation of information in collective U-turns of fish schools, Proceedings of the Royal Society B: Biological Sciences 285, 20180251 (2018).
- Crosato et al. [2018] E. Crosato, L. Jiang, V. Lecheval, J. T. Lizier, X. R. Wang, P. Tichit, G. Theraulaz, and M. Prokopenko, Informative and misinformative interactions in a school of fish, Swarm Intelligence 12, 283 (2018).
- Sosna et al. [2019] M. M. G. Sosna, C. R. Twomey, J. Bak-Coleman, W. Poel, B. C. Daniels, P. Romanczuk, and I. D. Couzin, Individual and collective encoding of risk in animal groups, Proceedings of the National Academy of Sciences 116, 20556 (2019).
- Poel et al. [2022] W. Poel, B. C. Daniels, M. M. G. Sosna, C. R. Twomey, S. P. Leblanc, I. D. Couzin, and P. Romanczuk, Subcritical escape waves in schooling fish, Science Advances 8, eabm6385 (2022).
- Múgica et al. [2022] J. Múgica, J. Torrents, J. Cristín, A. Puy, M. C. Miguel, and R. Pastor-Satorras, Scale-free behavioral cascades and effective leadership in schooling fish, Scientific Reports 12, 10783 (2022).
- Gómez-Nava et al. [2023] L. Gómez-Nava, R. T. Lange, P. P. Klamser, J. Lukas, L. Arias-Rodriguez, D. Bierbach, J. Krause, H. Sprekeler, and P. Romanczuk, Fish shoals resemble a stochastic excitable system driven by environmental perturbations, Nature Physics , 1 (2023).
- Kastberger et al. [2008] G. Kastberger, E. Schmelzer, and I. Kranner, Social Waves in Giant Honeybees Repel Hornets, PLoS ONE 3, e3141 (2008).
- Attanasi et al. [2014] A. Attanasi, A. Cavagna, L. Del Castello, I. Giardina, T. S. Grigera, A. Jelić, S. Melillo, L. Parisi, O. Pohl, E. Shen, and M. Viale, Information transfer and behavioural inertia in starling flocks, Nature Physics 10, 691 (2014).
- Ginelli et al. [2015] F. Ginelli, F. Peruani, M.-H. Pillot, H. Chaté, G. Theraulaz, and R. Bon, Intermittent collective dynamics emerge from conflicting imperatives in sheep herds, Proceedings of the National Academy of Sciences 112, 12729 (2015).
- Daniels et al. [2017] B. C. Daniels, D. C. Krakauer, and J. C. Flack, Control of finite critical behaviour in a small-scale social system, Nature Communications 8, 14301 (2017).
- Bikhchandani et al. [1992] S. Bikhchandani, D. Hirshleifer, and I. Welch, A Theory of Fads, Fashion, Custom, and Cultural Change as Informational Cascades, The Journal of Political Economy 100, 992 (1992), 2138632 .
- Pruessner [2012] G. Pruessner, Self-Organised Criticality: Theory, Models and Characterisation (Cambridge University Press, 2012).
- Gimeno et al. [2016] E. Gimeno, V. Quera, F. S. Beltran, and R. Dolado, Differences in shoaling behavior in two species of freshwater fish (Danio rerio and Hyphessobrycon herbertaxelrodi)., Journal of Comparative Psychology 130, 358 (2016).
- Romero-Ferrero et al. [2019] F. Romero-Ferrero, M. G. Bergomi, R. C. Hinz, F. J. H. Heras, and G. G. de Polavieja, Idtracker.ai: Tracking all individuals in small or large collectives of unmarked animals, Nature Methods 16, 179 (2019).
- Puy et al. [2023] A. Puy, P. Bartashevich, E. Gimeno, J. Torrents, M. C. Miguel, R. Pastor-Satorras, and P. Romanczuk, Selective social interactions and speed-induced leadership in schooling fish (2023), arxiv:2305.17108 [physics] .
- Nixon and Aguado [2010] M. S. Nixon and A. S. Aguado, Feature Extraction and Image Processing, 2nd ed. (Acad. Press, Amsterdam, 2010).
- Salvat [2019] F. Salvat, PENELOPE-2018: A Code System for Monte Carlo Simulation of Electron and Photon Transport, NEA/MBDAV/R(2019)1 (OECD Nuclear Energy Agency, Boulogne-Billancourt, France, 2019).
- Zapperi [2022] S. Zapperi, Crackling Noise: Statistical Physics of Avalanche Phenomena (Oxford University Press, 2022).
- Note [1] See Supplemental Material at http://link.aps.org/supplemental/ XXX for supplemental videos and figures.
- Zhong et al. [2023] W. Zhong, Y. Deng, and D. Xiong, Burstiness and information spreading in active particle systems, Soft Matter 10.1039/D2SM01470J (2023).
- Cardy [1988] J. Cardy, Finite-Size Scaling, Current Physics-Sources and Comments, Vol. 2 (North Holland, Amsterdam, 1988).
- Friedman et al. [2012] N. Friedman, S. Ito, B. A. W. Brinkman, M. Shimono, R. E. L. DeVille, K. A. Dahmen, J. M. Beggs, and T. C. Butler, Universal Critical Dynamics in High Resolution Neuronal Avalanche Data, Physical Review Letters 108, 208102 (2012).
- Corral [2004] Á. Corral, Universal local versus unified global scaling laws in the statistics of seismicity, Physica A: Statistical Mechanics and its Applications 340, 590 (2004).
- Baró et al. [2014] J. Baró, J.-M. Martín-Olalla, F. J. Romero, M. C. Gallardo, E. K. H. Salje, E. Vives, and A. Planes, Avalanche correlations in the martensitic transition of a Cu–Zn–Al shape memory alloy: Analysis of acoustic emission and calorimetry, Journal of Physics: Condensed Matter 26, 125401 (2014).
- Weihs [1974] D. Weihs, Energetic advantages of burst swimming of fish, Journal of Theoretical Biology 48, 215 (1974).
- Harpaz et al. [2017] R. Harpaz, G. Tkačik, and E. Schneidman, Discrete modes of social information processing predict individual behavior of fish in a group, Proceedings of the National Academy of Sciences 114, 10149 (2017).
- Li et al. [2021] G. Li, I. Ashraf, B. François, D. Kolomenskiy, F. Lechenault, R. Godoy-Diana, and B. Thiria, Burst-and-coast swimmers optimize gait by adapting unique intrinsic cycle, Communications Biology 4, 40 (2021).
- Herbert-Read et al. [2017] J. E. Herbert-Read, E. Rosén, A. Szorkovszky, C. C. Ioannou, B. Rogell, A. Perna, I. W. Ramnarine, A. Kotrschal, N. Kolm, J. Krause, and D. J. T. Sumpter, How predation shapes the social interaction rules of shoaling fish, Proceedings of the Royal Society B: Biological Sciences 284, 20171126 (2017).
- Calovi et al. [2018] D. S. Calovi, A. Litchinko, V. Lecheval, U. Lopez, A. P. Escudero, H. Chaté, C. Sire, and G. Theraulaz, Disentangling and modeling interactions in fish with burst-and-coast swimming reveal distinct alignment and attraction behaviors, PLOS Computational Biology 14, e1005933 (2018).
- Kuntz and Sethna [2000] M. C. Kuntz and J. P. Sethna, Noise in disordered systems: The power spectrum and dynamic exponents in avalanche models, Physical Review B 62, 11699 (2000).
- Sethna et al. [2001] J. P. Sethna, K. A. Dahmen, and C. R. Myers, Crackling noise, Nature 410, 242 (2001).
- Scholz [2019] C. H. Scholz, The Mechanics of Earthquakes and Faulting, 3rd ed. (Cambridge University Press, 2019).
- Omori [1894] F. Omori, On the After-shocks of Earthquakes, Seismological journal of Japan 19, 71 (1894).
- Gutenberg and Richter [1942] B. Gutenberg and C. F. Richter, Earthquake magnitude, intensity, energy, and acceleration*, Bulletin of the Seismological Society of America 32, 163 (1942).
- Baiesi and Paczuski [2004] M. Baiesi and M. Paczuski, Scale-free networks of earthquakes and aftershocks, Physical Review E 69, 066106 (2004).
- Baiesi and Paczuski [2005] M. Baiesi and M. Paczuski, Complex networks of earthquakes and aftershocks, Nonlinear Processes in Geophysics 12, 1 (2005).
- Zaliapin et al. [2008] I. Zaliapin, A. Gabrielov, V. Keilis-Borok, and H. Wong, Clustering Analysis of Seismicity and Aftershock Identification, Physical Review Letters 101, 018501 (2008).
- Zaliapin and Ben-Zion [2020] I. Zaliapin and Y. Ben-Zion, Earthquake Declustering Using the Nearest-Neighbor Approach in Space-Time-Magnitude Domain, Journal of Geophysical Research: Solid Earth 125, 10.1029/2018JB017120 (2020).
- Ouillon and Sornette [2005] G. Ouillon and D. Sornette, Magnitude‐dependent Omori law: Theory and empirical study, Journal of Geophysical Research: Solid Earth 110, 10.1029/2004jb003311 (2005), cond-mat/0407208 .
- Jiang et al. [2017] L. Jiang, L. Giuggioli, A. Perna, R. Escobedo, V. Lecheval, C. Sire, Z. Han, and G. Theraulaz, Identifying influential neighbors in animal flocking, PLOS Computational Biology 13, e1005822 (2017).
- Joshi et al. [2022] V. Joshi, S. Popp, J. Werfel, and H. F. McCreery, Alignment with neighbours enables escape from dead ends in flocking models, Journal of The Royal Society Interface 19, 20220356 (2022).
- Cavagna et al. [2013] A. Cavagna, I. Giardina, and F. Ginelli, Boundary Information Inflow Enhances Correlation in Flocking, Physical Review Letters 110, 168107 (2013).
Supplemental Material
Appendix 1 Supplemental Videos
[h] Examples of large turning avalanches in schooling fish of individuals. The trackings are overlapped to the experimental video. In grey we display individuals that have not participated yet in the avalanche, in cyan the individuals that are active at the current frame, and in blue individuals that were active previously in the avalanche.
Appendix 2 Supplemental Figures