The unipolar solar flares as a manifestation of the ‘topological’ magnetic reconnection
Abstract
Solar flares – which are the most prominent manifestation of the solar activity – typically manifest themselves as a single or a set of luminous arcs (magnetic flux tubes) rooted in regions of opposite polarity in the photosphere. However, a careful analysis of the archival data by Hinode satellite sometimes reveals surprising cases of flaring arcs whose footpoints belong to regions of the same polarity or to areas without any appreciable magnetic field. Despite the counterintuitive nature of this phenomenon, it can be reasonably interpreted in the framework of the so-called ‘topological model’ of magnetic reconnection, where a magnetic null point is formed due to specific superposition of influences from remote sources rather than by local current systems. As a result, the energy release propagates along a separator of the flipping two-dome structure rather than along a fixed magnetic field line. Therefore, the luminous arc needs not to be associated anymore immediately with the magnetic sources. Here, we report both observational cases of the above-mentioned type as well as provide their theoretical model and numerical simulations.
keywords:
Sun: flares – magnetic reconnection – methods: analytical – methods: numerical – software: simulations1 Introduction
Solar flares represent the main form of the solar activity (Svestka, 1976; Sturrock, 1980; Priest, 1981, 1982; Tandberg-Hanssen & Emslie, 1988; Phillips, 1991; Somov, 2013; Janvier et al., 2015). They usually manifest themselves as a set of the luminous arcs – associated with the magnetic field lines – tracing a propagation of heat fluxes and energetic particles from the sites of energy release to the lower layers of atmosphere; e.g. a comprehensive review by Huang et al. (2018). Such arcs should be obviously rooted in the regions of opposite polarity of the magnetic field, as usually confirmed by the corresponding magnetograms.
However, a careful analysis of the archival data on solar flares, outlined in Section 2, enabled us to identify a few surprising cases when the footpoints of the flaring arcs are located in the regions of the same polarity or in the areas without any appreciable magnetic fields. In other words, such arcs cannot be evidently associated with the magnetic field lines. Despite a counterintuitive nature of this phenomenon, as will be shown in Section 3, it can be reasonably described by the so-called ‘topological’ mechanism of the magnetic reconnection, where the spot of energy release is formed due to specific superposition of influences from the remote magnetic sources, rather than by the local current systems. As a result, the hot spot propagates approximately along a separator of the global magnetic field configuration, which is not associated immediately with the magnetic sources.
2 Observational data
The primary observational material for our study was the archive by Solar optical telescope (SOT) onboard Hinode satellite (Kosugi et al., 2007; Tsuneta et al., 2008), which is available in public domain.111https://hinode.nao.ac.jp/en/for-researchers/qlmovies/top.html Particularly, we analysed the patterns of emission in the chromospheric line Ca ii H, which is formed by a moderately heated plasma ( K, i.e. about twice the photospheric temperature). We preferred to use this line because we were interested in the relatively weak flares, where the magnetic field was not substantially disturbed by the local plasma processes in the course of the flare development. Besides, yet another advantage of the line Ca ii H is that – along with the flaring arcs – it enables one to observe also the sunspots and, thereby, to make some preliminary judgement about the structure of magnetic field.
So, we performed initially a visual inspection of the large series of images by Hinode/SOT to find the cases of unusual location of the flaring arcs with respect to the magnetic field sources. Next, these case were analysed more carefully by comparing them with the respective magnetograms recorded by HMI instrument onboard the Solar dynamics observatory (SDO, Pesnell et al., 2012), which are also available online.222http://jsoc.stanford.edu/HMI/hmiimage.html The most interesting situations were observed in the regions of solar surface involving complex geometrical configurations of the moderately-sized sunspots with intermittent polarity. Since they occurred most frequently in the periods of high solar activity, we have analysed in most detail the Hinode’s data for 2014 and 2015.
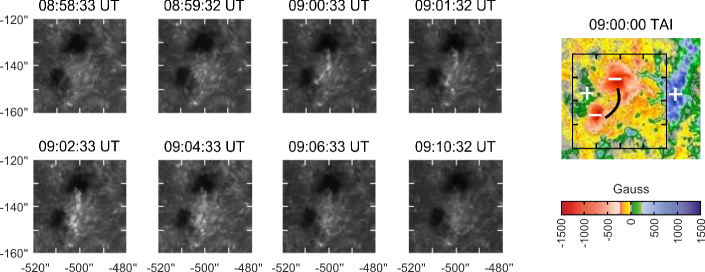
One of the interesting cases is presented in Fig. 1. We can see here a small-scale ( arcsec) flaring arc, rooted at the edges of two sunspots. So, at the first sight, it looks like an ordinary magnetic field line. Surprisingly, inspection of the corresponding magnetogram (right panel in the same figure) shows that these sunspots are of the same (negative) polarity. Therefore, this arc cannot be evidently associated with the field line.
Although such unusual arcs are very seldom, they are identified rather regularly under inspection of the sufficiently long time series of the images. As will be shown in the next section, these phenomena can be well explained by the so-called ‘topological’ ignition of the magnetic reconnection.333To avoid misunderstanding, let us emphasize that the topological methods are widely used in various contexts in the modern solar physics. (e.g., reviews Longcope, 2005; Janvier, 2017, and references therein). In the present paper, we shall call the ‘topological mechanism’ only the particular effect found by Gorbachev et al. (1988).
3 Theoretical model
A commonly-accepted theory of the solar flares is based on the process of magnetic reconnection, when the magnetic field lines break apart and then reconnect again in a new configuration (e.g., monographs Priest & Forbes, 2000; Somov, 2013, and references therein). This process develops in the null (or neutral) point of X-type, where all components of the magnetic field vanish. Such a null point is usually assumed to be formed by the local current systems in the vicinity of the spot of reconnection.
However, in principle, there might be also an absolutely different mechanism for the formation of X-point, namely, due to specific superposition of influences from the remote sources (sunspots), when the local currents are absent at all. The possibility of this option was pointed out for the first time over 30 years ago by Gorbachev et al. (1988), who employed some sophisticated theorems of differential geometry and algebraic topology. So, the corresponding mechanism was called the ‘topological trigger’ of magnetic reconnection. Subsequently, this idea was developed in more detail by Somov (2008, 2013); Oreshina & Somov (2009); Oreshina et al. (2012).
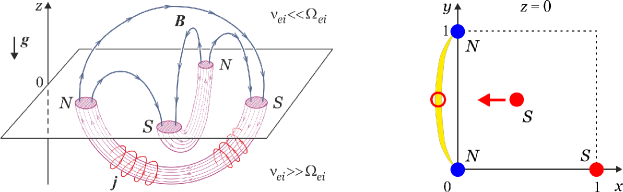
As depicted in the left panel of Fig. 2, the topological model of reconnection is usually formulated in the approximation of potential magnetic field formed by the point-like magnetic sources on (or slightly below) the surface of photosphere (for more details, see Longcope, 1996, and references therein). From the physical point of view, such sources (effective magnetic charges) represent open ends of the magnetic flux tubes, existing in the deeper layers of the Sun, where characteristic collisional frequencies of both electrons and ions are much greater than their gyrofrequencies . In the upper layers (above the photosphere), where the opposite inequality holds, the electric currents j can no longer flow across the magnetic field. So, in the first approximation, the field becomes potential and formed by the effective magnetic charges (the open flux tubes):444 Of course, the potential approximation is inadequate for the large solar flares, whose development in known to be associated with powerful local electric currents; but it should work rather well for the microflares, which are the main subject of the present study.
| (1) |
where is the magnitude of the ’th magnetic charge, and is its radius vector.
In most cases, the pattern of the potential field lines is rather simple. However, as was found by Gorbachev et al. (1988), there are some specific (‘topologically unstable’) configurations of the effective charges in plane where their tiny displacement results in a drastic change of the entire magnetic field. Moreover, such a reconfiguration is associated with birth and a fast motion of the new null point of the field high above the plane of its sources. Just this is a crucial prerequisite for the onset of magnetic reconnection. (Let us emphasize once again that the above-mentioned null point is formed without any local electric currents but solely due to the action by the remote sources.)
In general, searching for the unstable topological configurations is a very hard mathematical task, which was solved by now only for a few particular situations. In fact, the most studied case is the four-charge configuration of the slanted T-shape, shown in the right panel of Fig. 2: It is composed of two pairs of the opposite magnetic charges (two N(orth) and two S(outh)) of the same magnitude. Three of them are located at the vertices of a right equilateral triangle, while the fourth charge moves in the same plane, i.e. can take an arbitrary position. For the sake of convenience, a cathetus of the triangle is chosen as the unit of length, and absolute values of all magnetic charges are also unitary.
Then, as was found by Gorbachev et al. (1988), there is a narrow crescent region of instability, schematically shown in yellow in the figure. When the fourth charge enters this region (as shown by the open circle), a global structure of the magnetic field sharply changes, and a new null point should be born somewhere at . Unfortunately, this fact has been proven in the above-cited work only as an ‘existence theorem’, and dynamics of the magnetic field in the course of such reconstruction remained unclear for a long time.
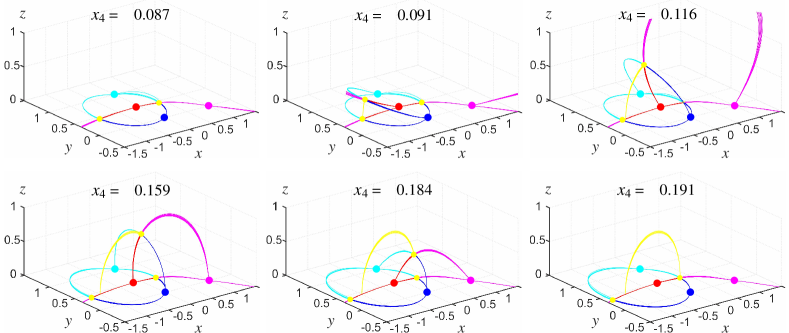
In the present work, we performed a detailed numerical simulation of the above-mentioned process, and its results are shown in Fig. 3. Here, six panels illustrate evolution of the ‘topological skeleton’ (i.e., a set of the field lines connecting the magnetic charges with null points) in the course of development of the topological instability, when the forth charge moves from the right to left along the line . The corresponding values of its coordinate are indicated at the top of each panel.
The first panel () illustrates the magnetic field structure just before the entrance into the zone of topological instability. One can see here a small and a part of the large circle, which are the bases of two domes separating four different types of topological connectivity of the magnetic field lines (Brown & Priest, 1999, 2001). There are two null points in the plane (shown by the yellow balls), which are of no interest for the magnetic reconnection because they are localized in the dense photospheric plasmas.
The next four panels ( and ) illustrate a development of the instability when the fourth source moves through the yellow crescent region in Fig. 2. Then we can see in Fig. 3 that a new null point splits off from the old one and begins to move quickly upward along the yellow arc. As a result, the entire two-dome structure of the magnetic field experiences a kind of flipping. It is important to emphasize that all these transformations occur under a tiny displacement of the fourth source, which is almost invisible in the scale of the figure. (The corresponding configuration of the magnetic charges, when the instability occurs, looks like the slanted letter ‘T’ rotated by .)
Finally, the last panel () corresponds to the end of the instability, when the quickly moving null point merges with the second previously-existing null point, and the magnetic skeleton restores its unperturbed configuration. The only noticeable change is a position of the first null point, which is shifted to the left as compared to its original location.
Referring to the earlier studies on the topology of solar magnetic fields, let us mention that our model exhibits approximately the same type of bifurcation as the one presented in Fig. 9 of the paper by Brown & Priest (2001), where it was called a ‘local-double-separator bifurcation’. Both before and after the stage of topological instability, there is a separator at the intersection of two domes above the plane, whose feet are in the null points shown in yellow. During the topological instability, there is an additional null point, which splits off from the left null point and quickly moves to the right one. Thereby, the original separator splits into two segments. To avoid misunderstanding, it should be emphasized that this situation is qualitatively different from the bifurcations caused by the appearance or disappearance of intersections between the separatrix surfaces (domes and walls), e.g., as discussed by Brown & Priest (1999).
Does reconnection occur at a null point or at a separator? The answer is both. In our scenario the most favourable place for the reconnection and the respective energy release is around the null point. On the other hand, since the bifurcated null point moves quickly along the separator, a luminous arc caused by the reconnection coincides approximately with the separator. (However, it should be kept in mind that – since the separator slightly shifts with time – a trajectory of the null point does not coincide exactly with the separator at any instant of time. This fact is well seen in Fig. 3, where a left footpoint of the yellow arc slightly deviates from the left null point in the plane . We preferred to not show the separator in this figure to avoid confusion with the null-point trajectory.)
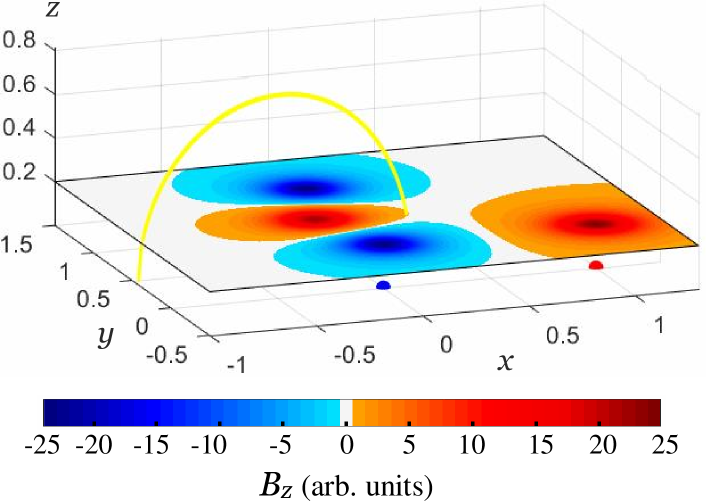
From the observational point of view, it is important to emphasize that trajectory of the bifurcated null point – along which the magnetic reconnection and the energy release processes should develop – is absolutely unrelated to the local configuration of the magnetic field lines. This is illustrated in Fig. 4, where the null-point trajectory is superimposed onto the model magnetogram, namely, the vertical component of the magnetic field in the plane . (The observed photospheric surface was taken slightly above the plane of sources for the sunspots to be of a finite size.) As is seen here, one footpoint of the arc is located at the edge of a sunspot, while another footpoint belongs to the area of very weak magnetic field. Unfortunately, it is impossible to accurately compare this structure with observational data in Fig. 1 because of the large uncertainty in the approximation of real magnetic field by the point-like magnetic sources.
4 Discussion and conclusions
In summary, simulations performed in the framework of topological model in Section 3 have shown that
-
1.
a trajectory of the bifurcated null point, where the energy release processes are expected, is formed very quickly, and
-
2.
location of this trajectory is actually irrelevant to the configuration of the local magnetic field lines.
Both these features are in good qualitative agreement with the observational data presented in Section 2: Really, the ‘unipolar’ flaring arc develops at the sufficiently short time scale (less than 1 min, which is limited by temporal resolution of the detectors) and extends between two sunspots of the same polarity, as was already discussed in the Introduction. Therefore, the model of ‘topological trigger’ represents a reasonable theoretical explanation for such kind of events.
It is rather surprising why the unipolar flares did not attract attention before, while such events could be identified repeatedly under inspection of the sufficiently long series of observations. Most probably, they were disregarded a priori as a kind of ‘noise’, since the flaring loops between the sources of the same polarity looked unacceptable from the physical point of view.
Of course, an important question is: where does the flare energy come from if we consider the potential field, i.e. the state of minimal energy at the given boundary conditions? One evident option is that the energy comes immediately from a redistribution (shifts) of the sources. Since plasmas in the upper layers are rarefied, the energy required to heat them is relatively small as compared to the energy stored in the lower layers, about . So, a small shift of the sources (e.g., by 5–10 per cent) in the region of topological instability will lead to a comparable change in the magnetic field energy, and this may be sufficient to feed a microflare. Yet another option might be that the real magnetic field is slightly non-potential (force-free) but close to the topologies described here. Really, as was shown by Brown & Priest (2000), topological structures of potential and force-free fields with given boundary conditions are usually very similar if the configuration of the sources is non-degenerate (i.e., not too symmetric) and we do not consider very distant regions of space. Then, the force-free field will store excess energy, which could be released in the reconnection.
Unfortunately, the theory of topological reconnection (especially, identification of the unstable topological configurations) is a very hard mathematical subject, which is sufficiently developed by now only for the case of no more than four sources. Bifurcations of the null points in some particular systems with multiple sources were studied by Inverarity & Priest (1999); but they did not show, in general, a fast motion of the null points. Attempts to go beyond the point-charge and potential-field approximations were undertaken by Longcope (2001); Longcope & Klapper (2002). Furthermore, a promising approach to generalising the topological criteria might be based on the Morse–Smale topological indices instead of the Euler–Poincaré ones. Such an idea was pursued in the recent work by Zhuzhoma et al. (2022), but this theory is only at the initial stage of development, and the results obtained cannot be confronted yet with observations.
From the observational point of view, a considerable improvement in the identification of unipolar flares can be achieved by utilising the images in He i 10 830 Å line, e.g., taken by the New solar telescope (NST) in the Big Bear Solar Observatory (Zeng et al., 2016). This is a chromospheric line formed approximately at the same conditions as Ca ii H, but spatial resolution of NST is as high as 0.16 arcsec, which is substantially better than for Hinode/SOT. So, this might be a promising tool for the refined study of the unusual microflares. Unfortunately, there are no sufficiently long series of observations in this line at the present time in the public domain.
Acknowledgements
YVD is grateful to A.T. Lukashenko and E.V. Zhuzhoma for the discussion of topological issues, to A.V. Getling, A.V. Oreshina and I. Slezak (former I.V. Oreshina) for consultations on the processing of magnetic fields, to V.F. Vereshchagin for the advices on analysis of Hinode images, and especially to the reviewer E.R. Priest for many valuable suggestions.
Hinode is a Japanese mission developed and launched by ISAS/JAXA, with NAOJ as domestic partner and NASA and STFC (UK) as international partners. It is operated by these agencies in co-operation with ESA and NSC (Norway).
Authors’ contributions: BVS suggested the general theoretical concept, supervised the work and discussed the results. YVD analysed the observational data, performed the corresponding numerical simulations and prepared the manuscript.
Data Availability
The observational data analysed in the present paper, namely, the movies of emission in Ca ii H line recorded by Hinode/SOT, are publicly available in the Hinode QL Movie Archive; and the SDO/HMI magnetograms, at the web-site of the Joint Science Operations Center (see footnotes in Section 2). Computer software used for a simulation of the topological reconnection can be obtained from YVD by reasonable request.
References
- Brown & Priest (1999) Brown D., Priest E., 1999, Sol. Phys., 190, 25
- Brown & Priest (2000) Brown D., Priest E., 2000, Sol. Phys., 194, 197
- Brown & Priest (2001) Brown D., Priest E., 2001, A&A, 367, 339
- Gorbachev et al. (1988) Gorbachev V., Kel’ner S., Somov B., Shvarts A., 1988, Soviet Ast., 32, 308
- Huang et al. (2018) Huang G., Melnikov V., Ji H., Ning Z., 2018, Solar Flare Loops: Observations and Interpretations. Springer, Singapore
- Inverarity & Priest (1999) Inverarity G., Priest E., 1999, Sol. Phys., 186, 99
- Janvier (2017) Janvier M., 2017, J. Plas. Phys., 83, 535830101
- Janvier et al. (2015) Janvier M., Aulanier G., Démoulin P., 2015, Sol. Phys., 290, 3425
- Kosugi et al. (2007) Kosugi T., et al., 2007, Sol. Phys., 243, 3
- Longcope (1996) Longcope D., 1996, Sol. Phys., 169, 91
- Longcope (2001) Longcope D., 2001, Phys. Plas., 8, 5277
- Longcope (2005) Longcope D., 2005, Liv. Rev. Sol. Phys., 2, 7
- Longcope & Klapper (2002) Longcope D., Klapper I., 2002, ApJ, 579, 468
- Oreshina & Somov (2009) Oreshina I., Somov B., 2009, Astron. Lett., 35, 207
- Oreshina et al. (2012) Oreshina A., Oreshina I., Somov B., 2012, A&A, 538, A138
- Pesnell et al. (2012) Pesnell W., Thompson B., Chamberlin P., 2012, Sol. Phys., 275, 3
- Phillips (1991) Phillips K., 1991, Vistas in Astronomy, 34, 353
- Priest (1981) Priest E., ed. 1981, Solar Flare Magnetohydrodynamics. Gordon & Breach, NY
- Priest (1982) Priest E., 1982, Solar Magnetohydrodynamics. D. Reidel, Dordrecht
- Priest & Forbes (2000) Priest E., Forbes T., 2000, Magnetic Reconnection: MHD Theory and Applications. Cambridge Univ. Press, Cambridge, UK
- Somov (2008) Somov B., 2008, Astron. Lett., 34, 635
- Somov (2013) Somov B., 2013, Plasma Astrophysics, Part II: Reconnection and Flares, 2 edn. Springer, NY
- Sturrock (1980) Sturrock P., ed. 1980, Solar Flares: A Monograph from Skylab Solar Workshop II. Colorado Assoc. Univ. Press, Boulder
- Svestka (1976) Svestka Z., 1976, Solar Flares. D. Reidel, Boston
- Tandberg-Hanssen & Emslie (1988) Tandberg-Hanssen E., Emslie A., 1988, The Physics of Solar Flares. Cambridge Univ. Press, Cambridge, UK
- Tsuneta et al. (2008) Tsuneta S., et al., 2008, Sol. Phys., 249, 167
- Zeng et al. (2016) Zeng Z., Chen B., Ji H., Goode P., Cao W., 2016, ApJ, 819, L3
- Zhuzhoma et al. (2022) Zhuzhoma E., Medvedev V., Dumin Y., Somov B., 2022, Physica D, 436, 133320