The Pierre Auger Observatory Open Data
![[Uncaptioned image]](/html/2309.16294/assets/x1.png)
A. Abdul Halim13, P. Abreu73, M. Aglietta55,53, I. Allekotte1, K. Almeida Cheminant71, A. Almela7,12, R. Aloisio46,47, J. Alvarez-Muñiz80, J. Ammerman Yebra80, G.A. Anastasi55,53, L. Anchordoqui87, B. Andrada7, S. Andringa73, Anukriti77, L. Apollonio60,50, C. Aramo51, P.R. Araújo Ferreira43, E. Arnone64,53, J. C. Arteaga Velázquez68, P. Assis73, G. Avila11, E. Avocone58,47, A.M. Badescu76, A. Bakalova33, F. Barbato46,47, A. Bartz Mocellin86, J.A. Bellido13,70, C. Berat37, M.E. Bertaina64,53, X. Bertou1, G. Bhatta71, M. Bianciotto64,53, P.L. Biermanni, V. Binet5, K. Bismark40,7, T. Bister81,82, J. Biteau38,b, J. Blazek33, C. Bleve37, J. Blümer42, M. Boháčová33, D. Boncioli58,47, C. Bonifazi8,27, L. Bonneau Arbeletche22, N. Borodai71, J. Brackk, P.G. Brichetto Orchera7, F.L. Briechle43, A. Bueno79, S. Buitink15, M. Buscemi48,62, A. Bwembya81,82, M. Büsken40,7, K.S. Caballero-Mora67, S. Cabana-Freire80, L. Caccianiga60,50, R. Caruso59,48, A. Castellina55,53, F. Catalani19, G. Cataldi49, L. Cazon80, M. Cerda10, A. Cermenati46,47, J.A. Chinellato22, J. Chudoba33, L. Chytka34, R.W. Clay13, A.C. Cobos Cerutti6, R. Colalillo61,51, A. Coleman91, M.R. Coluccia49, R. Conceição73, A. Condorelli38, G. Consolati50,56, M. Conte57,49, F. Convenga58,47, D. Correia dos Santos29, P.J. Costa73, C.E. Covault85, M. Cristinziani45, C.S. Cruz Sanchez3, S. Dasso4,2, K. Daumiller42, B.R. Dawson13, R.M. de Almeida29, J. de Jesús7,42, S.J. de Jong81,82, J.R.T. de Mello Neto27,28, I. De Mitri46,47, J. de Oliveira18, D. de Oliveira Franco22, F. de Palma57,49, V. de Souza20, B.P. de Souza de Errico27, E. De Vito57,49, A. Del Popolo59,48, O. Deligny35, N. Denner33, L. Deval42,7, A. di Matteo53, M. Dobre74, C. Dobrigkeit22, J.C. D’Olivo69, L.M. Domingues Mendes73, Q. Dorosti45, J.C. dos Anjos16, R.C. dos Anjos26, J. Ebr33, F. Ellwanger42, M. Emam81,82, R. Engel40,42, I. Epicoco57,49, M. Erdmann43, A. Etchegoyen7,12, C. Evoli46,47, H. Falcke81,83,82, J. Farmer90, G. Farrar89, A.C. Fauth22, N. Fazzinif, F. Feldbusch41, F. Fenu42,e, A. Fernandes73, B. Fick88, J.M. Figueira7, A. Filipčič78,77, T. Fitoussi42, B. Flaggs91, T. Fodran81, T. Fujii90,g, A. Fuster7,12, C. Galea81, C. Galelli60,50, B. García6, C. Gaudu39, H. Gemmeke41, F. Gesualdi7,42, A. Gherghel-Lascu74, P.L. Ghia35, U. Giaccari49, J. Glombitza43,h, F. Gobbi10, F. Gollan7, G. Golup1, J.P. Gongora11, J.M. González1, N. González7, I. Goos1, A. Gorgi55,53, M. Gottowik80, T.D. Grubb13, F. Guarino61,51, G.P. Guedes23, E. Guido45, M. Gómez Berisso1, P.F. Gómez Vitale11, D. Góra71, L. Gülzow42, S. Hahn40, P. Hamal33, M.R. Hampel7, P. Hansen3, D. Harari1, V.M. Harvey13, A. Haungs42, T. Hebbeker43, C. Hojvatf, P. Horvath34, M. Hrabovský34, T. Huege42,15, J.R. Hörandel81,82, A. Insolia59,48, P.G. Isar75, P. Janecek33, J.A. Johnsen86, J. Jurysek33, K.H. Kampert39, B. Keilhauer42, A. Khakurdikar81, V.V. Kizakke Covilakam7,42, H.O. Klages42, M. Kleifges41, F. Knapp40, N. Kunka41, J. Köhler42, B.L. Lago17, N. Langner43, M.A. Leigui de Oliveira25, Y. Lema-Capeans80, A. Letessier-Selvon36, I. Lhenry-Yvon35, L. Lopes73, L. Lu92, Q. Luce40, J.P. Lundquist77, A. Machado Payeras22, M. Majercakova33, D. Mandat33, B.C. Manning13, P. Mantschf, S. Marafico35, F.M. Mariani60,50, A.G. Mariazzi3, I.C. Mariş14, G. Marsella62,48, D. Martello57,49, S. Martinelli42,7, M.A. Martins80, O. Martínez Bravo65, H.J. Mathes42, J. Matthewsa, G. Matthiae63,52, E. Mayotte86,39, S. Mayotte86, P.O. Mazurf, G. Medina-Tanco69, J. Meinert39, D. Melo7, A. Menshikov41, C. Merx42, S. Michal34, M.I. Micheletti5, L. Miramonti60,50, S. Mollerach1, F. Montanet37, L. Morejon39, C. Morello55,53, K. Mulrey81,82, R. Mussa53, W.M. Namasaka39, S. Negi33, L. Nellen69, K. Nguyen88, G. Nicora9, M. Niechciol45, D. Nitz88, D. Nosek32, V. Novotny32, L. Nožka34, A. Nucita57,49, L.A. Núñez31, C. Oliveira20, M. Palatka33, J. Pallotta9, S. Panja33, G. Parente80, T. Paulsen39, J. Pawlowsky39, M. Pech33, R. Pelayo66, L.A.S. Pereira24, E.E. Pereira Martins40,7, J. Perez Armand21, L. Perrone57,49, S. Petrera46,47, C. Petrucci58,47, T. Pierog42, M. Pimenta73, M. Platino7, B. Pont81, M. Pothast82,81, M. Pourmohammad Shahvar62,48, P. Privitera90, M. Prouza33, A. Puyleart88, C. Pérez Bertolli7,42, J. Pȩkala71, S. Querchfeld39, J. Rautenberg39, D. Ravignani7, J.V. Reginatto Akim22, M. Reininghaus40, J. Ridky33, F. Riehn80, M. Risse45, V. Rizi58,47, W. Rodrigues de Carvalho81, E. Rodriguez7,42, J. Rodriguez Rojo11, M.J. Roncoroni7, S. Rossoni44, M. Roth42, E. Roulet1, A.C. Rovero4, P. Ruehl45, A. Saftoiu74, M. Saharan81, F. Salamida58,47, H. Salazar65, G. Salina52, J.D. Sanabria Gomez31, E.M. Santos21, E. Santos33, F. Sarazin86, R. Sarmento73, R. Sato11, P. Savina92, V. Scherini57,49, H. Schieler42, M. Schimassek35, M. Schimp39, D. Schmidt42, O. Scholten15,j, H. Schoorlemmer81,82, P. Schovánek33, F.G. Schröder91,42, J. Schulte43, T. Schulz42, C.M. Schäfer40, S.J. Sciutto3, M. Scornavacche7,42, A. Segreto54,48, S. Sehgal39, S.U. Shivashankara77, G. Sigl44, G. Silli7, O. Sima74,c, K. Simkova15, F. Simon41, R. Smau74, R. Šmída90, P. Sommersl, J.F. Soriano87, R. Squartini10, M. Stadelmaier33, S. Stanič77, J. Stasielak71, P. Stassi37, M. Straub43, S. Strähnz40, T. Suomijärvi38, A.D. Supanitsky7, Z. Svozilikova33, Z. Szadkowski72, F. Sánchez7, F. Tairli13, A. Tapia30, C. Taricco64,53, C. Timmermans82,81, O. Tkachenko42, P. Tobiska33, C.J. Todero Peixoto19, B. Tomé73, Z. Torrès37, A. Travaini10, P. Travnicek33, C. Trimarelli58,47, M. Tueros3, M. Unger42, L. Vaclavek34, M. Vacula34, J.F. Valdés Galicia69, L. Valore61,51, E. Varela65, D. Veberič42, C. Ventura28, I.D. Vergara Quispe3, V. Verzi52, J. Vicha33, J. Vink84, J. Vlastimil33, S. Vorobiov77, A. Vásquez-Ramírez31, C. Watanabe27, A.A. Watsond, A. Weindl42, L. Wiencke86, H. Wilczyński71, D. Wittkowski39, B. Wundheiler7, B. Yue39, A. Yushkov33, O. Zapparrata14, E. Zas80, D. Zavrtanik77,78, M. Zavrtanik78,77
The Pierre Auger Collaboration
- 1
-
Centro Atómico Bariloche and Instituto Balseiro (CNEA-UNCuyo-CONICET), San Carlos de Bariloche, Argentina
- 2
-
Departamento de Física and Departamento de Ciencias de la Atmósfera y los Océanos, FCEyN, Universidad de Buenos Aires and CONICET, Buenos Aires, Argentina
- 3
-
IFLP, Universidad Nacional de La Plata and CONICET, La Plata, Argentina
- 4
-
Instituto de Astronomía y Física del Espacio (IAFE, CONICET-UBA), Buenos Aires, Argentina
- 5
-
Instituto de Física de Rosario (IFIR) – CONICET/U.N.R. and Facultad de Ciencias Bioquímicas y Farmacéuticas U.N.R., Rosario, Argentina
- 6
-
Instituto de Tecnologías en Detección y Astropartículas (CNEA, CONICET, UNSAM), and Universidad Tecnológica Nacional – Facultad Regional Mendoza (CONICET/CNEA), Mendoza, Argentina
- 7
-
Instituto de Tecnologías en Detección y Astropartículas (CNEA, CONICET, UNSAM), Buenos Aires, Argentina
- 8
-
International Center of Advanced Studies and Instituto de Ciencias Físicas, ECyT-UNSAM and CONICET, Campus Miguelete – San Martín, Buenos Aires, Argentina
- 9
-
Laboratorio Atmósfera – Departamento de Investigaciones en Láseres y sus Aplicaciones – UNIDEF (CITEDEF-CONICET), Argentina
- 10
-
Observatorio Pierre Auger, Malargüe, Argentina
- 11
-
Observatorio Pierre Auger and Comisión Nacional de Energía Atómica, Malargüe, Argentina
- 12
-
Universidad Tecnológica Nacional – Facultad Regional Buenos Aires, Buenos Aires, Argentina
- 13
-
University of Adelaide, Adelaide, S.A., Australia
- 14
-
Université Libre de Bruxelles (ULB), Brussels, Belgium
- 15
-
Vrije Universiteit Brussels, Brussels, Belgium
- 16
-
Centro Brasileiro de Pesquisas Fisicas, Rio de Janeiro, RJ, Brazil
- 17
-
Centro Federal de Educação Tecnológica Celso Suckow da Fonseca, Petropolis, Brazil
- 18
-
Instituto Federal de Educação, Ciência e Tecnologia do Rio de Janeiro (IFRJ), Brazil
- 19
-
Universidade de São Paulo, Escola de Engenharia de Lorena, Lorena, SP, Brazil
- 20
-
Universidade de São Paulo, Instituto de Física de São Carlos, São Carlos, SP, Brazil
- 21
-
Universidade de São Paulo, Instituto de Física, São Paulo, SP, Brazil
- 22
-
Universidade Estadual de Campinas, IFGW, Campinas, SP, Brazil
- 23
-
Universidade Estadual de Feira de Santana, Feira de Santana, Brazil
- 24
-
Universidade Federal de Campina Grande, Centro de Ciencias e Tecnologia, Campina Grande, Brazil
- 25
-
Universidade Federal do ABC, Santo André, SP, Brazil
- 26
-
Universidade Federal do Paraná, Setor Palotina, Palotina, Brazil
- 27
-
Universidade Federal do Rio de Janeiro, Instituto de Física, Rio de Janeiro, RJ, Brazil
- 28
-
Universidade Federal do Rio de Janeiro (UFRJ), Observatório do Valongo, Rio de Janeiro, RJ, Brazil
- 29
-
Universidade Federal Fluminense, EEIMVR, Volta Redonda, RJ, Brazil
- 30
-
Universidad de Medellín, Medellín, Colombia
- 31
-
Universidad Industrial de Santander, Bucaramanga, Colombia
- 32
-
Charles University, Faculty of Mathematics and Physics, Institute of Particle and Nuclear Physics, Prague, Czech Republic
- 33
-
Institute of Physics of the Czech Academy of Sciences, Prague, Czech Republic
- 34
-
Palacky University, Olomouc, Czech Republic
- 35
-
CNRS/IN2P3, IJCLab, Université Paris-Saclay, Orsay, France
- 36
-
Laboratoire de Physique Nucléaire et de Hautes Energies (LPNHE), Sorbonne Université, Université de Paris, CNRS-IN2P3, Paris, France
- 37
-
Univ. Grenoble Alpes, CNRS, Grenoble Institute of Engineering Univ. Grenoble Alpes, LPSC-IN2P3, 38000 Grenoble, France
- 38
-
Université Paris-Saclay, CNRS/IN2P3, IJCLab, Orsay, France
- 39
-
Bergische Universität Wuppertal, Department of Physics, Wuppertal, Germany
- 40
-
Karlsruhe Institute of Technology (KIT), Institute for Experimental Particle Physics, Karlsruhe, Germany
- 41
-
Karlsruhe Institute of Technology (KIT), Institut für Prozessdatenverarbeitung und Elektronik, Karlsruhe, Germany
- 42
-
Karlsruhe Institute of Technology (KIT), Institute for Astroparticle Physics, Karlsruhe, Germany
- 43
-
RWTH Aachen University, III. Physikalisches Institut A, Aachen, Germany
- 44
-
Universität Hamburg, II. Institut für Theoretische Physik, Hamburg, Germany
- 45
-
Universität Siegen, Department Physik – Experimentelle Teilchenphysik, Siegen, Germany
- 46
-
Gran Sasso Science Institute, L’Aquila, Italy
- 47
-
INFN Laboratori Nazionali del Gran Sasso, Assergi (L’Aquila), Italy
- 48
-
INFN, Sezione di Catania, Catania, Italy
- 49
-
INFN, Sezione di Lecce, Lecce, Italy
- 50
-
INFN, Sezione di Milano, Milano, Italy
- 51
-
INFN, Sezione di Napoli, Napoli, Italy
- 52
-
INFN, Sezione di Roma “Tor Vergata”, Roma, Italy
- 53
-
INFN, Sezione di Torino, Torino, Italy
- 54
-
Istituto di Astrofisica Spaziale e Fisica Cosmica di Palermo (INAF), Palermo, Italy
- 55
-
Osservatorio Astrofisico di Torino (INAF), Torino, Italy
- 56
-
Politecnico di Milano, Dipartimento di Scienze e Tecnologie Aerospaziali , Milano, Italy
- 57
-
Università del Salento, Dipartimento di Matematica e Fisica “E. De Giorgi”, Lecce, Italy
- 58
-
Università dell’Aquila, Dipartimento di Scienze Fisiche e Chimiche, L’Aquila, Italy
- 59
-
Università di Catania, Dipartimento di Fisica e Astronomia “Ettore Majorana“, Catania, Italy
- 60
-
Università di Milano, Dipartimento di Fisica, Milano, Italy
- 61
-
Università di Napoli “Federico II”, Dipartimento di Fisica “Ettore Pancini”, Napoli, Italy
- 62
-
Università di Palermo, Dipartimento di Fisica e Chimica ”E. Segrè”, Palermo, Italy
- 63
-
Università di Roma “Tor Vergata”, Dipartimento di Fisica, Roma, Italy
- 64
-
Università Torino, Dipartimento di Fisica, Torino, Italy
- 65
-
Benemérita Universidad Autónoma de Puebla, Puebla, México
- 66
-
Unidad Profesional Interdisciplinaria en Ingeniería y Tecnologías Avanzadas del Instituto Politécnico Nacional (UPIITA-IPN), México, D.F., México
- 67
-
Universidad Autónoma de Chiapas, Tuxtla Gutiérrez, Chiapas, México
- 68
-
Universidad Michoacana de San Nicolás de Hidalgo, Morelia, Michoacán, México
- 69
-
Universidad Nacional Autónoma de México, México, D.F., México
- 70
-
Universidad Nacional de San Agustin de Arequipa, Facultad de Ciencias Naturales y Formales, Arequipa, Peru
- 71
-
Institute of Nuclear Physics PAN, Krakow, Poland
- 72
-
University of Łódź, Faculty of High-Energy Astrophysics,Łódź, Poland
- 73
-
Laboratório de Instrumentação e Física Experimental de Partículas – LIP and Instituto Superior Técnico – IST, Universidade de Lisboa – UL, Lisboa, Portugal
- 74
-
“Horia Hulubei” National Institute for Physics and Nuclear Engineering, Bucharest-Magurele, Romania
- 75
-
Institute of Space Science, Bucharest-Magurele, Romania
- 76
-
University Politehnica of Bucharest, Bucharest, Romania
- 77
-
Center for Astrophysics and Cosmology (CAC), University of Nova Gorica, Nova Gorica, Slovenia
- 78
-
Experimental Particle Physics Department, J. Stefan Institute, Ljubljana, Slovenia
- 79
-
Universidad de Granada and C.A.F.P.E., Granada, Spain
- 80
-
Instituto Galego de Física de Altas Enerxías (IGFAE), Universidade de Santiago de Compostela, Santiago de Compostela, Spain
- 81
-
IMAPP, Radboud University Nijmegen, Nijmegen, The Netherlands
- 82
-
Nationaal Instituut voor Kernfysica en Hoge Energie Fysica (NIKHEF), Science Park, Amsterdam, The Netherlands
- 83
-
Stichting Astronomisch Onderzoek in Nederland (ASTRON), Dwingeloo, The Netherlands
- 84
-
Universiteit van Amsterdam, Faculty of Science, Amsterdam, The Netherlands
- 85
-
Case Western Reserve University, Cleveland, OH, USA
- 86
-
Colorado School of Mines, Golden, CO, USA
- 87
-
Department of Physics and Astronomy, Lehman College, City University of New York, Bronx, NY, USA
- 88
-
Michigan Technological University, Houghton, MI, USA
- 89
-
New York University, New York, NY, USA
- 90
-
University of Chicago, Enrico Fermi Institute, Chicago, IL, USA
- 91
-
University of Delaware, Department of Physics and Astronomy, Bartol Research Institute, Newark, DE, USA
- 92
-
University of Wisconsin-Madison, Department of Physics and WIPAC, Madison, WI, USA
-
—–
- a
-
Louisiana State University, Baton Rouge, LA, USA
- b
-
Institut universitaire de France (IUF), France
- c
-
also at University of Bucharest, Physics Department, Bucharest, Romania
- d
-
School of Physics and Astronomy, University of Leeds, Leeds, United Kingdom
- e
-
now at Agenzia Spaziale Italiana (ASI). Via del Politecnico 00133, Roma, Italy
- f
-
Fermi National Accelerator Laboratory, Fermilab, Batavia, IL, USA
- g
-
now at Graduate School of Science, Osaka Metropolitan University, Osaka, Japan
- h
-
now at ECAP, Erlangen, Germany
- i
-
Max-Planck-Institut für Radioastronomie, Bonn, Germany
- j
-
also at Kapteyn Institute, University of Groningen, Groningen, The Netherlands
- k
-
Colorado State University, Fort Collins, CO, USA
- l
-
Pennsylvania State University, University Park, PA, USA
Email: spokespersons@auger.org
Abstract: The Pierre Auger Collaboration has embraced the concept of open access to their research data since its foundation, with the aim of giving access to the widest possible community. A gradual process of release began as early as 2007 when 1% of the cosmic-ray data was made public, along with 100% of the space-weather information. In February 2021, a portal was released containing 10% of cosmic-ray data collected from 2004 to 2018, during Phase I of the Observatory. The Portal included detailed documentation about the detection and reconstruction procedures, analysis codes that can be easily used and modified and, additionally, visualization tools. Since then the Portal has been updated and extended. In 2023, a catalog of the 100 highest-energy cosmic-ray events examined in depth has been included. A specific section dedicated to educational use has been developed with the expectation that these data will be explored by a wide and diverse community including professional and citizen-scientists, and used for educational and outreach initiatives. This paper describes the context, the spirit and the technical implementation of the release of data by the largest cosmic-ray detector ever built, and anticipates its future developments.
1 Introduction
During almost 20 years of data taking, the Pierre Auger Observatory [1], the largest facility for the measurement of ultra-high energy cosmic rays (UHECR), has detected more than 20 000 cosmic-ray events per year with an energy above 2.5 EeV (1 EeV = eV). The experimental Phase I of the Observatory was completed on 31 December 2021 providing, with unprecedented statistics and precision, major breakthroughs in the field.
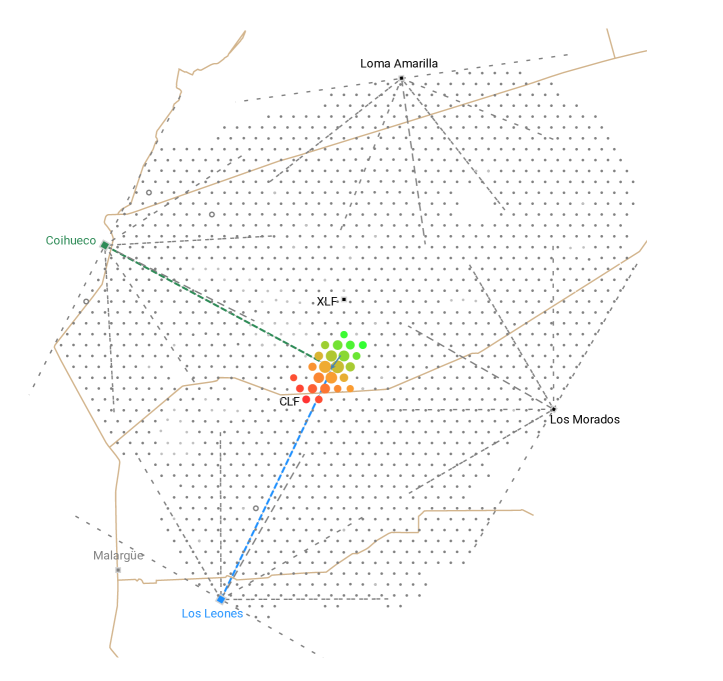
The Observatory, located on a high-altitude plain near Malargüe, Mendoza Province, Argentina, combines two detection techniques for the detection of extensive air showers (EAS). A Surface Detector (SD) array of 1600 water-Cherenkov detectors (WCD) in a 1500 m triangular grid covering 3000 km2 provides lateral sampling of the EAS at the ground. A Fluorescence Detector (FD) consisting of 24 telescopes detects the UV fluorescence light emitted by de-excitation of nitrogen molecules previously excited by the charged particles from the EAS, grouped at four sites (eyes) overlooking the array. The Observatory is at a mean altitude of about 1400 m, corresponding to an atmospheric overburden of about 875 g cm. The site lies between latitudes 35.0∘S and 35.3∘S and between longitudes 69.0∘ W and 69.4∘ W. Lasers for atmospheric monitoring are located towards the center of the array, at the positions marked as CLF (central laser facility) and XLF (extreme laser facility), see Fig. 1. Data-taking started on 1 January 2004 with the engineering and pre-production arrays of 154 surface detector stations and two fluorescence sites in operation [2]. Installation was completed in June 2008 and running the Observatory has been stable since then.
The rich data harvest by the Collaboration covers different and complementary fields of research. The main goal, targeted at revealing the nature and origin of ultra-high energy cosmic rays, relies on measurements of the energy spectrum and mass composition, and is complemented by extensive searches for anisotropy in the distribution of the arrival directions at both large and intermediate angular scales. Ultra-high energy cosmic rays offer the unique opportunity to investigate the nature of astrophysical sources and of particle interactions in a kinematic and energy region well beyond that covered by current particle accelerators. The main results include measurements of the cosmic-ray arrival directions [3], energy spectrum [4] and chemical composition [5] along with their interpretation [6], the possible presence of neutral primaries such as photons and neutrinos [7] and particle physics [8]. Moreover its potential as a multi-messenger [9] and multi-disciplinary [10, 11] Observatory has been proven.
The Collaboration has embraced the concept of open access to research data from its foundation. A gradual process of release began as early as 2007, when the Observatory was almost completed, a public event browser of 1% of data from the surface detector was created and the data have been updated every year for over 10 years [12]. Meant for educational purposes, that portal was the first step towards making data publicly available, at a time when there was no data management plan in place and only a few other astroparticle physics experiments were releasing data before the end of their activities.
The Open Data Portal [13] was set up in February 2021, towards the end of the first phase of operation of the Observatory and contained 10% of the cosmic-ray data used for the analyses presented in 2019 at the 36th International Cosmic Ray Conference in Madison, Wisconsin, US, comprising around 25 000 events from both the surface and the fluorescence detectors. Since then, it has been regularly updated and expanded in both the quantity and diversity of data in compliance with the Data open-access policy of the Observatory [14].
It is worthwhile to emphasize that the data from the Observatory are the result of vast and long-term moral, human and financial investment by the international community. The Collaboration is committed to their public release, as well as that of software tools developed for analysis, to offer to a wider community, including professional and citizen scientists, a major and unique opportunity to explore and analyse the data at various levels of complexity, in accordance with the Berlin declaration on Open data and Open Access, following the FAIR (Findable, Accessible, Interoperable, and Reusable) principle ”as open as possible and as closed as necessary” [15]. The Collaboration upholds the principle that open access to the data and the related software will, in the long term, allow the maximum realization of its scientific potential.
This paper is conceived as follows: Section 2 describes the general structure and content of the Portal while Section 3 focuses in particular on the datasets. Section 4 describes the event visualization and Section 5 the tools for data analysis. The catalog of the 100 highest energy cosmic-ray events detected at the Observatory is described in Section 6. Section 7 is dedicated to the outreach page and the activities connected to Open Data. Finally, in Section 8, the experience of the Collaboration, after two years of monitoring the access and the use of the open data, is summarized, and the intentions for the future development of the open-access program are anticipated.
2 The Portal
The Portal [13, 16, 17] is aimed at sharing a sensible fraction of the collected data and the associated knowledge with the scientific community, starting from either raw experimental or simulated data through reconstructed events and datasets of higher level generated by analysis workflows, all the way up to data presented in scientific publications.
2.1 Portal Organization
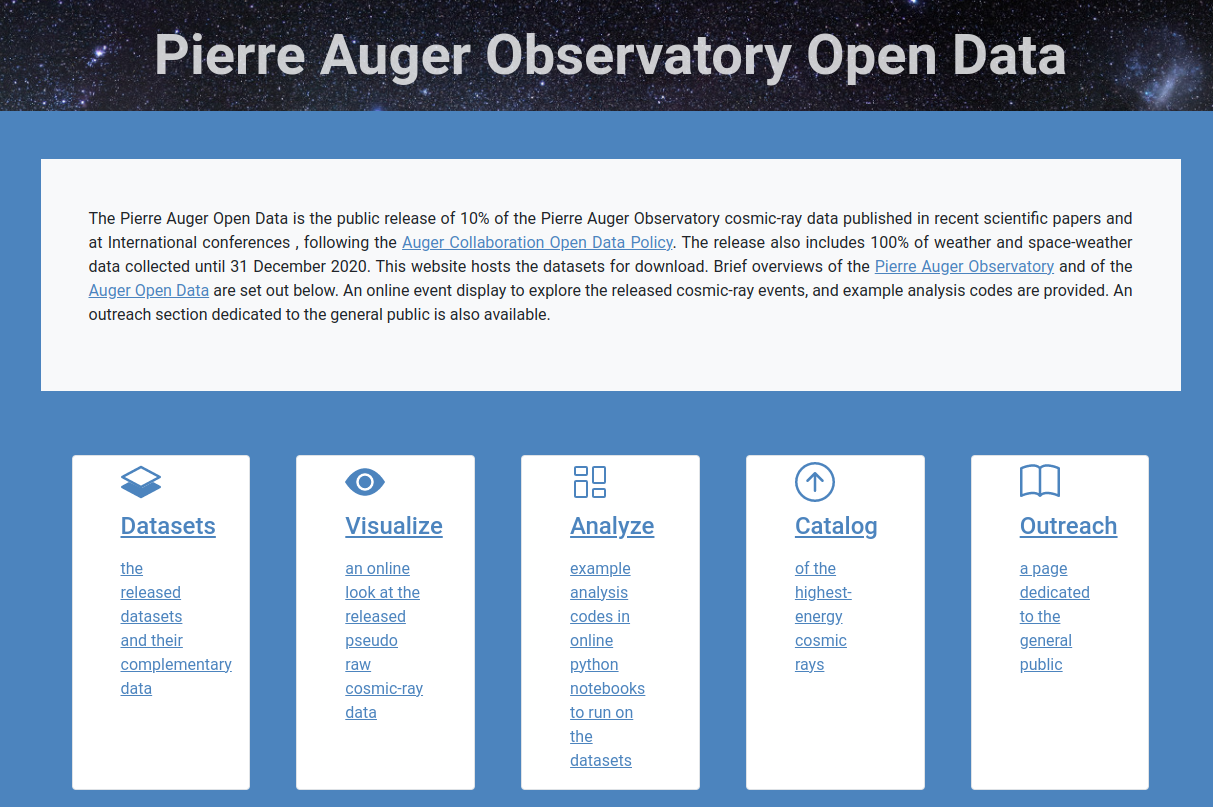
An introductory main page provides the link to the different sections. This page also displays a comprehensive overview of the Observatory, regarding the main detectors and their working principles. Appropriate references are given for deeper investigation. Subsections explaining the details of the atmospheric monitoring program and the potential of the space-weather monitoring and observation of ionospheric phenomena are also provided. Finally, it includes the technical and copyright information. A screenshot of the main page with the links to the five different sections is displayed in Fig. 2.
The Datasets tab contains the list of releases along with the available files and the detailed description of their structure and content. Moreover it includes an exhaustive explanation of the data, and the conditions under which they were taken, reconstructed and selected, with the links to the downloadable files (see Section 3).
The Visualization tab provides a user-friendly interface for selecting and browsing each of the public events by specifying an event ID or a range of reconstructed variables as, for example, energy or zenith angle. Some exemplary events, such as the highest energy or multiplicity event, are pre-selected for inspection and available through a dedicated menu (see Section 4).
The Analysis tab provides the user with some tutorial codes to browse and analyse the data. Simple scripts for plotting histograms and graphs with the reconstructed variables and advanced routines based on the main Auger published results are available for download or can be run online (see Section 5).
The Catalog tab implements a browser for the 109 highest energy events recorded by the surface and fluorescence detectors during Phase I of operation of the Observatory [18] (see Section 6).
The Outreach tab, dedicated to a wider audience, has been implemented and translated in different languages, thus offering unique opportunities which expose the general public to the excitement of cosmic-ray physics (see Section 7).
Finally the Portal includes a Contact link giving the user additional support via the answers to frequently asked questions about potential technical or content-related issues that might be raised. A dedicated e-mail address for contacting the Collaboration is given.
The datasets are released under the (CC BY-SA 4.0) International License and they have a unique Digital Object Identifier (DOI), provided by Zenodo, always pointing to the current version [19]. DOIs of the specific released versions are detailed in Table 1. The user is requested to cite the proper link to the data in any applications or publications.
| Release Tag | Date | Content | Specific DOI |
|---|---|---|---|
| Release 2.0 | Dec 22, 2022 | 10% cosmic-ray data, inclined sample (60∘ - 80∘), Outreach section with different languages | 10.5281/zenodo.6867688 |
| Release 1.1 | Oct 26, 2021 | 100% atmospheric data and scaler data | 10.5281/zenodo.5588460 |
| Release 1.0 | Feb 15, 2021 | 10% cosmic-ray data, vertical sample (0∘ - 60∘) and auxiliary files, ready-to-use event display, analysis examples | 10.5281/zenodo.4487613 |
3 Datasets
Different types of data are provided via the Portal including cosmic-ray data, weather and space-weather data and other resources. Detailed explanations of the datasets, and the conditions under which data were collected, are provided in the Datasets tab together with the description of the available files and of all the data fields.
3.1 Cosmic-ray Data
A set of selection criteria is applied to the detected cosmic-ray events in order to ensure an adequate sampling of the shower and the reliable performance of ground operation of the surface detector as well as of stable conditions of individual stations. Events are selected with a zenith angle less than for the vertical sample and in the interval for the inclined sample, with reconstructed energies above 2.5 EeV and 4 EeV, respectively, to guarantee operation in an energy regime where detection with the surface array is fully efficient. Hybrid events, simultaneously detected by the fluorescence detector and the surface detector, are selected by requiring the fulfilment of a set of criteria on the status of the hardware, reconstruction of shower geometry and profile and atmospheric quality. Specific fiducial volume cuts are also applied for different analyses (energy spectrum, calibration, composition) to achieve uniform acceptance and to minimize the uncertainties on the corresponding observables with events being flagged accordingly.
The details of the currently released cosmic-ray samples, comprising about 30 000 events from both the surface and the fluorescence detectors, are given in Table 2.
Each event is downloadable as pseudo-raw data in JavaScript Object Notation (JSON) files, structuring, in a compact format, the meta-data on the reconstruction along with blocks of data dedicated to each of the detectors involved in the event. The reconstructed parameters with their uncertainties and the list of the participating stations with their relevant PMT traces are available. When an event is detected simultaneously with the fluorescence detector, the participating telescopes with the associated reconstructed energy-deposit profile and the signal recorded in the triggered pixels are provided. All the high level reconstructed parameters from the surface and fluorescence detectors, such as energy, arrival direction, impact point at the ground and depth of shower maximum (), are also given in a summary comma separated (CSV) file.
Finally, auxiliary data files are also distributed, in particular for listing the positions of the surface detector stations and of the angular field of view of the fluorescence detector pixels. The surface detector exposure and the parameters required to calculate the fluorescence detector acceptance for specific analyses are also provided.
| Dec 2022 release | Surface detector | Hybrid detector | |||
| Vertical | Inclined | Spectrum | Calibration | ||
| Number of events | 21564 | 2355 | 1539 | 414 | 3057 |
| Data taking period | 2004-2018 | 2004-2017 | |||
| Threshold energy | 2.5 EeV | 4 EeV | 1 EeV | 2.5 EeV | 0.6 EeV |
| Zenith angle range | |||||
3.2 Atmospheric data
Since the Observatory uses the atmosphere as a giant calorimeter, a monitoring system has been set up at the detection site for measuring local atmospheric parameters affecting the shower development, thus providing the knowledge required for the accurate reconstruction of observed air showers [20]. Changes in the atmospheric pressure lead to changes in the rates of recorded showers. At fixed pressure, if the temperature increases, the particles in the shower will spread out more as the distance travelled between each scattering rises. Changes in the properties of the atmosphere also have significant effects on the rate of nitrogen fluorescence emission, as well as on the transmission of light.
The files produced by the atmospheric monitoring system include values of temperature, pressure, humidity, and wind speed recorded every five or ten minutes by five weather stations located at each fluorescence detector site and at the center of the array. In addition, the file used to calculate the weather correction of the energy estimator derived from the surface detector, included in the standard reconstruction procedure, is also released. This file is obtained by merging the weather stations data and it also contains the average value of the air density.
3.3 Space-weather data
Measurements of the background flux of secondary particles, produced mainly by low-energy cosmic rays (primary energies from 10 GeV to a few TeV) can be performed at the Observatory by exploiting scaler-mode data. The scaler mode is a particle counter mode, which is implemented for all the detectors of the surface array. These data are recorded for every station each second, reaching typical counting rates of 3 MHz. The temporal behavior of the number of counts is modulated by terrestrial and extraterrestrial phenomena and can thus be employed, for example, in studies of solar transient events like Forbush decreases and identification of modulations related to the solar cycle [11]. From September 2005, the scaler mode has been used to count, in each of the 1600 detectors, the number of times the amplitude of the signals satisfies threshold conditions corresponding to an energy deposit of between 15 MeV and 100 MeV. The current data consists of more than signal counts detected until December 2020.
4 Visualization
The Portal provides a page to view the characteristics of any shower in the dataset. From a menu it is possible to inspect particularly interesting events, such as the highest-energy events, the highest multiplicity events, and multi-eye hybrid events. In addition, a browser allows to select events by their energy, inclination, number of triggered stations, and arrival time. Once an event is selected, its components can be browsed using different tabs. The event files can also be directly downloaded and further processed with tutorial codes that are provided.
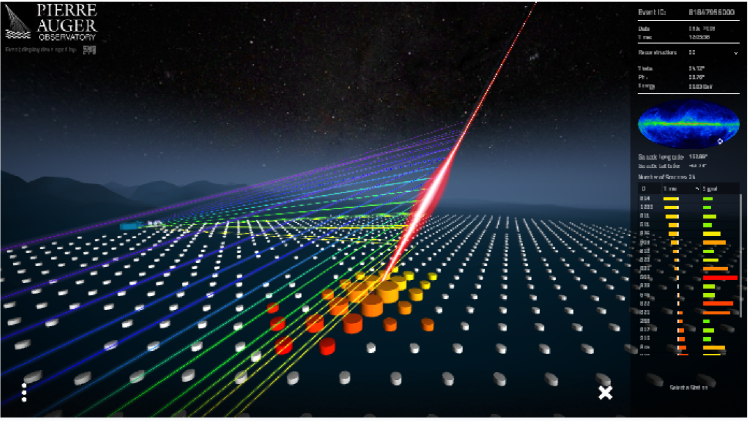
The ground array view tab displays a detailed map of the Observatory at the time the event was detected, showing the shower footprint at ground (color scale from green to red reflects the arrival time of the shower particles at the ground). The event shown in Fig. 1 with id 081847956000 is one of the highest energy multi-eye hybrid events in the released sample, with an energy of about 57 EeV and zenith angle 54∘. It was detected on 03 July 2008 with 24 surface detector stations and, simultaneously, with two sites of the fluorescence detector. Further details of this exemplary event are shown in Fig. 3, Fig. 4 and Fig. 5.
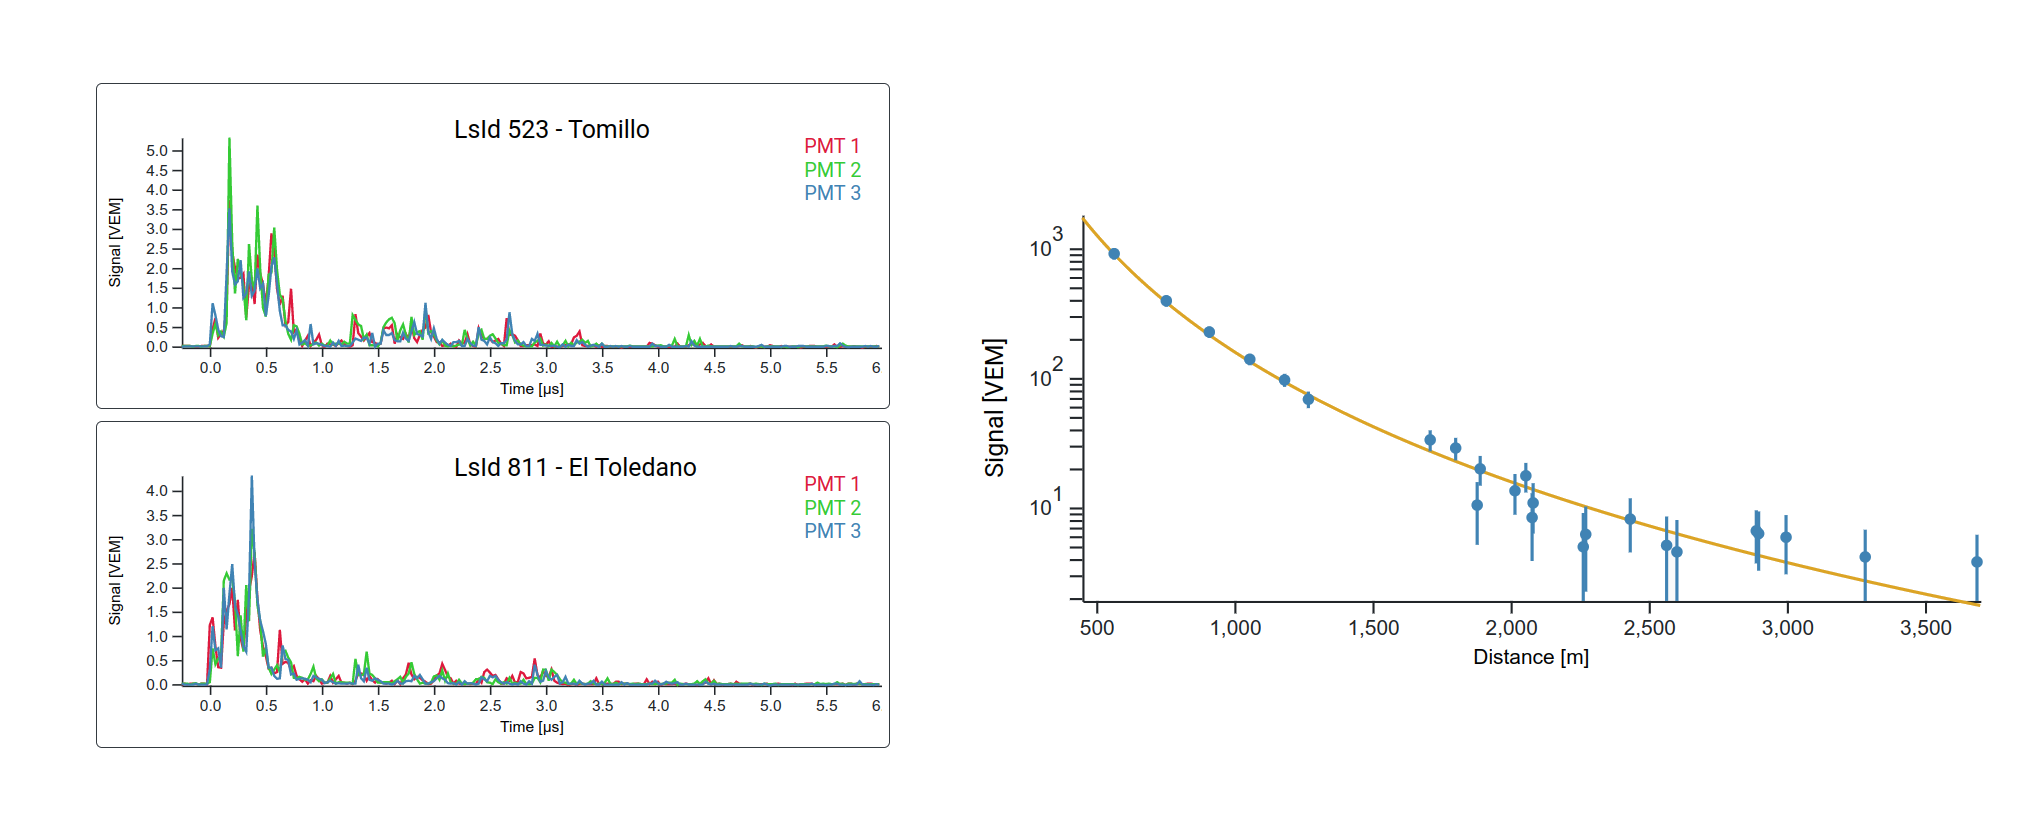
The flash analog-to-digital converters (FADCs) traces of the signals of the photomultiplier tubes (PMTs) of all triggered stations are displayed in the SD traces tab: the FADC traces from the PMTs of two WCD stations participating in the event are shown in Fig. 3, left panel. A fit of the signal fall-off as a function of distance from the shower impact point at the ground, the so-called lateral distribution function (LDF), provides the value of the energy estimator (1000), the signal at 1000 m from the shower impact point on the ground in the plane perpendicular to the shower axis [21]. The LDF of the exemplary event is shown in Fig. 3, right panel.
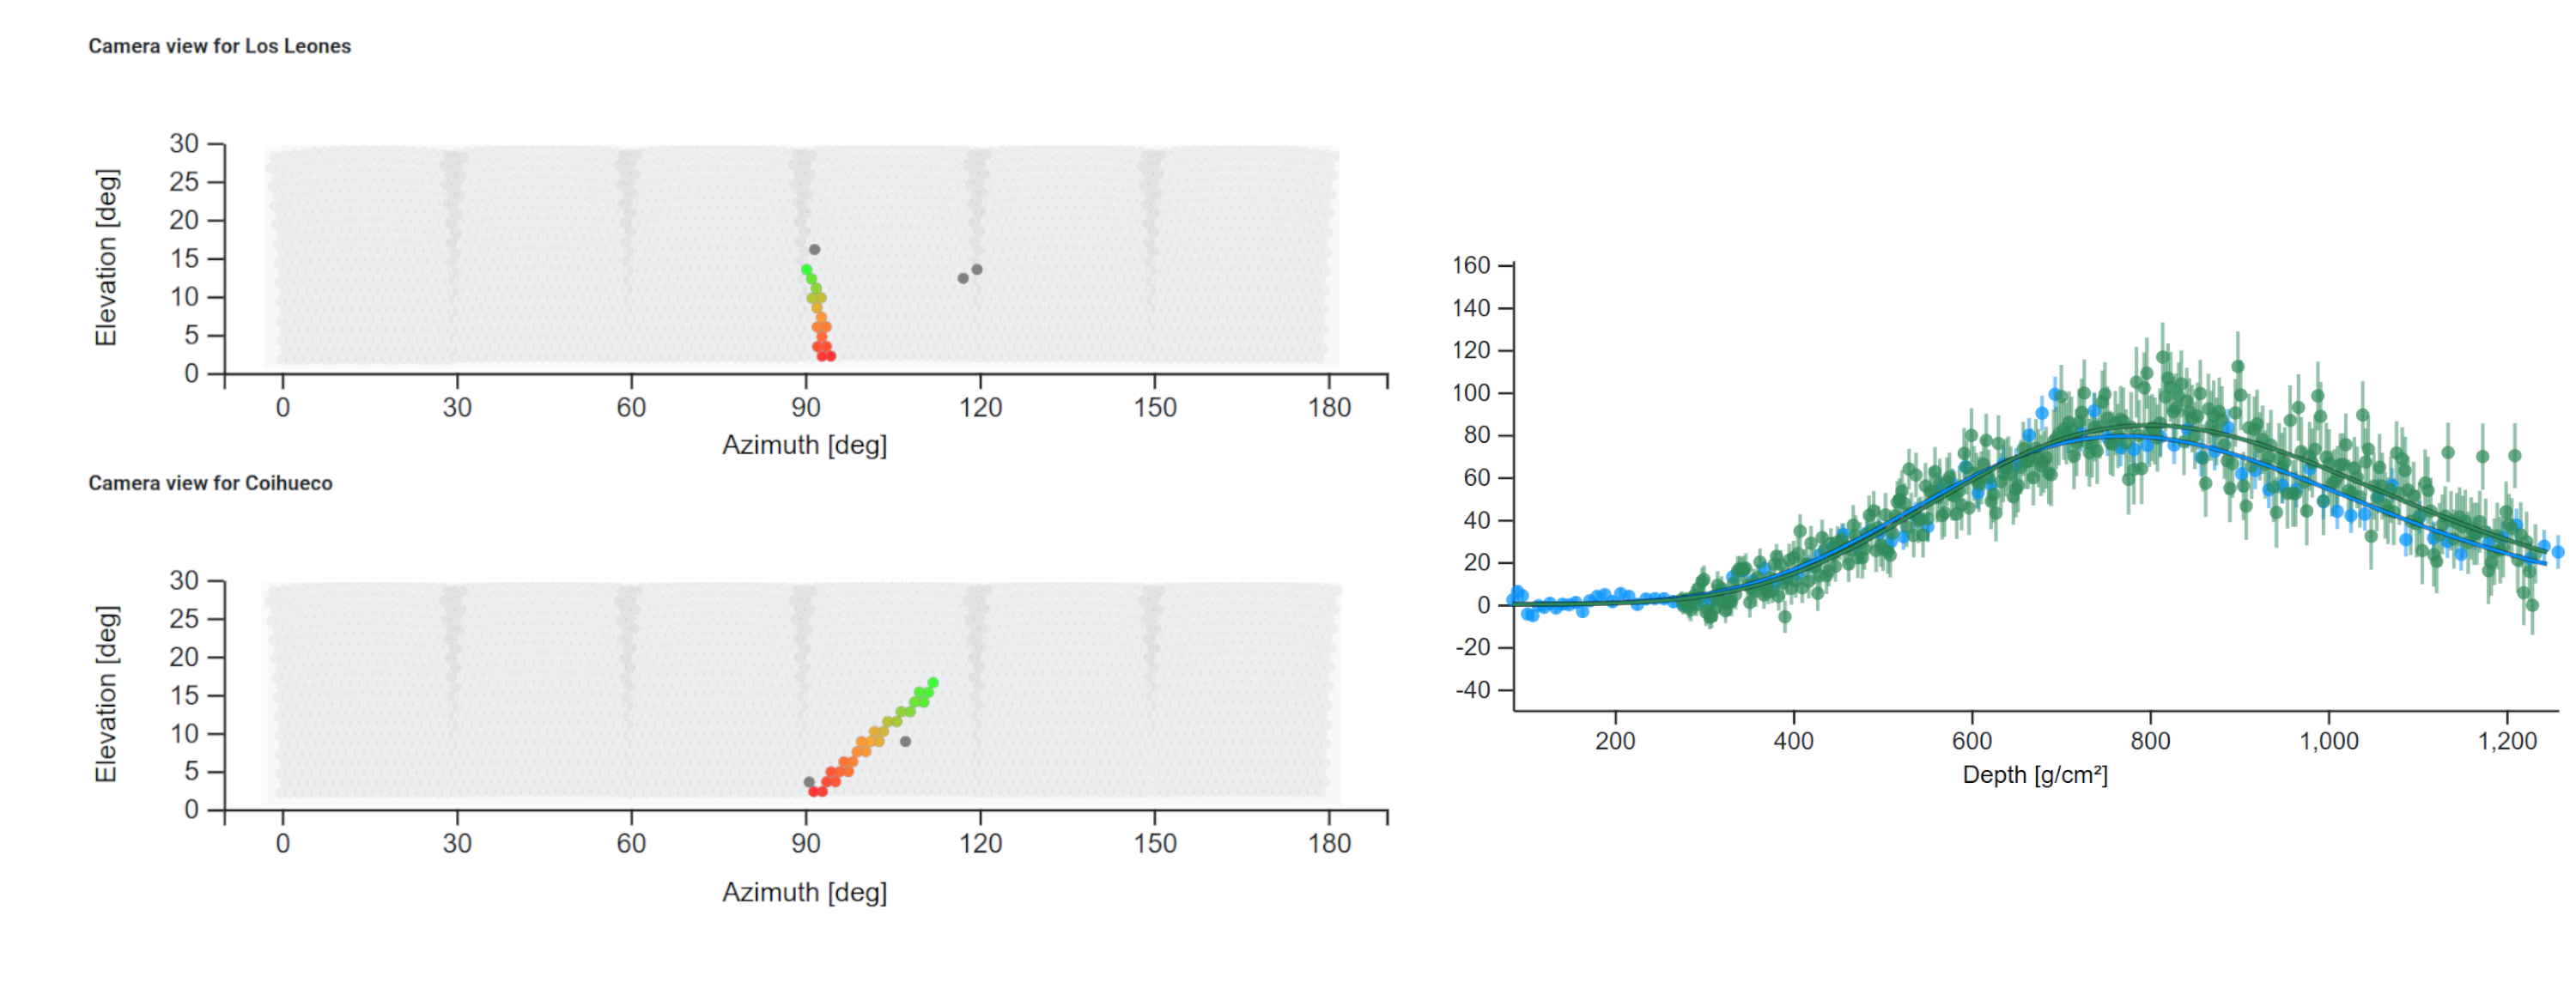
For hybrid events, the FD camera view and FD reconstruction tabs contain the information from the fluorescence telescopes. The sky view of the cameras and the reconstructed energy deposit as a function of atmospheric depth, the so called longitudinal shower profile, are shown in Fig. 4, left and right panel respectively. The energy deposited per unit depth in the atmosphere, d/d, increases at first, along with the multiplication of particles in the cascade, and then decreases as the rate of energy loss by ionisation starts to exceed that by radiative processes. This behavior gives rise to a universal profile shape [22], where the position of the maximum depends on the primary particle type (and its energy). The integration of the profile provides a calorimetric measurement of the total energy of the primary cosmic ray [23].
The 3D view tab provides an interface to a three-dimensional view of the events, from different perspectives. An interactive and immersive view of the events is provided along with access to all reconstructed values and graphs. A screenshot of the three-dimensional display for the exemplary event is shown in Fig. 5.
5 Analysis
The Open Data can be analyzed using Python Notebooks. Examples are provided in the Portal, together with a tutorial introducing the Python programming language and its use with the Open Data. These are mostly designed to require only the core Python analysis packages and can be downloaded or run online in a web browser, via the Kaggle platform.
Each cosmic-ray event can be processed via a simple Notebook exploring the content of the associated JSON file. Depending on the file structure and the data source, different plots can be produced, as for instance the PMTs signals of each surface detector station, the shower footprint at ground or the reconstructed profile of the energy deposited in the atmosphere.
Tutorials have been developed to show how to read the CSV summary files and the JSON pseudo-raw data and how to produce plots using pseudo-raw and higher level data. The examples demonstrate how to produce histograms and plot the trend of variables as a function of time or energy, how to produce maps of the array and of arrival directions in the sky, and how to correlate the values of two variables. More advanced analysis codes are simplified re-implementations of parts of analyses published by the Collaboration as detailed below.
The example analyses use the most-updated version of the Auger data sets and software, which may differ slightly from those used for associated publications because of improvements to the reconstruction and calibration procedures. The codes provided recall the spirit of the original analyses and provide insights as to how the results were obtained. They are simplified by omitting some more advanced analysis details that the user can find in the published papers. Even if the statistical significance is reduced with respect to what can be achieved with the full data set, the number of events is comparable to what was used in some of the first scientific publications by the Collaboration, see for example [24].
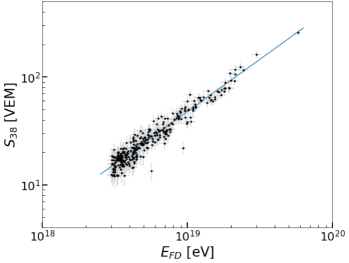
The energy calibration: The energy estimation for the vertical events using the surface detector relies on the calibration of the energy estimator, (1000). (1000) is first corrected for the the zenith-dependent attenuation to , the signal that a shower would have produced when coming from the median zenith angle of 38∘. The calibration of the estimator is then performed by exploiting the calorimetric measurement of the energy made with the fluorescence detector for a sub-sample of high-quality hybrid events [4]. The correlation between and the energy measured with the fluorescence detector, , is plotted in Fig. 6, top left panel.
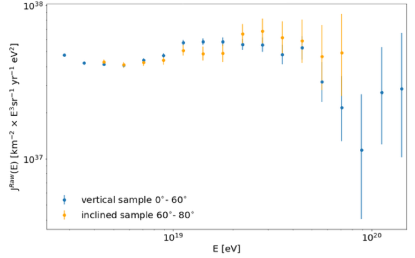
The energy spectrum: The estimation of the energy spectrum of cosmic rays for the vertical (zenith angle ) and the inclined ( zenith angle ) samples, detected with the surface detector, is derived by counting the number of observed showers in differential energy bins and dividing it by the detector exposure. The bin size is constant in the logarithm of the energy, and the bin width corresponds approximately to the energy resolution. The energy threshold is fixed at 2.5 EeV for vertical events and 4 EeV for inclined events, as this is the energy above which the surface detector acceptance becomes independent of the mass and energy of the primary cosmic ray. The energy spectra are shown in Fig. 6, top right panel. Further details are given in [4, 25].
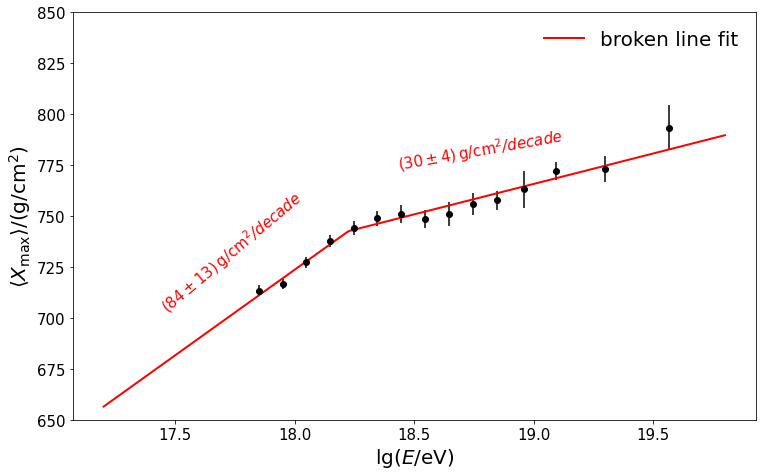
The depth of the shower maximum: The estimation of the atmospheric depth at which the deposited energy for a cosmic-ray shower as a function of atmospheric depth reaches its maximum, relies on the reconstruction of the longitudinal profile of events measured by the fluorescence detector, and at least one coincident surface detector station (hybrid events) [5]. The distributions in differential energy bins above 1 EeV for events with zenith angle less than are built and the energy dependence of their mean and standard deviation is derived. These can be compared to those obtained from simulations of showers produced by proton and iron primaries. The rate of change of the mean per decade of energy, the so-called elongation rate, is plotted in Fig. 6, bottom left panel.
The measurement of the p-air cross-section: The proton-air cross section for particle production at a center-of-mass energy per nucleon of 57 TeV can be estimated by studying the shape of the distribution of . The attenuation length of primary cosmic rays in the atmosphere is reflected in the tail of the distribution at very high values of , which follows an exponential law [8].
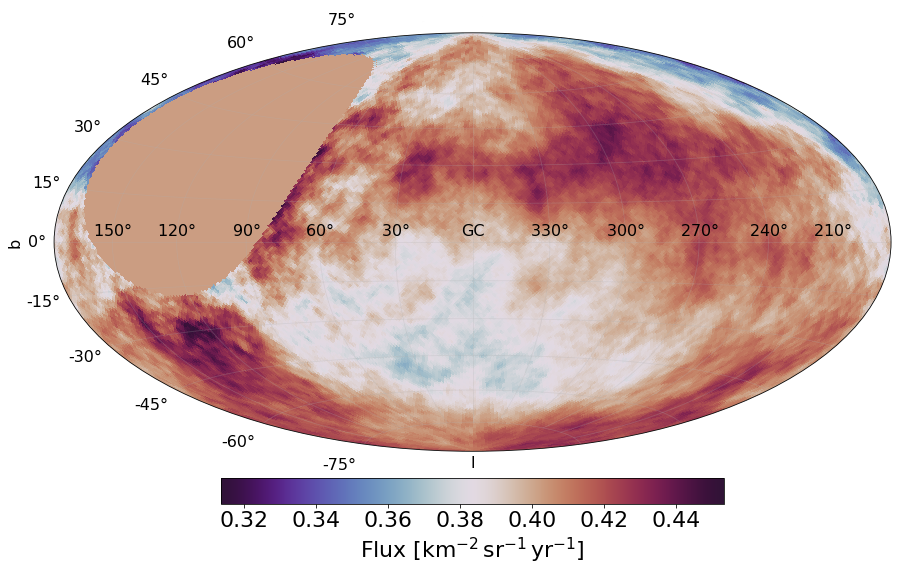
The UHECR sky: The distribution of the reconstructed arrival directions of cosmic rays detected by the surface detector is studied to search for anisotropies at large angular scales [3]. The search is carried out by looking for non-uniformities in right ascension, as, for arrays that operate with close to 100% efficiency, the total exposure as a function of this angle is almost constant. A search for the first harmonic modulation in right ascension is performed by applying the Rayleigh formalism [26]. In Fig. 6, bottom right panel, the resulting smoothed flux map in Galactic coordinates for events with energies above 8 EeV is shown.
6 Catalog of the 100 highest-energy events
In 2023 the Pierre Auger Collaboration published a catalog of the 100 highest-energy events [18] collected during Phase I of the data taking, along with the nine highest-energy hybrid events used for their calibration, demonstrating the quality of the data underlying the physics measurements carried out at the Observatory. The paper also describes the instrumentation and the methods used to detect and reconstruct cosmic rays. The events have been published under the Catalog tab in the Portal and their main features plus additional information are available for inspection.
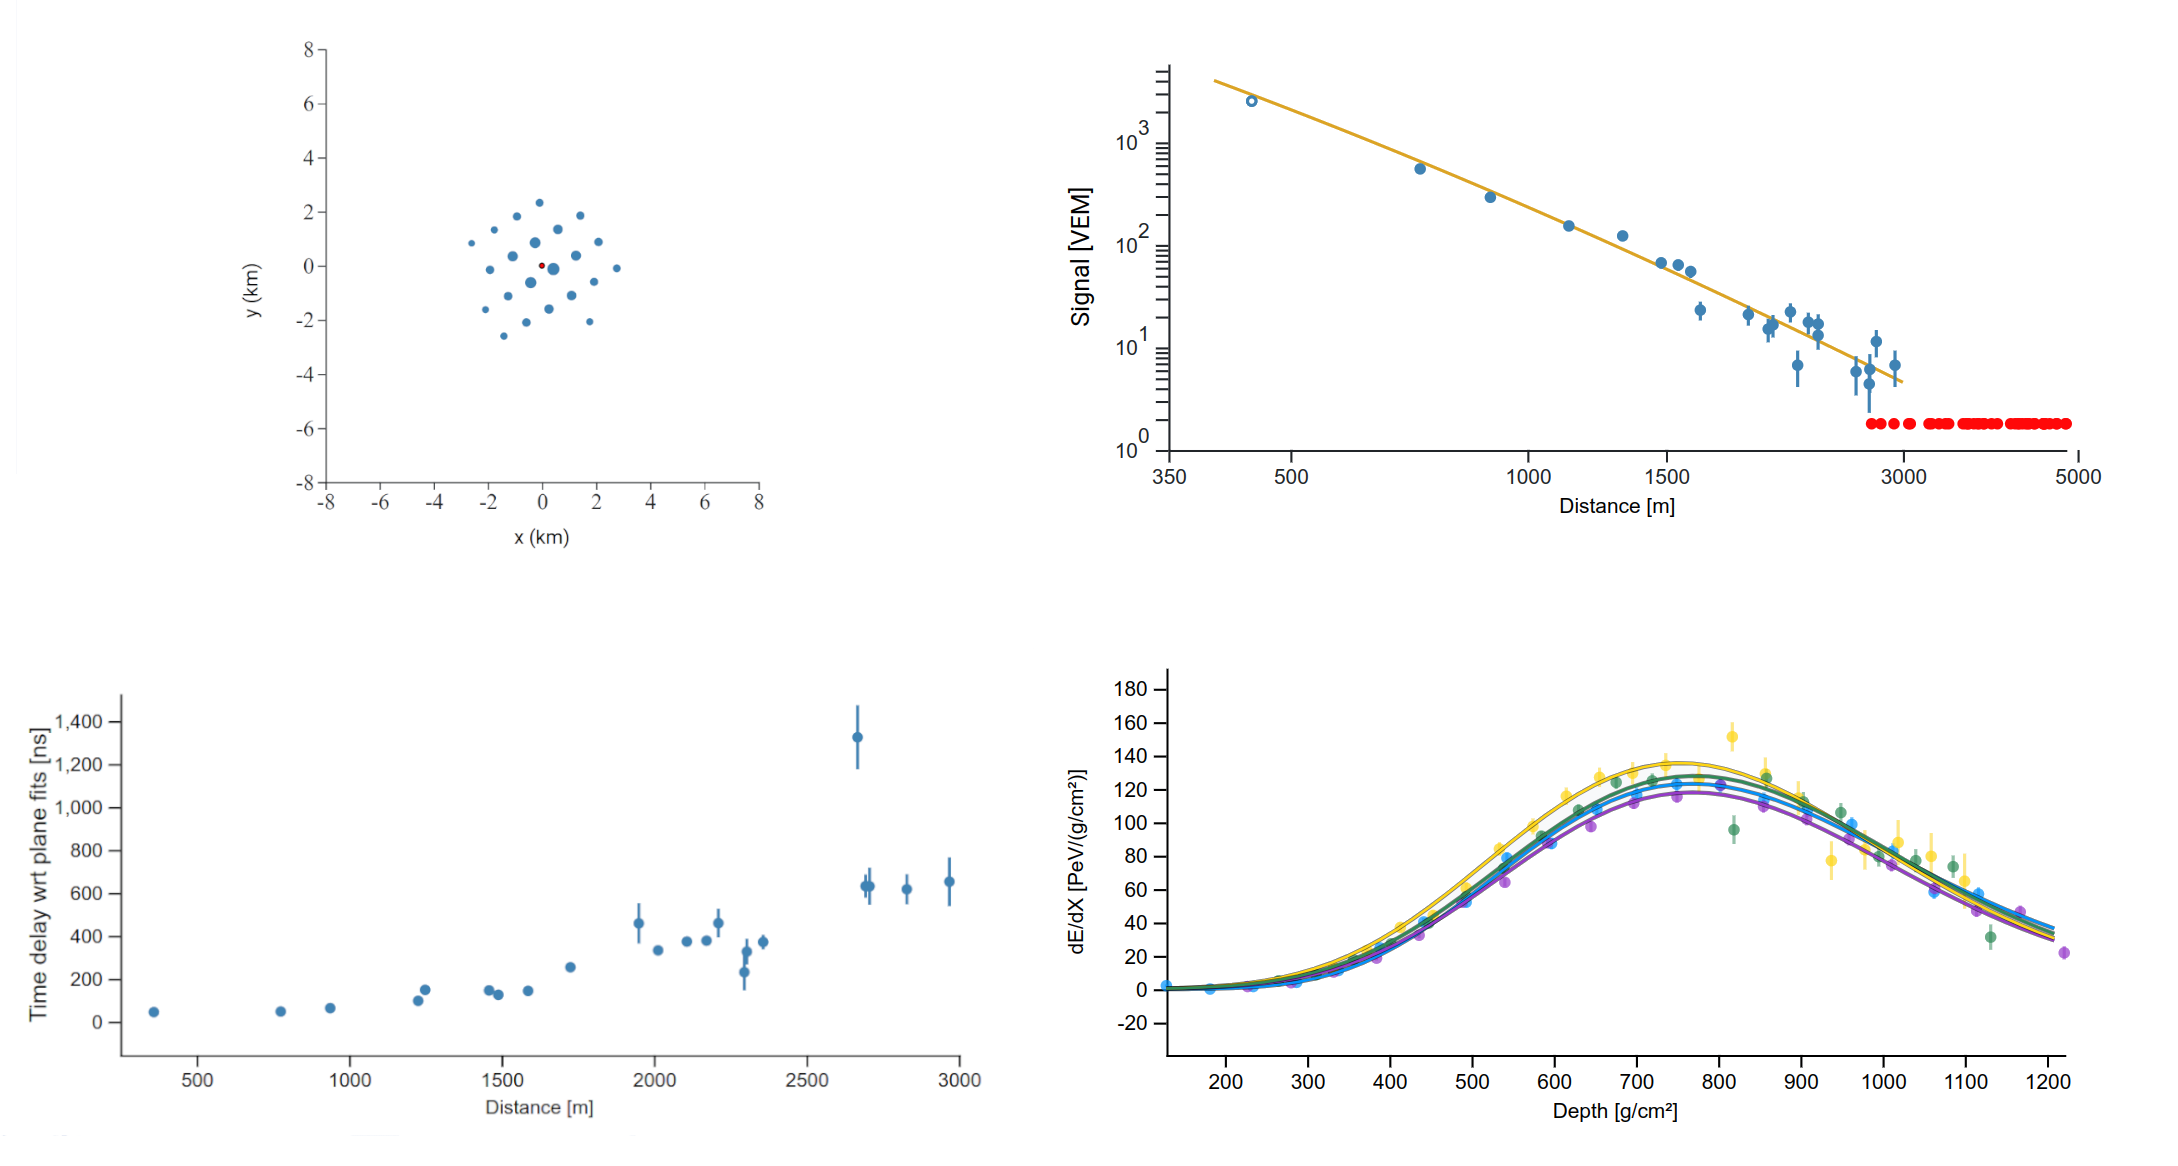
In Fig. 7 the main characteristics of the highest energy multi-eye hybrid event in the catalog, PAO100815 (id 102266222400), that occurred on 15 August 2010, with a measured energy of 82 EeV and zenith angle of 53∘, hitting 22 surface detector stations and all four sites of the fluorescence detector, are shown. The footprint in a plane perpendicular to the shower arrival direction (top left panel) and the lateral distribution of the recorded signal as a function of the distance to the shower core in log-log scale are plotted (top right panel). The user can also view the time delays in nanoseconds with respect to a fit that assumes a plane shower front for the triggered stations (bottom left panel) and the reconstructed energy deposited in the atmosphere as measured by the fluorescence telescopes (bottom right panel).
7 Outreach
For many years the Pierre Auger Collaboration has carried out an extensive education and outreach program for disseminating physics results, both locally and world-wide.
With the aim of facilitating its use by the general public, the Portal has been equipped with an Outreach tab which is itself a ”mini-framework” built with the same spirit as for the research part, but with a simplified format. The same types of data are available in the outreach framework (cosmic rays, scalers and meteorological data) and provided in summary CSV files. The tab is implementing a multilingual ”in-a-nutshell” description of the physics behind UHECR research and of the techniques for observing extensive air showers at the ground. An overview of the Observatory detectors and their working principles is provided, with the help of some explanatory videos, along with a simplified description of the main achievements of the Collaboration.
Exemplary tutorial and analysis tools have been developed and are linked to exercises dedicated to students, teachers and citizen-scientists in the general public, providing the necessary resources to understand the data and an invitation to use them for their own inquiry by developing original education and outreach activities. Some of the exercises are described below.
Exercise using surface detector data: The estimation of the energy spectrum of cosmic-rays as detected by the surface detector is presented in this exercise, guiding the user to plot a histogram of the number of events detected in differential energy bins and normalizing it by the detector exposure. The exercise is intended to answer some of the questions the reader might have when approaching cosmic-ray physics, such as how the energy of a cosmic-ray primary particle relates to every-day life quantities, how rare are cosmic rays at these energies and what is the energy carried by cosmic rays.
Exercise using hybrid data: This notebook provides an example of how to carry out a simple analysis of the relative composition differences between cosmic rays coming from different parts of the sky. Data collected with the surface and the fluorescence detectors simultaneously, the so-called hybrid events, can be used to extract information related to primary cosmic-ray composition. The result is shown in a sky-map in Galactic coordinates.
Exercises using other-than cosmic-ray data: Two notebooks are dedicated to other-than cosmic-ray data: atmospheric and space-weather data. Weather-stations data are used to study the atmospheric conditions at the Observatory site. In particular, the exercise focuses on how to exploit weather stations data to calculate the value of air-density in different zones of the detection site. Data acquired via the so-called ”scaler mode” can be used for space-weather science. In this notebook the user can see how the event rate depends on the local weather conditions, such as pressure, temperature and wind speed.
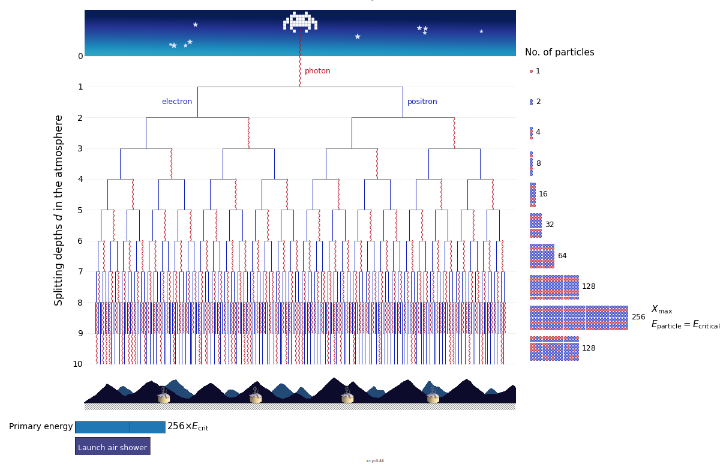
Exercise on the shower development: A simple toy-model for the description of the development of an extensive air shower is presented in this notebook. An interactive example can be run to understand the process of particle multiplication occurring during shower development from the first interaction to reach billions of particles at the observation level. The sketch of the development of an electromagnetic cascade is shown in Fig. 8. A colour histogram of the longitudinal shower profile is plotted on the right hand-side.
8 Outlook
The Collaboration has been committed to opening the access to its data, according to the FAIR principles, since the foundation of the Observatory. Data from the Pierre Auger Observatory come from a variety of instruments and take many forms, starting from raw experimental data, through reconstructed events and datasets of higher level generated by analysis workflows all the way to data presented in scientific publications. Given the complexity and the diversity of the experimental data involved, the process of releasing its data had to be started gradually.
The first step towards public data dates back to 2007 with a public event browser of 1% of cosmic-ray data. The Open Data Portal, firstly set up in February 2021 with 10% of the cosmic-ray events, has been updated and extended, by including other types of data and a catalog of the 100 highest-energy cosmic-ray events detected so far. By the end of 2023, the release of 10% data collected with the lower energy extensions of the Observatory is planned.
To facilitate the continued effort of the Portal maintenance, a task for Open Data has been created under the responsibility of the Project Management and in synergy with the related physics tasks. A standardized procedure has been designed to produce the simplified and portable format for Open Data along with the proprietary binary files. Code libraries are maintained within the Collaboration’s software repository. The validation of the data samples and the codes to be released is performed under the supervision of analysis and detector experts and certified by the related physics tasks. Finally the accompanying documentation follows the standard internal review for publication.
Although few scientific papers using the Open Data have appeared on journals or the ArXiv so far, the visits to the Portal, tracked via Zenodo and Matomo, number more than 20 000, while downloads of cosmic-ray samples number more than 2 000 since its first publication in 2021.
Open Data offer the basis for the development of diverse activities, dedicated both to high-school and higher level students and to the general public, focused on learning physics and enjoying programming and data analysis. The Collaboration actively participates in various projects to engage the general public in cosmic-ray science and in the physics of the Observatory, by providing open-access to cosmic-ray data and tools for astro-particle physics dissemination. In this context we quote the International Cosmic Day and the events carried out for the International Masterclasses program, organized within the IPPOG consortium, involving thousands of high school students in different countries each year. For further details please refer to [27].
In June 2023, the Collaboration Board approved the increase of the fraction of released cosmic-ray data to 30%, planned for 2024 to mark the 20th anniversary of the official start of data taking at the Observatory, that will be applied to the whole Phase I data of the Observatory. The members of the Collaboration are convinced that this will further boost the interest in and the use of the Observatory data.
Future samples from the upgraded Observatory [28] including new detectors, such as surface detector scintillators, underground muon detectors and radio antennas, will be easily integrated into this framework to produce Phase II data, on which the Collaboration will certainly keep the commitment to openness.
Acknowledgments
The successful installation, commissioning, and operation of the Pierre Auger Observatory would not have been possible without the strong commitment and effort from the technical and administrative staff in Malargüe. We are very grateful to the following agencies and organizations for financial support:
Argentina – Comisión Nacional de Energía Atómica; Agencia Nacional de Promoción Científica y Tecnológica (ANPCyT); Consejo Nacional de Investigaciones Científicas y Técnicas (CONICET); Gobierno de la Provincia de Mendoza; Municipalidad de Malargüe; NDM Holdings and Valle Las Leñas; in gratitude for their continuing cooperation over land access; Australia – the Australian Research Council; Belgium – Fonds de la Recherche Scientifique (FNRS); Research Foundation Flanders (FWO), Marie Curie Action of the European Union Grant No. 101107047; Brazil – Conselho Nacional de Desenvolvimento Científico e Tecnológico (CNPq); Financiadora de Estudos e Projetos (FINEP); Fundação de Amparo à Pesquisa do Estado de Rio de Janeiro (FAPERJ); São Paulo Research Foundation (FAPESP) Grants No. 2019/10151-2, No. 2010/07359-6 and No. 1999/05404-3; Ministério da Ciência, Tecnologia, Inovações e Comunicações (MCTIC); Czech Republic – Grant No. MSMT CR LTT18004, LM2015038, LM2018102, CZ.02.1.01/0.0/0.0/16_013/0001402, CZ.02.1.01/0.0/0.0/18_046/0016010 and CZ.02.1.01/0.0/0.0/17_049/0008422; France – Centre de Calcul IN2P3/CNRS; Centre National de la Recherche Scientifique (CNRS); Conseil Régional Ile-de-France; Département Physique Nucléaire et Corpusculaire (PNC-IN2P3/CNRS); Département Sciences de l’Univers (SDU-INSU/CNRS); Institut Lagrange de Paris (ILP) Grant No. LABEX ANR-10-LABX-63 within the Investissements d’Avenir Programme Grant No. ANR-11-IDEX-0004-02; Germany – Bundesministerium für Bildung und Forschung (BMBF); Deutsche Forschungsgemeinschaft (DFG); Finanzministerium Baden-Württemberg; Helmholtz Alliance for Astroparticle Physics (HAP); Helmholtz-Gemeinschaft Deutscher Forschungszentren (HGF); Ministerium für Kultur und Wissenschaft des Landes Nordrhein-Westfalen; Ministerium für Wissenschaft, Forschung und Kunst des Landes Baden-Württemberg; Italy – Istituto Nazionale di Fisica Nucleare (INFN); Istituto Nazionale di Astrofisica (INAF); Ministero dell’Università e della Ricerca (MUR); CETEMPS Center of Excellence; Ministero degli Affari Esteri (MAE), ICSC Centro Nazionale di Ricerca in High Performance Computing, Big Data and Quantum Computing, funded by European Union NextGenerationEU, reference code CN_00000013; México – Consejo Nacional de Ciencia y Tecnología (CONACYT) No. 167733; Universidad Nacional Autónoma de México (UNAM); PAPIIT DGAPA-UNAM; The Netherlands – Ministry of Education, Culture and Science; Netherlands Organisation for Scientific Research (NWO); Dutch national e-infrastructure with the support of SURF Cooperative; Poland – Ministry of Education and Science, grants No. DIR/WK/2018/11 and 2022/WK/12; National Science Centre, grants No. 2016/22/M/ST9/00198, 2016/23/B/ST9/01635, 2020/39/B/ST9/01398, and 2022/45/B/ST9/02163; Portugal – Portuguese national funds and FEDER funds within Programa Operacional Factores de Competitividade through Fundação para a Ciência e a Tecnologia (COMPETE); Romania – Ministry of Research, Innovation and Digitization, CNCS-UEFISCDI, contract no. 30N/2023 under Romanian National Core Program LAPLAS VII, grant no. PN 23 21 01 02 and project number PN-III-P1-1.1-TE-2021-0924/TE57/2022, within PNCDI III; Slovenia – Slovenian Research Agency, grants P1-0031, P1-0385, I0-0033, N1-0111; Spain – Ministerio de Economía, Industria y Competitividad (FPA2017-85114-P and PID2019-104676GB-C32), Xunta de Galicia (ED431C 2017/07), Junta de Andalucía (SOMM17/6104/UGR, P18-FR-4314) Feder Funds, RENATA Red Nacional Temática de Astropartículas (FPA2015-68783-REDT) and María de Maeztu Unit of Excellence (MDM-2016-0692); USA – Department of Energy, Contracts No. DE-AC02-07CH11359, No. DE-FR02-04ER41300, No. DE-FG02-99ER41107 and No. DE-SC0011689; National Science Foundation, Grant No. 0450696; The Grainger Foundation; Marie Curie-IRSES/EPLANET; European Particle Physics Latin American Network; and UNESCO.
References
- [1] Pierre Auger Collaboration [A. Aab, et al.], Nucl. Instrum. Meth. A 798 (2015) 172-213 https://doi.org/10.1016/j.nima.2015.06.058
- [2] Pierre Auger Collaboration [J. Abraham et al.], Nucl. Instrum. Meth. A 523 (2004) 50, https://doi.org/10.1016/j.nima.2003.12.012
- [3] Pierre Auger Collaboration [A. Aab, et al.], Science 357 (2017) 1266, https://doi.org/10.1126/science.aan4338, http://arxiv.org/abs/1709.07321, Pierre Auger Collaboration [P. Abreu, et al.], Astrophys. J. 935 (2022) 170, https://doi.org/10.3847/1538-4357/ac7d4e, http://arxiv.org/abs/2206.13492
- [4] Pierre Auger Collaboration [A. Aab, et al.], Phys. Rev. D 102 (2020) 062005, https://doi.org/10.1103/PhysRevD.102.062005, http://arxiv.org/abs/2008.06486 Pierre Auger Collaboration [A. Aab, et al.], Phys. Rev. Lett. 125 (2020) 121106, https://doi.org/10.1103/PhysRevLett.125.121106, http://arxiv.org/abs/2008.06488
- [5] Pierre Auger Collaboration [A. Aab, et al.], Phys. Rev. D 90 (2014) 122005, https://doi.org/10.1103/PhysRevD.90.122005, http://arxiv.org/abs/1409.4809v3
- [6] Pierre Auger Collaboration [A. Abdul Halim, et al.], JCAP 05 (2023) 024, https://doi.org/10.1088/1475-7516/2023/05/024, https://arxiv.org/abs/2211.02857
- [7] Pierre Auger Collaboration [P. Abreu, et al.], JCAP 05 (2023) 021, https://doi.org/10.1088/1475-7516/2023/05/021, https://arxiv.org/abs/2209.05926 Pierre Auger Collaboration [A. Aab, et al.], JCAP 10 (2019) 022, https://doi.org/10.1088/1475-7516/2019/10/022, https://arxiv.org/abs/1906.07422
- [8] Pierre Auger Collaboration [P. Abreu, et al.], Phys. Rev. Lett. 109 (2012) 062002, https://doi.org/10.1103/PhysRevLett.109.062002, http://arxiv.org/abs/1208.1520v2
- [9] Pierre Auger Collaboration [A. Aab, et al.], Front. Astron. Space Sci. 6 (2019) 24, https://doi.org/10.3389/fspas.2019.00024
- [10] Pierre Auger Collaboration [A. Aab, et al.], Earth and Space Science, 7, e2019EA000582 https://doi.org/10.1029/2019EA000582 R. Colalillo for the Pierre Auger Collaboration, PoS ICRC2021 395, https://pos.sissa.it/395/395/
- [11] Pierre Auger Collaboration [P. Abreu, et al.], JINST, 6 (2011) P01003; M. Schimassek for the Pierre Auger Collaboration, PoS ICRC2019 1147, https://pos.sissa.it/358/1147
- [12] Pierre Auger Observatory Public Event Browser http://labdpr.cab.cnea.gov.ar/ED-en/index.php
- [13] Pierre Auger Observatory Open Data Portal https://opendata.auger.org/
- [14] The Pierre Auger Collaboration, Data open-access policy of the Pierre Auger Observatory https://opendata.auger.org/AugerOpenDataPolicy.pdf
- [15] Wilkinson, M., et al. The FAIR Guiding Principles for scientific data management and stewardship. Sci Data 3 (2016) 160018. https://doi.org/10.1038/sdata.2016.18 and https://openaccess.mpg.de/Berlin-Declaration
- [16] V. Scherini for the Pierre Auger Collaboration, PoS 37th ICRC (2021) 1386, https://pos.sissa.it/395/1386/
- [17] P. L. Ghia for the Pierre Auger Collaboration, PoS 38th ICRC (2023) 1616, https://pos.sissa.it/444/1616/
- [18] Pierre Auger Collaboration [A. Abdul Halim, et al.], Astrophys. J. Suppl. 264, 2 (2023) 50, https://doi.org/10.3847/1538-4365/aca537, http://arxiv.org/abs/2211.16020
- [19] Pierre Auger Observatory Open Data, Zenodo 10.5281/zenodo.4487612
- [20] Pierre Auger Collaboration [A. Aab, et al.], JINST 12, 2 (2017) P022006, https://doi.org/10.1088/1748-0221/12/02/P02006, https://arxiv.org/abs/1702.02835
- [21] Pierre Auger Collaboration [A. Aab, et al.], JINST 15 (2020) P10021, https://doi.org/10.1088/1748-0221/15/10/p10021
- [22] Pierre Auger Collaboration [A. Aab, et al.], JCAP 03 (2019) 018, https://doi.org/10.1088/1475-7516/2019/03/018
- [23] Pierre Auger Collaboration [A. Aab et al.], Phys. Rev. D 100 (2019) 082003, https://doi.org/10.1103/PhysRevD.100.082003
- [24] Pierre Auger Collaboration [J. Abraham et al.] Phys. Rev. Lett. 101 (2008) 061101 https://doi.org/10.1103/PhysRevLett.101.061101
- [25] Pierre Auger Collaboration [A. Aab, et al.], JCAP 08 (2015) 49, https://doi.org/10.1088/1475-7516/2015/08/049
- [26] J. Linsley, Phys. Rev. Lett. 34 (1975) 1530, https://doi.org/10.1103/PhysRevLett.34.1530
- [27] R. Sarmento for the Pierre Auger Collaboration, PoS 38th ICRC (2023) 1611, https://pos.sissa.it/444/1611/
- [28] Pierre Auger Collaboration [A. Aab, et al.], Report FERMILAB-DESIGN-2016-05, https://arxiv.org/abs/1604.03637