The Sun-Earth-Moon Connection:
II–Solar Wind and Lunar Surface Interaction
Abstract
Context: In the pursuit of lunar exploration and the investigation of water presence on the lunar surface, a comprehensive understanding of plasma-surface interactions is crucial since the regolith’s space weathering can create H2O. However, the Moon is in the Earth’s magnetotail for nearly 20% of its orbit, which could affect this water creation on the side facing the Earth if this condition shields it from the solar wind.
Aims: The objective of this study is to understand how the passage of the Moon in the Earth’s magnetotail affects the plasma delivery near the lunar surface. Method: The Particle-In-Cell Electromagnetic (EM) Relativistic Global Model, known as IAPIC, is employed to kinetically simulate the Solar Wind-Magnetosphere-Ionosphere-Moon Coupling. Results: The Earth’s magnetotail does not prevent the influx of solar wind ions and ionospheric ions into the solar environment; therefore the space weathering of the regolith is not stopped in these conditions. In addition, the charge separation of solar wind ions and electrons happens is modeled, leading to electric fields and charging of the lunar surface that can be validated by observations. Conclusion: The study of the Sun-Earth-Moon system provides insight into the lunar environment while in the magnetotail, which is essential to better interpret the results of future Lunar missions. It also provides insights in the Lunar charging in different conditions that could affect the human presence on the Moon.
JGR: Space Physics \addeditorsb \addeditorgg \addeditorsh National Institute of Aerospace, 100 Exploration Way, Hampton, VA 23666 Jet Propulsion Laboratory, California Institute of Technology, M/S 183–401, 4800 Oak Grove Drive, Pasadena, CA 91109, USA Chemistry and Dynamics Branch, Science Directorate, NASA Langley Research Center, Hampton, Virginia, USA Institut d’Astrophysique de Paris, UMR7095, Sorbonne Université, Paris, France Department of Physics, University of Alberta, Edmonton, Alberta, Canada, Department of Physics and Astronomy, University of Calgary, Calgary, Alberta, Canada. Science Systems and Application Inc, Hampton, Va, USA \correspondingauthorSuleiman M Barakasuleiman.baraka@nianet.org {keypoints}
A fully kinetic simulation of the Sun-Earth-moon system was performed
The Lunar surface charging and the wake dynamics were evaluated
The Earth’s magnetotail does not prevent solar-wind ions and ionospheric ions from reaching the Lunar environment.
1 Introduction
As exploration efforts in the Lunar environment pick up pace, many questions arise concerning the source of water, its potential movement towards the poles, and its accessibility for human exploration. Among these questions is the extent to which the solar wind (SW) contributes to water production by implanting particles. The Lunar regolith, which comprises a large percentage the surface of the Moon, is formed by a constant barrage of large and small meteorites, as well as the unrelenting impact of solar wind. As a result, it serves as the actual boundary between the Moon and the surrounding interplanetary magnetic field and plasmas (McKay \BOthers., \APACyear1991, and references therein). The investigation of the interaction of solar wind protons with the Lunar regolith using data from the Lunar Prospector mission found that the solar wind protons can penetrate up to several tens of centimeters into the Lunar regolith, causing a significant chemical alteration of the surface materials (Lucey \BOthers., \APACyear2006). Multiple investigations have demonstrated that the ions found in the solar wind have the propensity to react with the upper layers of the Lunar regolith, as well as the rocks present on the surface (Taylor, \APACyear1982; Halekas \BOthers., \APACyear2012; Poppe, \APACyear2019). When the energetic ions interact with the crystalline structure, they prompt O atoms to respond, which can eventually lead to the creation of OH or . Recent observations from the Lunar surface by Chang’e 5, as reported by Mamo \BOthers. (\APACyear2022); Lin \BOthers. (\APACyear2022), indicate that a significant quantity of water is present in undisturbed regolith. In contrast, the regolith that has been disturbed by the impact of the lander’s rockets, i.e., the lower layers, was found to be relatively -depleted. Water molecules are a major component of the Lunar exosphere, resulting from various processes such as chemical reactions and the release of water from meteorite impacts. The studying of the water amount variations in the Lunar exosphere during the Moon’s passage through the Earth’s magnetotail could help understand the relative importance of these processes (see e.g. Wang \BOthers., \APACyear2021). This method assumed that the solar wind cannot directly produce water during these conditions. However, while the magnetosphere is a barrier against the direct impact of the solar wind, recent research has revealed that its behavior is more intricate than previously believed (Egan \BOthers., \APACyear2019). Recent measurements have indeed been challenging the belief that the magnetosphere was protecting against atmospheric escape. Notably, polar outflow can trigger the escape of significant amounts of through the poles, comparable to the rate of escape for unmagnetized planets (Gronoff \BOthers., \APACyear2020). As a result, it is crucial to revise our understanding of the Earth’s magnetotail surroundings and its impact on the Lunar environment. Previous researches have concentrated on the effect of the passage of the Moon through the Earth’s magnetotail on the Lunar exosphere (Wilson \BOthers., \APACyear2006; Sarantos \BOthers., \APACyear2008), showing that it affects its composition and impacts the sodium plume.
The solar wind can also induce surface charging on the Lunar surface, which can be a significant concern for human activities due to the risk of equipment discharges that may jeopardize their life support and equipment. Earlier studies (Stubbs \BOthers., \APACyear2007) have addressed the electrostatic charging of the Lunar surface and the electrically driven dust transport. According to Poppe \BOthers. (\APACyear2021), surface charging on the Lunar surface is attributed to tail plasma charging and an additional source generated by currents produced by micrometeorite impacts, which contribute 15%-40% to the total charging. Bale (\APACyear1997) discussed the charge imbalance resulting from the topological differences that induce charge fields in the solar wind plasma near the Moon. Kimura \BBA Nakagawa (\APACyear2008) discovered that ions dominate the dayside while electrons dominate the nightside/wake, causing a considerable potential drop. Lunar Prospector confirmed the theoretically predicted prevalence of negative charges on the shaded side of the Moon (Halekas \BOthers., \APACyear2005). Nonetheless, the impact of the magnetotail on surface charging is still unclear.
Several techniques have been employed to better understand the Lunar plasma environment and address these questions. For instance, space probes such as WIND or NASA/THEMIS-ARTEMIS have been utilized in extensive research (Halekas \BOthers., \APACyear2011; Poppe \BOthers., \APACyear2014, \APACyear2018, \APACyear2021; Fatemi \BOthers., \APACyear2014; Xu \BOthers., \APACyear2019; Akay \BOthers., \APACyear2019; A. Rasca \BOthers., \APACyear2021) to probe in-situ plasma parameters. The magnetic field within the lunar wake is amplified by a factor of 1.4, and this enhancement is accompanied by the presence of asymmetry. Furthermore, the MHD simulation allowed for the calculation of the induced electric field resulting from convection.(e.g. Wang \BOthers., \APACyear2011; Xie \BOthers., \APACyear2013). In addition to space probes, kinetic simulations (e.g. Birch \BBA Chapman, \APACyear2001) have been extensively utilized to supplement the understanding of the Lunar plasma environment.
The MHD simulation in Xie \BOthers. (\APACyear2013) provided insights into the interaction between the solar wind and the Moon, with different IMF orientations including north, radial, and tilted. The simulations were compared with NASA/WIND observations in the Lunar wake, revealing the significant role of electron dynamics in the SW-Moon interaction. Moreover, global hybrid simulations have been employed to model the WIND data and the Lunar wake (e.g. Trávníček \BOthers., \APACyear2005; Fuqua Haviland \BOthers., \APACyear2019; Jin \BBA Pang, \APACyear2020; A. Rasca \BOthers., \APACyear2021; Omelchenko \BOthers., \APACyear2021; A\BPBIP. Rasca \BOthers., \APACyear2022).
In this paper, we present a novel approach to studying the plasma environment of the Sun-Earth-Moon system and its connections using the Particle-In-Cell Electrodynamics Relativistic global Code (Baraka \BOthers., \APACyear2021; Ben-Jaffel \BOthers., \APACyear2021) where the transport of plasma originating from the Earth has been included. This paper follows the work started in Barakat et al. “The Sun-Earth-Moon Connection: I–3D Global Kinetic simulation”, referred to here as Paper I. Paper I concentrated on the simulation of the Earth’s environment and on the modifications/validation of the model. The present paper concentrates on the Lunar environment. In the following, Section 2 quickly summarizes the parameters used in the simulation. Section 3 describes the Lunar plasma environment and the ion transport from the Earth to the Moon as simulated by the model. Section 4 discusses the results in light of previous observations, before the conclusion. \justify
2 Initial conditions and Simulation Model: IAPIC
The initial conditions are similar to the one in Paper I. More specific details on the formulation can be found in (Baraka \BOthers., \APACyear2021). In order to observe the variations in plasma parameters, three distinct regions were selected within the simulation box to investigate how these parameters evolve. The values presented in Table 1 are expressed in code units, and the conversion from real-world values to code units is thoroughly documented in (Baraka \BOthers., \APACyear2021)
| parameters(averaged over | Undisturbed SW | Lunar Dayside() | Lunar Nightside() |
|---|---|---|---|
| Alfven velocity- | 0.22 | 0.1 | 0.14 |
| sound speed- | 0.05 | 0.05 | 0.06 |
| magnetosonic mach number- | 0.92 | 0.62 | 0.5 |
| sonic mach number- | 3.84 | 1.35 | 1.33 |
| alfven mach number- | 0.95 | 0.70 | 0.54 |
| Plasma ion frequency- | 0.02 | 0.02 | 0.03 |
| Plasma electron frequency- | 0.2 | 0.26 | 0.30 |
| Plasma ion gyro frequency– | 0.01 | 0.01 | 0.01 |
| Plasma electron gyro frequency– | 0.97 | 0.65 | 0.75 |
| Ion Intertial Length- | 22.21 | 14.70 | 19.15 |
| Electron Intertial Length- | 2.23 | 1.92 | 1.66 |
| gyro radius- | 0.04 | 0.23 | 0.26 |
| gyro radius- | 1.e-3 | 1.e-3 | 1.e-3 |
| Ion Debye Length- | 0.02 | 0.04 | 0.07 |
| Electron Debye Length- | 3.e-3 | 3.e-3 | 3.e-3 |
| Ion beta - | 0.07 | 3.41 | 2.79 |
| Electron beta– | 0.23 | 0.6 | 0.83 |
| ompi/omci- | 2.32 | 5.19 | 3.46 |
| ompe/omce– | 0.23 | 0.40 | 0.40 |
| / | 3.5e-3 | 1.3e-3 | 1.8e-3 |
| / | 6.2.e-3 | 7.1e-3 | 8.2e-3 |
3 Simulation Results
During the full moon phase, the solar wind impinging on the far magnetotail impacts the lunar surface in various ways, including its electric charging. The present study focuses on the accumulation of solar wind densities, which are considered absorbed by the lunar surface by typical models. Not following that hypothesis leads to the decoupling of ions and electrons, resulting in charge separation and therefore in electric currents.
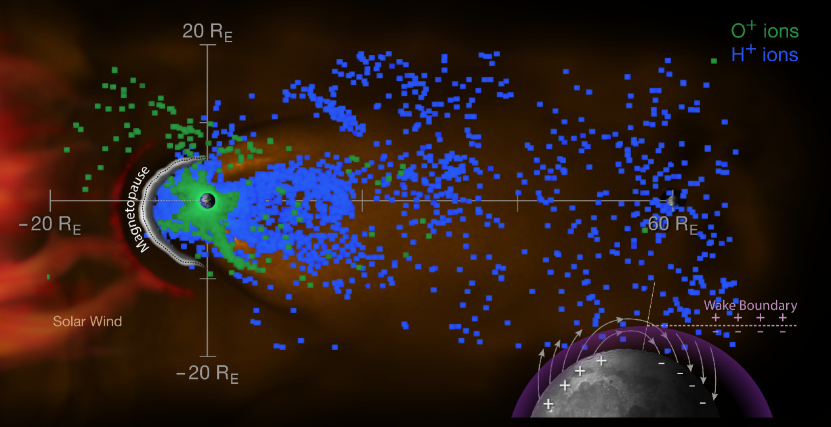
More precisely, the dayside of the lunar surface becomes positively charged, while the nightside becomes negatively charged, as illustrated in Figure (1). The UV radiation would increase the ionization rate on the dayside but are not taken into account in the present study and will deserve further investigation.
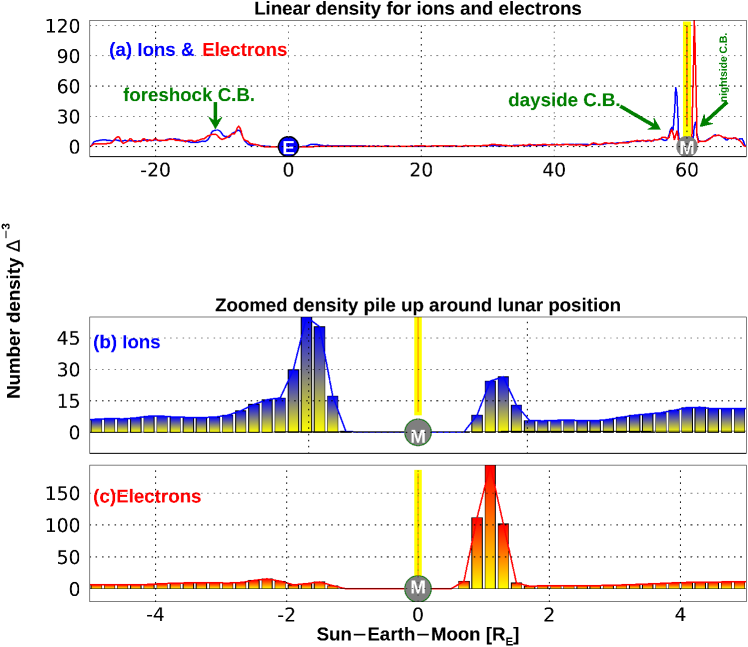
As depicted by the green arrows in Figure 1, anti-corrections of solar wind densities occur in three distinct regions: the foreshock, in the dayside magnetosphere, and on both the lit and dark sides of the moon. Figure 1 (b) and (c) panels provide a close-up look at the ions and electrons drifting towards the day and night sides of the moon (centered for clarity at zero), respectively.
Figure 2 shows the density when the moon is not positioned at 60 along the Sun-Earth line. The figure depicts ion densities (a) and electron densities (b) of the solar wind at in both dawn and dusk directions. The asymmetries between dawn and dusk regions in the deep magnetotail can be highlighted by comparing the two figures. If the moon is absent, the average densities at both dawn and dusk locations should be similar to those at the lunar location. It is important to mention that the total count of solar wind components is determined at the lunar surface within a spherical shell with a thickness of , approximately 174 km, on both sides of the lunar surface.
The results of the simulation indicate that the number of ions on the dayside of the moon outweighs that of electrons, whereas the opposite is true on the night side of the moon. Table 2 presents an estimate of the overall count of ions and electrons, providing a comparison of the respective charges on each side of the moon. Previous research by (Deca \BOthers., \APACyear2015) suggested that the Lunar Magnetic Anomalies, mini-magnetospheres, could exacerbate these charge separations. However, this topic is beyond the scope of the current study. The phenomenon of lunar surface charging has been widely documented and discussed within the scientific community.(Stubbs \BOthers., \APACyear2007; Fatemi \BOthers., \APACyear2014; Poppe \BOthers., \APACyear2014; Halekas \BOthers., \APACyear2014; Lue \BOthers., \APACyear2018; Poppe \BOthers., \APACyear2021).
Due to insufficient time for plasma to refill the wake with thermal velocities, typical lunar wakes often develop in the supersonic background plasma of the solar wind or remote magnetosheath. THEMIS observations have revealed that the field-aligned plasma flow within the lunar wake is highly organized when it is subsonic, particularly in cases where the plasma beta is low (Xu \BOthers., \APACyear2019). The results indicate a preference for electrons to enter the wake from the dawn side of the Moon, while ions tend to refill the wake from the dusk side. The computed charging percentages shown in Table 2 are consistent with the charging percentage reported in (Poppe \BOthers., \APACyear2021).
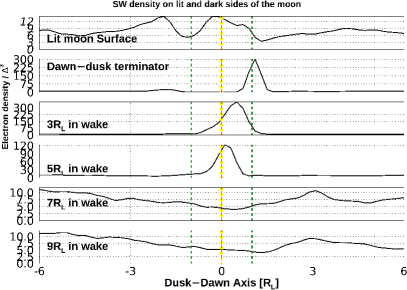
The densities (Figure 3) and temperatures (Figure 4) of ions and electrons at various distances from the lunar surface allow to obtain a comprehensive understanding of the plasma parameters within the lunar wake. Specifically, these values were extracted at the lunar surface, the terminator, and at distances of 3, 5, 7, and 9 inside the wake. The wake had a width of , extending equally on both sides of the dawn-dusk directions.
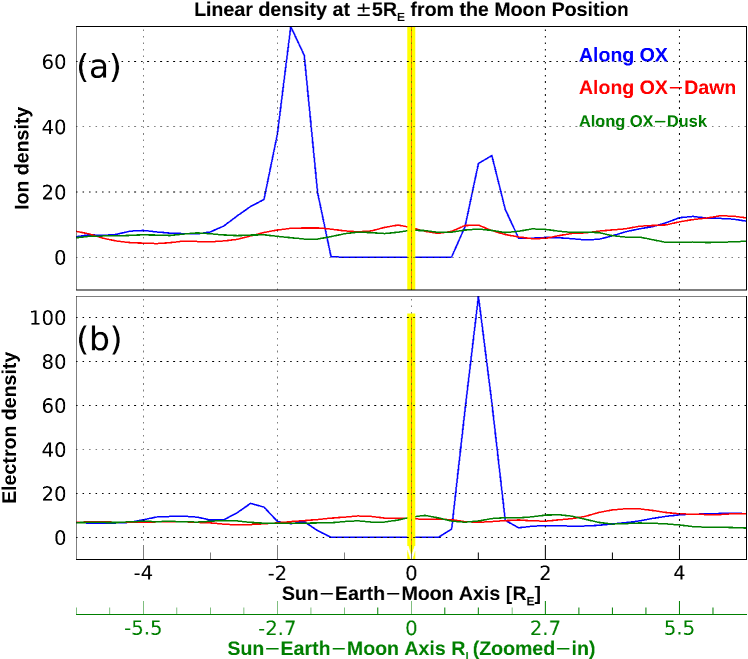
Figure 3-a highlights the tracking of ion densities along the OX direction, starting from the lunar surface and extending up to 9 . The assumption of the plasma accumulating on the lunar surface causes the front flow of the plasma to shift towards a less resistive direction in both the dawn and dusk directions. Specifically, at the subsolar lunar surface, the plasma flow is halted. At the terminator, the ion densities are significantly higher in the dawn direction compared to the dusk direction.
Inside the lunar wake, at a distance of 3, that plasma is slipping into the wake more prominently in the dusk direction, with a ratio of compared to the dawn side. The average density of this slipping plasma is approximately 100 ions cm-3. Moving closer to the lunar surface, at 2 there is an increase in ion filling, which is drifting towards the dusk direction. The rough density at this point is around 20 ion cm-3. However, as we reach 7 , the density begins to fade away, and the number of ions reduces to approximately 6 ion cm-3. This value remains constant until 9 .
In Figure 3-b, an interesting observation is made regarding the number of electrons at the lunar surface’s subsolar point: their count is close to that of ions. However, away from the terminator, a significant change in the ratio occurs, reaching an order of magnitude difference, with electrons outnumbering ions by a factor of 10.
Furthermore, it is noticed that electrons tend to slip inside the lunar wake, showing a preference for the dawn side boundaries of the wake. The average number of electrons decreases from 300 to 5 electrons cm-3 from 3 to 9 within the lunar wake. The obtained results align with the analytical and hybrid-kinetic model simulations, as well as observations from the ARTEMIS mission, as reported in Gharaee \BOthers. (\APACyear2015)
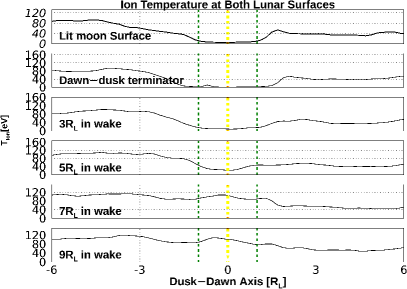
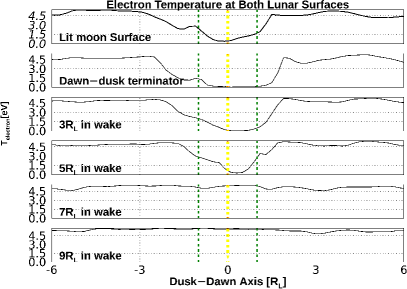
In Figure 4 (a) and (b), the temperatures of solar wind ions and electrons inside the lunar wake are depicted. A significant heating effect is observed, beginning at a distance of 7 and continuing up to 9 The temperature remains elevated within this range.
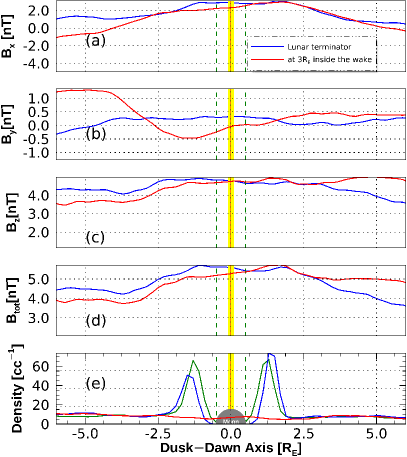
Near the lunar surface, in Figure 5, the magnetic field components () along the ion densities are analyzed at two specific locations: the terminator (depicted in blue) and 3 inside the lunar wake (depicted in red). Ion densities are also shown at the lunar surface (in green).
A minor discrepancy in the magnetic field components can be seen in Figure 5-(b), with the exception of . This could be attributed to the significant disparity in the electric field at a distance of 3 times the lunar radius (3, since the component at this distance exhibits symmetry both at dawn and dusk. It is noteworthy that this component exhibits a change in polarity inside the lunar wake, indicating a distinct magnetic field behavior within that region. The Magnetic field values at 3 [] reads [2,-0.2, 5,5]nT. Looking at the solar wind ion density in Figure 5-(e), we observe an average density of 10 ions cm-3. However, comparing the density at the lunar surface to the density at the terminator, there is a noticeable flare-out of the plasma towards the anti-sunward direction.
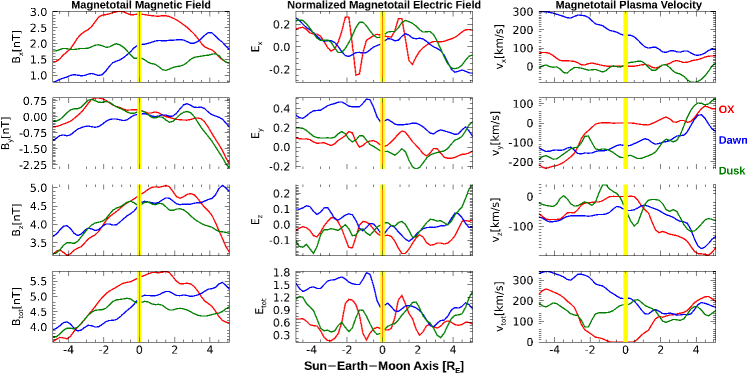
The magnetic field (a-d), electric fields (e-f), and solar wind velocity (i-m) on the moon’s surfaces along three parallel planes: OX (), and at 2 in both the dawn and dusk directions are also of interest to understand the effect of the Moon. Regarding the X-components in Figure 6 for magnetic field (B), electric field (E), and velocity (V), B is enhanced by a factor of 2 on the dayside, indicating bipolarity of E(between -3 and -2) followed by a polarity change from 0.2 to -0.2 at -1.5 , while V decreases until it reaches a stagnant state at the lunar surface. All dawn-dusk components exhibit asymmetry, therefore showing a model prediction that could be tested.
In terms of the Y-components, B shows enhancement, E remains nearly constant, and duskward velocity decreases until stagnation. The asymmetry of solar wind parameters is more pronounced on the dayside compared to the nightside.
As for the Z-components, B increases and exhibits almost symmetric behavior on the dayside, while E shows asymmetry and polarity reversal between –4 and -1, and V decreases from south to north until it reaches a stagnant point at the moon’s position.
Concerning the overall plasma parameters, B is enhanced on both sides of the lunar surface, while a decrease is observed on the dusk side and constancy along the dawn side within the lunar wake. There is a significant asymmetry between dusk and dawn for E and V, while plasma velocity increases inside the lunar wake from 0-150 km/s.
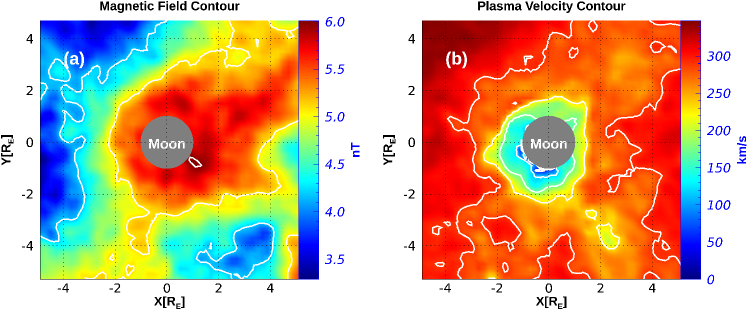
Furthermore, Figure 7 illustrates two contour plots depicting the total magnetic field and total velocity in the equatorial plane, revealing the magnetic field enhancement and the corresponding solar wind ion velocity. In Figure 7-a, the magnetic field enhancement is displayed on both the dayside and nightside of the lunar surface, with an average magnetic value reaching a maximum of 6nT (increased by a factor of 1.2 i.e. (Wang \BOthers., \APACyear2011)). On the other hand, Figure 7-b shows velocity stagnation at the lunar surface ranging from 300 km/s to 0 km/s on the dayside, while inside the lunar wake in the equatorial plane, there is an increase of approximately 150 km/s.
In Kimura \BBA Nakagawa (\APACyear2008), two-dimensional electromagnetic full particle code simulations were employed to successfully simulate the structure of the electric field near the lunar surface. Here, a three-dimensional electromagnetic relativistic global code (Baraka \BOthers., \APACyear2021; Ben-Jaffel \BOthers., \APACyear2021) was used, by incorporating the formula in (Kimura \BBA Nakagawa, \APACyear2008) i.e., , where , is the electron mass, , is the electron velocity, , the electron plasma frequency. and , is the electron charge, to account for the background electric field.
As depicted in Figure 1, and 2, the phenomenon of charge separation gives rise to a potential difference, which we determined as an induced electric field . This electric field was utilized to standardize the solar wind electric field along both surfaces of the moon, specifically within the range of Enlarging the moon’s size by a factor of 5, equivalent to about 1., does not impact the physical microscale of the process, which remains smaller than our grid size as shown in Figure 8.
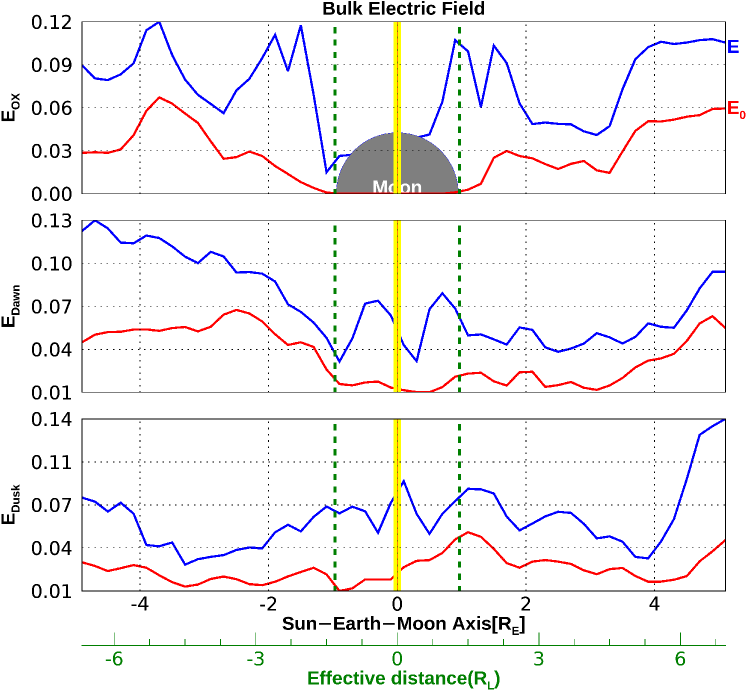
In Figure 8-A, the total Electric Field (E.F.) is plotted along three planes along OX, namely at , (dawn) and at (dusk) directions. The blue line represents the bulk E.F. The red line represents the background E.F. generated solely due to the charge separation. In order to account for an effective electric field, it is important to include the induced electric field () as a crucial component in our kinetic modeling. It results in a bulk E.F. of 2.6 at , 2.1 at , and 2.6 at , particularly at the terminator (). These results are consistent with those reported in Kimura \BBA Nakagawa (\APACyear2008) and the references therein.
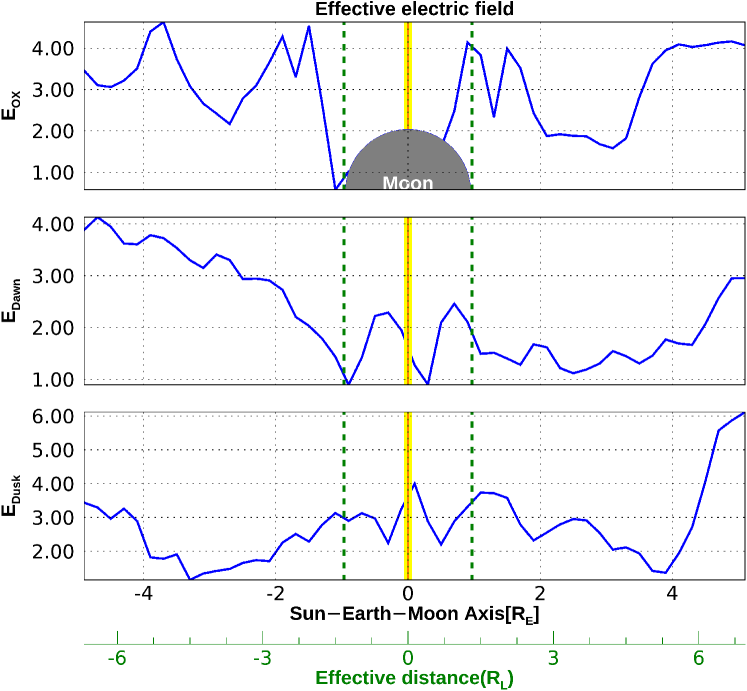
The electric field (Figure 8-B) in the present study has been normalized to the induced E.F. that results from the charge separation of both surfaces of the moon. Additionally, correlation can be performed between the total E.F. and the induced electric field: it reveals anti-correlations at with a correlation coefficient of C.C.=-0.06. At , there is a positive correlation coefficient of C.C.=0.81. In contrast, at , there is a weaker positive correlation with a correlation coefficient of C.C.=0.22.
These findings have a remarkable consistency with Kimura \BBA Nakagawa (\APACyear2008), indicating a complete agreement when there is a drop of the potential inside the lunar wake at around 2 as in Figure 8b. Furthermore, the potential drop caused by surface charging is more pronounced in terms of the potential drop associated with the lunar wake.
Finally, the utilization of 3D simulation allows to obtain the values of enabling a comprehensive three-dimensional analysis of the magnetic field enhancement on both sides of the lunar surface. This enhancement is clearly illustrated in the left and middle panels of Figure 6.
| Charge sign | Lunar dayside | Lunar nightside | charge ratio |
|---|---|---|---|
| Total # of positive charges(ions) | 4.83104 | 2.74104 | 171% |
| Total # of negative charges(electrons) | 1.99104 | 7.04104 | 39.4% |
| Relative charge | 2.84104 | -4.30104 | 66% |
| Number density per unit volume on lunar surface | |||
| Number density | Lunar dayside | Lunar nightside | average density |
| =/V | 58 | 33 | =45.5 |
| =/V | 34 | 85 | |
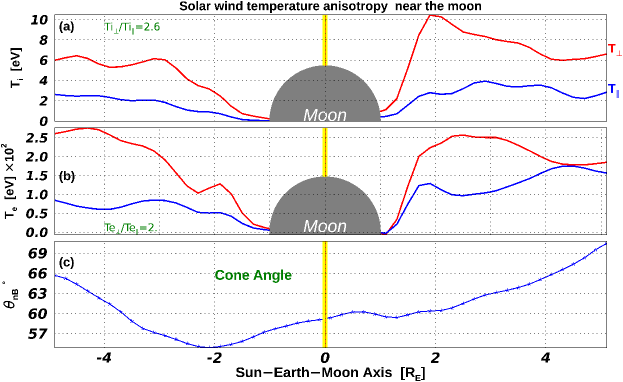
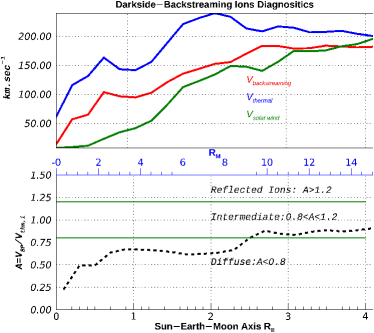
These simulations reveal a novel point regarding backstreaming ions at on both the lit and dark sides of the Moon. The present characterization of the backstreaming ions is consistent with previous studies (Bonifazi \BBA Moreno, \APACyear1981; Baraka \BOthers., \APACyear2021). However, here, the backstreaming ions are not primarily reflected ions but instead diffuse ions with a small percentage of intermediate ions. To prevent any confusion, the reflection presented here is from the nightside of the Moon to its dayside; this is not a reflection from the surface of the Moon which has be demonstrated to be negligible (Holmström \BOthers., \APACyear2012). Figure (10 -a) presents the co-plotted ion perpendicular temperature () and ion parallel temperature () to study the temperature anisotropy in the near Moon during the full Moon phase, in the range of . Similarly, Figure 10 -b presents the electron perpendicular temperature () and electron parallel temperature () to study the temperature anisotropy. Previous studies, such as (Gary \BBA Karimabadi, \APACyear2006; Chandran \BOthers., \APACyear2011; Treumann \BBA Baumjohann, \APACyear2013; Karimabadi \BOthers., \APACyear2014; Gingell \BOthers., \APACyear2015), have also reported temperature anisotropy in the Moon’s vicinity. We find that / and / equal 9.2 and 7, respectively. The electron correlation coefficient is 0.9, and the ion correlation coefficient is 0.75. It has been reported in studies such as Samsonov \BOthers. (\APACyear2012); Grygorov \BOthers. (\APACyear2017) that the backstreaming ions (Figure 9) can affect the temperature anisotropy configuration.
Table 3 presents the bulk speed of the backstreaming ions, along with their corresponding thermal velocities and the solar wind kinetic inflow. Notably, the thermal velocity of the backscattered ions on both sides of the Moon is higher than the bulk flow and the solar wind inflow speed. Additionally, the speeds are slower at the day side of the Moon than at night.
| Speed | -Lunar dayside | -Lunar nightside | Night/day ratio |
|---|---|---|---|
| 58.6 | 136.4 | 2.3 | |
| 99 | 186 | 1.9 | |
| 80.6 | 110 | 1.4 |
In Summary:
The charge separation on the lunar surface gives rise to an induced electric field, which is closely associated with ions backstreaming. This backstreaming phenomenon, in turn, is linked to the temperature anisotropy observed in the lunar environment. Figure 11 depicts the findings related to the connection between the Sun and Earth, the coupling between the magnetosphere and ionosphere, as well as the interaction between the solar wind and the Moon. This sketch offers a visual depiction of the findings from the study and illustrates their interconnections.
4 Discussion on observational implications
This discussion focuses on the Lunar surface charging and on the plasma parameters within the Lunar wake when the Moon is positioned solely along the Sun-Earth line, i.e., during a Lunar eclipse and inside the extended magnetotail of the Earth.
4.1 Lunar Surface Charging
Contrarily to previous studies such as Poppe \BOthers. (\APACyear2014), the present self-consistent simulation did not remove or absorb solar wind particles upon collision with the lunar surface. These particles are instead allowed to accumulate and build up on the lunar unmagnetized barrier. By doing so, we observed charge separation(see Figure 1), which led to a dominance of positively charged particles on the dayside of the Moon and a prevalence of dominance of negatively charged particles on the nightside. One should be careful with this approach, because measurements show that protons are absorbed by the lunar surface (Holmström \BOthers., \APACyear2012), which is what partially leads to the creation of water with the regolith, future work will improve on this interaction.
This approach aimed to account for the total number of charged particles on both Lunar surfaces, as demonstrated in Table 2. Typically, the Debye length determines the distance at which charges are separated or screened. In our case, the charges of piled-up solar wind plasma considered at step 3700 were shielded from the influence of distant particles closer to them. As a result, the total Debye length in the piled-up plasma is given by
| (1) |
as reported in Verscharen \BOthers. (\APACyear2019, Eq. 120).
The charging of the Lunar surface in this complex and non-uniform environment can be attributed to various complex current systems, including photoemission of electrons, plasma electrons, plasma ions, and secondary electrons resulting from surface ionization. (and references therein Halekas \BOthers., \APACyear2005; Stubbs \BOthers., \APACyear2007; Collier \BOthers., \APACyear2014; Verscharen \BOthers., \APACyear2019; Rakesh Chandran \BOthers., \APACyear2022). The amount of charging depends on several factors, including the density of the species present (), as well as the temperatures of the ions and electrons (, respectively), and the bulk flow velocity of the solar wind (), as discussed in Stubbs \BOthers. (\APACyear2014).
The present simulation results, obtained using the PIC code, can be compared with other simulations and observations conducted at local and global scales ((Halekas \BOthers., \APACyear2011); (Poppe \BOthers., \APACyear2014); (Deca \BOthers., \APACyear2015)). Since the present study aims to explore the charging of the lunar surface by analyzing the accumulation of solar wind particles on both sides of the Moon, the density at which the correlation between ions and electrons breaks up can be used to estimate the total number of charges on both lunar surfaces Figures 1 and 2. This breaking of correlations between ions and electrons densities indeed leads to charge separations due to topological differences((Bale, \APACyear1997). The total number of positive and negative charges in a spherical shell with a thickness equivalent to 0.1 (175 km) above the lunar surface has been computed (Table 2). This suggests that the dayside of the Moon is positively charged, in agreement with Kimura \BBA Nakagawa (\APACyear2008), while the nightside of the Moon is negatively charged (Stubbs \BOthers., \APACyear2014). These results are also comparable with measurements (Halekas \BOthers., \APACyear2002). It is worth noting that the linear density at both the dawn and dusk positions in Figure 2 provides an estimate of the density measured along the OX direction of the Moon when it is not in its current position.
Despite previous studies and references indicating a predominance of negative charge in the lunar nightside which could implies that no positive ions are transported to it, the SELENE mission (Nishino \BOthers., \APACyear2010) demonstrated the entry of ions in the lunar wake. The present simulation aligns with these observation: Table 9 shows that approximately 39% of ions detected within the lunar wake are solar wind particle. This result highlights the versatile and inclusive nature of the kinetic simulation of this complex interaction. The potential differences between the two surfaces of the Moon cause a charge separation that leads to the creation of an induced electric field. To determine the background electric field, we utilized the formula outlined in Kimura \BBA Nakagawa (\APACyear2008), which is given by .
As depicted in Figure 8, the electric field intensity along the subsolar Moon is normalized to the background electric field and found to be . Similarly, at dawn and dusk (terminator) directions, the values are and , respectively. These results align with those reported in Kimura \BBA Nakagawa (\APACyear2008), which indicate a measurement of at the terminator.
This result should be put in perspective with other magnetospheric environments: in planets such as Jupiter, the magnetotail current system is influenced by the planetary magnetic field. However, in the cases of Venus and Mars, the magnetotail current system is primarily formed by the solar wind’s magnetic field. The Earth’s magnetotail, on the other hand, can be considered an intermediate case, where the specific configuration depends on the geomagnetic conditions and the dynamics of the magnetotail itself. It is a region connected to the Earth and is populated by hot, rarefied plasma. This is a complex intermediate case study (i.e. Xu2018). Therefore, to accurately account for the effective electric field near the lunar surface, it is essential to employ kinetic modeling, which considers the backstreaming ions and effectively captures the induced electric fields resulting from charge separation. The present results are therefore one of the rare examples of the whole consistent simulation of the system.
4.2 Plasma Parameters Within the Lunar Wake
Figure 5 presents the magnetic field components, total magnetic field, and density of solar wind ions observed at the Lunar terminator and inside the Lunar wake. This figure is evaluated against Poppe \BOthers. (\APACyear2014, Fig. 4), where the two events captured by ARTEMIS are compared with a model. The present simulation results are shown for a single time step (3700 ), whereas, in Figure 4 of Poppe \BOthers. (\APACyear2014), the data was captured over 50 minutes. The magnetic field components inside the lunar wake at coordinates [63,0,0] are computed to be [bx,by,bz]=[2.30,-0.07,4.80]nT. A comparison with Table 1 of Poppe \BOthers. (\APACyear2014) is unfortunately limited to one specific event due to the size of the present simulation box. The March 2011 events has the spacecraft’s location within the simulated region. The model at coordinates [56.9, 19.8, 3.1], gives a magnetic field of [-2.86,-0.87,2.17]nT to be compared with the measured value of [-1.5, 0, -1]nT (Poppe \BOthers., \APACyear2014). The modeled values are almost double the observation; the reason for this discrepancy is related to the different solar wind speed, and initial IMF values. A more detailed study of this exact observation would involve running the model with the exact parameters of that day and is out of the scope of the present study. The Lunar Prospector data show an increase of the magnetic field at the center of the wake followed by a decrease near its boundaries(Akimov \BBA Dyatel, \APACyear2012; Poppe \BOthers., \APACyear2014). These results do not compare directly to our simulations since it takes only a phase of the Moon and do not consider the present alignment. However, Figure 6 shows such an increased magnetic field near the center of the wake, at a total value of 5.5 nT near the center while it goes to 4 nT four Moon radius’s away during the full moon phase. Figure 6-a,e,&i presents an increase in the magnetic field on the dayside Lunar surface (depicted in red) along the X-components of the plasma parameters. This increase corresponds to bipolarity (normalized to induced ) in the electric field, which is a direct consequence of charge separation and induced potential, as well as the stagnated solar wind velocity.
The remaining panels in Figure 6 demonstrate the variations in the magnetic and electric fields, as well as solar wind velocities, across the Y, Z, and total components. The Moon is situated at a distance of . Magnetic field measurements are presented in units of nT, while velocities are given in , The electric field values are normalized based on the induced background field that arises due to charge separations.
Higher solar wind ion velocity/temperature is observed at 5 RE as shown in Table 3. This suggest that external forces, energetic inputs, or non-equilibrium conditions increase these velocities (i.e., Futaana \BOthers., \APACyear2012). It is to be noted that the solar wind not only provides electrons and ions but also 20% of energetic neutral atoms (Vorburger \BOthers., \APACyear2016) whose effects are out of the scope of the present study. In order to address the asymmetry between dawn(blue) and dusk(green), the correlation coefficients were computed for the magnetic and electric fields, as well as solar wind velocities, along the dawn-dusk directions. The analysis revealed that the correlation coefficients for and were negative at both dawn and dusk, with values of -0.76 and -0.11, respectively. In contrast, the correlation coefficient for C.C. is 0.43 was positive at both dawn and dusk, with a value of 0.43. Furthermore, the total magnetic field was found to be positively correlated at both dawn and dusk, with a coefficient of 0.44.
It is noteworthy that the significant disturbances observed in the magnetic field components near the surface of the Moon are of crucial importance since they are directly associated with the interaction between the lunar surface and the solar wind. This can aid in distinguishing the effects of various factors, such as photoelectron radiation and lunar magnetic anomalies, as reported in previous studies (Zhang \BOthers. (\APACyear2020); Deca \BOthers. (\APACyear2015)).
The correlation coefficients for the electric field components were calculated as follows: , , and exhibited negative correlation, with coefficients of -0.06, -0.78, and -0.12, respectively. However, the component showed positive correlation, with a coefficient of 0.7. In addition, the velocities measured at both dawn and dusk were found to be positively correlated, with correlation coefficients of [] equal to 0.3, 0.82, 0.57, and 0.09, respectively.
Apart from highlighting the dawn-dusk asymmetry in the region surrounding the Moon, the dawn (green) and dusk (blue) magnetic and electric fields, as well as velocities, can also serve as a reference level for investigating plasma parameters in the magnetotail, assuming that the Moon is absent from its current location. Thus, these dawn-dusk asymmetric parameters can be employed to analyze the intricate current system in the magnetotail, up to a distance of 65 .
To better visualize the magnetic field enhancement on the lunar dayside and within the wake, we have presented 2D contours in equatorial planes taken at in both the day/night and dawn-dusk directions of the Moon. The Moon is centered at zero as shown in Figure 7. In Figure 7-a, it is evident that the magnetic field is amplified on the illuminated side of the Moon, and its value can be calculated using the formula ) i.e. (Liuzzo \BOthers., \APACyear2021). This formula yields a value of (1.) for the enhancement factor.
Figure 8-A shows the total Electric Field (E.F.) plotted along three planes, OX (at Y=0, Y=(dawn), and at Y=(dusk) directions. The bulk E.F. is shown in blue, while the background E.F. generated only due to charge separations is shown in red. The E.F. is considered at at both the day and night sides of the lunar surface. It is demonstrated in Figure 8 that the charge separation takes place at the lunar surface. The charge separation results in the induced additional E.F. (), which is equal to . To consider the effective E.F., should not be ignored, which can only be obtained by kinetic modeling. It is shown that the bulk E.F.=2.6 at Y=0, 2.1 at , and 2.6 at averaged over in the vicinity of the lunar surface, especially at the terminator . These results are consistent with those reported in Kimura \BBA Nakagawa (and references therein \APACyear2008) . As seen in Figure 1, positive charges dominate the lunar dayside, and the nightside is dominated by negative charges, which also agrees with (Kimura \BBA Nakagawa, \APACyear2008). It is noteworthy that the Correlation Coefficients (C.C.) between these two field components are as follows: along , 0.83 at , and 0.54 at , respectively
Backstreaming ions are present at the lunar surface and within the Lunar wake, according to Bamford \BOthers. (\APACyear2012). This study found that the Electric Field (EF) deflects the incoming solar wind ions and that Chandrayaan-1 has observed backstreaming ions. In Figure 8, we present the effective electric field at both lunar surfaces, which may be responsible for deflecting the incoming solar wind.
Additionally, it has been reported that the solar wind can be absorbed by the lunar surface, backscattered, or cause atoms to be removed from the Lunar regolith by sputtering or desorption (Dandouras \BOthers., \APACyear2023). Some studies have reported that a large percentage of backscattered solar wind ions can result in the formation of Energetic Neutral Atoms (ENA), which have been observed by the Interstellar Boundary Explorer (IBEX) (Allegrini \BOthers., \APACyear2013). Our Electromagnetic PIC Model does not account for ENA emissions, so the information presented in Figure 9 only pertains to charged solar wind ions.
It should be highlighted that the backstreaming ions were not only observed in our simulations, but we were also able to analyze and categorize them based on the ratio between the thermal speed and bulk speed of the solar wind. Specifically, the backstreaming ions observed at both lunar surfaces were identified as being diffuse rather than reflective, which aligns with the criteria previously reported by Baraka \BOthers. (\APACyear2021)
Our simulation resulted in a solar wind bulk flow comprising roughly 23% of backstreaming ions; the analysis accounted for the kinetic effects of these ions. Figure 9 showcases the identification of backstreaming ions in the vicinity of the Moon, which are attributed to temperature anisotropy, as depicted in Figure 10. In brief, the present simulation allowed the solar wind to accumulate on the lunar surface. This resulted in charge separations that generated a potential difference and induced an additional electric field component. In the absence of the lunar magnetosphere, the electric field deflected the incoming solar wind, leading to backstreaming ions at the lunar surface, which was associated with temperature anisotropy. This approach provides complementary information to potential future microscale studies of the Moon that investigate the influence of Lunar surface roughness on volatile sources and sinks, abundance, and evolution in the Lunar environment (as discussed in Davidsson \BBA Hosseini (\APACyear2021) and Grumpe \BOthers. (\APACyear2019)), as well as photoelectric emission (Mishra \BBA Bhardwaj, \APACyear2020).
5 Conclusion and Future Work
In these two studies, we have conducted a comprehensive analysis of the solar wind interaction with the lunar surface, taking into account complex current systems originating from various sources. This research presents the first-ever kinetic simulation of the Sun-Earth-Moon system, focusing specifically on a single scenario where the Moon is situated within Earth’s magnetotail.
Our findings reveal that the dayside of the lunar surface is predominantly influenced by positively charged solar wind ions, while the night side experiences a higher concentration of negatively charged electrons, arising from charge separation. This relationship is clearly illustrated in the flow chart provided in Figure 11.
Importantly, our results, more detailed in Paper I, demonstrate that, under these conditions, Earth’s magnetosphere does not protect the Moon from the solar wind, suggesting that the potential water creation process on the lunar surface, driven by the solar wind, is not hindered by Earth’s magnetospheric presence.
Moreover, our investigation has enabled us to explore numerous plasma parameters within the lunar wake. These include plasma ion and electron densities (Figure 1), plasma ion and electron temperatures (Figure 4), the Interplanetary Magnetic Field (IMF) at the terminator and within the wake (Figure 5), backstreaming ion characteristics (Figure 9), solar wind temperature anisotropy (Figure 10), and the effective electric field accounting for the induced electric field resulting from charge separation (Figure 8). These critical aspects of kinetic simulations offer valuable insights into the environmental conditions surrounding the Moon.
Future work will involve placing the Moon in various locations, including those outside of Earth’s magnetotail, examining the effects of different solar activity levels, and improving the modeling of Earth’s polar escape to better understand the transport of oxygen ions to the Moon in these conditions. A more in-depth understanding of the lunar plasma environment will significantly benefit upcoming missions, particularly those enabled by the Artemis program and the Moon to Mars initiative (Dandouras \BOthers., \APACyear2023).
References
- Akay \BOthers. (\APACyear2019) \APACinsertmetastarAkay2019{APACrefauthors}Akay, I\BPBIG., Kaymaz, Z.\BCBL \BBA Sibeck, D\BPBIG. \APACrefYearMonthDay2019. \BBOQ\APACrefatitleMagnetotail boundary crossings at lunar distances: ARTEMIS observations Magnetotail boundary crossings at lunar distances: Artemis observations.\BBCQ \APACjournalVolNumPagesJournal of Atmospheric and Solar-Terrestrial Physics18245–60. \PrintBackRefs\CurrentBib
- Akimov \BBA Dyatel (\APACyear2012) \APACinsertmetastarAkimov2012{APACrefauthors}Akimov, L.\BCBT \BBA Dyatel, N. \APACrefYearMonthDay2012. \BBOQ\APACrefatitleInfluence of the moon on the earth’s magnetosphere at various phases of a solar activity cycle Influence of the moon on the earth’s magnetosphere at various phases of a solar activity cycle.\BBCQ \APACjournalVolNumPagesKinematics and Physics of Celestial Bodies28139. \PrintBackRefs\CurrentBib
- Allegrini \BOthers. (\APACyear2013) \APACinsertmetastarAllegrini2013{APACrefauthors}Allegrini, F., Dayeh, M., Desai, M., Funsten, H., Fuselier, S., Janzen, P.\BDBLothers \APACrefYearMonthDay2013. \BBOQ\APACrefatitleLunar energetic neutral atom (ENA) spectra measured by the interstellar boundary explorer (IBEX) Lunar energetic neutral atom (ena) spectra measured by the interstellar boundary explorer (ibex).\BBCQ \APACjournalVolNumPagesPlanetary and space science85232–242. \PrintBackRefs\CurrentBib
- Bale (\APACyear1997) \APACinsertmetastarBale1997{APACrefauthors}Bale, S. \APACrefYearMonthDay1997. \BBOQ\APACrefatitleShadowed particle distributions near the Moon Shadowed particle distributions near the moon.\BBCQ \APACjournalVolNumPagesJournal of Geophysical Research: Space Physics102A919773–19778. \PrintBackRefs\CurrentBib
- Bamford \BOthers. (\APACyear2012) \APACinsertmetastarBamford2012{APACrefauthors}Bamford, R., Kellett, B., Bradford, W., Norberg, C., Thornton, A., Gibson, K.\BDBLBingham, R. \APACrefYearMonthDay2012. \BBOQ\APACrefatitleMinimagnetospheres above the lunar surface and the formation of lunar swirls Minimagnetospheres above the lunar surface and the formation of lunar swirls.\BBCQ \APACjournalVolNumPagesPhysical Review Letters1098081101. \PrintBackRefs\CurrentBib
- Baraka \BOthers. (\APACyear2021) \APACinsertmetastarBaraka2021{APACrefauthors}Baraka, S\BPBIM., Le Contel, O., Ben-Jaffel, L.\BCBL \BBA Moore, W\BPBIB. \APACrefYearMonthDay2021\APACmonth10. \BBOQ\APACrefatitleThe Impact of Radial and Non-Radial IMF on the Earth’s Magnetopause Size, Shape, and Dawn-Dusk Asymmetry From Global 3D Kinetic Simulations The Impact of Radial and Non-Radial IMF on the Earth’s Magnetopause Size, Shape, and Dawn-Dusk Asymmetry From Global 3D Kinetic Simulations.\BBCQ \APACjournalVolNumPagesJournal of Geophysical Research (Space Physics)12610e29528. {APACrefDOI} 10.1029/2021JA029528 \PrintBackRefs\CurrentBib
- Ben-Jaffel \BOthers. (\APACyear2021) \APACinsertmetastarBen-Jaffel2021{APACrefauthors}Ben-Jaffel, L., Ballester, G\BPBIE., Muñoz, A\BPBIG., Lavvas, P., Sing, D\BPBIK., Sanz-Forcada, J.\BDBLothers \APACrefYearMonthDay2021. \BBOQ\APACrefatitleSignatures of strong magnetization and a metal-poor atmosphere for a Neptune-sized exoplanet Signatures of strong magnetization and a metal-poor atmosphere for a neptune-sized exoplanet.\BBCQ \APACjournalVolNumPagesNature Astronomy1–13. \PrintBackRefs\CurrentBib
- Birch \BBA Chapman (\APACyear2001) \APACinsertmetastarBirch2001{APACrefauthors}Birch, P\BPBIC.\BCBT \BBA Chapman, S\BPBIC. \APACrefYearMonthDay2001. \BBOQ\APACrefatitleParticle-in-cell simulations of the lunar wake with high phase space resolution Particle-in-cell simulations of the lunar wake with high phase space resolution.\BBCQ \APACjournalVolNumPagesGeophysical research letters282219–222. \PrintBackRefs\CurrentBib
- Bonifazi \BBA Moreno (\APACyear1981) \APACinsertmetastarBonifazi1981{APACrefauthors}Bonifazi, C.\BCBT \BBA Moreno, G. \APACrefYearMonthDay1981. \BBOQ\APACrefatitleReflected and diffuse ions backstreaming from the Earth’s bow shock 2. Origin Reflected and diffuse ions backstreaming from the Earth’s bow shock 2. Origin.\BBCQ \APACjournalVolNumPagesJournal of Geophysical Research: Space Physics (1978–2012)86A64405–4413. \PrintBackRefs\CurrentBib
- Chandran \BOthers. (\APACyear2011) \APACinsertmetastarChandran2011{APACrefauthors}Chandran, B\BPBID., Dennis, T\BPBIJ., Quataert, E.\BCBL \BBA Bale, S\BPBID. \APACrefYearMonthDay2011. \BBOQ\APACrefatitleIncorporating kinetic physics into a two-fluid solar-wind model with temperature anisotropy and low-frequency Alfvén-wave turbulence Incorporating kinetic physics into a two-fluid solar-wind model with temperature anisotropy and low-frequency alfvén-wave turbulence.\BBCQ \APACjournalVolNumPagesThe Astrophysical Journal7432197. \PrintBackRefs\CurrentBib
- Collier \BOthers. (\APACyear2014) \APACinsertmetastarCollier2014{APACrefauthors}Collier, M\BPBIR., Snowden, S\BPBIL., Sarantos, M., Benna, M., Carter, J\BPBIA., Cravens, T\BPBIE.\BDBLWalsh, B\BPBIM. \APACrefYearMonthDay2014. \BBOQ\APACrefatitleOn lunar exospheric column densities and solar wind access beyond the terminator from ROSAT soft X-ray observations of solar wind charge exchange On lunar exospheric column densities and solar wind access beyond the terminator from ROSAT soft X-ray observations of solar wind charge exchange.\BBCQ \APACjournalVolNumPagesJournal of Geophysical Research (Planets)1191459–1478. {APACrefURL} http://adsabs.harvard.edu/abs/2014JGRE..119.1459C \PrintBackRefs\CurrentBib
- Dandouras \BOthers. (\APACyear2023) \APACinsertmetastarDandouras2023{APACrefauthors}Dandouras, I., Taylor, M\BPBIG., De Keyser, J., Futaana, Y., Bamford, R\BPBIA., Branduardi-Raymont, G.\BDBLothers \APACrefYearMonthDay2023. \BBOQ\APACrefatitleSpace plasma physics science opportunities for the lunar orbital platform-Gateway Space plasma physics science opportunities for the lunar orbital platform-gateway.\BBCQ \APACjournalVolNumPagesFrontiers in Astronomy and Space Sciences101120302. \PrintBackRefs\CurrentBib
- Davidsson \BBA Hosseini (\APACyear2021) \APACinsertmetastarDavidsson2021{APACrefauthors}Davidsson, B\BPBIJ.\BCBT \BBA Hosseini, S. \APACrefYearMonthDay2021. \BBOQ\APACrefatitleImplications of surface roughness in models of water desorption on the Moon Implications of surface roughness in models of water desorption on the moon.\BBCQ \APACjournalVolNumPagesMonthly Notices of the Royal Astronomical Society50633421–3429. \PrintBackRefs\CurrentBib
- Deca \BOthers. (\APACyear2015) \APACinsertmetastarDeca2015{APACrefauthors}Deca, J., Divin, A., Lembège, B., Horányi, M., Markidis, S.\BCBL \BBA Lapenta, G. \APACrefYearMonthDay2015. \BBOQ\APACrefatitleGeneral mechanism and dynamics of the solar wind interaction with lunar magnetic anomalies from 3-D particle-in-cell simulations General mechanism and dynamics of the solar wind interaction with lunar magnetic anomalies from 3-d particle-in-cell simulations.\BBCQ \APACjournalVolNumPagesJournal of Geophysical Research: Space Physics12086443–6463. \PrintBackRefs\CurrentBib
- Egan \BOthers. (\APACyear2019) \APACinsertmetastarEgan2019{APACrefauthors}Egan, H., Jarvinen, R., Ma, Y.\BCBL \BBA Brain, D. \APACrefYearMonthDay2019. \BBOQ\APACrefatitlePlanetary magnetic field control of ion escape from weakly magnetized planets Planetary magnetic field control of ion escape from weakly magnetized planets.\BBCQ \APACjournalVolNumPagesMonthly Notices of the Royal Astronomical Society48822108–2120. \PrintBackRefs\CurrentBib
- Fatemi \BOthers. (\APACyear2014) \APACinsertmetastarFatemi2014{APACrefauthors}Fatemi, S., Holmström, M., Futaana, Y., Lue, C., Collier, M\BPBIR., Barabash, S.\BCBL \BBA Stenberg, G. \APACrefYearMonthDay2014. \BBOQ\APACrefatitleEffects of protons reflected by lunar crustal magnetic fields on the global lunar plasma environment Effects of protons reflected by lunar crustal magnetic fields on the global lunar plasma environment.\BBCQ \APACjournalVolNumPagesJournal of Geophysical Research: Space Physics11986095–6105. \PrintBackRefs\CurrentBib
- Fuqua Haviland \BOthers. (\APACyear2019) \APACinsertmetastarFuqua2019{APACrefauthors}Fuqua Haviland, H., Poppe, A\BPBIR., Fatemi, S., Delory, G\BPBIT.\BCBL \BBA De Pater, I. \APACrefYearMonthDay2019. \BBOQ\APACrefatitleTime-dependent hybrid plasma simulations of lunar electromagnetic induction in the solar wind Time-dependent hybrid plasma simulations of lunar electromagnetic induction in the solar wind.\BBCQ \APACjournalVolNumPagesGeophysical Research Letters4684151–4160. \PrintBackRefs\CurrentBib
- Futaana \BOthers. (\APACyear2012) \APACinsertmetastarFutaana2012{APACrefauthors}Futaana, Y., Barabash, S., Wieser, M., Holmström, M., Lue, C., Wurz, P.\BDBLAsamura, K. \APACrefYearMonthDay2012. \BBOQ\APACrefatitleEmpirical energy spectra of neutralized solar wind protons from the lunar regolith Empirical energy spectra of neutralized solar wind protons from the lunar regolith.\BBCQ \APACjournalVolNumPagesJournal of Geophysical Research: Planets117E5. \PrintBackRefs\CurrentBib
- Gary \BBA Karimabadi (\APACyear2006) \APACinsertmetastarGary2006{APACrefauthors}Gary, S\BPBIP.\BCBT \BBA Karimabadi, H. \APACrefYearMonthDay2006. \BBOQ\APACrefatitleLinear theory of electron temperature anisotropy instabilities: Whistler, mirror, and Weibel Linear theory of electron temperature anisotropy instabilities: Whistler, mirror, and weibel.\BBCQ \APACjournalVolNumPagesJournal of Geophysical Research: Space Physics111A11. \PrintBackRefs\CurrentBib
- Gharaee \BOthers. (\APACyear2015) \APACinsertmetastarGharaee2015{APACrefauthors}Gharaee, H., Rankin, R., Marchand, R.\BCBL \BBA Paral, J. \APACrefYearMonthDay2015. \BBOQ\APACrefatitleProperties of the lunar wake predicted by analytic models and hybrid-kinetic simulations Properties of the lunar wake predicted by analytic models and hybrid-kinetic simulations.\BBCQ \APACjournalVolNumPagesJournal of Geophysical Research: Space Physics12053795–3803. {APACrefDOI} 10.1002/2014ja020907 \PrintBackRefs\CurrentBib
- Gingell \BOthers. (\APACyear2015) \APACinsertmetastarGingell2015{APACrefauthors}Gingell, P\BPBIW., Burgess, D.\BCBL \BBA Matteini, L. \APACrefYearMonthDay2015\APACmonth03. \BBOQ\APACrefatitleThe Three-dimensional Evolution of Ion-scale Current Sheets: Tearing and Drift-kink Instabilities in the Presence of Proton Temperature Anisotropy The Three-dimensional Evolution of Ion-scale Current Sheets: Tearing and Drift-kink Instabilities in the Presence of Proton Temperature Anisotropy.\BBCQ \APACjournalVolNumPagesThe Astrophysical Journal80214. {APACrefDOI} 10.1088/0004-637X/802/1/4 \PrintBackRefs\CurrentBib
- Gronoff \BOthers. (\APACyear2020) \APACinsertmetastarGronoff2020{APACrefauthors}Gronoff, G., Arras, P., Baraka, S., Bell, J\BPBIM., Cessateur, G., Cohen, O.\BDBLothers \APACrefYearMonthDay2020. \BBOQ\APACrefatitleAtmospheric Escape Processes and Planetary Atmospheric Evolution Atmospheric escape processes and planetary atmospheric evolution.\BBCQ \APACjournalVolNumPagesJournal of Geophysical Research: Space Physicse2019JA027639. \PrintBackRefs\CurrentBib
- Grumpe \BOthers. (\APACyear2019) \APACinsertmetastarGrumpe2019{APACrefauthors}Grumpe, A., Wöhler, C., Berezhnoy, A\BPBIA.\BCBL \BBA Shevchenko, V\BPBIV. \APACrefYearMonthDay2019. \BBOQ\APACrefatitleTime-of-day-dependent behavior of surficial lunar hydroxyl/water: Observations and modeling Time-of-day-dependent behavior of surficial lunar hydroxyl/water: Observations and modeling.\BBCQ \APACjournalVolNumPagesIcarus321486–507. \PrintBackRefs\CurrentBib
- Grygorov \BOthers. (\APACyear2017) \APACinsertmetastarGrygorov2017{APACrefauthors}Grygorov, K., Šafránková, J., Němeček, Z., Pi, G., Přech, L.\BCBL \BBA Urbář, J. \APACrefYearMonthDay2017. \BBOQ\APACrefatitleShape of the equatorial magnetopause affected by the radial interplanetary magnetic field Shape of the equatorial magnetopause affected by the radial interplanetary magnetic field.\BBCQ \APACjournalVolNumPagesPlanetary and Space Science14828–34. \PrintBackRefs\CurrentBib
- Halekas \BOthers. (\APACyear2005) \APACinsertmetastarHalekas2005{APACrefauthors}Halekas, J., Bale, S., Mitchell, D.\BCBL \BBA Lin, R. \APACrefYearMonthDay2005. \BBOQ\APACrefatitleElectrons and magnetic fields in the lunar plasma wake Electrons and magnetic fields in the lunar plasma wake.\BBCQ \APACjournalVolNumPagesJournal of Geophysical Research: Space Physics110A7. \PrintBackRefs\CurrentBib
- Halekas \BOthers. (\APACyear2011) \APACinsertmetastarHalekas2011{APACrefauthors}Halekas, J., Delory, G., Farrell, W., Angelopoulos, V., McFadden, J., Bonnell, J.\BDBLPlaschke, F. \APACrefYearMonthDay2011. \BBOQ\APACrefatitleFirst remote measurements of lunar surface charging from ARTEMIS: Evidence for nonmonotonic sheath potentials above the dayside surface First remote measurements of lunar surface charging from artemis: Evidence for nonmonotonic sheath potentials above the dayside surface.\BBCQ \APACjournalVolNumPagesJournal of Geophysical Research: Space Physics116A7. \PrintBackRefs\CurrentBib
- Halekas \BOthers. (\APACyear2002) \APACinsertmetastarHalekas2002{APACrefauthors}Halekas, J., Mitchell, D., Lin, R., Hood, L., Acuña, M.\BCBL \BBA Binder, A. \APACrefYearMonthDay2002. \BBOQ\APACrefatitleEvidence for negative charging of the lunar surface in shadow Evidence for negative charging of the lunar surface in shadow.\BBCQ \APACjournalVolNumPagesGeophysical research letters291077–1. \PrintBackRefs\CurrentBib
- Halekas \BOthers. (\APACyear2014) \APACinsertmetastarHalekas2014{APACrefauthors}Halekas, J., Poppe, A., McFadden, J., Angelopoulos, V., Glassmeier, K\BHBIH.\BCBL \BBA Brain, D. \APACrefYearMonthDay2014. \BBOQ\APACrefatitleEvidence for small-scale collisionless shocks at the Moon from ARTEMIS Evidence for small-scale collisionless shocks at the Moon from ARTEMIS.\BBCQ \APACjournalVolNumPagesGeophysical Research Letters41217436–7443. \PrintBackRefs\CurrentBib
- Halekas \BOthers. (\APACyear2012) \APACinsertmetastarHalekas2012{APACrefauthors}Halekas, J\BPBIS., Poppe, A., Delory, G\BPBIT., Farrell, W\BPBIM.\BCBL \BBA Horányi, M. \APACrefYearMonthDay2012\APACmonth02. \BBOQ\APACrefatitleSolar wind electron interaction with the dayside lunar surface and crustal magnetic fields: Evidence for precursor effects Solar wind electron interaction with the dayside lunar surface and crustal magnetic fields: Evidence for precursor effects.\BBCQ \APACjournalVolNumPagesEarth, Planets and Space64273-82. {APACrefDOI} 10.5047/eps.2011.03.008 \PrintBackRefs\CurrentBib
- Holmström \BOthers. (\APACyear2012) \APACinsertmetastarHolmstrom2012{APACrefauthors}Holmström, M., Fatemi, S., Futaana, Y.\BCBL \BBA Nilsson, H. \APACrefYearMonthDay2012. \BBOQ\APACrefatitleThe interaction between the Moon and the solar wind The interaction between the moon and the solar wind.\BBCQ \APACjournalVolNumPagesEarth, planets and space642237–245. \PrintBackRefs\CurrentBib
- Jin \BBA Pang (\APACyear2020) \APACinsertmetastarJin2020{APACrefauthors}Jin, Y.\BCBT \BBA Pang, Y. \APACrefYearMonthDay2020. \BBOQ\APACrefatitleThe effect of cavity density on the formation of electrostatic shock in the lunar wake: 1-D hybrid simulation The effect of cavity density on the formation of electrostatic shock in the lunar wake: 1-d hybrid simulation.\BBCQ \APACjournalVolNumPagesEarth and Planetary Physics43223–230. \PrintBackRefs\CurrentBib
- Karimabadi \BOthers. (\APACyear2014) \APACinsertmetastarKarimabadi2014{APACrefauthors}Karimabadi, H., Roytershteyn, V., Vu, H\BPBIX., Omelchenko, Y\BPBIA., Scudder, J., Daughton, W.\BDBLGeveci, B. \APACrefYearMonthDay2014. \BBOQ\APACrefatitleThe link between shocks, turbulence, and magnetic reconnection in collisionless plasmas The link between shocks, turbulence, and magnetic reconnection in collisionless plasmas.\BBCQ \APACjournalVolNumPagesPhysics of Plasmas21062308. {APACrefDOI} 10.1063/1.4882875 \PrintBackRefs\CurrentBib
- Kimura \BBA Nakagawa (\APACyear2008) \APACinsertmetastarKimura2008{APACrefauthors}Kimura, S.\BCBT \BBA Nakagawa, T. \APACrefYearMonthDay2008. \BBOQ\APACrefatitleElectromagnetic full particle simulation of the electric field structure around the moon and the lunar wake Electromagnetic full particle simulation of the electric field structure around the moon and the lunar wake.\BBCQ \APACjournalVolNumPagesEarth, planets and space606591–599. \PrintBackRefs\CurrentBib
- Lin \BOthers. (\APACyear2022) \APACinsertmetastarLin2022{APACrefauthors}Lin, H., Li, S., Xu, R., Liu, Y., Wu, X., Yang, W.\BDBLWang, C. \APACrefYearMonthDay2022\APACmonth01. \BBOQ\APACrefatitleIn situ detection of water on the Moon by the Chang’E-5 lander In situ detection of water on the Moon by the Chang’E-5 lander.\BBCQ \APACjournalVolNumPagesScience Advances81eabl9174. {APACrefDOI} 10.1126/sciadv.abl9174 \PrintBackRefs\CurrentBib
- Liuzzo \BOthers. (\APACyear2021) \APACinsertmetastarLiuzzo2021{APACrefauthors}Liuzzo, L., Poppe, A\BPBIR., Halekas, J\BPBIS., Simon, S.\BCBL \BBA Cao, X. \APACrefYearMonthDay2021. \BBOQ\APACrefatitleInvestigating the Moon’s interaction with the terrestrial magnetotail lobe plasma Investigating the moon’s interaction with the terrestrial magnetotail lobe plasma.\BBCQ \APACjournalVolNumPagesGeophysical Research Letters489e2021GL093566. \PrintBackRefs\CurrentBib
- Lucey \BOthers. (\APACyear2006) \APACinsertmetastarLucey2006{APACrefauthors}Lucey, P., Korotev, R\BPBIL., Gillis, J\BPBIJ., Taylor, L\BPBIA., Lawrence, D., Campbell, B\BPBIA.\BDBLothers \APACrefYearMonthDay2006. \BBOQ\APACrefatitleUnderstanding the lunar surface and space-Moon interactions Understanding the lunar surface and space-moon interactions.\BBCQ \APACjournalVolNumPagesReviews in mineralogy and geochemistry60183–219. \PrintBackRefs\CurrentBib
- Lue \BOthers. (\APACyear2018) \APACinsertmetastarLue2018{APACrefauthors}Lue, C., Halekas, J., Poppe, A.\BCBL \BBA McFadden, J. \APACrefYearMonthDay2018. \BBOQ\APACrefatitleARTEMIS observations of solar wind proton scattering off the lunar surface Artemis observations of solar wind proton scattering off the lunar surface.\BBCQ \APACjournalVolNumPagesJournal of Geophysical Research: Space Physics12375289–5299. \PrintBackRefs\CurrentBib
- Mamo \BOthers. (\APACyear2022) \APACinsertmetastarMamo2022{APACrefauthors}Mamo, B., Raut, U., Teolis, B., Retherford, K., Akene, J.\BCBL \BBA Brody, J. \APACrefYearMonthDay2022. \BBOQ\APACrefatitleProbing Ice Crystallinity with Far-ultraviolet Spectroscopy: Implications for Condensed Volatiles in Lunar Permanently Shadowed Regions and Outer Solar System Icy Satellites Probing ice crystallinity with far-ultraviolet spectroscopy: Implications for condensed volatiles in lunar permanently shadowed regions and outer solar system icy satellites.\BBCQ \BIn \APACrefbtitleAAS/Division for Planetary Sciences Meeting Abstracts Aas/division for planetary sciences meeting abstracts (\BVOL 54, \BPGS 521–09). \PrintBackRefs\CurrentBib
- McKay \BOthers. (\APACyear1991) \APACinsertmetastarMckay1991{APACrefauthors}McKay, D\BPBIS., Heiken, G., Basu, A., Blanford, G., Simon, S., Reedy, R.\BDBLPapike, J. \APACrefYearMonthDay1991. \BBOQ\APACrefatitleThe lunar regolith The lunar regolith.\BBCQ \APACjournalVolNumPagesLunar sourcebook567285–356. \PrintBackRefs\CurrentBib
- Mishra \BBA Bhardwaj (\APACyear2020) \APACinsertmetastarMishra2020{APACrefauthors}Mishra, S.\BCBT \BBA Bhardwaj, A. \APACrefYearMonthDay2020. \BBOQ\APACrefatitleElectrostatic charging of permanently shadowed craters on the Moon Electrostatic charging of permanently shadowed craters on the moon.\BBCQ \APACjournalVolNumPagesMonthly Notices of the Royal Astronomical Society: Letters4961L80–L84. \PrintBackRefs\CurrentBib
- Nishino \BOthers. (\APACyear2010) \APACinsertmetastarNishino2010{APACrefauthors}Nishino, M\BPBIN., Fujimoto, M., Saito, Y., Yokota, S., Kasahara, Y., Omura, Y.\BDBLothers \APACrefYearMonthDay2010. \BBOQ\APACrefatitleEffect of the solar wind proton entry into the deepest lunar wake Effect of the solar wind proton entry into the deepest lunar wake.\BBCQ \APACjournalVolNumPagesGeophysical Research Letters3712. \PrintBackRefs\CurrentBib
- Omelchenko \BOthers. (\APACyear2021) \APACinsertmetastarOmelchenko2021{APACrefauthors}Omelchenko, Y\BPBIA., Roytershteyn, V., Chen, L\BHBIJ., Ng, J.\BCBL \BBA Hietala, H. \APACrefYearMonthDay2021. \BBOQ\APACrefatitleHYPERS simulations of solar wind interactions with the Earth’s magnetosphere and the Moon Hypers simulations of solar wind interactions with the earth’s magnetosphere and the moon.\BBCQ \APACjournalVolNumPagesJournal of Atmospheric and Solar-Terrestrial Physics215105581. \PrintBackRefs\CurrentBib
- Poppe (\APACyear2019) \APACinsertmetastarPoppe2019{APACrefauthors}Poppe, A. \APACrefYearMonthDay2019. \BBOQ\APACrefatitleComment on “The Dominant Role of Energetic Ions in Solar Wind Interaction With the Moon” by Omidi et al. Comment on “the dominant role of energetic ions in solar wind interaction with the moon” by omidi et al.\BBCQ \APACjournalVolNumPagesJournal of Geophysical Research: Space Physics12486927–6932. \PrintBackRefs\CurrentBib
- Poppe \BOthers. (\APACyear2018) \APACinsertmetastarPoppe2018{APACrefauthors}Poppe, A., Farrell, W.\BCBL \BBA Halekas, J\BPBIS. \APACrefYearMonthDay2018. \BBOQ\APACrefatitleFormation timescales of amorphous rims on lunar grains derived from ARTEMIS observations Formation timescales of amorphous rims on lunar grains derived from artemis observations.\BBCQ \APACjournalVolNumPagesJournal of Geophysical Research: Planets123137–46. \PrintBackRefs\CurrentBib
- Poppe \BOthers. (\APACyear2014) \APACinsertmetastarPoppe2014{APACrefauthors}Poppe, A\BPBIR., Fatemi, S., Halekas, J\BPBIS., Holmström, M.\BCBL \BBA Delory, G\BPBIT. \APACrefYearMonthDay2014\APACmonth06. \BBOQ\APACrefatitleARTEMIS observations of extreme diamagnetic fields in the lunar wake ARTEMIS observations of extreme diamagnetic fields in the lunar wake.\BBCQ \APACjournalVolNumPagesGeophysical Research Letters41113766-3773. {APACrefDOI} 10.1002/2014GL060280 \PrintBackRefs\CurrentBib
- Poppe \BOthers. (\APACyear2021) \APACinsertmetastarPoppe2021a{APACrefauthors}Poppe, A\BPBIR., Xu, S., Liuzzo, L., Halekas, J\BPBIS.\BCBL \BBA Harada, Y. \APACrefYearMonthDay2021. \BBOQ\APACrefatitleARTEMIS observations of lunar nightside surface potentials in the magnetotail lobes: Evidence for micrometeoroid impact charging Artemis observations of lunar nightside surface potentials in the magnetotail lobes: Evidence for micrometeoroid impact charging.\BBCQ \APACjournalVolNumPagesGeophysical Research Letters4815e2021GL094585. \PrintBackRefs\CurrentBib
- Rakesh Chandran \BOthers. (\APACyear2022) \APACinsertmetastarChandran2022{APACrefauthors}Rakesh Chandran, S\BPBIB., Veenas, C\BPBIL., Asitha, L\BPBIR., Parvathy, B., Rakhimol, K\BPBIR., Abraham, A.\BDBLRenuka, G. \APACrefYearMonthDay2022\APACmonth07. \BBOQ\APACrefatitlePotential - Current characteristics of lunar surface at average solar wind conditions Potential - Current characteristics of lunar surface at average solar wind conditions.\BBCQ \APACjournalVolNumPagesAdvances in Space Research702546-555. {APACrefDOI} 10.1016/j.asr.2022.04.033 \PrintBackRefs\CurrentBib
- A. Rasca \BOthers. (\APACyear2021) \APACinsertmetastarRasca2021{APACrefauthors}Rasca, A., Fatemi, S., Farrell, W., Poppe, A.\BCBL \BBA Zheng, Y. \APACrefYearMonthDay2021. \BBOQ\APACrefatitleA double disturbed lunar plasma wake A double disturbed lunar plasma wake.\BBCQ \APACjournalVolNumPagesJournal of Geophysical Research: Space Physics1262e2020JA028789. \PrintBackRefs\CurrentBib
- A\BPBIP. Rasca \BOthers. (\APACyear2022) \APACinsertmetastarRasca2022{APACrefauthors}Rasca, A\BPBIP., Fatemi, S.\BCBL \BBA Farrell, W\BPBIM. \APACrefYearMonthDay2022. \BBOQ\APACrefatitleModeling the Lunar Wake Response to a CME Using a Hybrid PIC Model Modeling the lunar wake response to a cme using a hybrid pic model.\BBCQ \APACjournalVolNumPagesThe Planetary Science Journal314. \PrintBackRefs\CurrentBib
- Samsonov \BOthers. (\APACyear2012) \APACinsertmetastarSamsonov2012{APACrefauthors}Samsonov, A\BPBIA., Němeček, Z., Šafránková, J.\BCBL \BBA Jelínek, K. \APACrefYearMonthDay2012\APACmonth05. \BBOQ\APACrefatitleWhy does the subsolar magnetopause move sunward for radial interplanetary magnetic field? Why does the subsolar magnetopause move sunward for radial interplanetary magnetic field?\BBCQ \APACjournalVolNumPagesJournal of Geophysical Research (Space Physics)1175221. {APACrefDOI} 10.1029/2011JA017429 \PrintBackRefs\CurrentBib
- Sarantos \BOthers. (\APACyear2008) \APACinsertmetastarSarantos2008{APACrefauthors}Sarantos, M., Killen, R\BPBIM., Sharma, A\BPBIS.\BCBL \BBA Slavin, J\BPBIA. \APACrefYearMonthDay2008. \BBOQ\APACrefatitleInfluence of plasma ions on source rates for the lunar exosphere during passage through the Earth’s magnetosphere Influence of plasma ions on source rates for the lunar exosphere during passage through the earth’s magnetosphere.\BBCQ \APACjournalVolNumPagesGeophysical research letters354. \PrintBackRefs\CurrentBib
- Stubbs \BOthers. (\APACyear2014) \APACinsertmetastarStubbs2014{APACrefauthors}Stubbs, T\BPBIJ., Farrell, W\BPBIM., Halekas, J\BPBIS., Burchill, J\BPBIK., Collier, M\BPBIR., Zimmerman, M\BPBII.\BDBLPfaff, R\BPBIF. \APACrefYearMonthDay2014\APACmonth01. \BBOQ\APACrefatitleDependence of lunar surface charging on solar wind plasma conditions and solar irradiation Dependence of lunar surface charging on solar wind plasma conditions and solar irradiation.\BBCQ \APACjournalVolNumPagesPlanet. Space Sci.9010-27. {APACrefDOI} 10.1016/j.pss.2013.07.008 \PrintBackRefs\CurrentBib
- Stubbs \BOthers. (\APACyear2007) \APACinsertmetastarStubbs2007{APACrefauthors}Stubbs, T\BPBIJ., Halekas, J\BPBIS., Farrell, W\BPBIM.\BCBL \BBA Vondrak, R\BPBIR. \APACrefYearMonthDay2007\APACmonth01. \BBOQ\APACrefatitleLunar Surface Charging: A Global Perspective Using Lunar Prospector Data Lunar Surface Charging: A Global Perspective Using Lunar Prospector Data.\BBCQ \APACjournalVolNumPagesDust in planetary systems643181-184. \PrintBackRefs\CurrentBib
- Taylor (\APACyear1982) \APACinsertmetastarTaylor1982{APACrefauthors}Taylor, S\BPBIR. \APACrefYear1982. \APACrefbtitlePlanetary science: A lunar perspective Planetary science: A lunar perspective (\BVOL 3303). \APACaddressPublisherLunar and Planetary Institute Houston. \PrintBackRefs\CurrentBib
- Trávníček \BOthers. (\APACyear2005) \APACinsertmetastarTravnivcek2005{APACrefauthors}Trávníček, P., Hellinger, P., Schriver, D.\BCBL \BBA Bale, S\BPBID. \APACrefYearMonthDay2005. \BBOQ\APACrefatitleStructure of the lunar wake: Two-dimensional global hybrid simulations Structure of the lunar wake: Two-dimensional global hybrid simulations.\BBCQ \APACjournalVolNumPagesGeophysical research letters326. \PrintBackRefs\CurrentBib
- Treumann \BBA Baumjohann (\APACyear2013) \APACinsertmetastarTreumann2013{APACrefauthors}Treumann, R\BPBIA.\BCBT \BBA Baumjohann, W. \APACrefYearMonthDay2013. \BBOQ\APACrefatitleCollisionless magnetic reconnection in space plasmas Collisionless magnetic reconnection in space plasmas.\BBCQ \APACjournalVolNumPagesFrontiers in Physics131. \PrintBackRefs\CurrentBib
- Verscharen \BOthers. (\APACyear2019) \APACinsertmetastarVerscharen2019{APACrefauthors}Verscharen, D., Klein, K\BPBIG.\BCBL \BBA Maruca, B\BPBIA. \APACrefYearMonthDay2019. \BBOQ\APACrefatitleThe multi-scale nature of the solar wind The multi-scale nature of the solar wind.\BBCQ \APACjournalVolNumPagesLiving Reviews in Solar Physics1615. \PrintBackRefs\CurrentBib
- Vorburger \BOthers. (\APACyear2016) \APACinsertmetastarVorburger2016{APACrefauthors}Vorburger, A., Wurz, P., Barabash, S., Futaana, Y., Wieser, M., Bhardwaj, A.\BDBLAsamura, K. \APACrefYearMonthDay2016. \BBOQ\APACrefatitleTransport of solar wind plasma onto the lunar nightside surface Transport of solar wind plasma onto the lunar nightside surface.\BBCQ \APACjournalVolNumPagesGeophysical Research Letters432010–586. \PrintBackRefs\CurrentBib
- Wang \BOthers. (\APACyear2011) \APACinsertmetastarWang2011{APACrefauthors}Wang, Y\BPBIC., Müller, J., Ip, W\BPBIH.\BCBL \BBA Motschmann, U. \APACrefYearMonthDay2011\APACmonth12. \BBOQ\APACrefatitleA 3D hybrid simulation study of the electromagnetic field distributions in the lunar wake A 3D hybrid simulation study of the electromagnetic field distributions in the lunar wake.\BBCQ \APACjournalVolNumPagesIcarus2162415-425. {APACrefDOI} 10.1016/j.icarus.2011.09.021 \PrintBackRefs\CurrentBib
- Wang \BOthers. (\APACyear2021) \APACinsertmetastarWang2021{APACrefauthors}Wang, Z., Hu, H., Lu, J., Han, D., Liu, J., Wu, Y.\BCBL \BBA Hu, Z. \APACrefYearMonthDay2021. \BBOQ\APACrefatitleObservational evidence of transient lobe reconnection triggered by sudden northern enhancement of IMF Bz Observational evidence of transient lobe reconnection triggered by sudden northern enhancement of imf bz.\BBCQ \APACjournalVolNumPagesJournal of Geophysical Research: Space Physics1269e2021JA029410. \PrintBackRefs\CurrentBib
- Wilson \BOthers. (\APACyear2006) \APACinsertmetastarWilson2006{APACrefauthors}Wilson, J\BPBIK., Mendillo, M.\BCBL \BBA Spence, H\BPBIE. \APACrefYearMonthDay2006. \BBOQ\APACrefatitleMagnetospheric influence on the Moon’s exosphere Magnetospheric influence on the moon’s exosphere.\BBCQ \APACjournalVolNumPagesJournal of Geophysical Research: Space Physics111A7. \PrintBackRefs\CurrentBib
- Xie \BOthers. (\APACyear2013) \APACinsertmetastarXie2013{APACrefauthors}Xie, L., Li, L., Zhang, Y.\BCBL \BBA De Zeeuw, D\BPBIL. \APACrefYearMonthDay2013. \BBOQ\APACrefatitleThree-dimensional MHD simulation of the lunar wake Three-dimensional mhd simulation of the lunar wake.\BBCQ \APACjournalVolNumPagesScience China Earth Sciences562330–338. \PrintBackRefs\CurrentBib
- Xu \BOthers. (\APACyear2019) \APACinsertmetastarXu2019{APACrefauthors}Xu, X., Xu, Q., Chang, Q., Xu, J., Wang, J., Wang, Y.\BDBLAngelopoulos, V. \APACrefYearMonthDay2019. \BBOQ\APACrefatitleARTEMIS observations of well-structured lunar wake in subsonic plasma flow Artemis observations of well-structured lunar wake in subsonic plasma flow.\BBCQ \APACjournalVolNumPagesThe Astrophysical Journal881176. \PrintBackRefs\CurrentBib
- Zhang \BOthers. (\APACyear2020) \APACinsertmetastarZhang2020{APACrefauthors}Zhang, T\BHBIX., Zhang, H., Lai, H\BHBIR., Zhong, J., Liu, L\BHBIB., Wei, Y.\BDBLothers \APACrefYearMonthDay2020. \BBOQ\APACrefatitleAsymmetric lunar magnetic perturbations produced by reflected solar wind particles Asymmetric lunar magnetic perturbations produced by reflected solar wind particles.\BBCQ \APACjournalVolNumPagesThe Astrophysical Journal Letters8932L36. \PrintBackRefs\CurrentBib
6 Acknowledgment
This research was carried out at the National Institute of Aerospace, Science Sytems and Applications Inc., Langley Research Center, and partially at the Jet Propulsion Laboratory, California Institute of Technology, under a contract with the National Aeronautics and Space Administration Contract Number 80NM0018D0004. We express our gratitude for the valuable code contribution provided by Lotfi ben Jaffel. We gratefully acknowledge the assistance provided by Bjorn Davidsson, Larry Paxton, Richard Barkus, Iannis Dandouras, and Enrico Piazza for their immeasurable support and valuable discussions on the issues and progress of this research.
7 Figures
 |
 |
| A | B |
 |
 |
| A | B |
 |
 |
| A | B |
 |
 |