Roaring to softly whispering: Persistent X-ray emission at the location of the Fast Blue Optical Transient AT 2018cow 3.7 yrs after discovery and implications on accretion-powered scenarios111Based on observations obtained with XMM-Newton, an ESA science mission with instruments and contributions directly funded by ESA Member States and NASA
Abstract
We present the first deep X-ray observations of a luminous FBOT AT 2018cow at since discovery, together with the re-analysis of the observation at d. X-ray emission is significantly detected at a location consistent with AT 2018cow. The very soft X-ray spectrum and sustained luminosity are distinct from the spectral and temporal behavior of the LFBOT in the first days, and would possibly signal the emergence of a new emission component, although a robust association with AT 2018cow can only be claimed at d, while at d contamination of the host galaxy cannot be excluded. We interpret these findings in the context of the late-time panchromatic emission from AT 2018cow, which includes the detection of persistent, slowly-fading UV emission with . Similar to previous works, (and in analogy with arguments for Ultra-Luminous X-ray sources –ULXs), these late-time observations are consistent with thin-disks around Intermediate Mass Black Holes (IMBHs, with ) accreting at sub-Eddington rates. However, differently from previous studies, we find that smaller-mass BHs with accreting at the Eddington rate cannot be ruled out, and provide a natural explanation for the inferred compact size () of the accretion disk years after the optical flare. Most importantly, irrespective of the accretor mass, our study lends support to the hypothesis that LFBOTs are accretion-powered phenomena and that, specifically, LFBOTs constitute electromagnetic manifestations of super-Eddington accreting systems that evolve to Eddington over a days time scale.
1 Introduction
High-cadence, wide-area optical surveys have recently led to the discovery of a new class of luminous transients (peak bolometric luminosity erg s-1), characterized by rapid rising times ( d) and blue colors that are signatures of high effective temperatures K. The class of Fast Blue Optical Transients (FBOTs, Drout et al., 2014)222Also referred to in the literature as Fast Evolving Luminous Transients (FELTs, Rest et al., 2018). collects a few tens of systems (e.g., Poznanski et al., 2010; Drout et al., 2014; Arcavi et al., 2016; Pursiainen et al., 2018; Tampo et al., 2020; Ho et al., 2022b). While the observational properties of FBOTs are heterogeneous and most likely reflect some intrinsic diversity among the transients, their fast rise times, high luminosities and lack of ultraviolet (UV) line blanketing cannot be easily explained with the radioactive decay of newly-synthesized 56Ni as for ordinary supernova (SN) explosions. This argument especially applies to the most optically luminous end of the FBOT population (Luminous FBOTs –LFBOTs – hereafter), which shows a combination of extreme peak luminosities reaching erg s-1combined with the shortest rise-times of just a few days.
The key observational properties and inferences on the sub-class of LFBOTs are summarized below. (i) Differently from FBOTs, LFBOTs are intrinsically rare events (local volumetric rate of the core-collapse SN rate; Coppejans et al. 2020; Ho et al. 2020b). (ii) These studies also revealed that LFBOTs have luminous X-ray and radio counterparts, sometimes as luminous as Long Gamma-Ray Bursts (LGRBs), and that, similar to GRBs, (iii) LFBOTs are capable of launching relativistic outflows, which implies the presence of a compact object (BH or NS, pre-existing or newly formed). (iv) LFBOTs show highly time-variable non-thermal X-ray (and optical) emission (Rivera Sandoval et al., 2018; Margutti et al., 2019; Ho et al., 2022a), similar to GRB afterglows and TDEs, and clearly distinct from X-ray SNe that are powered by the shock interaction with the circumstellar medium (CSM). (iv) LFBOTs are surrounded by dense but radially confined CSM, as revealed by their rapidly declining radio light-curves (Bright et al., 2022; Nayana & Chandra, 2021; Ho et al., 2020a, b) and potential infrared “dust echo” signatures (Metzger & Perley, 2023). (v) In stark contrast with GRBs, the optical spectra of LFBOTs show the presence of H, demonstrating that LFBOTs are H-depleted but not H-free (e.g., Perley et al. 2019; Margutti et al. 2019). (vi) Finally, LFBOTs preferentially occur in low-mass star-forming galaxies, thus showing a preference for low-metallicity environments, and hence suggesting a connection with massive stars (Coppejans et al., 2020; Lyman et al., 2020; Yao et al., 2022).333The lack of evidence of cooling of LFBOTs like AT2018cow makes them phenomenologically distinct from the new class of luminous, fast-cooling transients, which occur in early-type galaxies and have no detected X-ray or radio emission (Nicholl et al., 2023).
Physical scenarios to explain the LFBOT population fall under two broad categories: those invoking the interaction of a shock with a dense CSM as a way to efficiently convert the outflow’s kinetic energy into radiation; and those involving the presence of energy injection by a “central engine” (e.g., Prentice et al. 2018; Margutti et al. 2019; Perley et al. 2019). In this second class of models, LFBOTs could be powered by a newly-formed rapidly-rotating magnetar (e.g., Vurm & Metzger 2021), an accreting black hole (BH; e.g., Akashi & Soker 2021; Gottlieb et al. 2022) born in a failed blue supergiant star explosion (Quataert et al., 2019; Antoni & Quataert, 2022), as well as tidal disruption events (TDEs) by intermediate-mass black holes (IMBHs), e.g., Kuin et al. (2019); Perley et al. (2019). Recently, Metzger (2022) showed that LFBOTs could also result from the binary merger of a Wolf-Rayet star with its BH or NS companion. While pure CSM interaction models (e.g., Fox & Smith 2019; Schrøder et al. 2020; Dessart et al. 2022; Leung et al. 2021; Margalit 2022; Pellegrino et al. 2022) struggle explaining the mildly-relativistic ejecta, rapid variability time scales and non-thermal X-ray spectra of LFBOTs, it is important to note that the two sets of models (i.e., “interaction” vs. “central engine”) are not mutually exclusive, and different parts of the spectrum can be dominated by different physical mechanisms (e.g., the radio emission could be shock-CSM interaction powered, while the rest of the spectrum is not).
Located in the spiral arm of the dwarf star-forming galaxy CGCG 137068 at a distance Mpc, AT 2018cow is the nearest LFBOT discovered so far (Prentice et al. 2018; Smartt et al. 2018; Perley et al. 2019) and offers an unparalleled opportunity to test and constrain the scenarios above. AT 2018cow has been extensively observed across the entire electromagnetic spectrum (Rivera Sandoval et al., 2018; Kuin et al., 2018; Perley et al., 2019; Ho et al., 2019; Margutti et al., 2019; Nayana & Chandra, 2021). The observational findings from these campaigns that are most relevant to our study are summarized below.
AT 2018cow displayed luminous, highly-variable X-ray emission (peak erg s-1) of non-thermal origin with two spectral components: a persistent, relatively hard power-law () at 0.1 keV, and a transient Compton-hump feature dominating at 10 keV at d (Margutti et al., 2019; Rivera Sandoval et al., 2018). While the bright radio-to-mm emission of AT 2018cow stems from a non-relativistic shock interaction with a dense medium (Margutti et al., 2019; Ho et al., 2019; Nayana & Chandra, 2021), the persistent optical-UV blue colors requiring K weeks after discovery (e.g., Margutti et al. 2019; Perley et al. 2019; Xiang et al. 2021), and the broad-band X-ray properties above demand a different powering source, which can be in the form of a long-lived central engine. Slowly-decaying, luminous () UV emission years after discovery has been recently reported by Sun et al. (2022, 2023); Chen et al. (2023a, b); Mummery et al. (2023); Inkenhaag et al. (2023), and similarities have been noted with radiation powered by accretion processes on compact objects. Along the same lines, a high-frequency (224 Hz) quasi-periodic oscillation (QPO) feature in the X-ray timing properties of AT 2018cow supports the presence of a compact object, either a NS or BH with mass 850 M⊙(Pasham et al., 2021, but see also Zhang et al. 2022). While no evidence was found for a long-lived relativistic jet such as those of GRBs (Bietenholz et al., 2020; Mohan et al., 2020), panchromatic observations of AT 2018cow further indicated a complex geometry that strongly departs from spherical symmetry, as was directly confirmed by the very large optical polarization () at early times (Maund et al., 2023).
Here we present deep X-ray observations of AT 2018cow performed up to yrs after the optical discovery, and we discuss the implications of a late-time X-ray detection on the intrinsic nature of this new class of transients. The paper is organized as follows: in §2 and §3 we present the analysis of the XMM-Newton and NuSTAR observations at 218 d. We put the X-ray data into the broader context of the late-time emission from AT 2018cow in §4 and §5, and we discuss our findings in §6. We conclude in §7. We provide in Appendix A the analysis of Chandra HETG observations at d that has not been published elsewhere. Times are referred to the epoch of the optical discovery, which is MJD 58285.44, and we adopt a luminosity distance of 60 Mpc (Prentice et al., 2018; Smartt et al., 2018; Perley et al., 2019).
2 Late-time XMM-Newton follow-up
Since its discovery, AT 2018cow was targeted four times by XMM-Newton (PI Margutti). The first two epochs (Obs1 and Obs2) were presented in Margutti et al. (2019). Here we report the analysis of the 2019 observation (Obs3, 218 d, Obs ID 0822580601) and the 2022 one (split in three, 1349 d to 1358 d; Obs4a, Obs4b, Obs4c, collectively Obs4; Obs IDs: 0843550401, 0843550501, 0843550601), that sample the very late time X-ray evolution of an FBOT (Table 1).
We reduced and analyzed the data of the three European Photon Imaging Camera (EPIC)-pn, MOS1 and MOS2 using the Scientific Analysis System (SAS) v. 20.0.0 and calibration files CALDB 3.13. Obs4b and Obs4c were significantly impacted by high-background flares while Obs3 and Obs4a were not. For the former, optimized flare filtering was achieved with espfilt444https://xmm-tools.cosmos.esa.int/external/sas/current/doc/espfilt/espfilt.html, which led to a severe reduction in the effective exposure time, especially for the pn camera (Table 1).
2.1 Source Detection
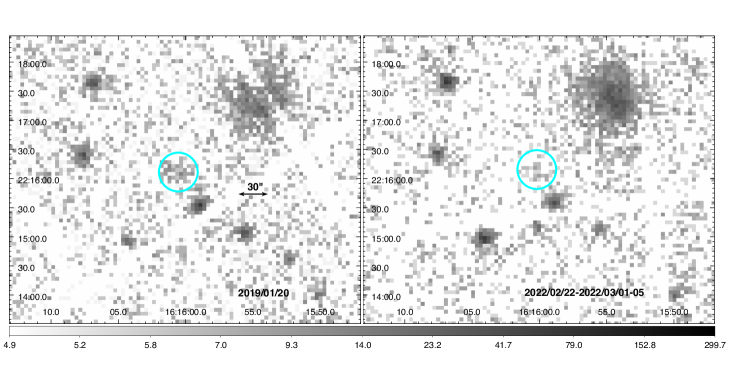
An X-ray source is clearly visible at the location of AT 2018cow in the 0.2–10 keV image of Obs3 (see Figure 1). We restricted our analysis to the 0.2–4.5 keV energy range (i.e., band 1 to 4 of the XMM catalogues) since above keV the background dominates. We estimated the background contribution from several source-free circular regions around AT 2018cow and in the same chip. In the 0.2-4.5 keV pn image, which has the best statistics, we measured 4114 net counts in a 20″ circular region centered at the optical coordinates of AT 2018cow. To assess the significance of the detection we ran the task edetect_chain for all the three cameras simultaneously over the full 0.2–4.5 keV energy band, and in four sub-energy bands (i.e., 0.2–0.5 keV, 0.5–1.0 keV, 1.0–2.0 keV and 2.0–4.5 keV). The source is significantly detected in the full 0.2–4.5 keV with a resulting detection maximum likelihood DET_ML=10.8 (, Gaussian equivalent). The 0.2–4.5 keV net count-rates for each instrument are reported in Table 1. The analysis of the distribution of the counts in the energy sub-bands shows that most counts are clustered below 2 keV.
The centroid coordinates of the X-ray source in Obs3 are RA:244.00104 deg, DEC: 22.26758 deg with a positional uncertainty of 1.5″, fully consistent with the coordinates of the optical counterpart. Note that the X-ray source closest to AT 2018cow is at 38″ and its flux did not vary through the XMM-Newton observations, suggesting a negligible level of contamination. The detection of AT 2018cow in XMM Obs3 has been previously reported by Yao et al. (2022)555This work focuses on the FBOT AT2020mrf, the detection of AT 2018cow is reported in Appendix A.. A source is present also in the fourth XMM-Newton serendipitous source catalog (4XMM, data release 11, DR11 Webb et al., 2020), instead the non-detection claimed in Pasham et al. (2021) is likely due to the use of the MOS1 image alone.
From visual inspection, no source is apparent in the individual images of the three exposures of Obs4. To maximize our sensitivity to faint sources we ran the SAS task edetect_stack, which performs source detection on stacked images from different exposures (Traulsen et al., 2019, 2020). Following a similar argument as for Obs3, we restricted our analysis to keV. We find evidence for a point-like666The task assigns a zero source extent if the likelihood of the source being extended falls below a threshold of four or its extent radius below 6″(Traulsen et al., 2019). X-ray source with a combined EPIC detection likelihood777This is defined as equivalent likelihood, i.e. the detection likelihood of the source in individual images, see Eq.3 in Traulsen et al. (2019). DET_ML=9.1 ( Gaussian equivalent) in the 0.2–4.5 keV energy band. However, the source position is displaced 4.4″ north (RA:244.00079 deg, DEC: 22.26925 deg) with respect to the optical position of AT 2018cow. The 1- positional error is 1.9″, and Traulsen et al. (2019) quote a mean systematic error in the range 0.43″-0.73″, hence an offset of 2 from the optical position. We note that the X-ray position is also 5.5″ offset from the host galaxy centroid. Inspection of the edetect_stack intermediate steps shows that this offset is the result of the final maximum likelihood fitting performed by the eml_detect task, while the input position provided in the previous step by the ebox_detect task is within 2″ from the AT 2018cow position, suggesting that uncertainties in merging the images, or performing the PSF fitting may affect the final position (see e.g. Rosen et al., 2016; Webb et al., 2020). The 0.2–4.5 keV net count-rates are reported in Table 1.
2.2 X-ray Spectral Analysis
For Obs3, we extracted source spectra using data acquired by the three cameras. We used a source region with radius defined as the best-fitting radius for each camera determined by the detection tool and selected multiple, contiguous and source-free regions for the background. We employed the W-stat statistic and simultaneously fit the source and background spectra. We tested two spectral models: a power-law and a black-body model, both combined with an absorption component (i.e., tbabs*pow and tbabs*bbody). Unsurprisingly, given the low-number counts, the two models are statistically indistinguishable. We derived a very soft best-fitting power-law photon index of , whereas we obtained a best-fitting black-body temperature of keV. In both cases, no evidence for intrinsic absorption is found and we thus froze the to the Galactic value =0.05 (Kalberla et al., 2005). This is in line with upper limits derived from high-count spectra at early times ( 0.02, Margutti et al., 2019). We further explored a multi-color black-body disk model (diskbb), which is the implementation of the standard Shakura & Sunyaev (1973) thin-disk model. The inner disk temperature is constrained to 0.23 keV, while for the inner disk radius we infer a maximum value, 1340 km for a face-on disk. The UV flux predicted by this model fails to explain the observed emission from AT 2018cow and we refer the reader to §5 for a self-consistent UV-to-X-ray multi-color black-body disk modeling. Fitting with a thermal plasma model (apec) leads to an extremely low temperature (0.009 keV) and to a worse fit.
To conclude, while the Obs3 data cannot constrain the spectral shape in detail, there is a clear indication of a spectral softening of the X-ray emission at d, which signals a change with respect to the persistently hard X-ray emission with observed at d (Rivera Sandoval et al. 2018; Margutti et al. 2019, Fig. 2). The 0.3–10 keV unabsorbed flux inferred from the spectral analysis ranges from (3.110-15 erg cm-2 s-1 (black-body model) to (4.51)10-15 erg cm-2 s-1 (power-law model). Note that the higher flux of 1.610-14 erg cm-2 s-1 reported in Yao et al. (2022) for this observation is the result of the harder 2.0 that was assumed by the authors.
While the limited statistics of Obs4 also leave the spectral models unconstrained, we note that most of the counts in the source region are at energies 2 keV, which supports the conclusion of spectral softening of the source. Using the output of the detection algorithm, we estimated the hardness ratios (HR) in the 0.2-1 keV (b1), 1-2 keV (b2) and 2-4.5 keV (b3) energy bands for the pn data. For and , we obtained and , respectively, which are in rough agreement with the values in Obs3 ( and ), although, given the large uncertainties, the HR measurements should be considered as purely indicative. Assuming as derived from Obs3, the pn count rate of Obs4 converts into an unabsorbed 0.3–10 keV flux of (1.0 0.4)10-15 erg cm-2 s-1 (Table 1).
3 Late-time NuSTAR follow-up
We obtained deep observations of AT 2018cow with the Nuclear Spectroscopic Telescope Array (Harrison et al., 2013) on 2022 March 2 (Program #084355, PI Margutti, d ). NuSTAR observations were processed using NuSTARDAS v1.9.7 and the NuSTAR CALDB released on 2022 May 10. Part of our observations were severely affected by Solar activity. Filtering out periods of increased detector background with saacalc=3, saamode=strict tentacle=yes leads to effective exposures of ks and ks on module A and B, respectively. No source of significant hard X-ray emission is detected at the location of AT 2018cow. Using extraction regions that sample of the NuSTAR Point Spread Function (PSF) and centered at the optical position of AT 2018cow, we infer a combined count-rate upper limit of (10–79 keV). This translates into a flux limit of erg cm-2 s-1 () for an assumed spectral power-law index of that best fits the XMM-Newton data (Obs3, see §2).
4 Nature of the late-time X-ray emission
4.1 Transient Emission vs. Star Formation
Before proceeding further, we discuss the origin of the late-time X-ray emission, whether it can be ascribed to AT 2018cow and in what fraction. In non-active galaxies, like the host of AT 2018cow, a possible source of contamination is represented by the X-ray emission of (i) X-ray binaries (XRBs), both low-mass and high-mass XRBs (LMXRBs and HMXRBs, respectively), which are dominant in the 2–10 keV energy range; and (ii) the hot ISM, mainly relevant below 2 keV. The X-ray luminosities of these components correlate with the star formation rate (SFR, see e.g. Mineo et al., 2012, 2014; Lehmer et al., 2016, and references therein). We adopted the empirical -SFR relations in Lehmer et al. (2016), which scale with redshift, SFR and stellar mass (), and used the SFR and inferred for the host galaxy of AT 2018cow from the SED fitting of the optical data in Perley et al. (2019): SFR0.22 M⊙ yr-1 and (1.42 M⊙ (also in agreement with Michałowski et al. 2019 and Lyman et al. 2020). We estimated a luminosity range erg s-1 for each, 0.5–2 keV and 2–10 keV, band (similar values are obtained using the relation in Mineo et al., 2014). The estimated 1 scatter in the relations is 0.17 dex, although the galaxy-to-galaxy spread in the 2-10 keV luminosity could be larger, up to 0.4 dex, and sensitive to variations in metallicity, stellar age and XRB populations (Lehmer et al., 2016).
The level of the observed emission is thus of the same order of the SF estimates. However, we note that at 218 d (Obs3): (i) the emission is significantly brighter than Obs4, thus showing the limitations of the SFR-based inferences; moreover (ii) the centroid of the X-ray emission is consistent with the position of AT 2018cow (and 6.8″ from the host galaxy core); (iii) the typical star forming spectral components (a thermal model with 0.3–2 keV and a power law with 1.8–2.0, see e.g. Lehmer et al., 2016) cannot satisfactorily model the the X-ray spectrum. For Obs4 (13491358 d), the poor characterization of the X-ray emission in terms of localization and spectral properties makes it difficult to be conclusive between AT 2018cow and a star formation origin. As a further attempt, we used the Chandra observation taken at 8.2 d (see Appendix A) and calculated the X-ray flux in the host galaxy region (excluding the AT 2018cow emission). Unfortunately, the 90% c.l. upper limit on the 0.3–10 keV unabsorbed flux is 2.410-13 erg cm-2 s-1, corresponding to a 0.3–10 keV luminosity of 1041 erg s-1, not sufficiently deep to probe the expected SF luminosities.
In the following we consider two possible scenarios: (i) either the X-ray emission at =1349–1358 d (Obs4) is still mostly contributed by AT 2018cow, or (ii) AT 2018cow had faded below the detectable level and we are detecting the SF-related X-ray emission from the host galaxy. In both cases, the hard X-ray emission from AT 2018cow at this epoch is (10–79 keV). Furthermore, if (ii), the SF component could contribute up to of the best-fit X-ray flux measured at 218 d (Obs3). This raises the question whether the SF contamination could be responsible of the spectral softening observed in Obs3. Incidentally, we note that a typical SF X-ray spectrum is not expected to be as soft as the observed one (see e.g. the template presented in Figure 4 of Lehmer et al., 2016). As a further test, we simulated an X-ray spectrum and supposed the (pessimistic) scenario of a total flux, at the time of Obs3, of and a true host flux of (both values within 1 of the measured/estimated values), meaning that fully half of the flux detected in Obs3 would be from the host galaxy. For the host galaxy spectrum, we referred to the mean X-ray SED of local star-forming galaxies presented in Lehmer et al. (2016): a thermal model with keV was assumed for the hot gas and a power-law with for the XRB emission, while the relative contributions were set so that the former(/latter) dominates below(/above) 1.5 keV (see Figure 4 in Lehmer et al., 2016). The X-ray spectrum of AT 2018cow was modelled with a power-law with a photon index equal to 1.5, i.e. the value measured at early times. The underlying assumption is that there is no spectral evolution in the X-ray emission of AT 2018cow. Fitting the simulated X-ray spectrum with a composite model that accounts for all contributions, we obtained for AT 2018cow a best-fit photon index , while a fit with a simple power-law model corrected for Galactic absorption, as done for Obs3 spectrum, gives a best-fit photon index . This is below the observed range measured in Obs3, albeit the large uncertainties, thus supporting the indications of a true spectral softening of the X-ray emission of AT 2018cow.
4.2 AT 2018cow X-ray Light-Curve
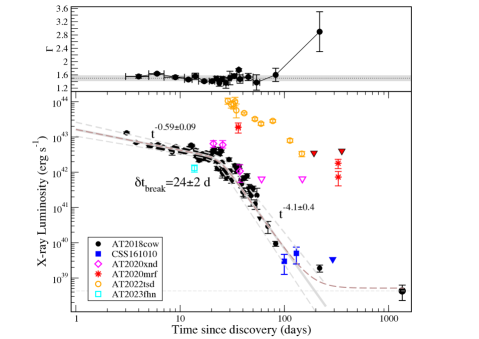
The temporal evolution of the soft X-ray flux at the location of AT 2018cow is remarkable: as shown in Figure 2, at 218 d the 0.3–10 keV has dropped by 4 orders of magnitude with respect to the time of the discovery (from 1043 erg s-1 to 1039 erg s-1). However, between 218 d and 13491358 d the X-ray flux decreases by a factor 4. We fit the X-ray lightcurve at 218 d with a smoothed broken power-law model, thus assuming that beyond that epoch we are detecting X-ray emission from the host galaxy. The best fit model (Figure 2) indicates an initial decay t-0.59±0.09, which drastically steepens to t-4.1±0.04 at 242 days. Note that this model has the goal to reproduce the long-term evolution of the X-ray emission, not the superposed hour-to-day temporal variability, evident in from the residuals, which was discussed in previous works (Rivera Sandoval et al., 2018; Margutti et al., 2019). As the spectrum softens, the observed at d appears in excess (2.7) with respect to the broken power-law model. In the hypothesis that the emission is instead still associated with AT 2018cow, a new component, here chosen to be constant with , needs to be added to the X-ray lightcurve model (smoothed broken power-lawconstant) to match the last XMM-Newton epoch. We will discuss the implications of a persistent vs. rapidly fading X-ray emission in FBOTs at d in §6.
5 Late-time Broadband Radio-UV-X-ray SEDs
AT 2018cow was observed with the the Karl G. Jansky Very Large Array (JVLA) at d (PI Coppejans; Margutti et al. 2019; Ho et al. 2019, Coppejans et al., in prep.), with the Giant Metrewave Radio Telescope (GMRT) extending to d (PI Nayana; Nayana & Chandra 2021) and with HST in the time window d (PIs Y. Chen, A. Filippenko, R. Foley, M. Drout, A. Levan; Sun et al. 2022, 2023; Chen et al. 2023a, b; Inkenhaag et al. 2023). In the following we model the multi-wavelength data sets that are approximately coeval with XMM-Newton Obs3 and Obs4.
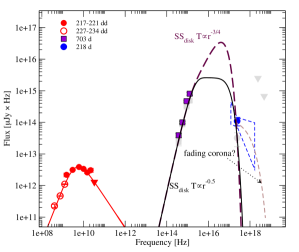
Multi-frequency radio observations were performed at t217–221 d (VLA, 1.5 to 33 GHz; Coppejans et al. in prep.), and t227-234 d (GMRT, at 0.4, 0.75 and 1.25 GHz; Nayana & Chandra 2021), thus coeval with XMM-Newton Obs3. The radio to X-ray SED is shown in Figure 3. We fit the radio data with a smoothed broken power-law model of the form:
| (1) |
which is typical of the synchrotron emission originating from the deceleration of astrophysical outflows associated with TDEs or SNe (e.g., Chevalier & Fransson 2017). We find a best-fitting break frequency 4.20.7 GHz, peak flux density of mJy, optically thick slope 2.00.3 and optically thin slope 0.70.3 (with a smoothing parameter 0.9). The VLA data will be discussed in detail elsewhere. Here it is sufficient to note that the extrapolation of the radio to the X-ray band severely underpredicts the X-ray flux, confirming that the emission in the two energy bands is produced by two distinct components, as found for the previous epochs (Margutti et al., 2019). Specifically, the shock-CSM interaction power that explains the radio data cannot account for the bright X-ray (and UV, see Figure 3) emission from AT 2018cow.
Late-time multi-band UV photometry was acquired with HST at d and d (Figure 2). The analysis of these observations has been presented in Sun et al. (2022, 2023); Chen et al. (2023a, b); Inkenhaag et al. (2023). These studies agree on the presence of a luminous (), blue () and persistent (albeit slowly fading) UV source at the location of AT 2018cow.888In the following analysis we adopt the HST photometry values presented in Chen et al. (2023a, b). However, we note that consistent findings would be obtained by using the photometry presented in the other studies, without any significant impact on our major conclusions. The UV spectrum is consistent with the expected for the Rayleigh-Jeans tail of an optically thick thermal spectrum. Chen et al. (2023a) find indications of a chromatic flux decay, with a flattening of the NUV spectrum in the last HST epoch, possibly pointing at cooling and expansion of the emitting region. The (slow) decay of the UV emission is not consistent with a stellar origin and suggests instead a physical association with AT 2018cow. Interestingly, similarly luminous, hot and lingering UV emission has been detected in TDEs in the lower BH mass bin (i.e., ) years after the optical flare (van Velzen et al., 2019; Mummery et al., 2023), and the similarity of the UV behavior of AT 2018cow and TDEs (and its astrophysical implications) has been recently pointed out by Inkenhaag et al. (2023).
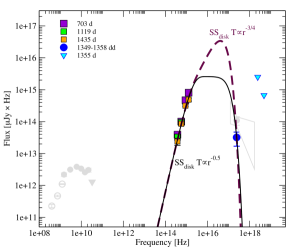
HST data at d are approximately coeval with XMM-Newton Obs4 and NuSTAR data.999Based on the very slow evolution of the source at these epochs both in the UV and X-rays we do not expect that the d difference between the acquisition time of these data sets will impact our major conclusions. Given the soft X-ray spectrum and the similar temporal behavior, we consider the possibility that the optical-UV and X-ray emission belong to the same radiative component, which we first model with the standard Shakura & Sunyaev (1973) multi-color black-body thin disk with a radial temperature scaling (solid line in Figure 3). The best-fitting parameters are an inner disk temperature (which is ), outer-disk temperature , and inner disk radius , which corresponds to the ISCO of a non-rotating BH with mass ( and the gravitational radius is cm). These parameters imply an outer disk radius from which most of the UV radiation is generated, and a BH accretion rate well below the Eddington limit , where we follow the convention . Less steep disk temperature profiles with such as those expected when radial flux advection is important (e.g., Narayan & McClintock 2008) lead to similar inferences on , and , but smaller accretor masses (Figure 3).
The inferred low temperature of the inner disk, set to truncate at the ISCO, is what drives the inference of IMBH-like accretor masses accreting at sub-Eddington rates (parenthetically, a similar argument motivated IMBH models for ULXs, e.g., Miller et al. 2004a, b; King et al. 2023). For , the disk will be a standard thin disk (e.g., Frank et al. 2002), for which the effective temperature of the radiation from the innermost radii is approximately given by:
| (2) |
Within this set of models, from Eq. 2, smaller-accretors with are coupled with inner disks that are hotter than (and not consistent with) the observed X-rays. We note that this argument is independent from the detected X-rays being physically associated with AT 2018cow or instead just providing a limit on the emission from AT 2018cow. Mathematically, this is a consequence of . For the same reason, our inferences are consistent with those of Chen et al. (2023a) where the authors used a shallower X-ray limit from Swift-XRT observations to reach a similar conclusion. However, differently from previous studies, we argue that these geometrically thin-disk models cannot be used to rule out BH accretors as in that case super-Eddington mass supplies are needed, which causes strong deviations from the geometrically thin-disk picture since , where and are the disk height and radius, respectively (e.g., Frank et al. 2002). We discuss models of super-critical accretion that might apply to LFBOTs in §6.
In this scenario, the disk is supposed to be present also at earlier times. Modelling of the optical-UV to X-ray emission at d provides us with parameter values consistent with those of the last epoch, with the caveat that the optical-UV flux at the time of Obs3 could have been higher. Interestingly, this model leaves an excess in the X-ray spectrum of Obs3, as supported by the X-ray spectral fit of a black body model resulting in a higher temperature and lower normalization (see §2.2. One possibility is that at d we are still detecting the non-thermal component, which was dominant at early times and is now rapidly fading (see Figure 3) and possibly driving the fast decay of the X-ray lightcurve at d.
6 Discussion
Deep late-time XMM-Newton observations out to d revealed a distinctive temporal and spectral evolution (Fig. 2) of the X-ray emission from the direction consistent with AT 2018cow. Additionally, the last two XMM-Newton observations of AT 2018cow at d indicate a spectral change from a relatively hard to a very soft spectrum. Given that most of the X-ray photons are detected at very soft X-ray energies, obscuration is unlikely. We note that the lack of an intrinsic absorber is in line with observations at early times (§2).
We discuss the implications of a soft X-ray source of emission in a LFBOT and its connection with the luminous, declining UV source, reported by Sun et al. (2023) and Chen et al. (2023a), within the context of the shock interaction model (§6.1) and accretion-powered emission on a compact object (§6.2). In the following, we assume the association of the X-ray emission with AT 2018cow robust for Obs3. Our main arguments hold true independently from the soft X-ray source of Obs4 being physically associated with AT 2018cow or regarded as a limit.
6.1 Shock Interaction with the Medium
The SED of AT 2018cow at 220 days clearly shows that the emission in the radio and X-ray bands stems from two separate radiative components and that the X-ray emission is in clear excess to the extrapolation of the synchrotron spectrum that best fits the shock-interaction-powered radio emission of AT 2018cow (Figure 2, lower panel). However, for shocks that propagate within regions of CSM with high densities the X-ray emission is expected to be dominated by thermal bremsstrahlung radiation (e.g., Fransson et al. 1996; Chevalier & Fransson 2017), as it was observationally confirmed in SN 2014C (Margutti et al., 2017; Thomas et al., 2022; Brethauer et al., 2022). In this scenario, and assuming electron-ion equipartition, the temperature of the emission is related to the shock velocity as , where is the shock velocity in units of , is the mean mass per particle including protons and electrons and we assumed solar composition and complete ionization, which is appropriate for a forward-shock powered X-ray emission.101010For shocked SN ejecta chemical composition and complete ionization, which is appropriate for a reverse-shock powered X-ray emission, . The observed very soft spectrum implies keV or , which is in stark contrast with the derived from the radio modeling at 257 d (Nayana & Chandra, 2021). We conclude that the forward shock that is powering the radio emission cannot be the source of energy behind the persistent, soft X-ray emission. A similar conclusion is supported by the independent analysis of the late-time UV emission (Chen et al., 2023a) that we do not replicate here.
6.2 Accretion-powered scenarios for AT 2018cow and LFBOTs
In this section we explore scenarios that connect the observed late-time UV-X-rays with manifestation of accretion processes onto a compact object. We start by summarizing the inferences from the early time data at d that are relevant here and independently support this physical scenario.
Generically, Compton-hump spectra like those observed in AT 2018cow (Margutti et al. 2019, their Figure 6) have been observationally associated with accreting sources like those of Active Galactic Nuclei (AGN) or X-Ray Binaries (XRBs), e.g, Reynolds (1999); Risaliti et al. (2013); Belloni & Motta (2016). More specifically: (i) the observed X-ray and UV emission from AT 2018cow reaching , if accretion powered, implies a super-Eddington regime for any accretor with mass . Borrowing the argument from the ULX literature (e.g., King et al. 2023), this large luminosity, if disk powered, requires beaming of the emission even for super-Eddington mass supplies. (ii) This super-critical accretion scenario is independently supported by the significantly blue-shifted Fe K fluorescent line observed in AT 2018cow at d (Margutti et al., 2019). The numerical simulations by Thomsen et al. (2019), which were originally motivated by the discovery of such a strongly blue-shifted Fe-K line in the jetted relativistic TDE Swift J1644 (Kara et al., 2016), showed that hot (6.7–6.97 keV rest-frame), strongly blue-shifted (8 keV centroid) Fe K fluorescent lines are a robust observational signature of super-Eddington accretion disks irradiated by a lamp-post corona. Optically thick outflows are launched from the super-Eddington disk and create a conical funnel structure that provides the reflecting surface shaping the line profile, in close similarity to the model invoked by Margutti et al. (2019). Note that at d, we could still be detecting the rapidly cooling corona emission. (iii) The outflow velocity required to produce the observed Fe K line shift is 0.2, which is similar to the inferred velocity of the optical photosphere of AT 2018cow at early times, and to the velocity of its radio emitting material (Ho et al., 2019; Margutti et al., 2019; Nayana & Chandra, 2021).
These velocities are significantly larger than thermal (or magneto-centrifugal) winds from sub-Eddington XRBs, but intriguingly similar to the velocity of a few c expected to be associated with outflows launched by super-Eddington accretion disks (e.g., Thomsen et al. 2019 and references therein).111111Consistently, these “ultra-fast outflows” have been located in several ULXs, see e.g. King et al. (2023) for a recent review.
6.2.1 Inner accretion disk temperature: IMBHs vs. BHs
The inferences above support a physical connection between the early emission from AT 2018cow and the manifestation of a super-Eddington accretion phase (like in jetted TDEs, GRBs and ULXs) independently from the accretor mass. From an X-ray perspective, the X-ray constraints at d indicate that the system evolves from luminous, spectrally hard and super-Eddington regime, to remarkably fainter, softer and Eddington one (Figure 2). We thus consider that one of three potential transient events (i.e., a massive stellar core collapse, Wolf Rayet-BH merger, IMBH-TDE) results in the formation of a (super-Eddington) accretion disk of initial outer radius around a black hole of mass . The disk spreads with time as and evolves to an innermost ring temperature by the time of our X-ray observations.
For , the disk will be a standard thin-disk, for which the effective temperature of the radiation from the innermost radii is approximately given by Equation 2. However, for we expect powerful outflows from the inner regions of the disk (e.g., Narayan & Yi 1995; Blandford & Begelman 1999; Kitaki et al. 2021), which can carry a substantial fraction of accreted matter and that can place the photosphere radius at radii . In particular, a steady quasi-spherical wind with a mass-loss rate and velocity launched from will possess a density profile at radii given by .
The optical depth of the wind above a radius is
| (3) |
such that the photosphere radius () is
| (4) |
where we take an electron-scattering dominated opacity (for fully ionized gas with H-dominated composition) cm2 g-1, and being the Thompson cross section and the proton mass, respectively. Assuming the emitted luminosity follows with radiative efficiency as predicted by simulations of super-Eddington accretion (e.g., Sadowski & Narayan 2016), this predicts a maximum emission temperature for thermal emission from the innermost radii of the disk given by
| (5) |
where , we have taken as expected for super-Eddington accretion disks that lose an order-unity fraction of their inflowing mass across each decade of radius (e.g., Blandford & Begelman 1999) and we used .
Unlike a thin disk for which increases for higher accretion rate (Equation 2), for super-Eddington accretion the thermal photosphere temperature decreases for higher accretion rate.121212Though we note that non-thermal X-ray emission such as that observed at early times in AT 2018cow can originate above the photosphere and will not follow Equation 5. For example, if , and , Equation 5 gives similar to the thin-disk temperature (Equation 2) for an higher-mass IMBH accreting at , corresponding to (similar to our last observations of AT 2018cow, Fig. 2). Stated another way, for any observed and there can be two allowed solutions: sub-Eddington for a high-mass (i.e. IMBH-like) BH (Eq. 2), and super-Eddington for a low-mass BH (Eq. 5). This argument applies independently from the physical association of the late-time soft X-ray source to AT 2018cow.
6.2.2 Outer accretion disk radius: IMBHs vs. BHs
Late-time UV observations of AT 2018cow constrain the outer disk radius at d to a value (§5). In this section we discuss the expectations from accretion disks formed by a core-collapse stellar explosion, an IMBH-TDE and a WR-BH merger.
In the core-collapse case, the initial disk radius depends on the angular momentum of the progenitor star, butinsofar that angular momentum is at a premium (e.g., Fuller & Ma 2019)is typically expected to be just outside the ISCO radius of at most tens of gravitational radii cm. So, we expect cm in the core-collapse case.
In the IMBH-TDE case, the characteristic disk radius is at most (i.e., for a typical encounter, where is the penetration parameter, is the periapse) equal to twice the tidal radius :
| (6) |
where and are the mass and radius of the disrupted star, respectively, and we have normalized to to match the fall-back time of the debris (e.g., Stone et al. 2013) with the AT 2018cow peak engine duration optical rise-time 3 d.
The disruption process setting the disk size in the WR merger case is similar to the TDE scenario, except the BH is much less massive and the mass of the WR star is generally greater than the Sun, resulting in cm (e.g., Metzger 2022).
After forming, the disk will begin to accrete on the viscous timescale
| (7) |
where is the effective kinematic viscosity, , , is the sound speed and we have normalized the equation to the case of a geometrically thick disk with (see below). In the WR-BH merger case, the LFBOT engine timescale d (for ) is naturally set by However, in the core-collapse case and as a result is too short to represent the engine activity timescale of AT 2018cow, which would instead be set by the free-fall time of the infalling stellar envelope. The viscous time in the IMBH-TDE case can also (just barely) obey for high and/or small stellar radius .
On timescales , the disk will establish a steady flow onto the central compact object. Taking as the mass of the disk, the peak accretion rate near the outer disk edge can be estimated as,
| (8) |
This is orders of magnitude larger than the Eddington rate g s-1, justifying our assumption of a geometrically thick disk with (e.g., Sadowski & Narayan 2015).
For the high mass inflow rates of interest, photons are trapped and advected inwards through the disk at radii (e.g., Begelman 1979). Since the disk cannot cool efficiently via radiation (e.g., Shakura & Sunyaev 1973), the accretion flow in this “hyper-accretion” regime is susceptible to outflows powered by the released gravitational energy (e.g., Narayan & Yi 1995; Blandford & Begelman 1999; Kitaki et al. 2021). These outflows are responsible for creating the conical funnel geometry where the blue-shifted Fe K line is formed and provide a natural explanation to the AT 2018cow fastest ejecta traced by radio observations (§6.2). Such outflows cause the mass inflow rate to decrease approaching the BH surface, in a way typically parametrized as a power-law in radius,
| (9) |
where values for the parameter are motivated by numerical simulations of radiatively inefficient accretion flows (e.g., Yuan & Narayan 2014).
At late times , the outer edge of the disk will spread outwards from its initial radius due to the redistribution of angular momentum:
| (10) |
where the parameter depends on the properties of the disk outflows. If the disk outflows carry away only the local specific angular momentum of the disk material, then the outer edge of the disk will grow with time as (e.g., Cannizzo et al. 1990). However, in the case of a net torque on the disk, one can instead have (Metzger et al., 2008) where in the final equality we take .
Thus, by the time of the HST observations d, the disk will spread to a radius , where we demand d to match the maximum initial rise time of AT 2018cow. Thus we predict for the WR-BH merger case, in overall agreement with the inferences from the late-time HST observations of AT 2018cow, but generally significantly larger or smaller values in the IMBH-TDE or core-collapse cases, respectively. From this perspective, the WR-BH merger scenario provides a natural explanation of the inferred size of the accretion disk at late times, while the other two scenarios struggle explaining the size of the UV emitting region. We note that a potentially viable option is represented by the IMBH tidal disruption of a very small star with and .
We end with a note on the expected evolution of the accretion power in the WR-BH merger and IMBH-TDE models. The accretion rate at disk radii will drop as a power-law in time (e.g., Metzger et al. 2008), viz.
| (11) |
such that the accretion rate reaching the central BH will decay as
| (12) |
for . This results in a jetted accretion power
| (13) |
where we have used Eqs. (6), (8), (12) for . This expression is valid for . We observe that is broadly similar in normalization and power-law decay rate to the optical-UV light curve of AT 2018cow (e.g., Margutti et al. 2019, their fig. 9; Chen et al. 2023a), suggesting that the early UV/optical emission from AT 2018cow might also be powered by accretion processes onto a BH.
6.3 Comparison with other LFBOTs: a unifying model
The long-term evolution of the X-ray emission from the location of AT 2018cow is characterized by three regimes: (i) an initial, highly-luminous slowly-decreasing phase at 24 d with fast temporal variability superimposed, (ii) a rapid decay (about three order of magnitude drop in 200 days), possibly followed by (iii) a late-time flattening phase with at 200 d with a soft X-ray spectrum, which, however, might be contaminated, or even dominated, by the host emission. The presence of luminous, lingering optical/UV emission during phase (iii) (Sun et al., 2022, 2023; Chen et al., 2023a, b), which is reminiscent of TDEs in the lowest mass bin (van Velzen et al., 2019; Mummery et al., 2023; Inkenhaag et al., 2023), indirectly supports the physical association of the persistent, soft X-ray emission with AT 2018cow. Indeed, a further deep X-ray observation, able to probe the flux level measured in Obs4, could help to better discriminate the AT 2018cow contribution from the host galaxy one.
The other five X-ray detected LFBOTs showed a X-ray luminosity comparable to or larger than AT 2018cow (Figure 2), with AT 2022tsd rivaling the brightest long gamma-ray burst ever detected (Matthews et al., 2023). In the accretion-reprocessing scenario, more luminous X-ray emission can be a consequence of more powerful accretion and/or more favourable geometry (i.e. a pole-on viewing angle, Metzger, 2022), so that brighter or dimmer X-rays detected for other LFBOTs might be a consequence of the geometry of the emission and the location of the observer with respect to the pole.131313We note that the highly aspherical geometry invoked here is consistent with the large polarization degree reaching measured at optical wavelengths at a few days post-discovery of AT 2018cow (Maund et al., 2023). Since Fe K fluorescent lines are visible only to non-equatorial observers (i.e. for observers at large angles from the poles the Fe K emission is hidden by the optically thick disk and wind), it is plausible that the other LFBOTs with luminous X-rays also had transient Fe K spectroscopic features (and Compton humps) that were missed because their X-ray monitoring started too late (Fig. 2). As a reference, the Fe K line subsided at d in AT 2018cow, and no other LFBOT has X-ray observations at these early epochs. Similarly, the large distances of all the other LFBOTs prevent meaningful constraints on the presence of faint persistent X-ray emission at late time d. Therefore, other LFBOTs need to be discovered in the local universe (i.e. within Mpc) and at very early stages of their evolution (i.e. within days), in order to assess the occurrence of the Fe K line complex, (and the associated Compton hump feature), and validate the late time soft X-ray flattening.
We end by noting that this LFBOT unification model where the optical/UV and X-ray emission is powered by accretion (in the super-Eddington regime at early times, decreasing to Eddington at late times), and the radio emission is powered by the deceleration of the outflows into the CSM, naturally predicts the presence of AT 2018cow-like transients that are viewed edge-on, and will thus appear X-ray dim, if their optical/UV emission is detectable by these “equatorial” observers.
7 Summary and conclusions
We presented the first deep X-ray observations of an LFBOT at yrs after optical discovery. These observations sample a pristine portion of the observational phase space of FBOTs, and revealed the presence of a luminous, persistent, soft X-ray source of emission at the location of AT 2018cow. The association with AT 2018cow of such emission appears robust at and uncertain at d, given the potentially comparable level of the X-ray flux from the host galaxy. We modeled the soft X-ray emission in the broader context of the late-time panchromatic observations AT 2018cow, which includes luminous and slowly fading UV emission that is reminiscent of that detected from TDEs in the lowest mass bin years after the stellar disruption, as recently pointed out by Inkenhaag et al. (2023). We find that these late-time panchromatic observations of AT 2018cow are consistent with either sub-Eddington accretion on an IMBH () or with the manifestation of Eddington-like accretion processes on a lower-mass accretor, e.g., a BH of . While similar arguments have been used in the ULX literature based on the detection of soft X-rays from these systems,141414Specifically we note how IMBHs have been invoked in the ULX literature for systems that later were revealed to host pulsars, e.g. King et al. (2023) and references therein. we note that this conclusion is independent from the physical association of the soft X-ray source with AT 2018cow (i.e. the argument applies even if we interpret the soft X-ray emission as a limit on the X-ray luminosity output of AT 2018cow at these late epochs).
Assuming that the UV emission originates from the outermost annuli of a spreading disk, we showed that, with the exception of very small stars, the IMBH-TDE model () struggles to explain the inferred accretion disk radius, in addition to lacking a natural explanation for the dense CSM with a steep cutoff at a few implied by the analysis of the radio observations of AT 2018cow and other LFBOTs. The detection of an X-ray QPO signature in AT 2018cow, if interpreted as an orbital frequency in the accretion disk, furthermore implies . Nevertheless, if the IMBH-TDE is the correct physical scenario powering LFBOTs, we predict that other LFBOTs will be associated with larger disks at late times (e.g., cooler-late time emission). On the other hand, the WR-BH merger scenario that invokes smaller masses BHs, offers a natural source of dense CSM within a few in the form of WR mass loss and relic disk from the common-envelope phase (Tuna & Metzger, 2023), and while being able to explain the compact size of the disk at late times of our monitoring. A similar scenario, involving a neutron star (NS) spiraling-in inside the envelope of a massive star has been proposed by Soker et al. (2019) (see also Grichener 2023).
Most importantly, independently from the BH mass, our work provides support to the hypothesis that LFBOTs are accretion-powered transients, thus also indirectly supporting the picture where the early, luminous and short-lived UV-optical emission that gives LFBOTs their name originates at least in part from (partial) reprocessing of the high-energy X-rays by outflows launched by the super-Eddington accretion disk. In this accretion-powered scenario the LFBOTs observational properties at early times represent electromagnetic manifestations of super-Eddington accreting systems, later transitioning into an Eddington to sub-Eddington accretion ratio over the time scale of a few hundreds of days. In this perspective LFBOTs qualify as new laboratories for super-Eddington accretion physics. However, AT 2018cow is still the only event for which meaningful observations and detailed studies of its early (i.e. week) and late-time (i.e. years) evolution can be performed thanks to its proximity.
Going forward, wide field-of-view UV missions like ULTRASAT (Sagiv et al., 2014) and UVEX (Kulkarni et al., 2021) will fill up this observational gap by providing early UV detections of LFBOTs in the local Universe.
Finally, if related to an IMBH-TDE, LFBOTs are expected to produce gravitational waves, observable in the future in the local Universe (10-25 Mpc) using the LISA detector (e.g. Eracleous et al., 2019, and references therein).
| Observation log | ||||
|---|---|---|---|---|
| Obs3 | Obs4 | |||
| 0822580601 | 0843550401 | 0843550501 | 0843550601 | |
| (Obs4a) | (Obs4b) | (Obs4c) | ||
| Date (YYYY-mm-dd) | 2019-01-20 | 2022-02-24 | 2022-03-01 | 2022-03-05 |
| MJD | 58503.2 | 59634.4 | 59639.1 | 59643.6 |
| Time since discovery (d) | 218 | 1349 | 1354 | 1358 |
| Duration (ks) | 56.4 | 39.3 | 44.6 | 44.6 |
| Exposure (ks) | 42.5(pn) | 31.2(pn) | 7.6(pn) | 2.2(pn) |
| 54.2(MOS1) | 37.4(MOS1) | 14.0(MOS1) | 15.3(MOS1) | |
| 54.4(MOS2) | 37.4(MOS2) | 17.0(MOS2) | 23.4(MOS2) | |
| AT 2018cow detection | ||||
| Obs3 | Obs4 | |||
| 0.2-4.5 keV net count-rate (c/s) | (9.43.2)10-4 (pn) | (5.72.4)10-4 (pn) | ||
| (2.51.4)10-4 (MOS1) | (7.11.9)10-4 (MOS1) | |||
| (4.51.5)10-4 (MOS2) | (2.71.3)10-4 (MOS2) | |||
| (11.33.0)10-4 (tot.) | (6.32.0)10-4 (tot.) | |||
| detection likelihood | 10.8 | 9.1 | ||
| 0.3-10 keV unabs. flux (erg cm-2 s-1) | (4.5)10-15 | (1.00.4)10-15 | ||
| 0.3-10 keV luminosity (erg s-1) | (1.90.6)1039 | (4.31.7)1038 | ||
Note. — Detection count rates and likelihood have been obtained with edetect_chain (Obs3) and edetect_stack (Obs4), see §2. The count rates are calculated under the entire PSF of the detection, corrected for background, vignetting, detector efficiency and gaps. Unabsorbed fluxes have been derived from the spectral analysis for Obs3 and from the pn count rate using WebPIMMS for Obs4. In both cases, we used the spectral parameters from the best-fitting power-law model of Obs 3 (2.9 and cm-2).
Appendix A Early-time Chandra observations
Chandra observed AT 2018cow with the Low Energy Transmissions Gratings (LETG), using the High Resolution Camera (HRC)-Spectroscopy detectors for 48 ks, beginning on June 24, 2018 (8.2 d). A quick reduction was presented in a telegram shortly after the data were taken (Maccarone et al., 2018), and our more careful analysis is consistent with that work. We use the TGCAT data reductions (Huenemoerder et al., 2011), and use all orders of the spectrum for to . The initial goal for using this mode was to determine whether there was an extreme UV excess from this source, given the strong UV emission observed by Swift-UVOT (Rivera Sandoval & Maccarone, 2018; Kuin et al., 2018). Such an excess was not present, and the spectrum below about 0.2 keV was heavily dominated by background. We thus fit the data between the chip gap energy and 7 keV. For the negative orders, the range of fitted energy is 0.3-7 keV, while for the positive orders it is from 0.24-7 keV.
We group the data into bins with at least 100 counts, and fit using with Gehrels (1986) weighting. Using an absorbed power law spectrum, with the Xspec (Arnaud, 1996) phabs model within Sherpa (Freeman et al., 2001), we find = cm-2, thus consistent with , =1.66, and a total unabsorbed flux from 0.25-7.0 keV of erg sec-1 cm-2, with of 136/162. Additional parameters are thus not well justified. The 0.3-10 keV luminosity is (4.80.4)1042 erg s-1, and it is in line with the values measured by the other X-ray observatories at the same epoch.
References
- Akashi & Soker (2021) Akashi, M., & Soker, N. 2021, MNRAS, 501, 4053
- Antoni & Quataert (2022) Antoni, A., & Quataert, E. 2022, MNRAS, 511, 176
- Arcavi et al. (2016) Arcavi, I., Wolf, W. M., Howell, D. A., et al. 2016, ApJ, 819, 35
- Arnaud (1996) Arnaud, K. A. 1996, in Astronomical Society of the Pacific Conference Series, Vol. 101, Astronomical Data Analysis Software and Systems V, ed. G. H. Jacoby & J. Barnes, 17
- Astropy Collaboration et al. (2013) Astropy Collaboration, Robitaille, T. P., Tollerud, E. J., et al. 2013, A&A, 558, A33
- Begelman (1979) Begelman, M. C. 1979, MNRAS, 187, 237
- Belloni & Motta (2016) Belloni, T. M., & Motta, S. E. 2016, in Astrophysics and Space Science Library, Vol. 440, Astrophysics of Black Holes: From Fundamental Aspects to Latest Developments, ed. C. Bambi, 61
- Bietenholz et al. (2020) Bietenholz, M. F., Margutti, R., Coppejans, D., et al. 2020, MNRAS, 491, 4735
- Blandford & Begelman (1999) Blandford, R. D., & Begelman, M. C. 1999, MNRAS, 303, L1
- Brethauer et al. (2022) Brethauer, D., Margutti, R., Milisavljevic, D., et al. 2022, ApJ, 939, 105
- Bright et al. (2022) Bright, J. S., Margutti, R., Matthews, D., et al. 2022, ApJ, 926, 112
- Cannizzo et al. (1990) Cannizzo, J. K., Lee, H. M., & Goodman, J. 1990, ApJ, 351, 38
- Chen et al. (2023a) Chen, Y., Drout, M. R., Piro, A. L., et al. 2023a, arXiv e-prints, arXiv:2303.03501
- Chen et al. (2023b) —. 2023b, arXiv e-prints, arXiv:2303.03500
- Chevalier & Fransson (2017) Chevalier, R. A., & Fransson, C. 2017, in Handbook of Supernovae, ed. A. W. Alsabti & P. Murdin, 875
- Chrimes et al. (2023) Chrimes, A. A., Jonker, P. G., Levan, A. J., et al. 2023, arXiv e-prints, arXiv:2307.01771
- Coppejans et al. (2020) Coppejans, D. L., Margutti, R., Terreran, G., et al. 2020, ApJ, 895, L23
- Dessart et al. (2022) Dessart, L., Hillier, D. J., & Kuncarayakti, H. 2022, A&A, 658, A130
- Drout et al. (2014) Drout, M. R., Chornock, R., Soderberg, A. M., et al. 2014, ApJ, 794, 23
- Eracleous et al. (2019) Eracleous, M., Gezari, S., Sesana, A., et al. 2019, BAAS, 51, 10
- Fox & Smith (2019) Fox, O. D., & Smith, N. 2019, MNRAS, 488, 3772
- Frank et al. (2002) Frank, J., King, A., & Raine, D. J. 2002, Accretion Power in Astrophysics: Third Edition
- Fransson et al. (1996) Fransson, C., Lundqvist, P., & Chevalier, R. A. 1996, ApJ, 461, 993
- Freeman et al. (2001) Freeman, P., Doe, S., & Siemiginowska, A. 2001, in Society of Photo-Optical Instrumentation Engineers (SPIE) Conference Series, Vol. 4477, Astronomical Data Analysis, ed. J.-L. Starck & F. D. Murtagh, 76–87
- Fruscione et al. (2006) Fruscione, A., McDowell, J. C., Allen, G. E., et al. 2006, in Society of Photo-Optical Instrumentation Engineers (SPIE) Conference Series, Vol. 6270, Society of Photo-Optical Instrumentation Engineers (SPIE) Conference Series, ed. D. R. Silva & R. E. Doxsey, 62701V
- Fuller & Ma (2019) Fuller, J., & Ma, L. 2019, ApJ, 881, L1
- Gehrels (1986) Gehrels, N. 1986, ApJ, 303, 336
- Gottlieb et al. (2022) Gottlieb, O., Tchekhovskoy, A., & Margutti, R. 2022, MNRAS, 513, 3810
- Grichener (2023) Grichener, A. 2023, MNRAS, 523, 221
- Harrison et al. (2013) Harrison, F. A., Craig, W. W., Christensen, F. E., et al. 2013, ApJ, 770, 103
- Ho et al. (2022a) Ho, A. Y. Q., Perley, D. A., Chen, P., et al. 2022a, Transient Name Server AstroNote, 267, 1
- Ho et al. (2020a) Ho, A. Y. Q., Perley, D. A., Kulkarni, S. R., Dong, D. Z. J., et al. 2020a, ApJ, 895, 49
- Ho et al. (2019) Ho, A. Y. Q., Phinney, E. S., Ravi, V., et al. 2019, ApJ, 871, 73
- Ho et al. (2020b) Ho, A. Y. Q., Perley, D. A., Kulkarni, S. R., et al. 2020b, ApJ, 895, 49
- Ho et al. (2022b) Ho, A. Y. Q., Perley, D. A., Yao, Y., et al. 2022b, ApJ, 938, 85
- Ho et al. (2022c) Ho, A. Y. Q., Margalit, B., Bremer, M., et al. 2022c, ApJ, 932, 116
- Huenemoerder et al. (2011) Huenemoerder, D. P., Mitschang, A., Dewey, D., et al. 2011, AJ, 141, 129
- Inkenhaag et al. (2023) Inkenhaag, A., Jonker, P. G., Levan, A. J., et al. 2023, arXiv e-prints, arXiv:2308.07381
- Kalberla et al. (2005) Kalberla, P. M. W., Burton, W. B., Hartmann, D., et al. 2005, A&A, 440, 775
- Kara et al. (2016) Kara, E., Miller, J. M., Reynolds, C., & Dai, L. 2016, Nature, 535, 388
- King et al. (2023) King, A., Lasota, J.-P., & Middleton, M. 2023, New A Rev., 96, 101672
- Kitaki et al. (2021) Kitaki, T., Mineshige, S., Ohsuga, K., & Kawashima, T. 2021, arXiv e-prints, arXiv:2101.11028
- Kuin et al. (2018) Kuin, N. P. M., Wu, K., Oates, S., et al. 2018, ArXiv e-prints, arXiv:1808.08492
- Kuin et al. (2019) Kuin, N. P. M., Wu, K., Oates, S., et al. 2019, MNRAS, 487, 2505
- Kulkarni et al. (2021) Kulkarni, S. R., Harrison, F. A., Grefenstette, B. W., et al. 2021, arXiv e-prints, arXiv:2111.15608
- Lehmer et al. (2016) Lehmer, B. D., Basu-Zych, A. R., Mineo, S., et al. 2016, ApJ, 825, 7
- Leung et al. (2021) Leung, S.-C., Fuller, J., & Nomoto, K. 2021, ApJ, 915, 80
- Lyman et al. (2020) Lyman, J. D., Galbany, L., Sánchez, S. F., et al. 2020, MNRAS, 495, 992
- Maccarone et al. (2018) Maccarone, T. J., Rivera Sandoval, L., Corsi, A. r., Pooley, D., & Knigge, C. 2018, The Astronomer’s Telegram, 11779, 1
- Margalit (2022) Margalit, B. 2022, ApJ, 933, 238
- Margutti et al. (2019) Margutti, R., Metzger, B. D., Chornock, R., et al. 2019, ApJ, 872, 18
- Margutti et al. (2017) Margutti, R., Kamble, A., Milisavljevic, D., et al. 2017, ApJ, 835, 140
- Matthews et al. (2023) Matthews, D. J., Margutti, R., Metzger, B. D., et al. 2023, arXiv e-prints, arXiv:2306.01114
- Maund et al. (2023) Maund, J. R., Höflich, P. A., Steele, I. A., et al. 2023, MNRAS, 521, 3323
- Metzger (2022) Metzger, B. D. 2022, ApJ, 932, 84
- Metzger & Perley (2023) Metzger, B. D., & Perley, D. A. 2023, ApJ, 944, 74
- Metzger et al. (2008) Metzger, B. D., Piro, A. L., & Quataert, E. 2008, MNRAS, 390, 781
- Michałowski et al. (2019) Michałowski, M. J., Kamphuis, P., Hjorth, J., et al. 2019, A&A, 627, A106
- Miller et al. (2004a) Miller, J. M., Fabian, A. C., & Miller, M. C. 2004a, ApJ, 614, L117
- Miller et al. (2004b) —. 2004b, ApJ, 607, 931
- Mineo et al. (2014) Mineo, S., Gilfanov, M., Lehmer, B. D., Morrison, G. E., & Sunyaev, R. 2014, MNRAS, 437, 1698
- Mineo et al. (2012) Mineo, S., Gilfanov, M., & Sunyaev, R. 2012, MNRAS, 426, 1870
- Mohan et al. (2020) Mohan, P., An, T., & Yang, J. 2020, ApJ, 888, L24
- Mummery et al. (2023) Mummery, A., van Velzen, S., Nathan, E., et al. 2023, arXiv e-prints, arXiv:2308.08255
- Narayan & McClintock (2008) Narayan, R., & McClintock, J. E. 2008, New A Rev., 51, 733
- Narayan & Yi (1995) Narayan, R., & Yi, I. 1995, ApJ, 444, 231
- Nayana & Chandra (2021) Nayana, A. J., & Chandra, P. 2021, ApJ, 912, L9
- Nicholl et al. (2023) Nicholl, M., Srivastav, S., Fulton, M. D., et al. 2023, ApJ, 954, L28
- Pasham et al. (2021) Pasham, D. R., Ho, W. C. G., Alston, W., et al. 2021, Nature Astronomy, 6, 249
- Pellegrino et al. (2022) Pellegrino, C., Howell, D. A., Vinkó, J., et al. 2022, ApJ, 926, 125
- Perley et al. (2019) Perley, D. A., Mazzali, P. A., Yan, L., et al. 2019, MNRAS, 484, 1031
- Poznanski et al. (2010) Poznanski, D., Chornock, R., Nugent, P. E., et al. 2010, Science, 327, 58
- Prentice et al. (2018) Prentice, S. J., Maguire, K., Smartt, S. J., et al. 2018, ApJ, 865, L3
- Pursiainen et al. (2018) Pursiainen, M., Childress, M., Smith, M., et al. 2018, MNRAS, 481, 894
- Quataert et al. (2019) Quataert, E., Lecoanet, D., & Coughlin, E. R. 2019, MNRAS, 485, L83
- Rest et al. (2018) Rest, A., Garnavich, P. M., Khatami, D., et al. 2018, Nature Astronomy, 2, 307
- Reynolds (1999) Reynolds, C. S. 1999, in Astronomical Society of the Pacific Conference Series, Vol. 161, High Energy Processes in Accreting Black Holes, ed. J. Poutanen & R. Svensson, 178
- Risaliti et al. (2013) Risaliti, G., Harrison, F. A., Madsen, K. K., et al. 2013, Nature, 494, 449
- Rivera Sandoval & Maccarone (2018) Rivera Sandoval, L. E., & Maccarone, T. 2018, The Astronomer’s Telegram, 11737, 1
- Rivera Sandoval et al. (2018) Rivera Sandoval, L. E., Maccarone, T. J., Corsi, A., et al. 2018, MNRAS, 480, L146
- Rosen et al. (2016) Rosen, S. R., Webb, N. A., Watson, M. G., et al. 2016, A&A, 590, A1
- Sadowski & Narayan (2015) Sadowski, A., & Narayan, R. 2015, MNRAS, 453, 3213
- Sadowski & Narayan (2016) —. 2016, MNRAS, 456, 3929
- Sagiv et al. (2014) Sagiv, I., Gal-Yam, A., Ofek, E. O., et al. 2014, AJ, 147, 79
- Schrøder et al. (2020) Schrøder, S. L., MacLeod, M., Loeb, A., Vigna-Gómez, A., & Mandel, I. 2020, ApJ, 892, 13
- Shakura & Sunyaev (1973) Shakura, N. I., & Sunyaev, R. A. 1973, A&A, 500, 33
- Smartt et al. (2018) Smartt, S. J., Clark, P., Smith, K. W., et al. 2018, The Astronomer’s Telegram, 11727
- Soker et al. (2019) Soker, N., Grichener, A., & Gilkis, A. 2019, MNRAS, 484, 4972
- Stone et al. (2013) Stone, N., Sari, R., & Loeb, A. 2013, MNRAS, 435, 1809
- Sun et al. (2022) Sun, N.-C., Maund, J. R., Crowther, P. A., & Liu, L.-D. 2022, MNRAS, 512, L66
- Sun et al. (2023) Sun, N.-C., Maund, J. R., Shao, Y., & Janiak, I. A. 2023, MNRAS, 519, 3785
- Tampo et al. (2020) Tampo, Y., Tanaka, M., Maeda, K., et al. 2020, ApJ, 894, 27
- Thomas et al. (2022) Thomas, B. P., Wheeler, J. C., Dwarkadas, V. V., et al. 2022, ApJ, 930, 57
- Thomsen et al. (2019) Thomsen, L. L., Lixin Dai, J., Ramirez-Ruiz, E., Kara, E., & Reynolds, C. 2019, ApJ, 884, L21
- Traulsen et al. (2019) Traulsen, I., Schwope, A. D., Lamer, G., et al. 2019, A&A, 624, A77
- Traulsen et al. (2020) —. 2020, A&A, 641, A137
- Tuna & Metzger (2023) Tuna, S., & Metzger, B. D. 2023, arXiv e-prints, arXiv:2306.10111
- van Velzen et al. (2019) van Velzen, S., Stone, N. C., Metzger, B. D., et al. 2019, ApJ, 878, 82
- Virtanen et al. (2020) Virtanen, P., Gommers, R., Oliphant, T. E., et al. 2020, Nature Methods, 17, 261
- Vurm & Metzger (2021) Vurm, I., & Metzger, B. D. 2021, ApJ, 917, 77
- Webb et al. (2020) Webb, N. A., Coriat, M., Traulsen, I., et al. 2020, A&A, 641, A136
- Xiang et al. (2021) Xiang, D., Wang, X., Lin, W., et al. 2021, ApJ, 910, 42
- Yao et al. (2022) Yao, Y., Ho, A. Y. Q., Medvedev, P., et al. 2022, ApJ, 934, 104
- Yuan & Narayan (2014) Yuan, F., & Narayan, R. 2014, ARA&A, 52, 529
- Zhang et al. (2022) Zhang, W., Shu, X., Chen, J.-H., et al. 2022, Research in Astronomy and Astrophysics, 22, 125016