CLRmatchNet: Enhancing Curved Lane Detection with Deep Matching Process
Abstract
Lane detection plays a crucial role in autonomous driving by providing vital data to ensure safe navigation. Modern algorithms rely on anchor-based detectors, which are then followed by a label assignment process to categorize training detections as positive or negative instances based on learned geometric attributes. The current methods, however, have limitations and might not be optimal since they rely on predefined classical cost functions that are based on a low-dimensional model. Our research introduces MatchNet, a deep learning sub-module-based approach aimed at enhancing the label assignment process. Integrated into a state-of-the-art lane detection network like the Cross Layer Refinement Network for Lane Detection (CLRNet), MatchNet replaces the conventional label assignment process with a sub-module network. This integration results in significant improvements in scenarios involving curved lanes, with remarkable improvement across all backbones of +2.8% for ResNet34, +2.3% for ResNet101, and +2.96% for DLA34. In addition, it maintains or even improves comparable results in other sections. Our method boosts the confidence level in lane detection, allowing an increase in the confidence threshold. The code will be available soon: https://github.com/sapirkontente/CLRmatchNet.git

1 Introduction
Label assignment is a critical element within modern object detection models, wielding a substantial impact on their overall performance. The methodologies used for label assignment can yield significantly diverse results in the context of detection models. During this phase, the main objective is to establish a meaningful association between each prediction and its corresponding ground-truth (GT) for classification purposes. When a prediction aligns with a GT, it is considered as positive, whereas predictions lacking relevance to any GT are labeled as negatives. During training, the model learns to assign high confidence scores to the lanes labeled as positive, therefore predicted lanes that have high alignment score with the GTs are expected to receive high classification scores at test time. Label assignment serves as a stabilizing factor in the training process. Instead of optimizing all predictions, label assignment allows us to filter the most promising predictions for subsequent fine-tuning. This strategy allows the model to focus on the strong predictions without being affected by the weaker ones.
Typically, this procedure incorporates a predefined cost function that takes into account various geometric attributes and classification scores, assigning a score to each GT-prediction pairing. A filtering mechanism is then applied to select the most relevant pairings according to their respective scores. Modern object detectors employ a variety of cost functions, some relying solely on geometric metrics while others incorporate classification scores. Earlier models used fixed thresholds based on cost function scores to distinguish between positive and negative predictions, whereas recent models employ adaptive label assignment strategies that dynamically calculate thresholds for improved performance.
The formulation of the cost function is of utmost importance, as it directly determines the diagnostic ability of the distribution of matching degrees between pairs. A cost function based on classification scores and geometric attributes, such as the lane shape, lane curvature, start point, length, angle related to the bottom of the frames, and more, should be properly designed to avoid negatively affecting its diagnostic ability. Consequently, it is crucial to formulate the cost function in such a way that each of these attributes is effectively considered, enabling the label assignment process to identify the most relevant lanes and label them as positive.
State-of-the-art anchor-based algorithms such as CLRNet [13], often use straight lines as anchors that are regressed to obtain the desired lane shapes. Consequently, curved lanes often have fewer high-quality anchors corresponding to them, whereas straight lanes tend to have more. Given that the initial geometric alignment between the predictions and the curved GT lane is likely to be low, the label assignment method might tend to favor matches with lanes exhibiting high confidence but poor alignment with the curved GT lanes, ultimately yielding high classification scores for predictions with low IoU compared to GT lanes. Therefore, the cost function formulation plays a crucial role in mitigating these challenges, ensuring that classification scores accurately reflect both confidence and geometric accuracy and improving the reliability of lane predictions. Increasing the accuracy of sample selection could lead to better detection results. However, formulating an efficient classical cost function presents inherent challenges due to the limitations of classic approaches. Deep neural networks, on the other hand, offer a distinct advantage due to their high dimension and their ability to adapt and generalize, and may be capable of addressing the complexity of label assignment tasks.
We introduce a novel approach named MatchNet, a tiny neural network with the ability to learn a more accurate label assignment process while dynamically determining the number of predictions assigned to each GT. MatchNet has been incorporated into the state-of-the-art lane detection network, Cross Layer Refinement Network for Lane Detection (CLRNet) [13]. In this integration, MatchNet replaces the conventional classic label assignment process with a sub-module deep neural network. We refer to the full integrated model as CLRmatchNet. Fig.1 illustrates the results of our improved approach compared to CLRNet. Clearly, our method has a significant influence on the final lane detection, outperforming the initial CLRNet’s results.
Our main contributions can be summarized as follows:
-
•
Deep learning-based label assignment: Our work introduces an approach that aims to enhance models’ performance by utilizing a deep-learning-based label assignment model to overcome the limitations of classical cost functions.
-
•
Enhanced performance of curved lanes: Our novel matching network significantly enhances the detection capability of curved lanes, maintaining comparable performance across other testing categories.
-
•
Enhance confidence values of the true positive lane: During the evaluation, predicted lanes with scores that exceed a predefined threshold are considered as valid for F1 score calculation. Our lane matching network leads to a significant enhancement in the confidence levels of detected lanes. This advancement empowers us to raise the confidence score threshold used in the evaluation.
-
•
Dynamic lane matching flexibility: Originally, the number of matches per GT is limited and dynamically adjusted according to the scenario. Our approach allows dynamic selection of the maximum matches per GT based on the scores given by MatchNet where only those matches that exceed a predefined confidence threshold are considered positive matches.
2 Related Work
The task of lane detection presents inherent challenges arising from a wide range of lane configurations, driving scenarios, and environmental variables. Conventional methods for object detection are not suitable for lane detection since lanes are thin and elongated, requiring the application of adapted methodologies. Consequently, researchers have developed specific approaches to the task of lane detection.
A significant milestone in lane detection was achieved with Line-CNN [6], which adapted the conventional bounding box to the line shape and introduced a predefined set of line proposals as anchors. In order to predict traffic lines as a whole, they proposed a network that consists of two successive parts - an initial backbone followed by Line Proposal Unit (LPU). Then, each of the predictions was assigned a positive/negative label based on a cost function that consists of the average absolute value of the differences in their common indices of sampled rows and utilizes a fixed threshold to divide the positives and negatives. LaneATT [5] integrated a lightweight CNN backbone together with an anchor-based attention mechanism and expanded the label assignment cost function to include classification scores. CondLaneNet [9] presents a novel approach of conditional lane detection. This strategy relies on conditional convolution and a row anchor-based formulation. Specifically, it initially identifies the starting points of lane lines before proceeding with row anchor-based lane detection. CLRNet [13] introduced a novel network architecture that leverages both low-level and high-level features and proposed the Line IoU metric to better regress lines. They adopted the SimOTA method, as proposed by YOLOX [1], where for each GT lane, the k top predictions with the lowest cost were chosen as positive samples and the other predictions were labeled as negative samples. The detector dynamically selected the maximum number k of positive matches for each GT based on the LineIoU metric. Additionally, they reformulated the cost function between prediction and GT as follows:
| (2) |
Where is the regression cost of all valid lane points between GT and prediction . is the difference in the mean angle, is the regression cost of the starting point coordinates and is the focal cost [7]. and are the weight parameters for the geometric and classification, respectively, and were set likely as a result of a simple heuristic approach. CLRerNet [3] introduced a novel definition of IoU called LaneIoU, which takes into account local angles, with the goal of providing a more accurate representation of the IoU metric when calculating the overlap of the segmentation mask during the testing phase. They reformulated the cost function by substituting the geometric attributes originally used in CLRNet with the LaneIoU loss as follows:
| (2) |
Where is a weighting parameter.
While adapting the parameters to better define the lane correlation for the cost function is important, an equally crucial aspect is the establishment of relationships between these parameters when defining the cost function. We propose a deep-learning-based label assignment method that employs the same cost parameters (2) utilized by CLRNet and seeks to acquire an optimal label-assignment method.
3 Methods
3.1 Motivation
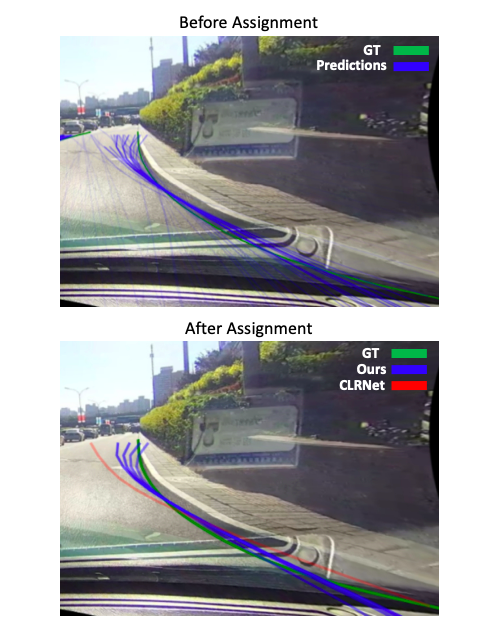
Fig.2 illustrates the results of the assignment process for a curved lane of both CLRNet and our approach, MatchNet. The color intensity of the predictions corresponds to their confidence scores. The upper figure shows all predictions of CLRNet in blue before the label assignment process, together with the GTs, in green. The lower figure presents the assignment results of the two approaches: lanes identified as positives by CLRNet’s label assignment method are shown in red, whereas those identified as positives by MatchNet (our approach) are shown in blue. GT lanes are colored green. Noticeably, the prediction assigned as positive by CLRNet’s assignment method (red) has both a low-confidence score and a sub-optimal geometric alignment. In contrast, our method excels in identifying a superior match for this GT, with a higher-confidence score and better geometric alignment. This example highlights that the conventional label assignment technique initially employed does not consistently produce the optimal matches that we aim for the network to learn from. Therefore, instead of attempting to formulate a cost function in advance, we propose MatchNet, a deep neural network trained to learn the most relevant cost function tailored to the task.
3.2 CLRmatchNet
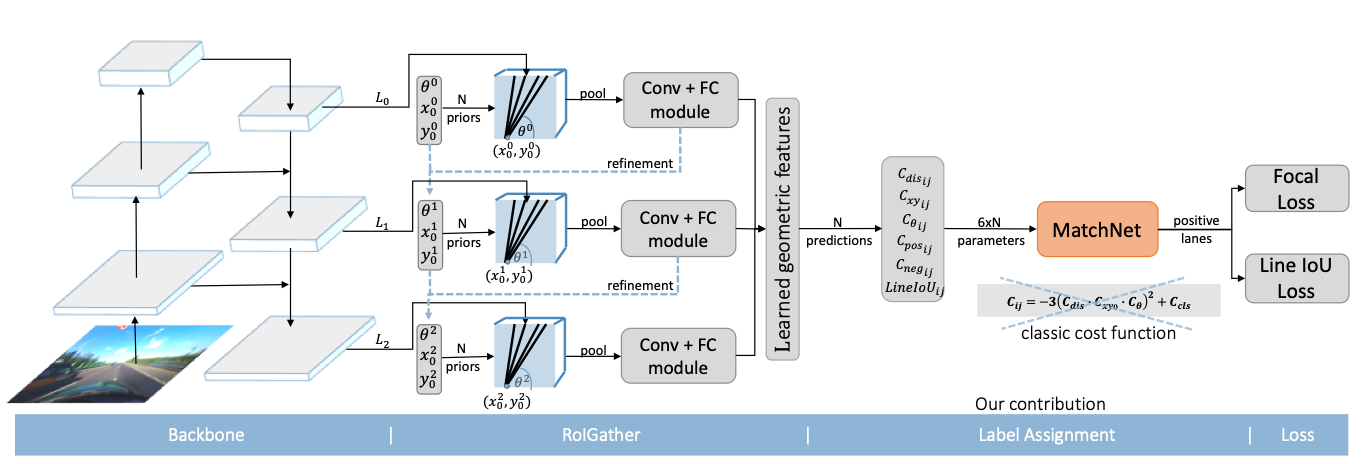
We adopted the state-of-the-art CLRNet as the baseline of our model due to its superior performance compared to alternative methods. To enhance its capabilities, we incorporated MatchNet to replace CLRNet’s original classic label assignment method. The architectural framework of the network is presented in Fig.3. CLRNet components are colored gray, while our network, MatchNet, is colored pink. The model utilizes ResNet[2] or DLA[12] as a backbone, generating three levels of feature maps using the feature pyramid network (FPN[8]). Each level of the feature map is then pooled by lane priors, defined by , where and indicate the starting point of the line, and represents the line’s angle. For the deepest layer , these priors are uniformly distributed and for the two followed layers () they are refined and learned. The refined lane priors and the feature maps are the input to the ROIGather module, where each feature map is pooled by its lane priors set to produce a lane feature maps. Followed by convolutions and fully connected model, the ROIGather outputs lane predictions. A lane prediction consists of learned geometric features, including foreground and background probabilities, the length of lane prior, the start point of the lane prior, the angle between the x-axis of the lane prior, and offsets, that is, the horizontal distance between the prediction and its lane prior. For more details, refer to [13]. As a pre-processing step, we trained MatchNet to determine the optimal score for each prediction-GT pair and classify them as positive or negative matches based on predefined parameters that describe their correlation. During the training phase, we use the pretrained sub-module of MatchNet to assign the lane predictions to the GTs. MatchNet assigns a score to each candidate pair, resulting in distinct and well-separated scores. For each GT, the network effectively selects the appropriate number of pairs, allowing for a more precise and efficient lane detection process. This dynamic selection method leverages the discriminating power of MatchNet’s scoring system and optimizes the match pairing for enhanced performance. Then, the positive matches are fed into the overall loss function used during training that is composed of several components:
| (3) |
Where is smooth-L1 loss to regress the anchor parameters and the length , is the focal loss [11] considering both positive lanes and negative lanes, is an auxiliary cross-entropy loss for per-pixel segmentation mask, and is the LineIoU loss.
3.3 MatchNet
Architecture.
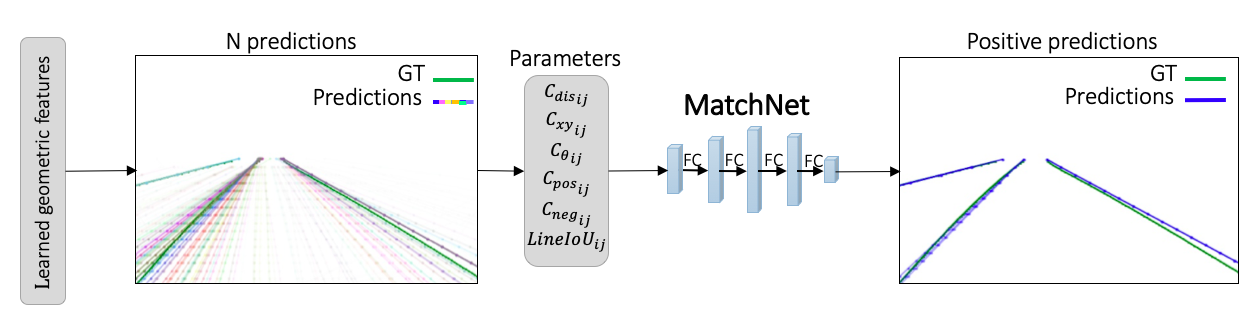
Fig.4 presents the architecture of MatchNet. MatchNet is an encoder-decoder model, where each of the stages consists of two fully connected (FC) layers, followed by a leaky ReLU activation function. The last fully connected layer is followed by a sigmoid activation function. MatchNet outputs probabilities for each GT-prediction pair, indicating whether they can be matched or not. The binary cross-entropy loss is adopted for the training process.
Training Method.
To train MatchNet, a teacher-student approach is adopted, where CLRNet acts as the teacher model and MatchNet acts as the student model. This configuration is shown in Fig.5, divided into two parallel components: the teacher (CLRNet) shown in green blocks and, at the bottom, the student (MatchNet) represented in blue blocks. The teacher, CLRNet, is tuned for 3 additional epochs while generating both the input data and the target information to the student, MatchNet. In this setup, MatchNet learns the decision-making process of the teacher, benefiting from the strengths of the classical cost function while incorporating the knowledge acquired from CLRNet.
Inputs.
The input of MatchNet consists of the same geometrical and classification parameters used in the classic cost function (2) and the Line IoU metric. These parameters are computed for each GT-prediction match candidate. All parameters are normalized to a range between 0 and 1. Additionally, any distances exceeding the size of the image (for x and y distances) or angles greater than 180 degrees (for ) are clamped to prevent extreme values from negatively affecting the performance of the model.

Targets.
To train MatchNet, we need to label pairs of detected lanes and GT lanes as positive and negative. This process includes two steps. First, we use the classical cost function 2 to determine if a match is plausible. Then, we further validate the match by considering the loss produced by CLRNet as valuable feedback for the pair match. In other words, a pair of GT prediction is considered as a match only when two conditions are met: 1) the classical cost function, 2, indicates a positive match between the prediction and the GT lane. 2) The loss function calculated by CLRNet for that specific pair should be lower than a predefined threshold . Only when both conditions are satisfied. the match considered valid and marked as a positive match in the GT data for MatchNet.
| (6) |
Where is the focal loss, is the focal loss and is a balancing parameter between the losses.
Dynamic k selection.
CLRNet incorporates the SimOTA [1] assigner to dynamically select the number of prediction matches for each GT, denoted as . The value of is determined by summing the LineIoUs of positive anchors and clipping the sum between 1 and . Our approach introduces a dynamic selection mechanism for based on the scores assigned by MatchNet. Only those matches that exceed a predefined confidence threshold are classified as positive matches. This innovative strategy ensures that the matching process is not solely dictated by the LineIoU metric, but is also influenced by the quality of each detected lane.
3.4 Curves Subset
CLRNet exhibited sub-optimal performance in scenarios involving curved lanes, a specific category within the test dataset. Aware of the need for improvement, we devised a strategy to improve lane detection, especially in these challenging conditions. We filtered a specific training dataset consisting of 8,677 images that exclusively feature curved lanes and we trained both MatchNet and CLRmatchNet on this subset. First, MatchNet was trained using this sub-dataset, and subsequently, we fine-tuned CLRNet’s results using the pre-trained MatchNet on the same sub-dataset. This approach allowed us to leverage the knowledge learned by MatchNet to further refine CLRNet’s performance in the curve section.
Method Backbone mF1 Normal Crowd Dazzle Shadow Noline Arrow Curve Cross Night GFLOPs FPS LaneATT [5] Res34 49.57 76.68 54.34 92.14 75.03 66.47 78.15 49.39 88.38 67.72 1330 70.72 18.0 170 CondLane[9] Res34 53.11 78.74 59.39 93.38 77.14 71.17 79.93 51.85 89.89 73.88 1387 73.92 19.6 237 CLRNet[13] Res34 55.14 79.73 62.11 93.49 78.06 74.57 79.92 54.01 90.59 72.77 1216 75.02 21.5 204 CLRmatchNet (ours) Res34 55.22 79.60 62.10 93.49 78.52 74.56 79.62 54.23 90.55 75.57 1898 75.03 21.5 204
Method Backbone mF1 Normal Crowd Dazzle Shadow Noline Arrow Curve Cross Night GFLOPs FPS CondLane[9] Res101 54.83 79.48 61.23 93.47 77.44 70.93 80.91 54.13 90.16 75.21 1201 74.80 44.8 97 CLRNet[13] Res101 55.55 80.13 62.96 93.85 78.78 72.49 82.33 54.50 89.79 75.57 1262 75.51 42.9 94 CLRmatchNet (ours) Res101 55.69 80.00 63.07 93.82 79.04 71.55 82.38 55.03 89.90 77.87 1610 74.84 42.9 94
Method Backbone mF1 Normal Crowd Dazzle Shadow Noline Arrow Curve Cross Night GFLOPs FPS CLRNet[13] DLA34 55.64 80.47 62.78 93.73 79.59 75.30 82.51 54.58 90.62 74.13 1155 75.37 18.4 185 CLRmatchNet (ours) DLA34 55.14 79.97 62.10 93.74 79.50 73.57 82.27 54.61 90.96 77.09 2064 75.19 18.4 185

4 Experiments
4.1 Datasets
In our experiments, we conducted research using the CULane dataset [11], a widely used benchmark for lane detection. This dataset contains 100,000 images, divided into three subsets: training set, validation set, and test set. All images are formatted to have dimensions of 1640x590 pixels. The test set is categorized into 9 groups, with 8 of them considered challenging cases such as challenging curved lanes and difficult lighting conditions such as shadows and night frames.
4.2 Implementation Details
CLRmatchNet.
Our implementation details are entirely identical to the baseline CLRNet [13]. The adopted approach utilizes pre-trained ResNet [2] or DLA [12] as backbone architectures. The input images were resized to dimensions of 320 × 800. The optimization process incorporates the AdamW [4] optimizer and a cosine learning rate decay [10]. Our training consists of 15 initial epochs identical to the original CLRNet setup. Following this, we incorporate the pre-trained MatchNet for an additional 5 epochs to refine the label assignment. We adopt a threshold of 0.7 for MatchNet’s output score during training, categorizing pairs with scores that surpass this threshold as positive and those that below it as negative. It is worth noting that MatchNet is a tiny neural network and had minimal impact on the overall training time.
MatchNet.
The selection of inputs plays an important role in ensuring a well-balanced dataset for effective and unbiased training. During the training of MatchNet, CLRNet generates predictions and their associated parameters relative to the GT. We select all matches classified as positive by CLRNet’s classical label assignment method from the first image in each batch of teacher training. To achieve a balanced dataset, additional random negative lane matches are chosen to complete the set to a total of 18 positives and negatives. We used a threshold of for the loss feedback. The network was trained for 3 epochs based on a teacher-student mechanism. The model was implemented using PyTorch and all experiments were executed on 2 GPUs. The optimization process incorporates the AdamW optimizer, with a cosine decay learning rate strategy.
4.3 Evaluation Metric
For performance evaluation metric, we use the F1 score [11]. We computed the Intersection over Union (IoU) matrix for each prediction-GT pair, using segmentation masks with a width of 30 pixels. First, we filter the predictions whose confidence scores exceed a predefined threshold, then prediction-GT pairs with segmentation IoU values greater than the threshold are referred to as true positives (), whereas unmatched predictions and GTs are referred to as false positives () and false negatives (), respectively. For the IoU calculation, we consider two distinct values: 0.5 and 0.75. The F1 score is then computed as follows:
| (4) |
5 Results
5.1 CULane Benchmark Results
We present our approach results on the CULane lane detection benchmark dataset and conduct a comparative analysis with other well-established lane detection techniques. Table 1 summarizes our findings, showing that our proposed method (CLRmatchNet) has achieved a significant improvement in the curve section of the CULane dataset, resulting in F150 scores 75.57% for ResNet34 (+2.8%), 77.87% for ResNet101 (+2.3%) and 77.09% for DLA34 (+2.96%). Furthermore, our approach demonstrates enhanced performance in the ’crowded’ section for ResNet34 (+0.46%) and the ’no-line’ section (+0.53%) for ResNet101, while maintaining comparable results for other sections. We show the qualitative results of our method on the CULane dataset in comparison to CLRNet in Fig.6, for the following scenarios: night, shadow, and crowd (from top to bottom). It is important to mention that in this dataset, in our experiments, the results for the night, cross, and dazzle conditions had an impact on the overall performance. However, we believe that this impact might be due to the quality of the GT in these scenes. Basically, MatchNet should not behave differently in these scenarios, and we assume that these scenes will also be improved.
5.2 Boosting Confidence
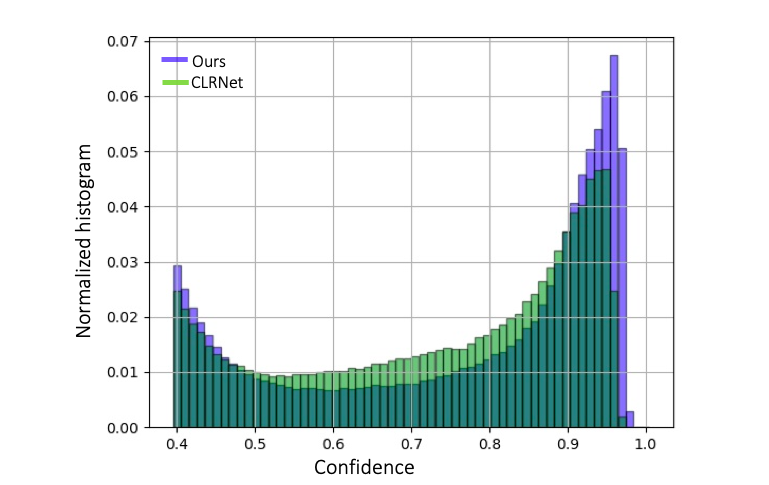
On evaluation, only lane detections that surpass a predefined threshold of confidence are classified as valid detections, forming the basis for calculating the F1 score (Equation 4). Employing MatchNet as the assignment method has yielded a remarkable improvement in detection confidence levels. Fig.7 illustrates the improvements in detection confidence scores, denoted as , with each lane’s confidence boost indicated as ”+x%.” This visualization indicates a significant increase in confidence for all detected lanes. In addition, a red dashed line indicates a decrease in the confidence level of lanes falsely detected by CLRNet. Fig.8 presents the confidence scores normalized histograms for both CLRNet (green) and our proposed CLRmatchNet method (purple). Our model exhibits increased confidence in lane detections compared to the original distribution. Additionally, our model’s confidence scores follow a more parabolic distribution, in contrast to the original distribution, which was notably more uniform. This change in confidence scores implies that our CLRmatchNet has a stronger grasp on accurate lane detection. This boost in confidence scores has enabled us to elevate the confidence threshold during evaluation, thereby ensuring a more reliable and accurate evaluation of our model’s performance.

5.3 Ablation Study
Table 2 presents the results of fine-tuning the CLRNet model weights on ResNet101 for an additional 5 epochs, incorporating both the curve sub-dataset and MatchNet as label assignment method for improving the performance on the curve section. As can be seen, the results on the curve section of CLRNet initially yielded a 75.57% score. Subsequent fine-tuning on the curve dataset over 5 epochs failed to produce any improvement and actually resulted in a lower accuracy of 75.15%. However, when we refined the model by fine-tuning it with both the curve dataset and a pre-trained MatchNet as the label assignment model, we managed to increase the accuracy by 2.3% to 77.87%.
| CLRNet | curved dataset | MatchNet | ||
|---|---|---|---|---|
| ✓ | - | - | 75.57 | |
| ✓ | ✓ | - | 75.15 | |
| ✓ | ✓ | ✓ | 77.87 |
6 Discussion
Inaccurate GT annotations.
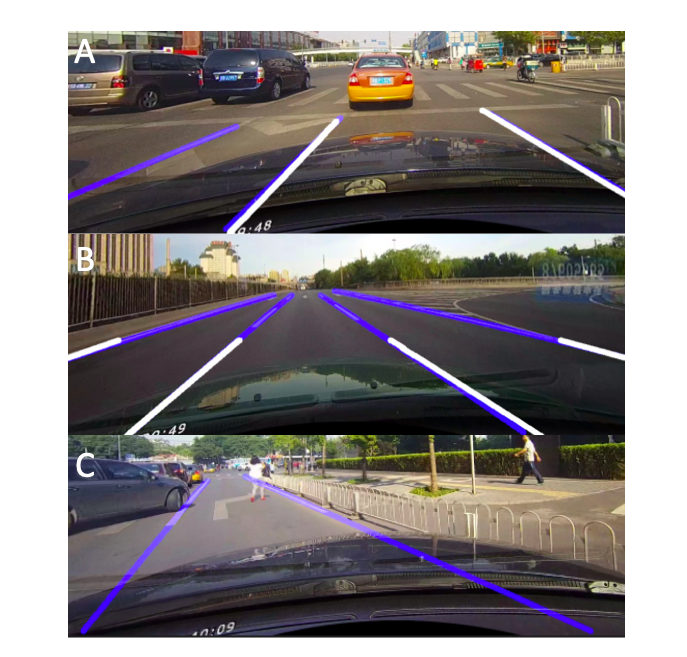
Although CLRmatchNet significantly improves the results for the curve section, it negatively affects the results of several sections and not improving the overall performance. Our method detects much more TP lanes and lowers the FN rate across all sections compared to CLRNet results with the initial confidence threshold for the test. However, we are experiencing more FP detections, especially in the cross section. It is noteworthy that the dataset we used might not have been labeled optimally. Our method has shown the ability to identify lanes not originally labeled as GT. Fig.9 illustrates three scenarios where our model successfully detected true lanes that were not marked as GT, resulting in them being marked as FP. Our model’s detections are highlighted in blue and the GT lanes are highlighted in white. In the upper frame, the left-most lane is clearly a real lane, and our network detects it as one, however it was not marked as a GT. In the middle frame, the GTs are very short but the actual lanes are much longer. Our network accurately identifies the entire lane length. In the lower frame, non of the lanes were marked as GTs. In all these cases, the network excels in detecting the real lanes; however, due to discrepancies in GT and network predictions, these instances are classified as FP which significantly influences the final F1 score.
MatchNet convergence.
During the training of MatchNet, we observed instances where the convergence exhibited fluctuations in the loss function for certain training examples. However, it is important to emphasize that despite these fluctuations, the overall loss in the training process improved as intended. This may be the result of qualitative labeling of the data, as the labels were not assigned manually, but rather through an automated process. This automated labeling approach might introduce some variability into the training process, leading to occasional fluctuations in the loss. Nevertheless, our training strategy effectively improved CLRNet’s performance, resulting in improved lane detection results in the curves section.
Comparative analysis.
It is worth noting that CLRerNet[3] demonstrates enhanced results compared to both CLRNet and our model (CLRmatchNet). However, their approach relies on classical methods, whereas our approach is based on deep learning model. We used CLRNet as our baseline model, therefore, we compared our results to the performance of CLRNet.
7 Conclusion
While the use of classical cost functions is a well-established practice, we propose an innovative deep-learning based label assignment method to enhance the performance of existing models and learn a more accurate cost function. We have illustrated that further improvements can be achieved through careful fine-tuning, particularly by refining the label assignment process during the latest stages of model training. By doing so, we significantly improved results in the curve section and managed to maintain or even enhance performance in other sections. Beyond lane detection, our approach has the potential to enhance the results of various detection algorithms that rely on classical cost functions.
References
- [1] Z. Ge, S. Liu, F. Wang, Z. Li, and J. Sun. Yolox: Exceeding yolo series in 2021. arXiv preprint arXiv:2107.08430, 2021.
- [2] K. He, X. Zhang, S. Ren, and J. Sun. Deep residual learning for image recognition. In Proceedings of the IEEE Conference on Computer Vision and Pattern Recognition (CVPR), June 2016.
- [3] H. Honda and Y. Uchida. Clrernet: Improving confidence of lane detection with laneiou. arXiv preprint arXiv:2305.08366, 2023.
- [4] D. P. Kingma and J. Ba. Adam: A method for stochastic optimization. In ICLR, 2015.
- [5] Y. Ko, Y. Lee, S. Azam, F. Munir, M. Jeon, and W. Pedrycz. Key points estimation and point instance segmentation approach for lane detection. IEEE Transactions on Intelligent Transportation Systems, 23(7):8949–8958, 2022.
- [6] X. Li, J. Li, X. Hu, and J. Yang. Line-cnn: End-to-end traffic line detection with line proposal unit. IEEE Transactions on Intelligent Transportation Systems, 21(1):248–258, 2019.
- [7] T. Lin, P. Goyal, R. B. Girshick, K. He, and P. Dollár. Focal loss for dense object detection. CoRR, abs/1708.02002, 2017.
- [8] T.-Y. Lin, P. Dollár, R. Girshick, K. He, B. Hariharan, and S. Belongie. Feature pyramid networks for object detection. In 2017 IEEE Conference on Computer Vision and Pattern Recognition (CVPR), pages 936–944, 2017.
- [9] L. Liu, X. Chen, S. Zhu, and P. Tan. Condlanenet: A top-to-down lane detection framework based on conditional convolution. In Proceedings of the IEEE/CVF International Conference on Computer Vision (ICCV), pages 3773–3782, October 2021.
- [10] I. Loshchilov and F. Hutter. Decoupled weight decay regularization. In International Conference on Learning Representations, 2019.
- [11] X. Pan, J. Shi, P. Luo, X. Wang, and X. Tang. Spatial as deep: Spatial cnn for traffic scene understanding. In AAAI, February 2018.
- [12] F. Yu, D. Wang, E. Shelhamer, and T. Darrell. Deep layer aggregation. In Proceedings of the IEEE Conference on Computer Vision and Pattern Recognition (CVPR), June 2018.
- [13] T. Zheng, Y. Huang, Y. Liu, W. Tang, Z. Yang, D. Cai, and X. He. Clrnet: Cross layer refinement network for lane detection. In Proceedings of the IEEE/CVF Conference on Computer Vision and Pattern Recognition (CVPR), pages 898–907, June 2022.