The Shortest Route Is Not Always the Fastest:Probability-Modeled Stereoscopic Eye Movement Completion Time in VR
Abstract.
Speed and consistency of target-shifting play a crucial role in human ability to perform complex tasks. Shifting our gaze between objects of interest quickly and consistently requires changes both in depth and direction. Gaze changes in depth are driven by slow, inconsistent vergence movements which rotate the eyes in opposite directions, while changes in direction are driven by ballistic, consistent movements called saccades, which rotate the eyes in the same direction. In the natural world, most of our eye movements are a combination of both types. While scientific consensus on the nature of saccades exists, vergence and combined movements remain less understood and agreed upon.
We eschew the lack of scientific consensus in favor of proposing an operationalized computational model which predicts the completion time of any type of gaze movement during target-shifting in 3D. To this end, we conduct a psychophysical study in a stereo VR environment to collect more than 12,000 gaze movement trials, analyze the temporal distribution of the observed gaze movements, and fit a probabilistic model to the data. We perform a series of objective measurements and user studies to validate the model. The results demonstrate its predictive accuracy, generalization, as well as applications for optimizing visual performance by altering content placement. Lastly, we leverage the model to measure differences in human target-changing time relative to the natural world, as well as suggest scene-aware projection depth. By incorporating the complexities and randomness of human oculomotor control, we hope this research will support new behavior-aware metrics for VR/AR display design, interface layout, and gaze-contingent rendering.
1. Introduction
Gaze movement patterns are dictated by the strengths and limitations of the visual system. Visual acuity is much higher in the central region of the retina, encouraging observers to first shift their gaze to bring targets of interest into the fovea prior to analyzing any details. Furthermore, the binocular nature of human vision dictates that both left and right eyes must move in coordination to focus at the same location. Consequently, several distinct classes of eye movement patterns have evolved in humans to fulfill various roles and are used in different situations. Due to the underlying neurological and mechanical limitations of eye movements, each one exhibits distinct performance characteristics; some are slow and steady, while others are ballistic and jerky. The combination of all classes of movements forms an efficient and comprehensive overall gaze behavior strategy in 3D visual environments.
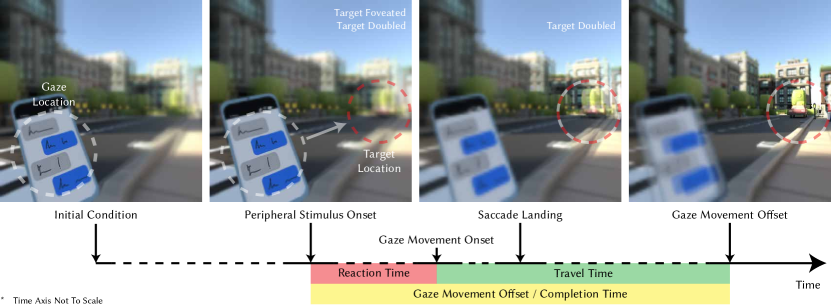
The speed of these movements are critical in complex tasks such as driving, where we rapidly move our eyes to acquire a plethora of information from the surroundings such as the presence of pedestrians, the approaching of vehicles, the speedometer reading, and even GPS navigation instructions. In those tasks, there is always a delay between the decision to acquire a visual target, and our two eyes successfully landing on it. We ask “how long is this delay and how does it depend on the displacement of our gaze location?”. With the emerging adoption of virtual/augmented reality (VR/AR), answering this question enables us to design 3D content that allows for an efficient target changing.
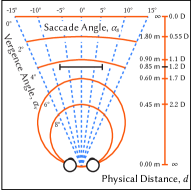
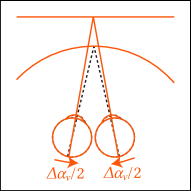
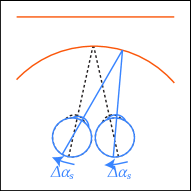
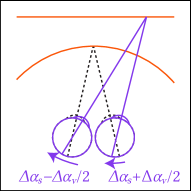
Illustration of various eye movements.
Prior vision science studies suggest that gaze shifts move along two primary axes (Figure 2a): one in direction and the other in depth (Zee et al., 1992). Highly rapid and consistent eye motions that quickly shift to a peripheral location, called saccades, are crucial for fast reaction to targets in different directions. In contrast, eye movements that shift the gaze in depth by rotating each eye in opposing directions, called vergence movements, are relatively slower and more inconsistent. Often, both of these movements are executed concurrently, and the performance of such combined movements exhibit a different time signature which is faster than pure vergence movements, but slower than pure saccades (Zee et al., 1992; Bucci et al., 2006; Lang et al., 2014; Yang and Kapoula, 2004). While vision science literature has extensively studied saccadic movements and provided comprehensive models for its temporal characteristics (i.e., the main sequence (Bahill et al., 1975b; van Beers, 2008)), the nature of vergence and combined movements exhibit confounding theories (Chen et al., 2010; Cullen and Van Horn, 2011; King, 2011).
As an alternative, we present the first operational model that predicts the required eye movement completion time necessary for shifting the gaze to new 3D targets in stereoscopic virtual environments. We recognize the current lack of first-principle consensus on how vergence/combined eye movements are neurologically constructed. Additionally, we note that noise in both human behavior and eye-tracking adds difficulty to comprehensive study of complex stereoscopic movements with downstream applications. Circumventing these obstacles, we take a holistic approach to (1) focus on when both eyes land on a target after its onset, instead of the intermediate trajectory; and (2) form a computational model which accounts for the noise and variability to produce a probabilitic prediction, instead of a deterministic one.
We fit our model and validate its accuracy using our psychophysical study data, which includes more than individual trials to measure the temporal offsets of gaze movements in a stereo VR environment. The results evidence the model’s consistent prediction accuracy, generalizability to unseen participants and trials, as well as the capability of forecasting and optimizing task performance with various real-world VR scenarios. Our model can be applied to measure the difficulty of video games in VR and how the scale of variability in depth can alter gaze movement behaviors for users. We also explore how completion time predictions can be used as a metric for evaluating the placement of 3D UI elements in VR/AR applications. Recalling the driving example, we can improve driver awareness by placing a virtual car dashboard overlay (with speedometer readings and navigation instructions etc.) in an adaptive manner to minimize completion times of objects that appear in the driver’s periphery in changing surrounding environments.
This research aims to propose an operational model for computer graphics applications for a behavioral phenomenon that is yet to be fully understood. We believe that providing a quantitative understanding of how emerging VR/AR technology influences statistical signatures of human target-changing performance during daily tasks is beneficial even without the neurological understanding of the underlying behaviors. We hope the research can serve as a novel benchmark to guide 3D interfaces and act as a metric for the “user performance” in various applications and mediums. To this aim, we will release the source code and de-identified study data at www.github.com/NYU-ICL/stereo-latency. In summary, our main contributions include:
-
•
a series of psychophysical studies and data which systematically characterize visual performance (measured by completion/offset time) across various vergence-saccade combined eye movements in VR;
-
•
an operational model that predicts the statistical distribution of completion times;
-
•
demonstration of the model’s accuracy and effectiveness in predicting and optimizing VR users’ target-changing performance in natural scenarios;
-
•
model application to measure users’ visual performance discrepancies among various games, 2D and VR displays, as well as recommendations for depth designs for 3D user interfaces.
2. Related Work
2.1. Eye Movement, Visual Behaviors, and Performance
Human eyes are highly dynamic, consisting of various types of movements including smooth pursuit, vestibulo-ocular, saccade, and vergence movements. Saccade and vergence are the two most frequent movements to redirect gaze in 3D spaces (Lang et al., 2014). There has been extensive study of them in the context of computer graphics, displays, and interactions (Yarbus, 2013; Hadnett-Hunter et al., 2019). Unlike most traditional desktop displays, VR/AR platforms provide high field-of-view stereoscopic displays, which simultaneously unlock both saccade and vergence movements. Understanding the timing of these visual movements is essential in broad applications such as esports (Duinkharjav et al., 2022), driving (Salvucci and Liu, 2002), and healthcare (Bertram et al., 2016).
Pure saccades are rapid and conjugate eye movements that change the direction of gaze along a circle of iso-vergence (or the geometric horopter) which is computed using the centers of the two eyes and the fixation point (Figure 2d). In the scope of this work, we simplify the measurements by equalizing the optical and visual axes (cf. (Konrad et al., 2020; Krajancich et al., 2020)), leaving the study of this difference as future work. Saccades are high-speed, ballistic motions with short travel times and a probability distribution of spatial error skewing towards undershooting the target location (Lisi et al., 2019). The scan path, speed, and spatial accuracy of a saccade are all influenced by the characteristics of the visual content (Sitzmann et al., 2018; Martin et al., 2022; Duinkharjav et al., 2022; van Beers, 2007; Specht et al., 2017; Arabadzhiyska et al., 2017), and have been extensively studied and modeled (Bahill et al., 1975b; Boghen et al., 1974; van Beers, 2008). Although those features can also be influenced by visual tasks (Hu et al., 2021b, a), studies on the main sequence (Bahill et al., 1975b) show the consistency in completion time after the ocular-motor-controlled movement starts, independent of cognitive factors.
By comparison, pure vergences are both slower and disconjugate, directing the gaze to a new location in depth and thereby defining a new geometric horopter. In stereo displays that lack accommodative cues, the displacement of the images presented to the two eyes provides an essential depth cue that drives vergence eye movements. In the context of VR/AR, the conflict between the variable vergence cues provided by stereo displacement and the static accommodation cue corresponding to the display depth commonly causes discomfort, known as vergence-accommodation conflict (Julesz, 1971). The duration of pure vergence movements is influenced by travel distance, direction, and starting depth (Templin et al., 2014b). Measurement of vergence movements are also more challenging compared to saccades due to the relatively smaller amplitude of movements (Yang et al., 2002; Yang and Kapoula, 2004), inconsistent performance (Welchman et al., 2008), complex neural coding (Cullen and Van Horn, 2011; Semmlow et al., 2019; King, 2011), and a higher sensitivity to external factors such as pupil dilation (Nyström et al., 2016; Jaschinski, 2016; Feil et al., 2017).
In the real 3D world, saccade and vergence movements are more commonly combined than isolated because of the 3D distribution of visual targets (Lang et al., 2014; Kothari et al., 2020). Prior literature has demonstrated that, relative to pure vergence, these combined eye movements are accelerated by the addition of saccades (Yang and Kapoula, 2004; Coubard, 2013; Erkelens et al., 1989; Collewijn et al., 1995; Pallus et al., 2018). Competing theories attempt to untangle the neurological pathways that control vergence and combined movements, and fully explain their behaviors (Mays, 1984; Zee et al., 1992; Quinet et al., 2020). However, there is no definitive and agreed-upon theory within the literature (King, 2011; Cullen and Van Horn, 2011), as exists for saccadic movements (Bahill et al., 1975b). Therefore, despite the critical importance of combined eye movements, we still lack an analytical understanding of how different vergence-saccade combinations quantitatively influence visual performance. For instance, although adding a small saccade offset to a 3D target location may accelerate a slower vergence movement, would an extra long saccade provide even more acceleration, or would the benefits of the saccade be outweighed by additional travel time? If so, what size saccade is optimal for producing the fastest vergence movement? Our work attempts to answer these questions by quantifying the scale of this acceleration effect across different amplitudes of 3D gaze movements into a continuous domain probabilistic model for predicting gaze offset times, and side-step the need to explicitly depict the vast complexity of vergence-saccade movement behaviors.
2.2. Stereo Vision and Stereopsis-Aware Optimization
Understanding stereo vision in order to optimize computer graphics systems and user experience, especially in VR/AR environments, remains a popular research frontier (Aizenman et al., 2022; Shi et al., 2022). Most of today’s consumer VR/AR devices are incapable of supporting accommodation; therefore, stereopsis is still the primary means by which these devices improve depth perception over conventional 2D displays.
Numerous efforts have been made to optimize stereoscopic content with gaze tracking so as to enhance the perceived realism of depth in virtual environments. Examples include grain positioning (Templin et al., 2014a), as well as optimizations considering depth (Kellnhofer et al., 2016a; Templin et al., 2014b), luminance (Wolski et al., 2022), shading material (Chapiro et al., 2015), and displays (Zhong et al., 2021; Chapiro et al., 2014). With the surge of low-cost and low-power gaze-tracking, another emerging research line incorporates dynamic cues such as motion parallax (Kellnhofer et al., 2016b). Depth cues may be enhanced by incorporating these various rotation and projection centers (Konrad et al., 2020; Krajancich et al., 2020). Reduced depth acuity in peripheral vision has also been leveraged to accelerate neural rendering (Deng et al., 2022) and image reconstruction (Kaplanyan et al., 2019).
3. Measuring and Predicting Stereoscopic Eye Movement Completion Time
To quantitatively understand combined stereoscopic eye movements, we first performed a psychophysical experiment with a wide field-of-view stereo VR display. The study measured how jointly varying vergence and saccade amplitudes influence the time required for an observer’s eyes to reach a 3D target relative to stimulus onset; this duration is often referred to as the eye movement offset time. The data then serve as the foundation of our model (detailed in Section 3.4) for predicting the offset timing of various eye movements.
3.1. Experimental Design
Participants and setup
Eight participants (ages -, male) with normal or corrected-to-normal vision were recruited. Due to the demanding requirements, established low-level psychophysical research commonly starts with pilot studies involving a small number of participants and leverages the collected data to develop computational models (e.g., the foveated rendering literature (Patney et al., 2016; Sun et al., 2020; Krajancich et al., 2021, 2023)). These models, constructed using data from a limited set of subjects, can be evaluated for their cross-subject generalizability using a larger group of users, as we performed in Section 4.3 with 12 additional unseen participants. Moreover, in the context of our work, psychophysical studies examining the temporal dynamics of human behaviors require remarkably large sample sizes for a comprehensive statistical pattern to account for neural and mechanical noise (Yang and Kapoula, 2004; Collewijn et al., 1995; Erkelens et al., 1989; Bucci et al., 2006; van Beers, 2007). Considering that variations among subjects do not exhibit a significant impact on the completion rate of low-level gaze movements like saccades (Bahill et al., 1975b) and vergence movements (Collewijn et al., 1995; Erkelens et al., 1989) – as confirmed by our cross-validation analysis in Section 4.2 – and given that these are objective psychophysical behaviors not reliant on subjective reporting, we chose to enlist a small number of participants while acquiring an extensive sample size (1,500+ trials) per participant. To this aim, we split the study across multiple days for every participant (see Conditions paragraph for details).
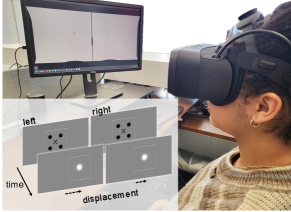
The study was conducted with a Varjo Aero head-mounted VR display (HMD) with the relevant specifications detailed in LABEL:tab:pilot:hmd. As shown in Figure 3a, throughout the study, participants wearing the HMD remained seated and performed the visual-target-changing task as detailed in the Task and Stimuli paragraph. Before the experiment, participants underwent a “preamble” checklist to ensure proper task completion and accuracy, including:
-
(1)
Measure and calibrate the HMD’s inter-pupillary distance (IPD).
-
(2)
Complete a five-point calibration for accurate binocular gaze tracking (repeat whenever the HMD is re-mounted after breaks).
-
(3)
Adjust a fixation point between the nearest and furthest depths at which experimental stimuli appeared to ensure the success of fusing the stereoscopic visual stimuli (i.e., no double-vision).
Task and stimuli
Participants’ task was to shift their gaze to land on targets appearing in 3D space. At the beginning of each trial, they were instructed to observe the fixation stimulus at the center of the screen. As illustrated in Figure 3a, this stimulus included a combination of a cross and four circular flankers to assist fixation (Thaler et al., 2013). Once successful fixation was detected, this stimulus disappeared and was immediately replaced by a target stimulus, to which participants were instructed to move their gaze to as naturally as possible with a single gaze motion. The target stimulus was a Gaussian blob with and peak luminance of — a similar design as in Lisi et al. (2019).
To ensure stable tracking, a trial only began if the participant’s eyes were within to the center of the fixation point for a consecutive . If the participant failed to hold their gaze at the fixation point for sufficient duration more than three consecutive times, the eye-tracker was re-calibrated. Additionally, to ensure correct task completion, we rejected and repeated a trial if it was completed in less than or more than . To avoid fatigue, participants were shown a darkened screen between trials as a cue to blink or close their eyes, if they: (1) successfully completed a trial, (2) failed to hold their gaze on the starting fixation point, or (3) failed a trial.
Definitions and annotations
Offset times are known to vary depending on the spatial location of the stimuli, mostly due to the varying contributions of either saccadic or vergence movements, often superimposed on each other (Zee et al., 1992). In order to study how the spatial placement of the stimuli influences what type of eye movements arise, we parameterize spatial locations using two parameters: the vergence angle, , and the saccade angle, , as illustrated in Figure 2a. All locations in the transverse plane containing the participants’ eyes, and the stimuli can be encoded using the two degrees of freedom provided by and .
Specifically, following vision science practice, we define the vergence angle as the angle formed by the intersection of the gaze rays. That is, if we denote the signed angles of the left and right eyes, with respect to the forward “” direction (i.e. the intersection between the transverse and median planes) as and , the vergence angle is equal to
| (1) |
The set of gaze locations that have the same form an isovergence circle, visualized as the orange circles in Figure 2a. Pure vergence movements maintain the direction of gaze and move the gaze point from one isovergence circle to another.
On the other hand, the saccade angle, , is defined as the mean of the angles of the left and right eyes:
| (2) |
The set of gaze locations that have the same form a ray representing the direction of gaze, visualized as the blue lines in Figure 2a. Pure saccadic movements remain on the same isovergence circle while rotating the direction of gaze across the transverse plane.
Therefore, a vergence and saccade angle pair, , uniquely defines a point on the transverse plane via the intersection of the isovergence circle which corresponds to , and the direction of gaze which corresponds to . An arbitrary gaze movement in this coordinate system can be represented as a displacement vector,
| (3) |
for movement from to .
Conditions
We define a condition by a pair . We sought to create a grid of experimental conditions which cover a wide set of possible gaze movements. Today’s VR devices limit the breadth of applicable eye movements. Here we discuss these limitations as well as the solutions we implemented to ensure study accuracy.
First, we observed that participants could not fuse a stereo stimulus when it was placed too close, causing double (yet in-focus) vision. This restricted the range of possible vergence movements we could study in VR. We believe this effect is due to the lack of support for variable accommodation in VR displays, and thus distorted depth cues due to the vergence-accomodation conflict (Hoffman et al., 2008; Aizenman et al., 2022; March et al., 2022). To establish a conservative minimum depth with successful stereo stimulus fusion, we performed a pre-study test with participants with various inter pupil distances (IPDs) (). Through this experiment, we established that this depth is approximately in front of the observer. This corresponds to a maximum vergence angle coordinate of for an observer with an IPD of — the lowest IPD supported by the HMD (see LABEL:tab:pilot:hmd). Since a larger IPD only relaxes this maximum value, we limit the maximum vergence angle to . See LABEL:sec:supp:pilot:conditions for a more in-depth analysis.
Second, we found that the accuracy of the HMD eye tracker deteriorates significantly further in the periphery for . We recognize that the majority of saccades naturally performed by humans have amplitudes (Bahill et al., 1975a), due to a preference to move the head otherwise. Therefore, we limit the maximum saccade angle to .
Lastly, due to the inconsistent nature of temporal human behavior, our study requires many repeats for each condition in order to reveal statistical trends. It is therefore infeasible to include a large number of conditions in our study. We address this by only sampling gaze movement displacements, . That is, although the initial gaze position has been shown to be a relevant factor influencing offset time (Templin et al., 2014b), we chose not to consider it in our analysis and modeling for the current study. We leave characterizing the effects of “starting pose” as future work.
To summarize, our study design is constrained to vergence angles , saccade angles , as well as to only consider gaze movement displacements, , and to ignore initial gaze positions, . Within these constraints, we sample the following conditions for vergence, saccade, and combined motions respectively:
-
•
vergence conditions with amplitudes conducted for both divergent () and convergent () movements,
-
•
saccade conditions with amplitudes conducted at near and far depths,
-
•
combined movements for every combination of the above conditions for both convergent and divergent movements,
totaling in conditions, as in Figures 3b and 3c. We treated leftward and rightward saccades as symmetric; therefore, while we randomized stimulus location to appear on the left or right side, in data processing, we remove the distinction by taking the absolute value of the saccade amplitudes. Implementation of the conditions is detailed in LABEL:sec:supp:pilot:conditions.
To account for human sensory and behavioral noise (van Beers, 2007), we repeated each condition times within one experimental block (totaling in trials per block), and instructed participants to complete a total of blocks. Each block took minutes to complete, with a minute break between blocks. The experiment was split into sessions across days to avoid fatigue, with each session scheduled at approximately the same time for consistent performance. Before each session, participants also performed a short warm-up session of trials to familiarize themselves with the task and target positions and eliminate potential variance in reaction time. Overall, each experimental condition was repeated a total of times, and the entire experiment took about hours for each participant, including intermediate breaks. Running the experiment across participants, we collected a total of trials.
Data analysis
Each experimental trial yields a time-series of eye directions recorded during the trial, sampled at . Similar to (Yang et al., 2002; Templin et al., 2014b; Yang et al., 2010), we performed post-hoc processing and analysis on the raw data to more precisely identify gaze movement offset times. To address tracker noise from high sampling frequency (van Beers, 2007), we first applied a Hz smoothing filter (Butterworth et al., 1930), similar to (Yang et al., 2010; Templin et al., 2014b).
We compute the angular velocity over time across each trial from the smoothed eye direction data and apply a constant velocity threshold to detect offset timestamps of gaze movement. Specifically, for a reliable offset time measurement, we require two conditions to be met: (1) individual speeds of the left and right eyes to be below a threshold of /sec, as well as (2) each eye to be directed within relative to the target. While some prior work suggests that vergence offset times can be detected by the angular velocity in the vergence dimension, i.e., (Yang and Kapoula, 2004), we found that our strategy is more fitting in our use case due to the additional challenges in eye tracker precision, accuracy, and frequency posed by consumer VR devices. For consistency and fairness across all conditions, we applied this detection approach for all the conditions, including vergence-only, saccade-only, and combined movement trails. A small percentage of trials () were rejected from analysis and training due to the gaze offset position falling outside the allowable range. Manual inspection of these trials indicates that the users’ eye movements only satisfied the second condition (2) above, but not the first (1). These cases could not be identified during experiment run-time due to the inability to reliably perform post-processing filters to the raw data on the fly.
3.2. Results
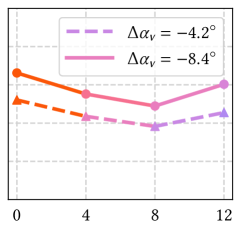

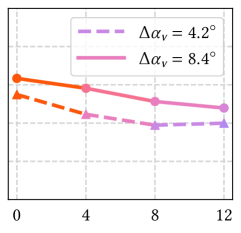
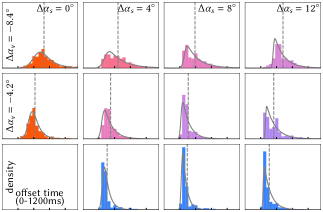
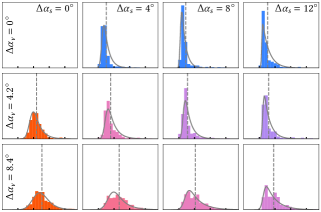
Figure 3 visualizes the raw data with the identified eye movement offset time. All time values in the statistical analysis below and throughout the paper are in seconds for clarity. Additionally, Figure 4 statistically summarizes the mean of each condition.
The offset times of saccades (, ) are lower than offset times of vergence movements (, ). The effect applies for both divergent (, ) and convergent (, ) conditions. The average offset time of combined movements () lies in between. A repeated measures analysis of variance (ANOVA) indicated that the type of eye movement (saccade/vergence/combined) had a significant effect on the offset time (). Additionally, the range (max-min) of mean offset times across saccade conditions () is significantly narrower than across vergence conditions (). The effect can be visualized by comparing the span of values on the Y-axis of Figure 4.
Larger vergence amplitudes () significantly prolong the offset time in combined movements. For example, the average landing time for is /. A repeated measures ANOVA indicated that the had a statistically significant effect on the offset time ().
For combined offset times, we did not observe a monotonic effect of saccade amplitude (). In fact, with a given vergence amplitude, the effect of saccade amplitude on the combined movement time is inconsistent and commonly non-monotonic, as visualized with the “U-shape” in Figure 4b. The average landing time for pure saccade conditions, , are //. When , however, the fastest combined movement occurs for (), compared with the other two conditions () and (). A Mann-Kendall trend test did not observe a significant monotonic trend ().
The distribution of offset times across all conditions exhibits positive skewness (). Among the conditions, skewness varied by condition with pure vergence movements is the smallest (), combined movements in the middle (), and pure saccadic movements is the highest (). This indicates that different gaze movements change the shape of the distribution of offset times, which can also be visualized from the histograms in Figure 3.
3.3. Discussion
The visualization and analysis draw us to several conclusions. First, the offset times of singular saccade movements are significantly shorter and more consistent than those of vergence movements. Second, statistical analysis of our data evidenced that slow vergence movements are “accelerated” if combined with faster saccades. Third, the acceleration effect varies depending on how they are combined. Saccade acceleration exhibits a “U-shape” for divergent combined movements (Figure 4b). The optimality (i.e., the amplitude of the saccade that accelerates vergence the most, thus the fastest combined movement) depends on the corresponding vergence amplitude. Lastly, human performance on changing 3D visual targets is inconsistent across trials, even within the same participant. Moreover, the scale of the inconsistency varies across different eye movements. These observations inspire us to develop a computational model that 1) depicts quantitatively how saccades accelerate vergence, and 2) predicts the probability distribution of target landing offset time with combined vergence-saccade movements.
3.4. Generalization to Arbitrary Gaze Movements
Statistical model
The statistical analyses in Sections 3.2 and 3.3 motivate us to develop a model for predicting the target landing offset times for arbitrary gaze movements not present within our dataset. As reported in Section 3.2, the distributions observed in our dataset are positively skewed, and vary across different conditions; so an Exponentially modified Gaussian (ExGauss), which features fine control over skewness via its parameters, is a viable choice of statistical model for these distributions (Marmolejo-Ramos et al., 2023). Specifically, offset time, , represented as an ExGauss random variable has a probability density function (PDF),
| (4) |
parameterized by , , and , to depict the location, spread, and asymmetry of the resulting distribution, respectively. All parameters are in units of seconds. Here, is the complementary error function. As shown in Figure 3, we estimate the ExGauss parameters for each condition separately via Maximum Likelihood Estimation (MLE) to collect a total of sets of parameters (not double counting the saccade conditions).
In this work, offset times are modeled as ExGauss random variables, but note that modeling with a different random variable may also be valid. We leave the analysis and comparisons among model choices as future work since the specific presentation is beyond our focus, and other parameterizations are adaptable to our framework.
Parameter interpolation
Our focus, instead, is on how the parameters of a given model should be interpolated to provide predictions of gaze offset times for arbitrary gaze movements. To this end, we leverage the ExGauss parameter estimations of each condition and smoothly interpolate each parameter via Radial Basis Function (RBF) interpolation. Concretely, each RBF takes, as input, the amplitude of the gaze movement, , to output the predicted ExGauss random variable, , with estimated parameters
| (5) |
and represent the location and weight of each of the radial bases, is the radial function, and is a tuning shape parameter for the radial function. In our implementation, we used the Gaussian kernel, . Overall, the learnable parameters in this regression are , , and for , totalling in variables for each ExGauss parameter .
Regression
We optimize the adjustable variables via gradient descent to minimize the mean-squared error between the MLE-estimated ExGauss parameters for each condition, and the RBF-interpolated parameters, with the loss
| (6) |
The RBF parameters are regressed using batch gradient descent with the loss functions from Equation 6 and a learning rate of for iterations. The mean-squared losses are minimized from to over the course of each regression, respectively. We report model performance metrics as well as additional evaluations in Section 4.
Discussion and applications
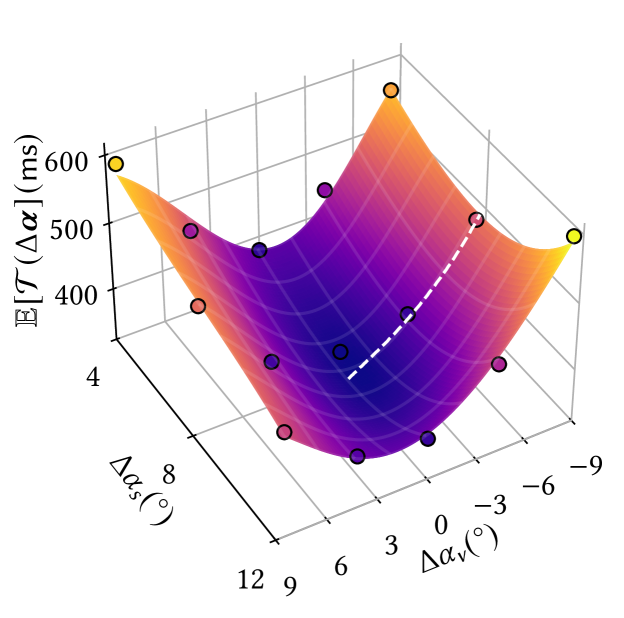
We compare the mean offset times predicted by our model to the means aggregated from our dataset in Figure 5. This visualization demonstrates how the offset times differ between convergent and divergent gaze movements. For convergent combined movement, we observe the same monotonic decrease in offset time as a function of saccade amplitude as reported in Figure 4c. Additionally, we see the U-shaped behavior for divergent combined movements, as discussed in Sections 3.3 and 4b.
The ExGauss distribution and RBF interpolation methods are represented by parameterized differentiable functions. This allows us to compose these components to construct an end-to-end differentiable model for predicting the probability distribution of arbitrary gaze movements. This formulation can be leveraged in various ways for practical applications. For example, the “optimal” saccade amplitude, , which minimizes the offset time at various vergence amplitudes, can be computed analytically:
| (7) |
These local minima indicate the location of the lowest point in the valley of the U-shaped behavior, as visualized in Figure 5.
4. Evaluation
We first measure the statistical accuracy and necessity of the vergence-saccade combined modeling with an ablation study in Section 4.1. We further test the model’s goodness-of-fit when generalizing to unseen users and trials in Section 4.2. Then, to evaluate its applicability in real-world scenarios and novel conditions, we perform an evaluation user study with various scenes in Section 4.3.
4.1. Model Accuracy and Ablation Study
Metrics
We utilize the Kullback–Leibler divergence (KLdiv) as a continuous domain metric for measuring the similarity between model-predicted probability densities and the histograms obtained from the psychophysical data. A model with lower KLdiv relative to a ground truth histogram indicates a better prediction.
| Condition | |||
|---|---|---|---|
| KL Divergence |
Conditions
We conduct an ablation study and utilize the KLdiv to validate the necessity of modeling combined movements. Specifically, we consider the model’s prediction accuracy if not supplying it with information on either saccade or vergence movement. For this purpose, we re-aggregate our psychophysical data into groups separated only by saccade amplitude (), or only by vergence amplitude () conditions. That is, we pool together the histograms in Figures 3 and 3 across the columns, or rows respectively. The re-aggregation is then utilized to regenerate an ablated model following the same steps as described in Section 3.4. See LABEL:sec:supp:ablation for visualizations of the ablated model predictions.
While the probability distribution predicted by our model is continuous, the psychophysical study dataset only provides a finite sample of the theoretical ground truth distribution of offset times. Therefore, we apply the discrete version of KLdiv onto histograms of the ground truth data for each condition with bins ().
Results and discussion.
The resulting average KLdivs for the two ablated models are compared to the full model () in Table 1. We observe that the model exhibits significantly lower KLdiv than and . While the number of bins does have an effect on the divergence values, we extensively tested and confirmed that the relative relationship across the three conditions was not influenced by this factor. These results demonstrate that combined eye movements exhibit remarkably distinct temporal patterns that depend both on saccade and vergence movement amplitudes, agreeing with our observations in Section 3.3. Quantitatively, the combined model predicts participants’ behaviors significantly more accurately, and thus proves the necessity and effectiveness of considering amplitudes of both components of movement.
4.2. Model Generalizability
We further evaluate generalized goodness-of-fit with unseen data partitions. We create segments of the psychophysical data from Section 3 into training-testing groups along multiple axes.
Metrics
Similar to prior art on stochastic visual behaviors (Duinkharjav et al., 2022; Le Meur et al., 2017), we utilize the Kolmogorov-Smirnov (K.S.) goodness-of-fit test (Massey Jr, 1951) between the test set and the corresponding model prediction, using ten quantiles for the offset time. Significance () in the K.S. test indicates a rejection of the null hypothesis that two samples are drawn from the same distribution; failing to reject () supports distributional matching. The value in K.S. measures the maximum distance.
Conditions
We first assess the model’s statistical goodness of fit for the full set of psychophysical data from Section 3. Then we analyze the model’s generalizability based on its capability to successfully fit the statistical distribution with unseen trials or subjects. To this end, the collected dataset is split into two fully separated training and testing sets without overlap. The training set is leveraged to re-train a new model as in Section 3.4, which tests the fitness on the corresponding unseen test set. We experiment with two methods of partitions: (1) reserve each one of the eight participants’ data as the test set (annotated as ; (2) uniformly randomly sample 1/8 of the entire data for each condition but across all users (annotated as ). For both methods, the remaining data is used as the corresponding training set.
Results and discussion
| D | p | |
|---|---|---|
| .1 | 1 | |
| .1 | 1 | |
| .2 | .99 | |
| .2 | .99 | |
| .1 | 1 | |
| .1 | 1 | |
| .1 | 1 | |
| .1 | 1 | |
| .1 | 1 |
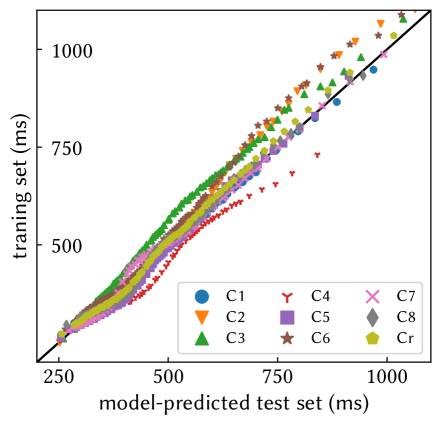
Figure 6a shows the results for the goodness-of-fit across all conditions. Additionally in Figure 6b, we provide a quantile-quantile (Q-Q) visualization between the training set and the model prediction on the test set: samples closer to the diagonal line indicate better distribution agreement. As a baseline reference, the K.S. test between the model and all collected data shows . For all experimented partitioning conditions, the K.S. tests exhibit , failing to reject the null hypothesis that the model prediction acquired from the training set and the unseen test data are drawn from the same distribution. The goodness-of-fit analyses above reveal that our probabilistic model can be generalized to unseen users and trials, implying that it can predict user behavior without observing it in advance.
4.3. Study: Predicting and Optimizing Visual Performance
Beyond measuring the performance of the model on data from the controlled experiment (Section 3), we further design and conduct a second study with more complex stimuli. We aim to gauge the model’s capability to predict and optimize visual performance with realistic VR/AR scenarios, novel conditions, and unseen participants.
Participants and setup
We recruited participants (ages , female). To validate the generalizability of the model, we ensured no overlap of participants with the study from Section 3. All participants reported having normal or correct-to-normal vision. We utilized the same hardware and “preamble” checklist as in Section 3.1.
Scenes and stimuli
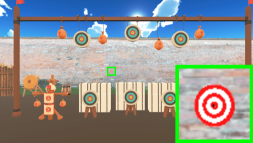
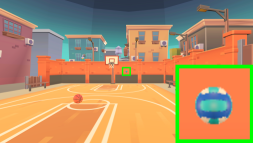
To validate how our model performs for varied scenarios and content, we designed distinct environments: (1) a rendered archery range with a 2D bullseye stimulus (Figure 7a), (2) a rendered basketball court with a 3D ball stimulus (Figure 7b), and (3) a photographic natural outdoor scene with a virtual bird stimulus to simulate pass-through augmented reality (AR) scenarios (Figure 7c).
Tasks
We instructed participants to complete a target-changing task similar to Section 3.1. During each trial, participants were first instructed to fixate on a cross at the center of the screen. After successfully fixating for , the cross was immediately replaced by one of the three scenes, containing the corresponding target at a new location. The participant then made an eye movement to direct their gaze at the target stimulus. To reduce the influence of progressive learning effects on reaction time, as well as to familiarize the participants with the environment and task, participants performed warm-up trials for each of the scenes, followed by a short break.
Conditions
We aim to validate our realistic scenarios with unseen conditions during the model training. Given the hardware limitations in Section 3.1, we experimented with a fixation at and targets placed away in depth. Using this novel vergence depth, we designed conditions with various eye travel distances:
-
:
pure vergence motion with the shortest distance, ,
-
:
combined motion with the medium distance ,
-
:
combined motion with the longest distance .
We used the same conditions across all three tested scenes to statistically compare inter-scene generalizability, as detailed in the results paragraph below. To acquire enough data for robust statistical distributions, we included repeats per condition on each scene, with fully randomized order. Therefore, the experiment generated participants scenes conditions repeats trials in total. We avoided participant fatigue by partitioning the study into blocks, with each block containing trials from only one scene. Additionally, the scene order was fully counterbalanced with a Latin square to avoid carry-on effects.

Results
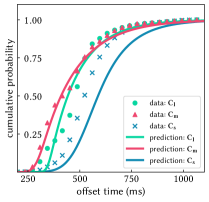
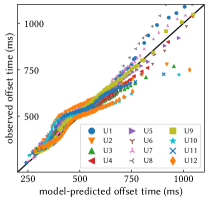
The second row of Figure 7 summarizes the results (see LABEL:sec:supp:study:fullStats for the full visualization). To measure the model’s applicability and generalizability, we compare its predictions with the obtained human data along multiple axes, including unseen conditions (Figure 7d), participants (Figure 7e), and scenes. Specifically,
-
(1)
Across the conditions, exhibits the fastest average offset time (), compared to () and () conditions. The trend agrees with the model’s prediction for //, as . The predictions for in Figure 7d appear to be slightly higher than measured data, however, K.S. tests failed to reject the null hypothesis that the model prediction and the user-exhibited data are drawn from the same distribution ( for each condition). A repeated measures ANOVA indicated that the condition had a significant effect on the offset time ().
-
(2)
Across the participants, K.S. tests failed to reject the null hypothesis that the model prediction and the user-exhibited data are drawn from the same distribution ( for each).
-
(3)
Across the scenes, K.S. tests failed to reject the null hypothesis that the model prediction and the user-exhibited data are drawn from the same distribution ( for each scene). A repeated measures ANOVA did not observe that the scene had a significant effect on the offset time (). We further calculated the KLdivs between observed data and model predictions for each scene to investigate whether the choice of scene affects model alignment. The KLdiv for archery/basketball/natural is , respectively. A repeated measures ANOVA did not observe that scene had a significant effect on the KLdiv ().
Discussion
The statistical analysis demonstrates the model’s consistent capability of predicting and thus optimizing users’ task performance during 3D visual target changes. In addition to averaged offset times, the model also accurately predicts probability distributions with statistical accuracy, considering individual differences and sensory/behavioral randomness. Our predictions are consistent with unseen conditions and participants, without being affected by novel and realistic scenes. We also re-observe the remarkable fact that offset time performance is not positively correlated to the travel distance, again evidenced by a significant “U-shape” effect.
5. Application Case Studies
We apply our model to two applications considering 3D gaze movements. First, we explore how gaze movement variability between VR games can influence video game difficulty experienced by players. Second, we make recommendations for scene-aware design and placement of 3D UI elements to minimize the cost of users’ target changing in scenarios such as automotive head-up displays (HUD).
5.1. Gaze Movement Performance in Games for VR vs. 2D
The relationship between human performance in video games and target placement has been studied in traditional 2D displays (Duinkharjav et al., 2022; Kim et al., 2022). In this case study, we consider whether the game-dependent content depth has an effect on this performance. Since gaming in 2D does not involve vergence movements, our evidence in Section 3 suggests that gaze movements would be faster than in 3D environments. To measure the scale of this difference across display environments as well as individual games, we conduct a numerical simulation using our model.
Setup
We experiment with a large-scale VR player behavior dataset established by Aizenman et al. (2022). The dataset investigates how often users fixate at various depths during gameplay. It contains games which mimic four top-rated games on Steam111https://store.steampowered.com/vr/#p=0&tab=TopSellers: Job Simulator, Arizona Sunshine, Beat Saber, and Pistol Whip. With this data, we can simulate various gaze shifts between fixations that occur during real gameplay and use our model to predict the corresponding average offset time. Concretely, the distribution of gaze fixation depth is described via a probability density function, . The PDF value at some vergence angle, , represents the proportion of total time spent fixating at that depth when a user plays a given game .
We model each gaze movement during play as originating and targeting two fixation points sampled from the same distribution . Given an origin and target vergence angles, and , the joint probability density, , is equal to
| (8) |
Using this distribution of vergence movement amplitudes, , as a weight factor, we compute the mean gaze movement offset times at all saccade amplitudes our model supports (i.e., ).
Results and discussion
We visualize our main results in Figure 8. Across all gaze depths reported by Aizenman et al. (2022), of the duration was fixated at vergence angles — the maximum supported by our model. In analysis, we excluded the remaining data. The baseline 2D condition without vergence movements between fixations (i.e., ) exhibits the fastest offset times of . The mean offset times for the four games are, on average, slower compared to the baseline 2D condition. Job Simulator and Arizona Sunshine present a mean gaze offset time of around more than baseline, while Beat Saber, and Pistol Whip present a mean gaze offset time of around .
The additional time and effort resulting from stereoscopic eye movements in different games will likely translate to increased difficulty. Notably, the performance regression varies across games and depends on the scale of players’ gaze depth variance. These results suggest that gaming in VR comes with a “performance overhead” when compared to playing in 2D. Games that feature more salient objects at shallow depths such as Job Simulator and Arizona Sunshine result in up to longer gaze offset times compared to the other two games where very little performance is lost. Further investigations to characterize the relationship between gaze offset times and player-experienced difficulties are interesting future work but beyond the scope of this research.
5.2. Scene-Aware Optimization for 3D User Interface
The surging automotive head-up displays (HUD) and wearable AR devices raise new demands in user-centric 3D interface design. Suboptimal designs may slow users’ reactions and cause dangers (Sabelman and Lam, 2015). When it comes to HUD interface, a desirable design target is the “optimal” virtual projection distance that preserves or even accelerates drivers’ reaction to road conditions (see Figure 9a), in addition to factors such as focal depths. However, the optimization still remains debated and thus confounds designs. For example, while some literature suggests the distance to be (Betancur, 2011), some manufacturers instead designed it as 222https://media.mbusa.com/releases/release-9e110a76b364c518148b9c1ade19bc23-meet-the-s-class-digital-my-mbux-mercedes-benz-user-experience. Our model provides a quantitative metric for drivers’ target-reaching time as a consequence of varying HUD projection distances.
Specifically, as annotated in Figure 9b: if the driver were to initiate a gaze movement from looking at the HUD image, depending on the depth of the UI element as well as the target location, the gaze offset times would vary anywhere between (Figure 9c). Therefore, driving assistant applications could leverage the predictions in gaze offset to adjust the placement of UI elements, or to provide timely intervention/alerts in case of emergencies. While the specific optimization goal for object placement will vary depending on the application, we conducted an example optimization using our model without loss of generality. Specifically, we leverage large-scale datasets to collect the depth distribution of various scenes and suggest the ideal placement of a “HUD overlay image” which would minimize the average gaze offset time from the display element to arbitrary points of focus within the scene.
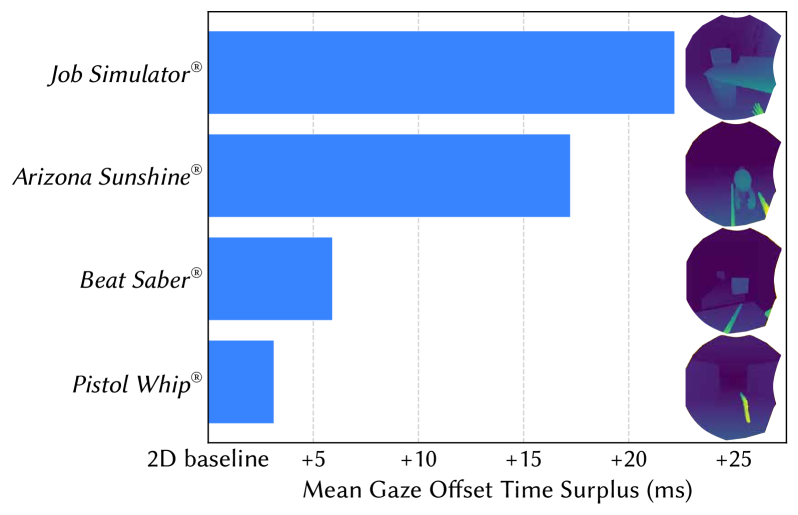
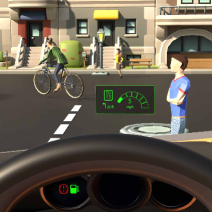
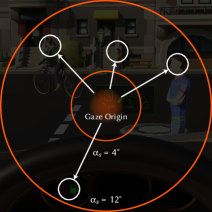
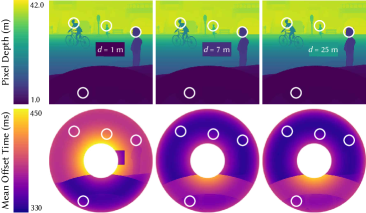
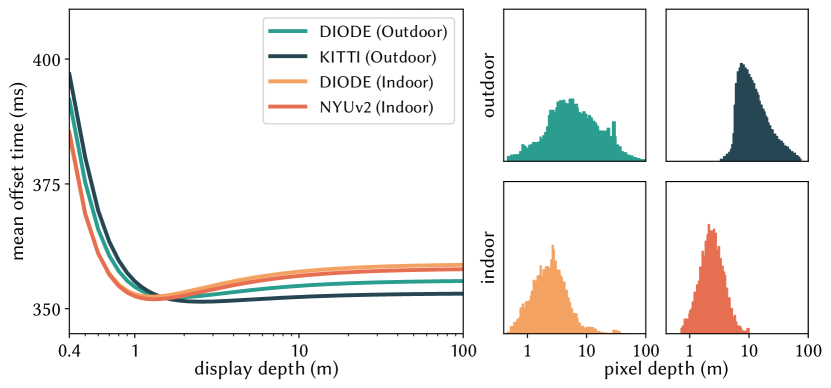
Figure 10 shows our experimental results with two datasets containing depth maps of natural outdoor environments; DIODE (Vasiljevic et al., 2019) ( frames), KITTI (Geiger et al., 2012) ( frames). The average distances of objects are visualized in the top row of the histograms. Assuming a starting gaze centered on a HUD overlay image, positioned at some depth, , we measure the average gaze offset time, , for saccade amplitudes uniformly sampled from , and depth targets sampled from the dataset depth histograms. The resulting relationship between and is visualized in Figure 10. Due to the differentiable nature of our model, we can optimize to minimize via gradient descent. As a result, the optimal image placements, , are and for the outdoor DIODE and KITTI datasets. Beyond HUD in outdoor environments, we may also leverage the model for AR devices in indoor scenarios. Therefore, we further leveraged the indoor portion from DIODE ( frames), and NYUv2 (Silberman et al., 2012) ( indoor frames). Intuitively, the depths that minimize are smaller for indoor datasets because more objects are closer in the distance. Indeed, we found to be the optimal projection depths for both the indoor-DIODE and NYUv2 datasets.
Our model helps design HUD displays in various applications, as the optimized image placements clearly vary significantly with scenes, e.g. indoor or outdoor ones. They can also be further optimized by using distributions of saccade amplitudes that are more representative of each application.
6. Limitations and Future Work
Initial depth and eccentricity
Our combined vergence-saccade model measures the angular displacement in 3D without considering the initial fixation depth and eccentricity, even though both of these factors do influence eye movement offset time. Specifically, prior literature suggests that convergence/divergence-only movements show a linear correlation for offset times (Templin et al., 2014b), while off-axis movements that maintain focal depth are much more complex, and require consideration of both vertical/horizontal eccentricity and ocular-motor anatomics (van Beers, 2007). In order to develop a model that predicts gaze offset times between arbitrary points in 3D space, we would need to individually measure and account for all these factors as a high-dimensional grid of conditions. Our main focus of this research is to demonstrate the importance and possibility of modeling gaze offset times for computer graphics applications; therefore, we plan to investigate all the factors above in future work.
Influence of accommodation and peripheral stereoacuity
Vergence accommodation conflict may, in addition to discomfort, also cause incorrect visual fidelity (March et al., 2022) and depth acuity (Sun et al., 2020), thus potentially degrading target localization accuracy. Similarly, the inherent mismatch between the geometric and empirical horopters may result in poor stereoacuity (and therefore localization) for targets at farther eccentricities along the iso-vergence circle (Ogle, 1952). Additionally, accommodation speeds have been shown to be slower than vergence speeds (Heron et al., 2001); hence, while our methods have comprehensive predictive capability in VR and pass-through AR devices (such as the Oculus Quest, and Apple Vision Pro), future investigations are necessary to fully model the latency of accommodation in see-through AR devices. Our stimuli cover a conservative range of vergence depths and eccentricities, with targets placed close to where the geometric and empirical horopters meet, and having little to no VAC. While this range is appropriate for the contemporary (vergence-only) VR/AR displays (Aizenman et al., 2022), however, future work on understanding and optimizing for the influence of accommodation on 3D temporal visual behaviors may shed light on new performance-aware metrics to guide 3D display optics design.
Reaction time and image-space features
Throughout this paper, we eliminated, as much as possible, any image-dependent variance in reaction time. Therefore, our measured offset time is primarily influenced by biomechanical responses to the spatial distribution of the stimuli, and not influenced by task difficulties or image characteristics such as contrast and spatial frequency (Devillez et al., 2020; Lisi et al., 2019). Exploring the combined effect of cognitive load or image characteristics on reaction time may add new building blocks for comprehensive measurements of visual performance.
Eye-head coordination
During free-viewing, head movements often accompany eye movements and we tend to rotate our heads toward visual targets, especially for large eccentricities beyond (Bahill et al., 1975a). Our model does not predict the duration or impact of this concurrent head movement. However, even though moving the head to center the target is a slower movement that typically completes after initial eye movement (Sağlam et al., 2011), our retinal image during the re-centering phase is stabilized, similar to Vestibular Ocular Reflex. Hence, our model’s predictions are likely to continue to be useful as they identify the earliest point after initial eye movement at which the target is clearly visible. We hope that future work in eye-head movement validates this expectation.
7. Conclusion
We statistically measure and model the correlation between visual target displacement in 3D and eye movement offset time. Our data and model reveal a remarkable fact about eye movements in the 3D world: although combining a saccadic movement with a vergence movement accelerates motion towards a target in depth, the acceleration effect shows a surprisingly non-monotonic U-shape effect. Moreover, the model accurately predicts absolute temporal performance on this task without individual normalization. This is primarily because offset time for eye movements is mainly a biophysical phenomenon and not a cognitive one. We hope the research presented here inspires a new frontier exploring exciting questions about eye movements in 3D. For example, what contributes to variation in our target acquisition speeds? How do the surging virtual layers added to the physical world influence our visual attention shifts, and thus safety? And finally, how can we build future virtual environments that boost human performance in taking actions, even to outperform ourselves in the physical world?
Acknowledgements.
We would like to thank Avigael Aizenman and Agostino Gibaldi for insightful advice on processing stereo gaze data, and support in leveraging the video game gaze behavior data in their work (2022). This project is partially supported by the National Science Foundation grants #2225861 and #2232817, and a DARPA PTG program.References
- (1)
- Aizenman et al. (2022) Avi M Aizenman, George A Koulieris, Agostino Gibaldi, Vibhor Sehgal, Dennis M Levi, and Martin S Banks. 2022. The statistics of eye movements and binocular disparities during VR gaming: Implications for headset design. ACM Transactions on Graphics (TOG) 42, 1 (2022), 15 pages.
- Arabadzhiyska et al. (2017) Elena Arabadzhiyska, Okan Tarhan Tursun, Karol Myszkowski, Hans-Peter Seidel, and Piotr Didyk. 2017. Saccade landing position prediction for gaze-contingent rendering. ACM Transactions on Graphics (TOG) 36, 4 (2017), 1–12.
- Bahill et al. (1975a) AT Bahill, D Adler, and L Stark. 1975a. Most naturally occurring human saccades have magnitudes of 15 degrees or less. Investigative Ophthalmology 14, 6 (1975), 468–469.
- Bahill et al. (1975b) A Terry Bahill, Michael R Clark, and Lawrence Stark. 1975b. The main sequence, a tool for studying human eye movements. Mathematical biosciences 24, 3-4 (1975), 191–204.
- Bertram et al. (2016) Raymond Bertram, Johanna Kaakinen, Frank Bensch, Laura Helle, Eila Lantto, Pekka Niemi, and Nina Lundbom. 2016. Eye movements of radiologists reflect expertise in CT study interpretation: A potential tool to measure resident development. Radiology 281, 3 (2016), 805–815.
- Betancur (2011) J Alejandro Betancur. 2011. Physical Variable Analysis Involved in Head-Up Display Systems Applied to Automobiles. Augmented Reality-Some Emerging Application Areas 13 (2011), 244–266.
- Boghen et al. (1974) D Boghen, BT Troost, RB Daroff, LF Dell’Osso, and JE Birkett. 1974. Velocity characteristics of normal human saccades. Investigative Ophthalmology & Visual Science 13, 8 (1974), 619–623.
- Bucci et al. (2006) Maria Pia Bucci, Qing Yang, Dominique Brémond-Gignac, et al. 2006. Latency of saccades, vergence, and combined movements in children with early onset convergent or divergent strabismus. Vision Research 46, 8-9 (2006), 1384–1392.
- Butterworth et al. (1930) Stephen Butterworth et al. 1930. On the theory of filter amplifiers. Wireless Engineer 7, 6 (1930), 536–541.
- Chapiro et al. (2014) Alexandre Chapiro, Simon Heinzle, Tunç Ozan Aydın, Steven Poulakos, Matthias Zwicker, Aljosa Smolic, and Markus Gross. 2014. Optimizing stereo-to-multiview conversion for autostereoscopic displays. In Computer graphics forum, Vol. 33. Wiley Online Library, The Eurographics Association and John Wiley and Sons Ltd., 63–72.
- Chapiro et al. (2015) Alexandre Chapiro, Carol O’Sullivan, Wojciech Jarosz, Markus H Gross, and Aljoscha Smolic. 2015. Stereo from Shading. In EGSR (EI&I). 119–125.
- Chen et al. (2010) Yung-Fu Chen, You-Yun Lee, Tainsong Chen, John L Semmlow, Tara L Alvarez, et al. 2010. Behaviors, models, and clinical applications of vergence eye movements. J Med Biol Eng 30, 1 (2010), 1–15.
- Collewijn et al. (1995) Han Collewijn, Casper J Erkelens, and Robert M Steinman. 1995. Voluntary binocular gaze-shifts in the plane of regard: dynamics of version and vergence. Vision research 35, 23-24 (1995), 3335–3358.
- Coubard (2013) Olivier A Coubard. 2013. Saccade and vergence eye movements: a review of motor and premotor commands. European journal of neuroscience 38, 10 (2013), 3384–3397.
- Cullen and Van Horn (2011) Kathleen E Cullen and Marion R Van Horn. 2011. The neural control of fast vs. slow vergence eye movements. European Journal of Neuroscience 33, 11 (2011), 2147–2154.
- Deng et al. (2022) Nianchen Deng, Zhenyi He, Jiannan Ye, Budmonde Duinkharjav, Praneeth Chakravarthula, Xubo Yang, and Qi Sun. 2022. FoV-NeRF: Foveated Neural Radiance Fields for Virtual Reality. IEEE Transactions on Visualization and Computer Graphics 28, 11 (2022), 3854–3864.
- Devillez et al. (2020) Hélène Devillez, Nathalie Guyader, Tim Curran, and Randall C O’Reilly. 2020. The bimodality of saccade duration during the exploration of visual scenes. Visual Cognition 28, 9 (2020), 484–512.
- Duinkharjav et al. (2022) Budmonde Duinkharjav, Praneeth Chakravarthula, Rachel Brown, Anjul Patney, and Qi Sun. 2022. Image Features Influence Reaction Time: A Learned Probabilistic Perceptual Model for Saccade Latency. ACM Trans. Graph. 41, 4, Article 144 (jul 2022), 15 pages. https://doi.org/10.1145/3528223.3530055
- Erkelens et al. (1989) CJ Erkelens, RM Steinman, and H Collewijn. 1989. Ocular vergence under natural conditions. II. Gaze shifts between real targets differing in distance and direction. Proceedings of the Royal Society of London. B. Biological Sciences 236, 1285 (1989), 441–465.
- Feil et al. (2017) Moritz Feil, Barbara Moser, and Mathias Abegg. 2017. The interaction of pupil response with the vergence system. Graefe’s archive for clinical and experimental ophthalmology 255 (2017), 2247–2253.
- Fesharaki et al. (2012) Hamid Fesharaki, Leila Rezaei, Fereidoun Farrahi, Taghi Banihashem, and Ahmad Jahanbakhshi. 2012. Normal interpupillary distance values in an Iranian population. Journal of ophthalmic & vision research 7, 3 (2012), 231.
- Geiger et al. (2012) Andreas Geiger, Philip Lenz, and Raquel Urtasun. 2012. Are we ready for autonomous driving? the kitti vision benchmark suite. In 2012 IEEE conference on computer vision and pattern recognition. IEEE, 3354–3361.
- Hadnett-Hunter et al. (2019) Jacob Hadnett-Hunter, George Nicolaou, Eamonn O’Neill, and Michael Proulx. 2019. The effect of task on visual attention in interactive virtual environments. ACM Transactions on Applied Perception (TAP) 16, 3 (2019), 1–17.
- Heron et al. (2001) Gordon Heron, WN Charman, and C Schor. 2001. Dynamics of the accommodation response to abrupt changes in target vergence as a function of age. Vision research 41, 4 (2001), 507–519.
- Hoffman et al. (2008) David M Hoffman, Ahna R Girshick, Kurt Akeley, and Martin S Banks. 2008. Vergence–accommodation conflicts hinder visual performance and cause visual fatigue. Journal of vision 8, 3 (2008), 33–33.
- Hu et al. (2021a) Zhiming Hu, Andreas Bulling, Sheng Li, and Guoping Wang. 2021a. Ehtask: Recognizing user tasks from eye and head movements in immersive virtual reality. IEEE Transactions on Visualization and Computer Graphics (2021).
- Hu et al. (2021b) Zhiming Hu, Andreas Bulling, Sheng Li, and Guoping Wang. 2021b. Fixationnet: Forecasting eye fixations in task-oriented virtual environments. IEEE Transactions on Visualization and Computer Graphics 27, 5 (2021), 2681–2690.
- Jaschinski (2016) Wolfgang Jaschinski. 2016. Pupil size affects measures of eye position in video eye tracking: implications for recording vergence accuracy. Journal of Eye Movement Research 9, 4 (2016).
- Julesz (1971) Bela Julesz. 1971. Foundations of cyclopean perception. (1971).
- Kaplanyan et al. (2019) Anton S Kaplanyan, Anton Sochenov, Thomas Leimkühler, Mikhail Okunev, Todd Goodall, and Gizem Rufo. 2019. DeepFovea: Neural reconstruction for foveated rendering and video compression using learned statistics of natural videos. ACM Transactions on Graphics (TOG) 38, 6 (2019), 1–13.
- Kellnhofer et al. (2016a) Petr Kellnhofer, Piotr Didyk, Karol Myszkowski, Mohamed M Hefeeda, Hans-Peter Seidel, and Wojciech Matusik. 2016a. GazeStereo3D: Seamless disparity manipulations. ACM Transactions on Graphics (TOG) 35, 4 (2016), 1–13.
- Kellnhofer et al. (2016b) Petr Kellnhofer, Piotr Didyk, Tobias Ritschel, Belen Masia, Karol Myszkowski, and Hans-Peter Seidel. 2016b. Motion parallax in stereo 3D: Model and applications. ACM Transactions on Graphics (TOG) 35, 6 (2016), 1–12.
- Kim et al. (2022) Joohwan Kim, Arjun Madhusudan, Benjamin Watson, Ben Boudaoud, Roland Tarrazo, and Josef Spjut. 2022. Display Size and Targeting Performance: Small Hurts, Large May Help. In SIGGRAPH Asia 2022 Conference Papers. 1–8.
- King (2011) WM King. 2011. Binocular coordination of eye movements–Hering’s Law of equal innervation or uniocular control? European Journal of Neuroscience 33, 11 (2011), 2139–2146.
- Konrad et al. (2020) Robert Konrad, Anastasios Angelopoulos, and Gordon Wetzstein. 2020. Gaze-contingent ocular parallax rendering for virtual reality. ACM Transactions on Graphics (TOG) 39, 2 (2020), 1–12.
- Kothari et al. (2020) Rakshit Kothari, Zhizhuo Yang, Christopher Kanan, Reynold Bailey, Jeff B Pelz, and Gabriel J Diaz. 2020. Gaze-in-wild: A dataset for studying eye and head coordination in everyday activities. Scientific reports 10, 1 (2020), 1–18.
- Krajancich et al. (2020) Brooke Krajancich, Petr Kellnhofer, and Gordon Wetzstein. 2020. Optimizing depth perception in virtual and augmented reality through gaze-contingent stereo rendering. ACM Transactions on Graphics (TOG) 39, 6 (2020), 1–10.
- Krajancich et al. (2021) Brooke Krajancich, Petr Kellnhofer, and Gordon Wetzstein. 2021. A perceptual model for eccentricity-dependent spatio-temporal flicker fusion and its applications to foveated graphics. ACM Transactions on Graphics (TOG) 40, 4 (2021), 1–11.
- Krajancich et al. (2023) Brooke Krajancich, Petr Kellnhofer, and Gordon Wetzstein. 2023. Towards Attention–aware Foveated Rendering. ACM Transactions on Graphics (TOG) 42, 4 (2023), 1–10.
- Lang et al. (2014) Alexandre Lang, Chrystal Gaertner, Elham Ghassemi, Qing Yang, Christophe Orssaud, and Zoï Kapoula. 2014. Saccade-vergence properties remain more stable over short-time repetition under overlap than under gap task: a preliminary study. Frontiers in Human Neuroscience 8 (2014), 372.
- Le Meur et al. (2017) Olivier Le Meur, Antoine Coutrot, Zhi Liu, Pia Rämä, Adrien Le Roch, and Andrea Helo. 2017. Visual attention saccadic models learn to emulate gaze patterns from childhood to adulthood. IEEE Transactions on Image Processing 26, 10 (2017), 4777–4789.
- Lisi et al. (2019) Matteo Lisi, Joshua A Solomon, and Michael J Morgan. 2019. Gain control of saccadic eye movements is probabilistic. Proceedings of the National Academy of Sciences 116, 32 (2019), 16137–16142.
- March et al. (2022) Joseph March, Anantha Krishnan, Simon Watt, Marek Wernikowski, Hongyun Gao, Ali Özgür Yöntem, and Rafal Mantiuk. 2022. Impact of correct and simulated focus cues on perceived realism. In SIGGRAPH Asia 2022 Conference Papers. 1–9.
- Marmolejo-Ramos et al. (2023) Fernando Marmolejo-Ramos, Carlos Barrera-Causil, Shenbing Kuang, Zeinab Fazlali, Detlef Wegener, Thomas Kneib, Fernanda De Bastiani, and Guillermo Martinez-Florez. 2023. Generalised exponential-Gaussian distribution: a method for neural reaction time analysis. Cognitive Neurodynamics 17, 1 (2023), 221–237.
- Martin et al. (2022) Daniel Martin, Ana Serrano, Alexander W Bergman, Gordon Wetzstein, and Belen Masia. 2022. ScanGAN360: A Generative Model of Realistic Scanpaths for 360° Images. IEEE Transactions on Visualization and Computer Graphics 28, 5 (2022), 2003–2013.
- Massey Jr (1951) Frank J Massey Jr. 1951. The Kolmogorov-Smirnov test for goodness of fit. Journal of the American statistical Association 46, 253 (1951), 68–78.
- Mays (1984) Lawrence E Mays. 1984. Neural control of vergence eye movements: convergence and divergence neurons in midbrain. Journal of Neurophysiology 51, 5 (1984), 1091–1108.
- Nyström et al. (2016) Marcus Nyström, Ignace Hooge, and Richard Andersson. 2016. Pupil size influences the eye-tracker signal during saccades. Vision research 121 (2016), 95–103.
- Ogle (1952) Kenneth N Ogle. 1952. On the limits of stereoscopic vision. Journal of experimental psychology 44, 4 (1952), 253.
- Pallus et al. (2018) Adam C Pallus, Mark MG Walton, and Michael J Mustari. 2018. Response of supraoculomotor area neurons during combined saccade-vergence movements. Journal of Neurophysiology 119, 2 (2018), 585–596.
- Patney et al. (2016) Anjul Patney, Marco Salvi, Joohwan Kim, Anton Kaplanyan, Chris Wyman, Nir Benty, David Luebke, and Aaron Lefohn. 2016. Towards foveated rendering for gaze-tracked virtual reality. ACM Transactions on Graphics (TOG) 35, 6 (2016), 1–12.
- Quinet et al. (2020) Julie Quinet, Kevin Schultz, Paul J May, and Paul D Gamlin. 2020. Neural control of rapid binocular eye movements: Saccade-vergence burst neurons. Proceedings of the National Academy of Sciences 117, 46 (2020), 29123–29132.
- Sabelman and Lam (2015) Eric E Sabelman and Roger Lam. 2015. The real-life dangers of augmented reality. IEEE Spectrum 52, 7 (2015), 48–53.
- Sağlam et al. (2011) Murat Sağlam, Nadine Lehnen, and Stefan Glasauer. 2011. Optimal control of natural eye-head movements minimizes the impact of noise. Journal of Neuroscience 31, 45 (2011), 16185–16193.
- Salvucci and Liu (2002) Dario D Salvucci and Andrew Liu. 2002. The time course of a lane change: Driver control and eye-movement behavior. Transportation research part F: traffic psychology and behaviour 5, 2 (2002), 123–132.
- Semmlow et al. (2019) John L Semmlow, Chang Yaramothu, and Tara L Alvarez. 2019. Dynamics of the disparity vergence slow (fusion sustaining) component. Journal of eye movement research 12, 4 (2019).
- Shi et al. (2022) Peiteng Shi, Markus Billeter, and Elmar Eisemann. 2022. Stereo-consistent screen-space ambient occlusion. Proc. ACM Comput. Graph. Interact. Tech. 5, 1 (2022), 2–1.
- Silberman et al. (2012) Nathan Silberman, Derek Hoiem, Pushmeet Kohli, and Rob Fergus. 2012. Indoor segmentation and support inference from rgbd images. In European conference on computer vision. Springer, 746–760.
- Sitzmann et al. (2018) Vincent Sitzmann, Ana Serrano, Amy Pavel, Maneesh Agrawala, Diego Gutierrez, Belen Masia, and Gordon Wetzstein. 2018. Saliency in VR: How do people explore virtual environments? IEEE transactions on visualization and computer graphics 24, 4 (2018), 1633–1642.
- Specht et al. (2017) JI Specht, ML Freije, AL Frapiccini, R de Luis Garcia, and G Gasaneo. 2017. A simple physical representation for saccadic eye movement data. In European Congress on Computational Methods in Applied Sciences and Engineering. Springer, 854–861.
- Sun et al. (2020) Qi Sun, Fu-Chung Huang, Li-Yi Wei, David Luebke, Arie Kaufman, and Joohwan Kim. 2020. Eccentricity effects on blur and depth perception. Optics express 28, 5 (2020), 6734–6739.
- Templin et al. (2014b) Krzysztof Templin, Piotr Didyk, Karol Myszkowski, Mohamed M Hefeeda, Hans-Peter Seidel, and Wojciech Matusik. 2014b. Modeling and optimizing eye vergence response to stereoscopic cuts. ACM Transactions on Graphics (TOG) 33, 4 (2014), 1–8.
- Templin et al. (2014a) Krzysztof Templin, Piotr Didyk, Karol Myszkowski, and Hans-Peter Seidel. 2014a. Perceptually-motivated stereoscopic film grain. In Computer Graphics Forum, Vol. 33. Wiley Online Library, The Eurographics Association and John Wiley and Sons Ltd., 349–358.
- Thaler et al. (2013) Lore Thaler, Alexander C Schütz, Melvyn A Goodale, and Karl R Gegenfurtner. 2013. What is the best fixation target? The effect of target shape on stability of fixational eye movements. Vision research 76 (2013), 31–42.
- van Beers (2007) Robert J van Beers. 2007. The sources of variability in saccadic eye movements. Journal of Neuroscience 27, 33 (2007), 8757–8770.
- van Beers (2008) Robert J van Beers. 2008. Saccadic eye movements minimize the consequences of motor noise. PloS one 3, 4 (2008), e2070.
- Vasiljevic et al. (2019) Igor Vasiljevic, Nick Kolkin, Shanyi Zhang, Ruotian Luo, Haochen Wang, Falcon Z. Dai, Andrea F. Daniele, Mohammadreza Mostajabi, Steven Basart, Matthew R. Walter, and Gregory Shakhnarovich. 2019. DIODE: A Dense Indoor and Outdoor DEpth Dataset. CoRR abs/1908.00463 (2019). http://arxiv.org/abs/1908.00463
- Welchman et al. (2008) Andrew E Welchman, Judith M Lam, and Heinrich H Bülthoff. 2008. Bayesian motion estimation accounts for a surprising bias in 3D vision. Proceedings of the National Academy of Sciences 105, 33 (2008), 12087–12092.
- Wolski et al. (2022) Krzysztof Wolski, Fangcheng Zhong, Karol Myszkowski, and Rafał K. Mantiuk. 2022. Dark Stereo: Improving Depth Perception under Low Luminance. ACM Trans. Graph. 41, 4, Article 146 (jul 2022), 12 pages. https://doi.org/10.1145/3528223.3530136
- Yang et al. (2002) Qing Yang, Maria Pia Bucci, and Zol Kapoula. 2002. The latency of saccades, vergence, and combined eye movements in children and in adults. Investigative Ophthalmology & Visual Science 43, 9 (2002), 2939–2949.
- Yang and Kapoula (2004) Qing Yang and Zoï Kapoula. 2004. Saccade–vergence dynamics and interaction in children and in adults. Experimental Brain Research 156 (2004), 212–223.
- Yang et al. (2010) Qing Yang, Marine Vernet, Christophe Orssaud, Pierre Bonfils, Alain Londero, and Zoi Kapoula. 2010. Central crosstalk for somatic tinnitus: abnormal vergence eye movements. PLoS One 5, 7 (2010), e11845.
- Yarbus (2013) Alfred L Yarbus. 2013. Eye movements and vision. Springer.
- Zee et al. (1992) David S Zee, Edmond J Fitzgibbon, and Lance M Optican. 1992. Saccade-vergence interactions in humans. Journal of Neurophysiology 68, 5 (1992), 1624–1641.
- Zhong et al. (2021) Fangcheng Zhong, Akshay Jindal, Özgür Yöntem, Param Hanji, Simon Watt, and Rafal Mantiuk. 2021. Reproducing reality with a high-dynamic-range multi-focal stereo display. ACM Transactions on Graphics 40, 6 (2021), 241.