Multi-Messenger Measurements of the Static Structure of Shock-Compressed Liquid Silicon at 100 GPa
Abstract
Ionic structure of high pressure, high temperature fluids is a challenging theoretical problem with applications to planetary interiors and fusion capsules. Here we report a multi-messenger platform using velocimetry and in situ angularly and spectrally resolved X-ray scattering to measure the thermodynamic conditions and ion structure factor of materials at extreme pressures. We document the pressure, density, and temperature of shocked silicon near with uncertainties of 6%, 2%, and 20%, respectively. The measurements are sufficient to distinguish between and rule out some ion screening models.
With the advent of high-power lasers, a laboratory-based exploration into extreme states of matter, such as those found in planetary interiors Benuzzi-Mounaix et al. (2014) or during asteroid impacts Sharp and DeCarli (2006), has been realized. This exotic state, referred to as warm dense matter (WDM) Graziani et al. (2014), is characterized by temperatures and pressures on the order of and . Experimental measurement of material behavior and structure under such conditions is paramount for testing theoretical models used in the pursuit of fusion energy Craxton et al. (2015); Hu et al. (2018a) and for modeling planetary phenomena Landeau et al. (2022); Badro et al. (2014); Soubiran et al. (2017); de Wijs et al. (1998), where dynamic geophysics processes are dominated by changes in solid- and liquid-state structure.
Over the last few decades, high-energy density (HED) facilities have developed the capability of generating sufficiently long-lived WDM states to deploy suites of advanced diagnostics Glenzer et al. (2016); Koenig et al. (2005); Wünsch et al. (2011). Using the X-ray free electron laser (XFEL) at the Linac Coherent Light Source, high-resolution X-ray scattering measurements have successfully probed the electronic and atomic structure of high-pressure states Fletcher et al. (2015); McBride et al. (2019). However, the compression capabilities and prepared WDM volumes (critical for seeding uniform conditions) at XFELs are limited in comparison to what is readily achieved at to -class laser facilities. Due to the difficulty in making standard simplifying approximations at these high-pressure states, which are expected in both Jovian planet interiors Guillot (1999) and fusion ignition capsules Hurricane et al. (2019), equation-of-state (EOS) development Bonitz et al. (2020); Hu et al. (2018b) requires experimental measurements.
At such laser-facilities, diagnostic access can be comparatively constrained and probing shock-compressed matter has often been limited to single diagnostics e.g. X-ray Thomson scattering (XRTS) Kraus et al. (2016); Davis et al. (2016); Regan et al. (2012); Lee et al. (2009) or X-ray diffraction (XRD) Lazicki et al. (2015); Coppari et al. (2022); Rygg et al. (2012); Gong et al. (2023) for measuring the electronic and atomic structures, or impedance matching techniques via a velocity interferometry system for any reflector (VISAR) Henderson et al. (2021). In such experiments the conditions inferred from these diagnostics often rely on appropriate model selections or on previous measurements of reference materials.
Initial attempts to combine scattering and velocimetry observations to infer WDM conditions were performed by Falk et al. Falk et al. (2013), though different measurements had to be taken over multiple shots using identical targets and drive conditions. In this work we present a novel experimental platform, where reduction of model selection biases is obtained by combining multiple diagnostics for simultaneous in situ structure characterization. Reverse Monte Carlo techniques are employed to determine the structural properties of shock-compressed matter, via measurement of the static density response. For this study, silicon was chosen due to its importance in the understanding of planetary interiors Davies et al. (2020); Hirose et al. (2017), for its use as a dopant to ablators in inertial confinement fusion target designs Huser et al. (2018); Edwards et al. (2011) and to mitigate laser-imprint effects on multi-layer targets Hu et al. (2012); Fiksel et al. (2012).
The experiments were conducted at the OMEGA-EP laser facility at the Laboratory for Laser Energetics Meyerhofer et al. (2010). A thick polycrystalline silicon sample was shock-compressed to using a single drive laser beam delivering over with a diameter distributed phase plate. The drive laser is incident on a polystyrene (C8H8) ablator at a angle with respect to the target normal. The ablator was fixed to the front of the silicon sample using a thin layer of glue (). Three additional beams were tightly focused on a thick copper backlighter with an areal size of , generating a pulse of Cu He- X-rays centered at Coppari et al. (2019). The X-ray source was placed away from the silicon sample.
The experimental configuration devised to probe the structure of WDM silicon at OMEGA-EP is shown in Figure 1. It employed a variation of the powder X-ray diffraction image plate (PXRDIP) setup Rygg et al. (2012), which uses Fujifilm BAS-MS image plates (IP’s) Meadowcroft et al. (2008). Due to spatial constraints the X-ray diffraction only accessed momentum transfers up to at . To extend the capabilities of the PXRDIP diagnostic, a Bragg crystal zinc-spectrometer (ZSPEC) was added to measure scattering at high momentum transfer, and is capable of resolving the electronic structure of sufficiently ionized systems. The ZSPEC consists of a highly-oriented pyrolitic graphite (HOPG) crystal with a radius of curvature of , and placed after the sample. As shown in the top inset in Figure 1, the ZSPEC was fielded out of perfect von-Hamos focusing meaning the X-rays were spectrally dispersed on a curve. The spectral analysis procedure can be found in the Supplementary Material. The silicon sample was fitted to the front of the PXRDIP enclosure on top of a diameter silver or tantalum collimating aperture pinhole, which restricts the diagnostics’ line-of-sight to the central planar shock region. These materials were chosen to ensure no fluorescence within the ZSPEC energy range, and to reduce interference between the pinhole and silicon Bragg peaks on the PXRDIP.
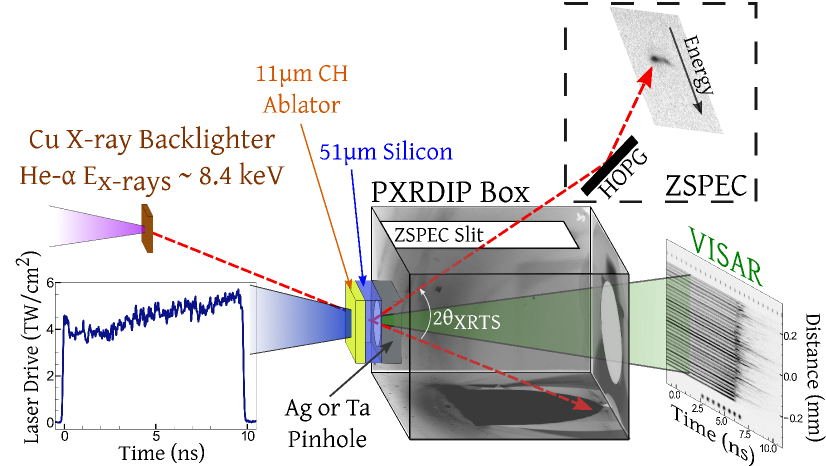
To measure the shock-breakout (SBO) time we fielded line-imaging VISAR which monitored the silicon sample’s free surface Celliers and Millot (2023). The streaked image inset in Figure 1 shows the SBO as a rapid disappearance of the fringes around . From this time we inferred the shock velocity in silicon to be (see Supplementary Material for details). As silicon is opaque to the VISAR wavelength () at the investigated conditions, a direct measurement of the silicon particle velocity could not be made, and is instead inferred from the bilinear relationship in Ref. Henderson et al. (2021), which for small velocities is calculated from previous high explosive measurements Pavlovskii (1968). Combining this information with the Rankine-Hugoniot relations, we measured the achieved pressure-density state to be and .
At these conditions silicon is expected to be in the fluid state, which occurs when dynamically compressed above Turneaure et al. (2018); McBride et al. (2019). Whilst liquid silicon scattering, up to , has been previously observed at XFELs McBride et al. (2019), extracting the contribution from low-Z liquids at high-power laser facilities is experimentally challenging due to limited X-ray source brightness, the presence of fluorescence, spurious scattering from the pinhole, and X-ray emission in the drive ablation plasma. To achieve this we quantified the contribution from the pinhole, ablation plasma and ambient sample. The procedure is described in detail in the Supplementary Material.
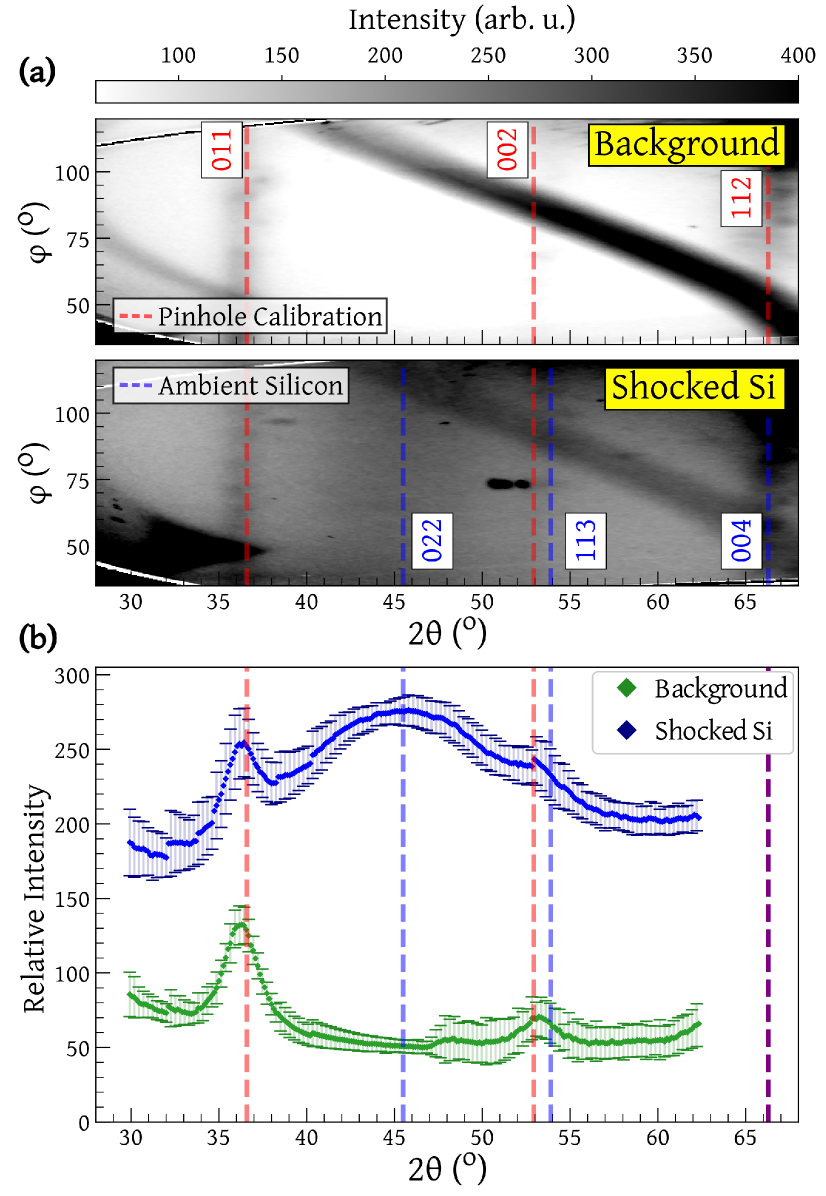
As shown in Figure 2(a), a broad scattering feature, attributed to liquid silicon, is observed around . Due to the PXRDIP’s geometry and the broad band X-ray emission from the laser generated plasma plume, shadows from the box appear on the IP’s, preventing a complete azimuthal integration in -space. Instead, a partial integration is performed by selecting regions with reduced contamination from the aforementioned sources. The resultant signal for a reference shot (s30970), which contained only the pinhole and ablator, and a driven silicon sample (s30967) are shown in Figure 2(b) in green and blue, respectively. The final liquid silicon scattering signal, , shown in Figure 3(a) is obtained by subtracting the reference shot from the driven sample, and excluding the regions around the pinhole Bragg peaks. Further details can be found in the Supplementary Material. A error of is taken to be the average deviation of the observed pinhole Bragg peaks from their expected values.
Additionally, the fraction of shocked (fluid) material within the probe volume was inferred using the ZSPEC diagnostic by comparing data obtained with varying time delays between the drive laser and X-ray probe. As the volume of liquid silicon increases, the elastic scattering signal recorded on the XRTS, fielded in-between Bragg peaks, becomes more intense. From the elastic signal measured on s30967, the volume fraction was found to be (see Supplementary Material). This gives further evidence that the diffuse signal observed on the X-ray diffraction is dominated by liquid-state silicon.
At high momentum transfers the liquid scattering signal is the result of coherent, , incoherent, , and multiple, , scattering. As the silicon thickness is small relative to its attenuation length, is assumed to be negligible. The experimentally measured is therefore related to the normalized ion-ion structure factor, , via Drewitt (2021); Singh et al. (2022),
| (1) |
where , with the form factor of the tightly bound electrons and that of the free electrons that follow the ion motion Chihara (2000). The factor is a scaling constant defined such that . To be experimentally obtained, momentum transfers in excess of are required, a regime not currently accessible at high-power laser facilities. Here, is obtained using the tabulated values from Ref. Hubbell et al. (1975) and is simulated using the multi-component scattering spectra (MCSS) code Chapman (2017). As detailed further in the Supplementary Material, is left proportional to a free random Gaussian scalar with a standard deviation equal to the noise of the raw data.
The large parameter space, , is explored using a Markov-Chain Monte Carlo (MCMC) procedure Kasim et al. (2019); Poole et al. (2022). This uses Bayesian inference to determine the likelihood of a set of parameters producing the experimental spectrum based on an acceptance percentage with
| (2) |
where is the error on , and is a scalar chosen to allow acceptance freedom within data uncertainty. The investigated parameter space assumed a uniform distribution with linear sampling for the density, , ionization, , and temperature, .
Simulating , however, is subject to model biases and requires appropriate selection of electron and ion interactions. Measurement of the liquid structure factor opens the opportunity for direct model comparison. In the partially ionized, low density state, the ion-ion interaction potential, is commonly modeled using Debye-Hückel (DH) Debye and Hückel (1923). This work compares the DH model with the bare (unscreened) effective Coulomb (EC) interaction and a model non-linear Hulthén (NH) interaction Varshni (1990); the latter approximately describes screening beyond the DH approach. For the screening cloud, , large momentum transfers in high-density matter have shown deviation from the simple DH model as a result of finite-wavelength screening (FWS) Chapman et al. (2015). As detailed in the Supplementary Material, the simulated liquid scattering is comparatively insensitive to each model and FWS was chosen for the MCMC analysis.
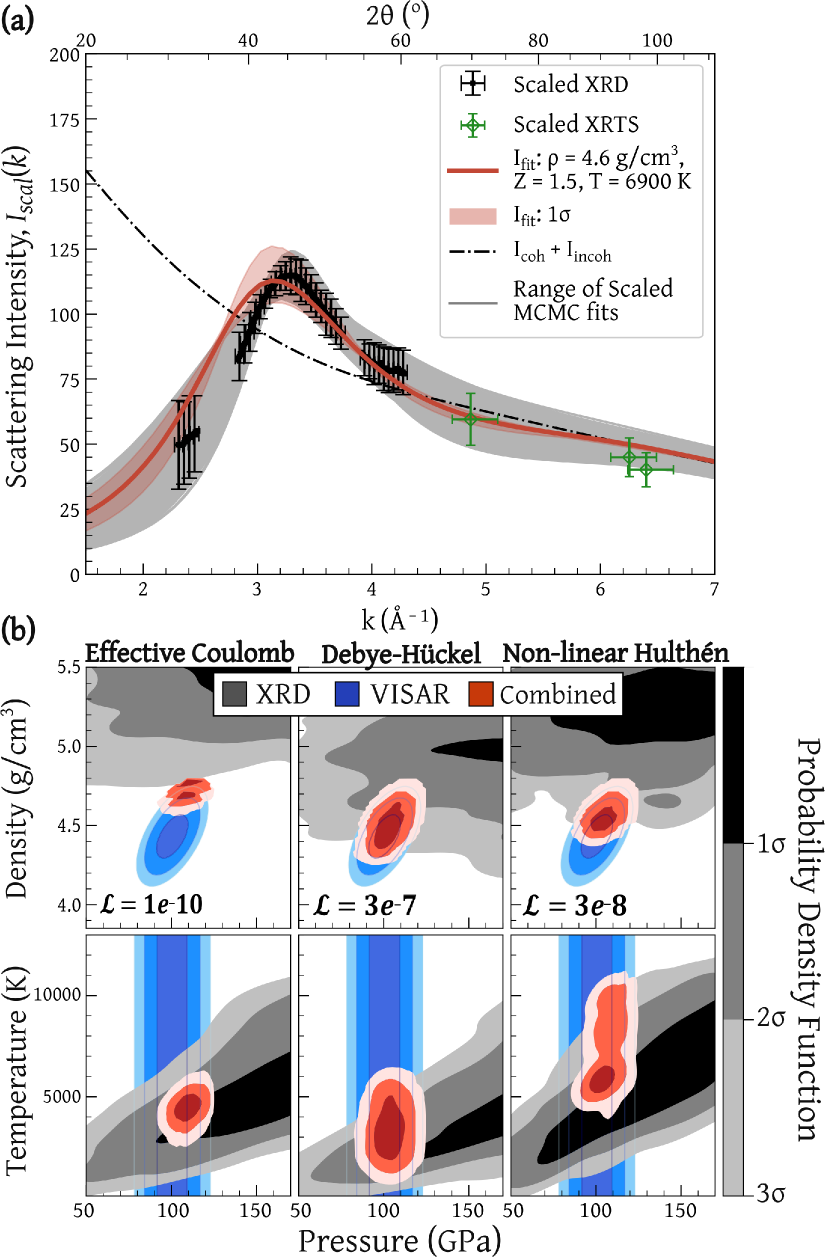
In Figure 3(a) the range of accepted fits after MCMC convergence using the NH model are shown in gray. The signal from the XRTS recorded on shots that were probed after shock breakout (where the liquid volume fraction ) are compared in green against the angularly resolved scattering in Figure 3(a), extending the effective range. They show good agreement with the MCMC results.
Using a suitable theoretical description, the total plasma pressure can be determined from the range of accepted fits. Under conditions of strongly coupled ions and degenerate electrons, in which screening is expected to be significant, a reasonable framework is the ‘two-fluid’ model discussed by Vorberger et al. Vorberger et al. (2013); Ebeling et al. (2020) (see Supplementary Material). The converged probability density functions and , for each ion-ion potential model, are shown in gray in Figure 3(b) and compared, in blue, to the - state inferred using VISAR. We can combine these concurrent diagnostics to find joint - probability density functions which are superimposed in Figure 3(b) as red heat maps.
The likelihood of each ion-ion potential model given the VISAR information is defined as the sum of its joint probability distribution,
| (3) |
where and denote the MCMC and VISAR probability density functions, respectively. These likelihoods are indicated in the upper grid of Figure 3(b). They show that comparatively, the effective-Coulomb model is a poor representation of the liquid silicon state. This is expected as it does not account for screening effects.
Unlike the VISAR diagnostic, the MCMC convergence of the X-ray scattering analysis is dependent not only on pressure and density, but also on temperature. The combined can therefore be propagated into temperature space. This re-distributes the X-ray scattering to penalize where the density and pressure disagree with VISAR. Further details of this process can be found in the Supplementary Material. The resultant are used to find the combined errors in the pressure-temperature phase, shown in red in the lower grid of Figure 3(b). The simulated X-ray diffraction fits, , produced by the conditions inferred when combining VISAR and the NH MCMC convergence are shown in red in Figure 3(a).
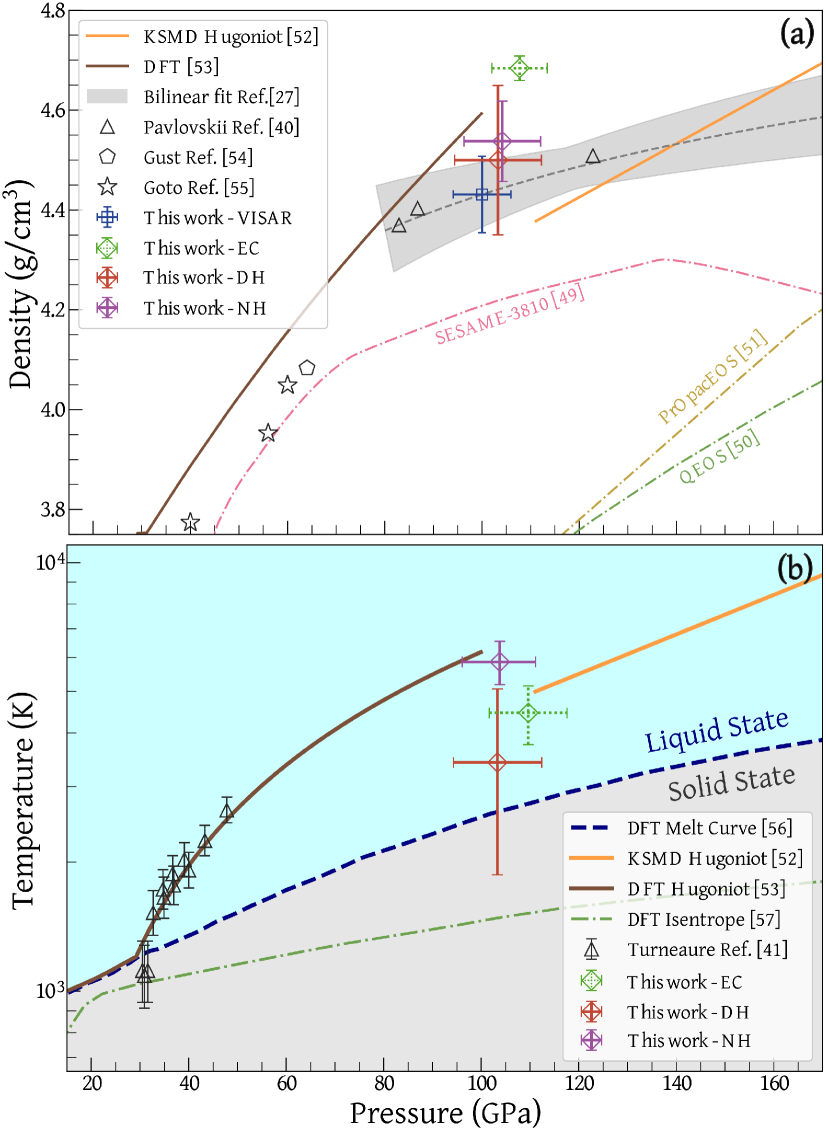
In Figure 4 the VISAR and MCMC combined - and - for each ion-ion potential model are plotted on the principal Hugoniot and compared to density functional theory (DFT) calculations Hu et al. (2016); Paul et al. (2019a), the Si melt Paul et al. (2019b), and previous experimental work. Despite having the closest agreement with VISAR in -, the temperature predicted by the commonly used Debye-Hückel model falls below the Hugoniot state. Instead we find the implementation of a Hulthén potential Varshni (1990), which estimates non-linear screening regimes beyond DH, better describes the thermodynamic conditions.
This report demonstrates how a novel experimental platform at a high-power laser-facility collects detailed information on the structure of shock-compressed matter at HED conditions. Whilst previous work on liquid silicon structure has been limited to pressures of McBride et al. (2019); Turneaure et al. (2018), this platform is highly scalable to different pressures and materials. Our presented analytical technique applied Markov-Chain Monte Carlo analysis to the observed liquid diffraction signal and combined it with the concurrent VISAR - measurement. This provided uncertainties on the shock-compressed state that are equivalent to previous experimental work without relying on EOS models. In addition, this platform enables the investigation of ion-ion interaction potentials. We found that accounting for screening beyond the linear Debye-Hückel approach via a Hulthén potential was required for agreement between the measured liquid silicon state and Hugoniot predictions. This platform therefore facilitates both mapping solid-to-liquid transitions for high pressure states and reducing model selection biases.
Acknowledgements.
This material is based upon work supported by the Department of Energy National Nuclear Security Administration under Award Number DE-NA0003856, the University of Rochester, and the New York State Energy Research and Development Authority and the National Science Foundation under Grant No. PHY-2045718. Part of this work was prepared by LLNL under Contract No. DE-AC52–07NA27344. The PXRDIP data was analyzed with LLNL AnalyzePXRDIP package. This report was prepared as an account of work sponsored by an agency of the U.S. Government. Neither the U.S. Government nor any agency thereof, nor any of their employees, makes any warranty, express or implied, or assumes any legal liability or responsibility for the accuracy, completeness, or usefulness of any information, apparatus, product, or process disclosed, or represents that its use would not infringe privately owned rights. Reference herein to any specific commercial product, process, or service by trade name, trademark, manufacturer, or otherwise does not necessarily constitute or imply its endorsement, recommendation, or favoring by the U.S. Government or any agency thereof. The views and opinions of authors expressed herein do not necessarily state or reflect those of the U.S. Government or any agency thereof.References
- Benuzzi-Mounaix et al. (2014) A. Benuzzi-Mounaix, S. Mazevet, A. Ravasio, T. Vinci, A. Denoeud, M. Koenig, N. Amadou, E. Brambrink, F. Festa, A. Levy, et al., Physica Scripta 2014, 014060 (2014).
- Sharp and DeCarli (2006) T. G. Sharp and P. S. DeCarli, Meteorites and the early solar system II 943, 653 (2006).
- Graziani et al. (2014) F. Graziani, M. P. Desjarlais, R. Redmer, and S. B. Trickey, Frontiers and challenges in warm dense matter, vol. 96 (Springer Science & Business, 2014).
- Craxton et al. (2015) R. S. Craxton, K. S. Anderson, T. R. Boehly, V. N. Goncharov, D. R. Harding, J. P. Knauer, R. L. McCrory, P. W. McKenty, D. D. Meyerhofer, J. F. Myatt, et al., Physics of Plasmas 22, 110501 (2015).
- Hu et al. (2018a) S. X. Hu, L. A. Collins, T. R. Boehly, Y. H. Ding, P. B. Radha, V. N. Goncharov, V. V. Karasiev, G. W. Collins, S. P. Regan, and E. M. Campbell, Physics of Plasmas 25, 056306 (2018a).
- Landeau et al. (2022) M. Landeau, A. Fournier, H.-C. Nataf, D. Cébron, and N. Schaeffer, Nature Reviews Earth & Environment 3, 255 (2022).
- Badro et al. (2014) J. Badro, A. S. Côté, and J. P. Brodholt, Proceedings of the National Academy of Sciences 111, 7542 (2014).
- Soubiran et al. (2017) F. Soubiran, B. Militzer, K. P. Driver, and S. Zhang, Physics of Plasmas 24, 041401 (2017).
- de Wijs et al. (1998) G. A. de Wijs, G. Kresse, L. Vočadlo, D. Dobson, D. Alfe, M. J. Gillan, and G. D. Price, Nature 392, 805 (1998).
- Glenzer et al. (2016) S. H. Glenzer, L. B. Fletcher, E. Galtier, B. Nagler, R. Alonso-Mori, B. Barbrel, S. B. Brown, D. A. Chapman, Z. Chen, C. B. Curry, et al., Journal of Physics B: Atomic, Molecular and Optical Physics 49, 092001 (2016).
- Koenig et al. (2005) M. Koenig, A. Benuzzi-Mounaix, A. Ravasio, T. Vinci, N. Ozaki, S. Pape, D. Batani, G. Huser, T. Hall, D. Hicks, et al., Plasma Physics and Controlled Fusion 47, B441 (2005).
- Wünsch et al. (2011) K. Wünsch, J. Vorberger, G. Gregori, and D. O. Gericke, Europhysics Letters 94, 25001 (2011).
- Fletcher et al. (2015) L. B. Fletcher, H. J. Lee, T. Döppner, E. Galtier, B. Nagler, P. Heimann, C. Fortmann, S. L. Pape, T. Ma, M. Millot, et al., Nature photonics 9, 274 (2015).
- McBride et al. (2019) E. E. McBride, A. Krygier, A. Ehnes, E. Galtier, M. Harmand, Z. Konôpková, H. J. Lee, H.-P. Liermann, B. Nagler, A. Pelka, et al., Nature Physics 15, 89 (2019).
- Guillot (1999) T. Guillot, Science 286, 72 (1999).
- Hurricane et al. (2019) O. A. Hurricane, P. T. Springer, P. K. Patel, D. A. Callahan, K. Baker, D. T. Casey, L. Divol, T. Döppner, D. E. Hinkel, M. Hohenberger, et al., Physics of Plasmas 26, 052704 (2019).
- Bonitz et al. (2020) M. Bonitz, T. Dornheim, Z. A. Moldabekov, S. Zhang, P. Hamann, H. Kählert, A. Filinov, K. Ramakrishna, and J. Vorberger, Physics of Plasmas 27, 042710 (2020).
- Hu et al. (2018b) S. X. Hu, W. Theobald, P. B. Radha, J. L. Peebles, S. P. Regan, A. Nikroo, M. J. Bonino, D. R. Harding, V. N. Goncharov, N. Petta, et al., Physics of Plasmas 25, 082710 (2018b).
- Kraus et al. (2016) D. Kraus, D. A. Chapman, A. L. Kritcher, R. A. Baggott, B. Bachmann, G. W. Collins, S. H. Glenzer, J. A. Hawreliak, D. H. Kalantar, O. L. Landen, et al., Physical Review E 94, 011202(R) (2016).
- Davis et al. (2016) P. Davis, T. Döppner, J. R. Rygg, C. Fortmann, L. Divol, A. Pak, L. Fletcher, A. Becker, B. Holst, P. Sperling, et al., Nature communications 7, 11189 (2016).
- Regan et al. (2012) S. P. Regan, K. Falk, G. Gregori, P. B. Radha, S. X. Hu, T. R. Boehly, B. J. B. Crowley, S. H. Glenzer, O. L. Landen, D. O. Gericke, et al., Physical review letters 109, 265003 (2012).
- Lee et al. (2009) H. J. Lee, P. Neumayer, J. Castor, T. Döppner, R. W. Falcone, C. Fortmann, B. A. Hammel, A. L. Kritcher, O. L. Landen, R. W. Lee, et al., Physical review letters 102, 115001 (2009).
- Lazicki et al. (2015) A. Lazicki, J. R. Rygg, F. Coppari, R. Smith, D. Fratanduono, R. G. Kraus, G. W. Collins, R. Briggs, D. G. Braun, D. C. Swift, et al., Physical review letters 115, 075502 (2015).
- Coppari et al. (2022) F. Coppari, D. E. Fratanduono, M. Millot, R. G. Kraus, A. Lazicki, J. R. Rygg, R. F. Smith, and J. H. Eggert, Physical Review B 106, 134105 (2022).
- Rygg et al. (2012) J. R. Rygg, J. H. Eggert, A. E. Lazicki, F. Coppari, J. A. Hawreliak, D. G. Hicks, R. F. Smith, C. M. Sorce, T. M. Uphaus, B. Yaakobi, et al., Review of Scientific Instruments 83, 113904 (2012).
- Gong et al. (2023) X. Gong, D. N. Polsin, R. Paul, B. J. Henderson, J. H. Eggert, F. Coppari, R. F. Smith, J. R. Rygg, and G. W. Collins, Physical Review Letters 130, 076101 (2023).
- Henderson et al. (2021) B. J. Henderson, M. C. Marshall, T. R. Boehly, R. Paul, C. A. McCoy, S. X. Hu, D. N. Polsin, L. E. Crandall, M. F. Huff, D. A. Chin, et al., Physical Review B 103, 094115 (2021).
- Falk et al. (2013) K. Falk, S. P. Regan, J. Vorberger, B. J. B. Crowley, S. H. Glenzer, S. X. Hu, C. D. Murphy, P. B. Radha, A. P. Jephcoat, J. S. Wark, et al., Physical Review E 87, 043112 (2013).
- Davies et al. (2020) E. J. Davies, P. J. Carter, S. Root, R. G. Kraus, D. K. Spaulding, S. T. Stewart, and S. B. Jacobsen, Journal of Geophysical Research: Planets 125, e2019JE006227 (2020).
- Hirose et al. (2017) K. Hirose, G. Morard, R. Sinmyo, K. Umemoto, J. Hernlund, G. Helffrich, and S. Labrosse, Nature 543, 99 (2017).
- Huser et al. (2018) G. Huser, N. Ozaki, P. Colin-Lalu, V. Recoules, T. Sano, Y. Sakawa, K. Miyanishi, and R. Kodama, Physics of Plasmas 25, 052706 (2018).
- Edwards et al. (2011) M. J. Edwards, J. D. Lindl, B. K. Spears, S. V. Weber, L. J. Atherton, D. L. Bleuel, D. K. Bradley, D. A. Callahan, C. J. Cerjan, D. Clark, et al., Physics of Plasmas 18, 051003 (2011).
- Hu et al. (2012) S. X. Hu, G. Fiksel, V. N. Goncharov, S. Skupsky, D. D. Meyerhofer, and V. A. Smalyuk, Physical Review Letters 108, 195003 (2012).
- Fiksel et al. (2012) G. Fiksel, S. X. Hu, V. A. Goncharov, D. D. Meyerhofer, T. C. Sangster, V. A. Smalyuk, B. Yaakobi, M. J. Bonino, and R. Jungquist, Physics of Plasmas 19, 062704 (2012).
- Meyerhofer et al. (2010) D. D. Meyerhofer, J. Bromage, C. Dorrer, J. H. Kelly, B. E. Kruschwitz, S. J. Loucks, R. L. McCrory, S. F. B. Morse, J. F. Myatt, P. M. Nilson, et al., Journal of Physics: Conference Series 244, 032010 (2010).
- Coppari et al. (2019) F. Coppari, R. F. Smith, D. B. Thorn, J. R. Rygg, D. A. Liedahl, R. G. Kraus, A. Lazicki, M. Millot, and J. H. Eggert, Review of Scientific Instruments 90, 125113 (2019).
- Meadowcroft et al. (2008) A. L. Meadowcroft, C. D. Bentley, and E. N. Stott, Review of scientific instruments 79, 113102 (2008).
- Rygg et al. (2020) J. R. Rygg, R. F. Smith, A. E. Lazicki, D. G. Braun, D. E. Fratanduono, R. G. Kraus, J. M. McNaney, D. C. Swift, C. E. Wehrenberg, F. Coppari, et al., Review of Scientific Instruments 91, 043902 (2020).
- Celliers and Millot (2023) P. M. Celliers and M. Millot, Review of Scientific Instruments 94 (2023).
- Pavlovskii (1968) M. N. Pavlovskii, Soviet Physics Solid State 9, 2514 (1968).
- Turneaure et al. (2018) S. J. Turneaure, S. M. Sharma, and Y. M. Gupta, Physical review letters 121, 135701 (2018).
- Drewitt (2021) J. W. E. Drewitt, Journal of Physics: Condensed Matter 33, 503004 (2021).
- Singh et al. (2022) S. Singh, A. L. Coleman, S. Zhang, F. Coppari, M. G. Gorman, R. F. Smith, J. H. Eggert, R. Briggs, and D. E. Fratanduono, Journal of Synchrotron Radiation 29, 1033 (2022).
- Chihara (2000) J. Chihara, Journal of Physics: Condensed Matter 12, 231 (2000).
- Hubbell et al. (1975) J. H. Hubbell, W. J. Veigele, E. A. Briggs, R. T. Brown, D. T. Cromer, and R. J. Howerton, Journal of physical and chemical reference data 4, 471 (1975).
- Chapman (2017) D. A. Chapman, User Guide and Theoretical Basis for the Multi-Component Scattering Spectra (MCSS) Thomson Scattering Analysis Code (AWE, 2017).
- Kasim et al. (2019) M. Kasim, T. P. Galligan, J. Topp-Mugglestone, G. Gregori, and S. M. Vinko, Physics of Plasmas 26, 112706 (2019).
- Poole et al. (2022) H. Poole, R. E. D. Cao, I. Golovkin, T. Walton, S. X. Hu, M. Kasim, S. M. Vinko, J. R. Rygg, V. N. Goncharov, G. Gregori, et al., Physics of Plasmas 29, 072703 (2022).
- Bennett et al. (1978) B. I. Bennett, J. D. Johnson, G. I. Kerley, and G. T. Rood, Los Alamos National Laboratory, Los Alamos, NM pp. LA–7130 (1978).
- More et al. (1988) R. M. More, K. H. Warren, D. A. Young, and G. B. Zimmerman, The Physics of fluids 31, 3059– (1988).
- MacFarlane et al. (2006) J. J. MacFarlane, I. E. Golovkin, and P. R. Woodruff, Journal of Quantitative Spectroscopy and Radiative Transfer 99, 381 (2006).
- Hu et al. (2016) S. X. Hu, B. Militzer, L. A. Collins, K. P. Driver, and J. D. Kress, Physical Review B 94, 094109 (2016).
- Paul et al. (2019a) R. Paul, S. X. Hu, and V. V. Karasiev, Physical Review B 100, 144101 (2019a).
- Gust and Royce (1971) W. H. Gust and E. B. Royce, Journal of Applied Physics 42, 1897 (1971).
- Goto et al. (1982) T. Goto, T. Sato, and Y. Syono, Japanese Journal of Applied Physics 21, L369 (1982).
- Paul et al. (2019b) R. Paul, S. X. Hu, and V. V. Karasiev, Physical Review Letters 122, 125701 (2019b).
- Paul (2022) R. Paul, Private Communication (2022).
- Strickson and Artacho (2016) O. Strickson and E. Artacho, Physical Review B 93, 094107 (2016).
- Debye and Hückel (1923) P. Debye and E. Hückel, Physikalische Zeitschrift 24, 185 (1923).
- Varshni (1990) Y. P. Varshni, Physical Review A 41, 4682 (1990).
- Chapman et al. (2015) D. A. Chapman, J. Vorberger, L. B. Fletcher, R. A. Baggott, L. Divol, T. Döppner, R. W. Falcone, S. H. Glenzer, G. Gregori, T. M. Guymer, et al., Nature communications 6, 6839 (2015).
- Vorberger et al. (2013) J. Vorberger, D. O. Gericke, and W.-D. Kraeft, High Energy Density Physics 9, 448 (2013).
- Ebeling et al. (2020) W. Ebeling, H. Reinholz, and G. Röpke, The European Physical Journal Special Topics 229, 3403 (2020).