Recovering lost light: discovery of supernova remnants with integral field spectroscopy
Abstract
We present results from a systematic search for broad ( 400 ) H emission in Integral Field Spectroscopy data cubes of 1200 nearby galaxies obtained with PMAS and MUSE. We found 19 unique regions that pass our quality cuts, four of which match the locations of previously discovered SNe: one Type IIP, and three Type IIn, including the well-known SN 2005ip. We suggest that these objects are young Supernova Remnants, with bright and broad H emission powered by the interaction between the SN ejecta and dense circumstellar material. The stellar ages measured at the location of these SNR candidates are systematically lower by about 0.5 dex than those measured at the location of core collapse SNe, implying that their progenitors might be shorter lived and therefore more massive than a typical CC SN progenitor. The methods laid out in this work open a new window into the study of nearby SNe with Integral Field Spectroscopy.
1 Introduction
Supernovae (SNe) are energetic stellar explosions that mark the endpoints in the life of certain types of stars. Although they are rare events, occurring once or twice per century in a typical galaxy, SNe are essential to understanding the chemical evolution of the Universe (Kobayashi et al., 2006; Andrews et al., 2016; Prantzos et al., 2018) and the injection of energy into the interstellar medium (ISM, Thornton et al., 1998). This local deposition of energy plays a crucial role in galaxy evolution, triggering star formation (Stinson et al., 2006; Dalla Vecchia & Schaye, 2012; Hopkins et al., 2014) and seeding and sustaining turbulence (Mac Low & Klessen, 2004).
Our understanding of the role that SNe play in the ecology of the ISM is limited by the many questions that remain open about their stellar progenitors. The baseline physical scenarios for the two major classes of SNe posit that core collapse (CC) SNe arise from gravitational collapse in the cores of stars more massive than M⊙, and Type Ia SNe are the aftermath of a thermonuclear runaway ignited in the central regions of massive CO white dwarfs (WDs) that are somehow destabilized by accretion in close binary systems. However, many important details of these scenarios remain obscure, including the role played by binary interactions and pre-explosion progenitor mass loss in CCSNe (Smartt, 2009; Smith, 2014), and the specific identity of the progenitors in SN Ia (Maoz et al., 2014). As a result, we have not been able to fully characterize fundamental properties that regulate the feedback mechanism into the ISM, like the distribution of progenitor masses and delay times (Badenes et al., 2009; Jennings et al., 2014; Zapartas et al., 2017; Auchettl et al., 2019; Strolger et al., 2020; Castrillo et al., 2021) or the detailed nucleosynthetic yields (Romano et al., 2010; Andrews et al., 2017).
Recent advances in astronomical instrumentation have opened new opportunities to explore these issues. In particular, the wide availability of data from Integral Field Spectroscopy (IFS) makes it possible to study the properties of the host galaxies of SNe with an unprecedented level of detail, revealing a wealth of information on the environments in which SN explode (e.g. Stanishev et al. 2012; Kuncarayakti et al. 2013a, b; Rigault et al. 2013; Galbany et al. 2014, 2016a, 2016b, 2017; Krühler et al. 2017; Galbany et al. 2018a; Kuncarayakti et al. 2018; Lyman et al. 2018; Rigault et al. 2018; Lyman et al. 2020). Previous IFS studies of SNe have relied on dedicated SN surveys and literature searches to identify SN host galaxies and locate their explosion sites. Here, we describe the first results of an effort to use the IFS observations themselves to discover recent SNe. This is possible because some SNe undergo strong interaction with a dense circumstellar medium (CSM) shortly after the explosion, leading to large luminosities that can be sustained for a long time (Milisavljevic & Fesen, 2017; Dessart et al., 2023). These objects are often described as transitional, between SNe and Supernova Remnants (SNRs), and range from young SNe with clear evidence of CSM interaction such as SN 1993J (Fransson et al., 1996; Matheson et al., 2000), SN1996cr (Bauer et al., 2008; Quirola-Vásquez et al., 2019), and SN 1978K (Kuncarayakti et al., 2016) to SNRs like Cas A, which remain optically bright centuries after the explosion (Milisavljevic et al., 2012). For clarity, we will refer to this class of objects as young SNRs. Our work is motivated by the fact that some of these young SNRs are luminous enough to stand out in narrow-band images of their host galaxies (e.g., SNR NGC4449, Milisavljevic & Fesen, 2008), and in principle could be picked up serendipitously in IFS observations of nearby galaxies. To explore this possibility, we have conducted a systematic search for regions in IFS data cubes that are characterized by bright H line emission with a significant broad component ( 400 km s-1) that could be associated with CSM interaction.
This paper is organized as follows. In Section 2, we describe the IFS data that constitute our initial sample. In Section 3, we outline the methods we have employed to identify candidate young SNRs. In Section 4, we discuss the main properties of our sample of young SNR candidates. In Section 5 we comment on our results and discuss possible avenues for future research.
2 Observations
Our initial sample is constituted by IFS observations of nearby galaxies obtained using two different instruments:
-
(i)
the Potsdam Multi Aperture Spectograph (PMAS; Roth et al. 2005) in PPak mode (Verheijen et al., 2004; Kelz et al., 2006), mounted on the 3.5 m telescope of the Centro Astronomico Hispano-Aleman (CAHA) at the Calar Alto Observatory. PPak consists of a fiber bundle of 382 fibers with 2.7” diameter. Among these, 331 are ordered in a single hexagonal bundle, with the remaining fibers used for sky measurements and calibration purposes. Most objects are observed with two overlapping setups and then combined. The V500 grating has a spectral resolution of 6 Å in the wavelength range 37507300 Å. The V1200 grating has a higher spectral resolution of 2.7 Å, with a bluer range spanning 3400-4750 Å. The final products are 3D datacubes with a 100% covering factor within a hexagonal FoV of 1.3 arcmin2 with 1”1” pixels, which correspond to 4000 spectra per object.
-
(ii)
the Multi-Unit Spectroscopic Explorer (MUSE; Bacon et al. 2014), located at the Nasmyth B focus of Yepun, the VLT UT4 telescope at Cerro Paranal Observatory. It has a modular structure composed of 24 identical IFU modules that together sample, in Wide Field Mode (WFM), a near-contiguous 1 arcmin2 FoV with spaxels of 0.2 0.2 arcsec, and a wavelength coverage of 4650-9300 Å with a mean resolution of R 3000. MUSE produces 100,000 spectra per pointing.
Observations obtained with PMAS come in their majority from the 3rd data release of the Calar Alto Legacy Integral Field Area survey (CALIFA; Sánchez et al. 2012, 2016). The PMAS sample consists of 667 galaxies selected from DR7 of the Sloan Digital Sky Survey (SDSS, Abazajian et al., 2009) with redshifts between 0.005 and 0.03, declinations -7∘, and diameters between 45” and 79.2”. These selection criteria are optimized for the PMAS/PPak instrument. We added to this sample data from the PMAS/PPak Integral field Supernova hosts COmpilation (PISCO; Galbany et al. 2018a), an extended project of CALIFA that aimed at increasing the sample of supernova host galaxies used for environmental studies (Galbany et al., 2014, 2016b). As of January 2020, the PISCO sample contained 220 galaxies, bringing the total PMAS sample to 887 galaxies.
Observations obtained with MUSE come in its totality from the All-weather MUse Supernova Integral-field of Nearby Galaxies (AMUSING; Galbany et al. 2016a; Galbany et al. in prep.) survey. This survey has been running for 11 semesters (P95-P106) with the focus of obtaining IFS of SN host galaxies, each semester with a different science focus including among others: hosts of SNe that showed strong sodium absorption lines in their spectra indicating the presence of large amounts of dust; hosts of SNe discovered by the ASASSN-SN survey to study SN rates as a function of local environment (Pessi et al., 2023); SN hosts with low surface brightness (Holoien et al., 2022); hosts of SNe included in the Carnegie Supernova Project (CSP; Phillips et al. 2019) sample. The compilation used in this work consisted of 342 nearby SN host galaxies.
3 Detection method
3.1 Pre-processing
All IFS datacubes are pre-processed in preparation for the analysis. First, regions with foreground stars are masked out. Then, single stellar population (SSP) synthesis models are fit to all individual spectra (around 4,000 and 100,000 spectra per PMAS and MUSE cube, respectively) to separate the underlying stellar continuum from the ionized gas-phase emission. This is done with STARLIGHT (Cid Fernandes et al., 2005, 2009), which determines the fractional contribution of different SSP models to the spectrum, , and to the galaxy mass, . STARLIGHT accounts for dust extinction () as a foreground screen, using a reddening law from Cardelli et al. (1989) that assumes =3.1. To reduce computing time, we used a reduced grid of 248 SSP models from Cid Fernandes et al. (2013), with 62 ages spanning 1 Myr to 14 Gyr and four metallicities (0.2, 0.4, 1.0, and 1.5 solar). The best fit model is subtracted from each observed spectrum and the resulting residual is stored in a 3D cube containing only the ionized gas-phase emission.
The resulting residual spectra are mostly flat, dominated by the narrow line emission from the host galaxy. We fit the most prominent lines (H, [O iii] 5007, [O iii] 4969, [N ii] 6548,84, H, [S ii] 6719,31) with the Python version of MPFIT (Markwardt, 2009, 2012; Newville et al., 2016), which performs non-linear least-squares fitting using the Levenberg-Marquardt minimization algorithm (Levenberg, 1944; Marquardt, 1963). For each residual spectrum, we focus on the wavelength range corresponding to each line and fit it using a Gaussian profile to retrieve line fluxes, central wavelengths, velocity shifts and widths, and their corresponding errors. When required, more than one Gaussian is fitted simultaneously for transitions that are close to one another (H with the two [N ii], the two [S ii], and H with [O iii]).
We correct all the fitted line fluxes for reddening intrinsic to the host galaxy by measuring the H to H ratio and applying an extinction law from Cardelli et al. (1989), assuming , Case B recombination, and densities of 103 cm-3 around a heating source with T104 K and a large optical depth (Osterbrock & Ferland, 2006). We note that the extinction correction and the selection of a particular extinction law do not affect the method we use to detect young SNR candidates.
3.2 Line emission from young SNRs in IFS data: an illustrative example
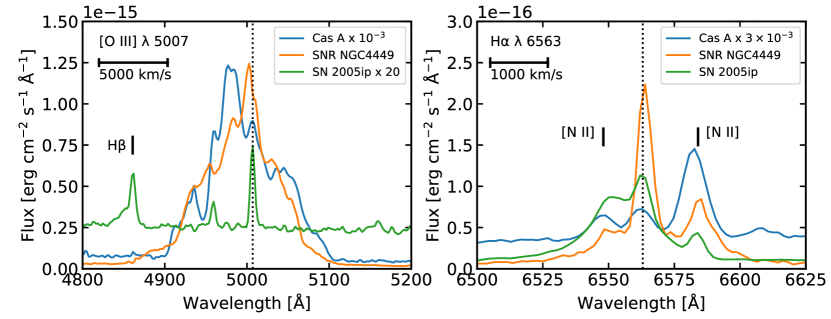
Young SNRs have distinctive optical spectra. In Figure 1 we show the integrated line emission in two spectral windows around the [O iii] 5007 and H lines from the Galactic SNR Cas A (age 340 yr, Thorstensen et al. 2001, Milisavljevic et al. 2012, the SNR in NGC 4449 (age 80 yr, Milisavljevic & Fesen 2008, Bietenholz et al. 2010), and SN 2005ip (age 17 yr), which we use as an illustrative example of a young SNR imaged by our IFS data. SN 2005ip is a bright, well-observed Type IIn SN that exploded in NGC 2906 (Fox et al., 2009, 2010) and has been showing signs of strong CSM interaction and enhanced dust formation for well over a decade (Smith et al., 2009; Stritzinger et al., 2012; Katsuda et al., 2014; Smith et al., 2017; Bevan et al., 2019; Fox et al., 2020). All three objects show bright emission in both lines, with Cas A and SNR NGC4449 being brighter in [O iii], and SN 2005ip being brighter in H. The H emission is noticeably broadened by several hundred due to shock interactions in all three objects, although in all cases this broad emission appears superimposed on several components of narrow emission from H and the neighboring [N ii] 6548,84 doublet. The [O iii] 5007 line is broadened by several thousand in both Cas A and SNR NGC4449, but the spectrum from SN 2005ip appears much narrower, even if the neighboring H line has a clear blueshifted broad component.
A detailed physical interpretation of the line emission from young SNRs is outside the scope of the present work. In particular, the mapping between shock physics and line emission is likely to be complex - we note that our IFS data only provide an unresolved view of objects that probably have a great deal of spatial structure, which can only be studied in detail in nearby cases like Cas A (Milisavljevic et al., 2012; Milisavljevic & Fesen, 2015). We refer the reader to Fransson et al. (2002) and Milisavljevic et al. (2012) for further details. For our purposes, the qualitative comparisons shown in Figure 1 are enough to illustrate the ability of IFS data cubes to recover young SNe with strong CSM interaction.
| Date | FWHMBroad | FWHMIntermediate |
|---|---|---|
| MJD | [km s-1] | [km s-1] |
| 53697 | 13625.0 1899.9 | 2936.1 1982.2 |
| 53698 | 13936.1 2031.7 | 2299.7 1302.9 |
| 53699 | 13556.2 1865.8 | 2310.0 1218.9 |
| 53722 | 13393.3 1891.5 | 2250.6 1360.3 |
| 53724 | 13841.3 2005.5 | 2245.7 1399.2 |
| 53725 | 14133.7 1994.1 | 2317.4 1472.2 |
| 53727 | 13947.9 1910.5 | 2508.1 1663.6 |
| 53751 | 12507.7 1544.1 | 2245.2 1128.8 |
| 53759 | 11121.5 1325.6 | 1965.7 714.0 |
| 53799 | 10085.8 1587.2 | 2113.0 848.7 |
| 53809 | 9507.8 538.9 | 2142.5 525.7 |
| 53817 | 9037.8 670.6 | 2204.2 670.6 |
| 53848 | 8458.0 681.1 | 2099.8 681.1 |
| 53852 | 8272.0 703.5 | 2093.0 488.3 |
| 54092 | 2026.7 339.4 | |
| 54415 | 1677.9 364.9 | |
| 54584 | 1579.7 302.2 | |
| 55267 | 1466.1 331.9 | |
| 55510 | 1332.2 342.5 | |
| 55574 | 1361.9 264.4 | |
| 55928 | 1444.0 328.0 | |
| 56030 | 1522.7 379.8 | |
| 56033 | 1477.5 351.7 | |
| 56255 | 1421.3 262.1 | |
| 56273 | 1559.6 636.9 | |
| 56778 | 1639.7 392.9 | |
| 56783 | 1320.4 350.6 | |
| 57103 | 1381.5 321.0 | |
| 57346 | 1430.7 352.9 | |
| 57372 | 1273.6 238.6 | |
| 57433 | 1314.2 262.8 | |
| 57449 | 1318.3 310.4 |
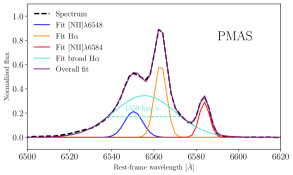
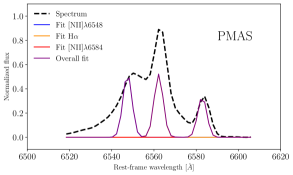
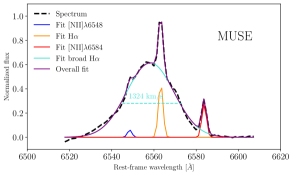
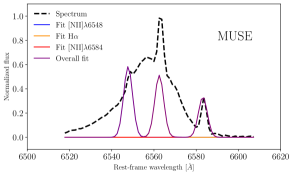
Detailed fits to the line emission from the PMAS and MUSE residual spectra around H at the location of SN 2005ip are shown in Figure 2. The default fits to the narrow line emission from the host galaxy are shown on the right panels. The three narrow Gaussians for H and the [N ii] doublet emission miss much of the measured flux, and try to compensate for this by overfitting the [N ii] line at 6548 Å, resulting in an unphysical flux ratio for the [N ii] doublet. The addition of a fourth Gaussian corresponding to a broad H component associated with SN 2005ip greatly improves the spectral fit, accounting for all the observed flux and recovering the correct flux ratio for the narrow component of the [N ii] doublet. The width of this component in the IFS data cubes is Å and Å, which correspond to FWHM velocities of 1550637 and 1324351 , respectively.
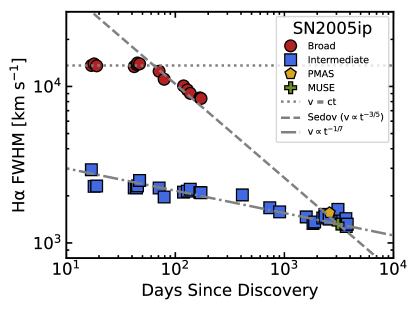
To evaluate our IFS observations of SN 2005ip in context, we have compiled the 30 single-slit spectra of the SN analyzed by Smith et al. (2009) and Smith et al. (2017), which span ages between 17 days and more than 10 years after discovery. As noted in these references, the broad H emission from SN 2005ip has at least two components, which evolve in distinct ways (see e.g. Figure 5 in Smith et al. 2009). In Table 1, we list fitted FWHM values for these two components, which we have labeled ’broad’ and ’intermediate’, in the single-slit spectra of SN 2005ip. The overall temporal evolution of these FWHM values is shown in Figure 3, together with our IFS observations. The broadest of the two components is only seen clearly in spectra taken before April 2006 (MJD 53852, or 172 days after discovery, see Table 1), but the intermediate component is always present. The evolution of the broad component shows an initial free expansion ( ct) phase, with a clear transition to a Sedov regime () approximately 60 days after the explosion. This early transition to a Sedov regime, which happened while the SN was still optically bright, is consistent with the hypothesis that the SN progenitor lost a large amount of mass shortly before the explosion (see Moriya et al., 2013, for a discussion). The intermediate component, on the other hand, shows a slower deceleration, roughly as . The physical interpretation for the behavior of the intermediate component is less clear, but we emphasize that our IFS measurements are broadly consistent with those obtained from contemporary single-slit spectra, showcasing the ability of galaxy-wide IFS data sets to study bright young SNRs and obtain physically meaningful measurements from them.
| Host Galaxy | Redshift | Survey | RA | DEC | |||
|---|---|---|---|---|---|---|---|
| [] | [] | [] | |||||
| LEDA 43070aaASAS-SN 14fd (Holoien et al., 2019) | 0.0158 | MUSE | 12:46:14.75 | -40:48:52.59 | |||
| 2MASX J23331223-6034201 | 0.0148 | MUSE | 23:33:10.63 | -60:34:29.87 | |||
| LEDA 1015413 | 0.0131 | MUSE | 12:54:12.58 | -07:38:37.19 | |||
| NGC 2906bbSN 2005ip (Fox et al., 2009; Smith et al., 2009) | 0.0074 | MUSE | 09:32:06.42 | +08:26:44.53 | |||
| NGC 4806ccSN2011fh (Pessi et al., 2022) | 0.0082 | MUSE | 12:56:14.02 | -29:29:54.74 | |||
| ESO 467-51ddASAS-SN 14jb (Holoien et al., 2019) | 0.0060 | MUSE | 22:23:16.15 | -28:58:31.17 | |||
| NGC 1448 | 0.0037 | MUSE | 03:44:30.39 | -44:38:50.48 | |||
| Arp 142 | 0.0233 | PMAS | 09:37:42.50 | +02:45:26.76 | |||
| MCG +11-08-25 | 0.0136 | PMAS | 06:15:48.81 | +66:50:21.60 | |||
| NGC 1056 | 0.0052 | PMAS | 02:42:47.98 | +28:34:27.41 | |||
| NGC 2276 | 0.0081 | PMAS | 07:27:07.12 | +85:44:35.71 | |||
| NGC 2906bbSN 2005ip (Fox et al., 2009; Smith et al., 2009) | 0.0074 | PMAS | 09:32:06.47 | +08:26:44.94 | |||
| NGC 5633 | 0.0078 | PMAS | 14:27:27.69 | +46:08:36.14 | |||
| NGC 5735 | 0.0125 | PMAS | 14:42:34.95 | +28:43:38.18 | |||
| NGC 5908eeCoincides with SN impostor reported in 2012, PSNJ15164204+5525011 (Benetti et al., 2012) | 0.0110 | PMAS | 15:16:42.08 | +55:24:59.85 | |||
| NGC 6946 | 0.0001 | PMAS | 20:34:51.87 | +60:12:52.70 | |||
| UGC 04179 | 0.0186 | PMAS | 08:02:07.59 | +00:48:27.79 | |||
| UGC 09110 | 0.0156 | PMAS | 14:14:12.55 | +15:37:04.78 | |||
| UGC 09182 | 0.0155 | PMAS | 14:20:45.95 | +21:56:16.12 | |||
| MCG +03-31-094 | 0.0030 | PMAS | 12:17:26.07 | +17:39:16.06 |
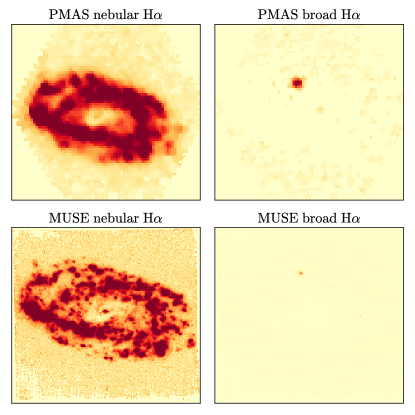
The broad component to the H emission associated with SN 2005ip does not appear at any other location in the IFS data cubes for the host galaxy NGC 2906. To illustrate this, we added a broad emission component to the fits to the residual spectra in the H region for all spaxels, in addition to the narrow H and the two narrow [N ii] lines. This broad component has a minimum width of 400 , but no minimum amplitude, so that MPFIT returns a zero value for the amplitude when the spectral fit does not require it. For the reminder of the paper, we will not distinguish between ’broad’ and ’intermediate’ components to the H line emission, as defined in the case of SN 2005ip, but will use the notation ’broad’ to describe any contribution to the line flux that is clearly broader than usual (i.e., that is not kinematically narrow). Figure 4 shows the flux maps for NGC 2906 generated by this procedure for both the narrow (left column) and broad (right column) H components, in the PMAS (top row) and MUSE (bottom row) data. The narrow component is distributed throughout the entire disk of the galaxy, showcasing emission from individual HII regions, but the broad component is restricted exclusively to the location of SN 2005ip. Note how the higher spatial resolution of MUSE (0.2” compared to 1” for PMAS) allows to accurately pinpoint the site of the SN.
Without spatial coincidence with a previously recorded SN, as seen here for SN 2005ip, it is impossible to determine with absolute confidence that a region showing broad line emission in an IFS data cube is in fact a young SNR. In general, broad line emission in IFS data cubes is often associated with Active Galactic Nuclei in the central regions (see e.g. Papaderos et al. 2013; Singh et al. 2013; Lacerda et al. 2020). Off-center broad line emission has been associated with sources like stellar outflows from supergiants or Wolf-Rayet clusters (e.g. Diaz et al. 1987, Terlevich et al. 1991, Kehrig et al. 2020), but the vast majority of these examples have low luminosities, which would be hard to disentangle from the background in IFS data cubes, and modest widths, with FWHM below 200 . In rare cases, bright H emission with FWHM in excess of 1000 has been reported in single-slit spectra, like the giant HII region NGC 5471 in M101 (Castaneda et al., 1990). For this specific example, follow-up X-ray observations indicate the presence of at least one SNR at this location (Williams & Chu, 1995). Of course, larger scale ionized flows outflows have been found in starburst and post-starburst galaxies like the ‘green peas’ (Rodríguez Del Pino et al., 2019; Amorín et al., 2012; Hogarth et al., 2020), but these outflows will not appear as high contrast point sources like the IFS detection of SN 2005ip shown in Figure 4.
4 A systematic search for young SNRs in IFS data
4.1 Search method
The illustrative example of SN 2005ip demonstrates that IFS data cubes have the potential to both recover emission from young SNRs and extract relevant physical information about them. Motivated by this realization, we have conducted a systematic search for broad H emission in all the IFS data of all the nearby galaxies in our sample. To do this, we defined a set of criteria designed to single out young SNR candidates without making strong assumptions about the specific properties of their line emission. First, we require a minimum FWHM of , which should be enough to remove most non-SN local outflows. Second, we use the flux (), flux uncertainty (), width (), and width uncertainty () of the Gaussian fits to the broad H component (denoted as H,SNR) to define two diagnostic ratios designed to single out bright line emission from young SNR candidates:
-
•
-
•
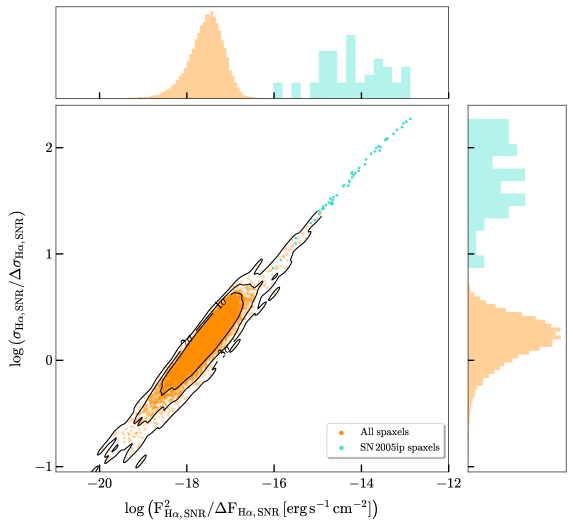
We show the values for these two diagnostic ratios in all the spaxels of the MUSE data cube for NGC 2906 in Figure 5. This plot illustrates the discriminating power of our chosen diagnostic ratios, with the spaxels that cover the site of SN 2005ip clearly deviating from the distribution of values measured in the rest of the host galaxy along both axes.
We have examined the values of these diagnostic ratios in all IFS data cubes in our sample of 887 PMAS and 342 MUSE observations of nearby galaxies, consisting of more than 35 million individual spectra. To minimize false detections, we restrict our search to spaxels where the signal-to-noise ratio (S/N) for is higher than 5 in the residual spectra. We have set a conservative threshold of 3 above the median of the distribution in both diagnostic ratios to flag regions of interest as a young SNR candidates.
As a side note, we attempted a similar search centered in the [O iii] 5007 line, but we failed to find any clear candidates. This indicates that objects with strong, broad [O iii] emission like Cas A and SNR NGC 4449 (Figure 1) must be rare, or short-lived, or both.
4.2 Young SNR Candidates
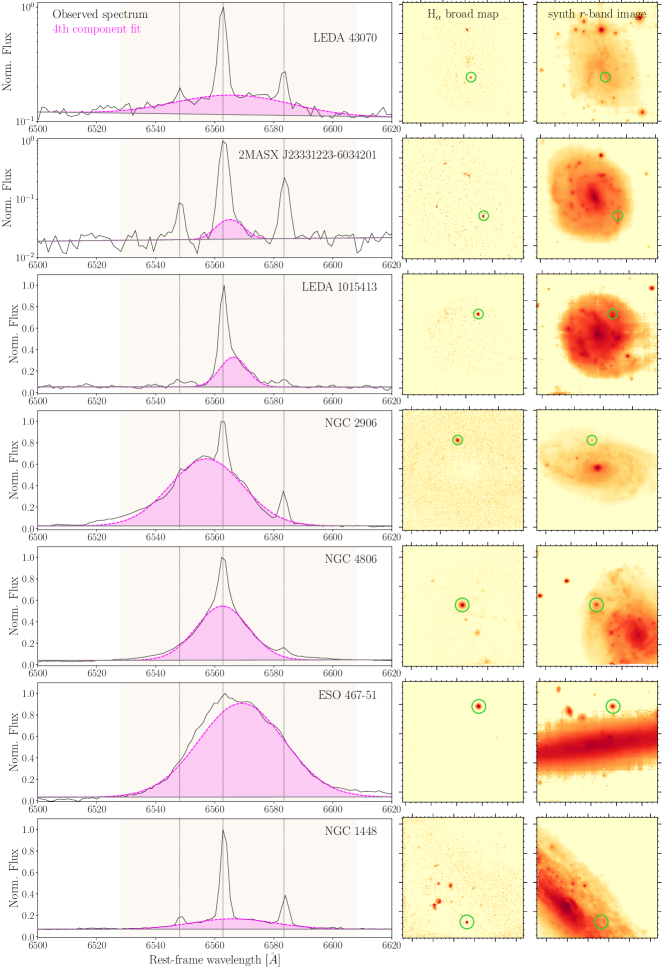
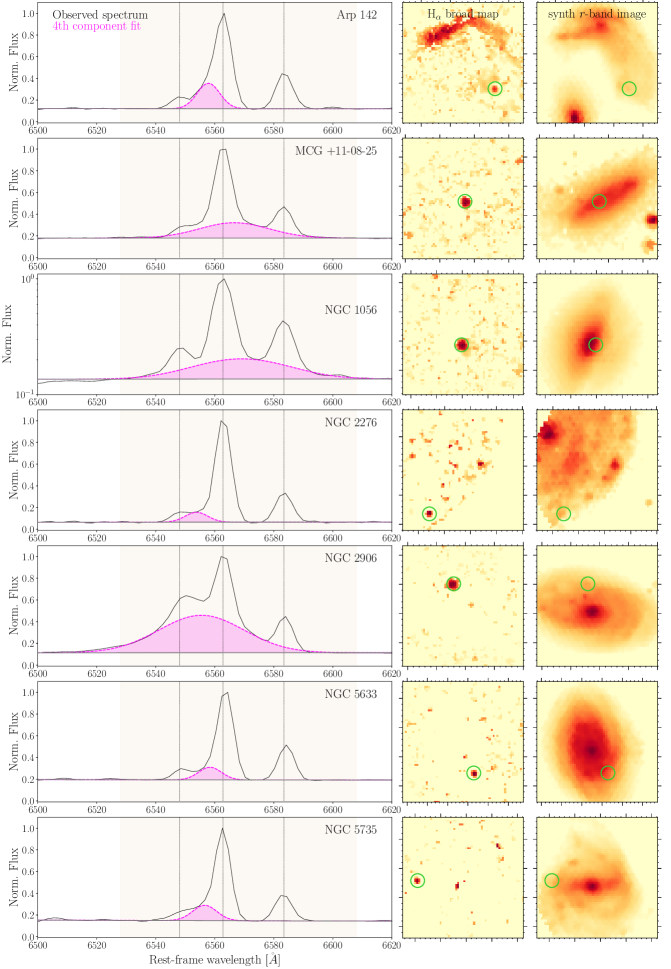
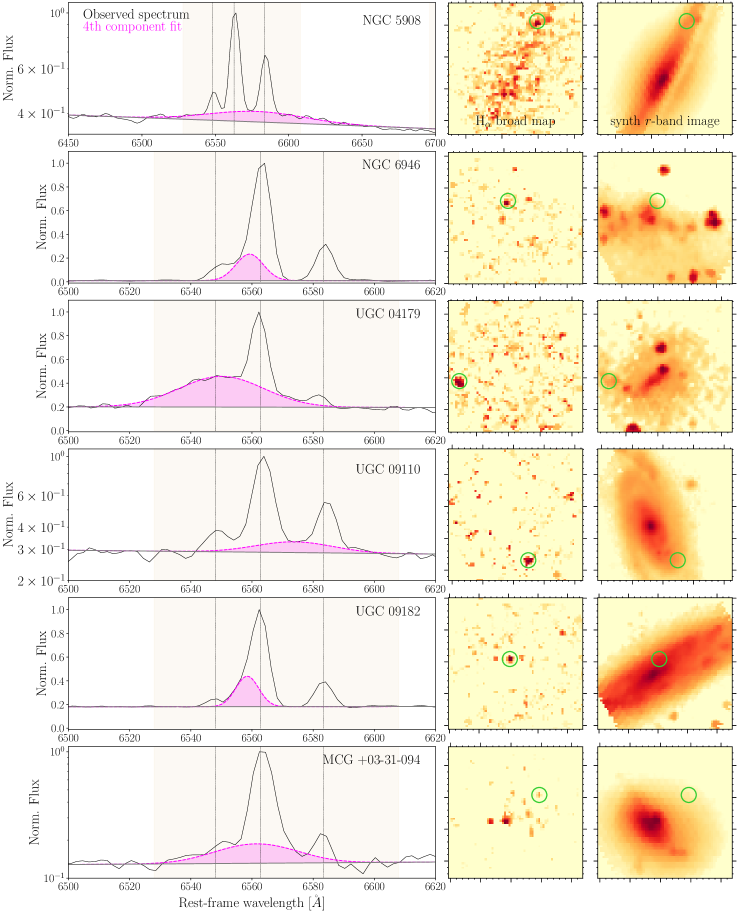
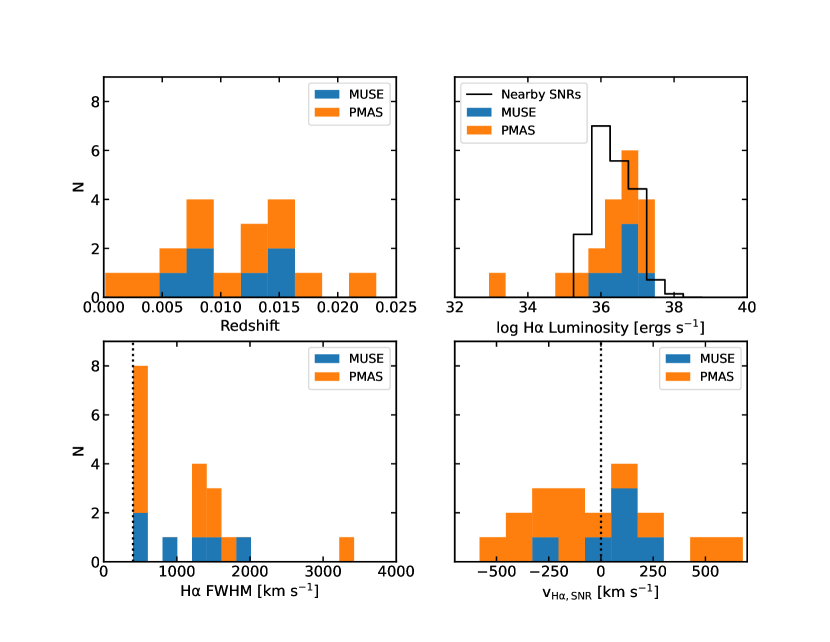
Our search yielded 20 contiguous regions that pass our quality cuts, 7 in MUSE and 13 in PMAS. We list these regions in Table 2, and classify them as young SNR candidates, by analogy with the properties of SN 2005ip described in Section 3.2. The only object that appears in both MUSE and PMAS data is SN 2005ip itself, which brings the total number of unique objects identified in our search to 19. The individual fits to the residual spectra around H in the spaxels identified as young SNR candidates are shown in Figures 6, 7, and 8, along with maps of the entire host galaxy, both in the broad H component and in white light. The regions outside the SNR candidates that appear in some of these broad H maps did not pass our quality cuts. In Figure 9 we show the distribution of host galaxy redshifts, along with the FWHM, luminosity, and systemic velocity of the broad H component corresponding to these regions.
Four of these 19 objects coincide spatially with previously known SNe: the already discussed SN 2005ip, a Type IIn SN in the spiral NGC 2906 imaged by PMAS and MUSE 2593 and 3104 days after discovery, respectively; ASAS-SN 14fd (Holoien et al., 2019), a Type IIn SN in the dwarf irregular galaxy LEDA 43070 (PGC 43070) imaged by MUSE 514 days after discovery; SN2011fh (Pessi et al., 2022), a Type IIn SN in the spiral NGC 4806 imaged by MUSE 1362 days after discovery; and ASAS-SN 14jb (Holoien et al., 2019), a Type IIP SN in the spiral ESO 467-51, imaged by MUSE 391 days after discovery. A fifth object, the SNR candidate in NGC 5908, coincides spatially with PSNJ15164204+5525011, a ’SN impostor’ reported in 2012, likely a luminous blue variable (Benetti et al., 2012).
It is worth noting that three out of four SNe that coincide with our SNR candidates are Type IIn, despite the fact that this subtype only accounts for 9% of CC SNe (Smith et al., 2011; Kiewe et al., 2012). The fourth SN, ASAS-SN 14jb, is a rare extraplanar Type IIP SN in an edge-on spiral, whose MUSE observations were analyzed and discussed in Meza et al. (2019). The remaining 15 candidates in our sample are probably young SNRs whose SN either exploded before the era of modern transient surveys, or were missed, perhaps because of weather, or poor sampling, or coincidence with the Sun. With distances up to 100 Mpc (for SNR Arp 142, at a redshift of 0.0233, see Figure 9), these are among the furthest SNRs identified as such. Interestingly, one of our candidate SNRs is located in NGC 6946, the ‘Fireworks Galaxy’, a nearby spiral with a high star formation rate that has hosted 10 known SNe (Eldridge & Xiao, 2019; Eibensteiner et al., 2022). Our results bring the total number of SNe in this galaxy up to eleven.
With all the caveats attached to small number statistics, the four objects associated with known SNe in our sample suggest that our method is turning up SNRs whose H luminosity is driven predominantly by CSM interaction, likely core collapse SNe whose progenitors have lost a great deal of mass in their pre-SN evolution, either due to winds or to binary interactions (Smith et al., 2009; Langer, 2012; Dessart et al., 2023). Some (possibly most) of these SNe might have shown signs of interaction during their optically thick phase, appearing as Type IIn or Type Ibn SNe (Kiewe et al., 2012; Taddia et al., 2013; Smith, 2017). Others, like ASAS-SN 14jb, might not have developed those signs until later on, particularly if the progenitor drove some sort of fast outflow clearing a low-density cavity surrounded by denser and slower material (Dwarkadas, 2005, 2007; Patnaude et al., 2015, 2017). There is of course no way to tell how old these SNRs might be, but given the properties of Cas A, SNR NGC 4449, and SN2005 ip discussed in Section 3.2, ages ranging between a few years and a few centuries seem reasonable.
Eight of our young SNR candidates have FWHM values that are within 25% of our lower threshold of 400 : 2MASX J23331223-6034201, LEDA 1015413, Arp 142, NGC 2276B, NGC 5735, NGC 6946, and UGC 09182. While these candidates might be considered somewhat more marginal than the others, it is important to emphasize that in each case the fit to the H spectral window does require the presence of a broad component with a high level of significance that shows spatial clustering in the 2D maps. The FWHM values in the other eleven candidates range between for NGC 4806/SN2011fh and for NGC 5908, comparable to the values measured in X-ray bright SNRs decades to centuries after the SN explosion (Vink, 2012). We note that the errors produced by MPFIT for the FWHM and systemic velocities of the broad H component are likely underestimated in the SNR candidates with the largest FWHM values. A Bayesian analysis might reveal substantial correlations in the posterior distributions for these parameters, but that is outside the scope of the present work. With one exception, the luminosities we measure for the broad H component in our SNR candidates range between and . The outlier, with a luminosity of , is the SNR candidate in NGC 6946, which is also by far the closest galaxy in our sample ( Mpc, Eldridge & Xiao, 2019). For comparison, the H luminosities of the 143 SNRs in five nearby galaxies compiled by de Grijs et al. (2000) range between and (see Figure 9). Although there is considerable overlap in these luminosity ranges, it is important to keep in mind that all our SNR candidates show considerably broad emission, while most local SNRs (including those in the sample from de Grijs et al. 2000) do not.
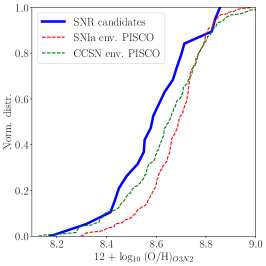
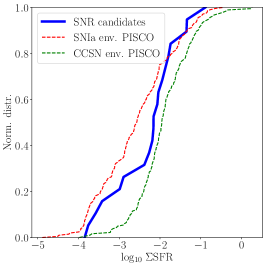
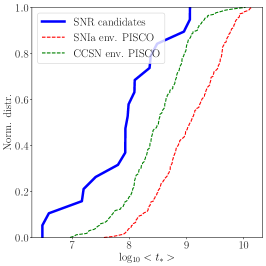
In Figure 10 we show the distribution of the metallicities, star formation rates and average stellar ages of the candidate SNRs in our sample, derived from the IFS spectra at their locations, compared to larger samples of CC and Type Ia SNe from PISCO (190 CC SNe and 234 SN Ia, respectively, Galbany et al., 2018b). All the parameters for our SNR candidates have been measured following the procedures described in Galbany et al. (2018b). The metallicities at the location of the candidate SNRs are somewhat lower than those found in the environments of the PISCO CC SNe, and the star formation rates are intermediate between the CC and Ia SNe in the PISCO samples, but these differences are small and hard to interpret for a sample as small as ours. The most striking systematic difference between our candidate SNRs and the bulk population of PISCO SNe is in the average stellar ages, which are clearly lower by about half a dex than those found in the environments of CC SNe, and about a dex lower than those of SN Ia. This indicates that the progenitors of our candidate SNRs might be shorter lived, and hence more massive, than those of a typical CC SNe. A similar trend has been found for the environments of Type IIn SNe by Moriya et al. (2023).
5 Discussion and Conclusions
We have conducted a systematic search for regions with broad ( ) H emission in IFS data cubes of 1229 nearby galaxies imaged by the PMAS and MUSE instruments. We have identified 19 such regions, which we classify as SNR candidates by analogy with the properties of known objects like Cas A and SNR NGC 4449-1. Indeed, four of the regions we have found coincide with the sites of previously known CC SNe, one Type IIP and three Type IIn, including the well known interacting object SN 2005ip. These coincidences, and the physical properties of the SNR candidates we have identified, suggest that the broad H emission in these regions is produced by a strong interaction between SN ejecta and some sort of dense surrounding medium. This medium could be material lost by the SN progenitor before the explosion due to stellar winds or binary interactions, which seems to be a common feature in Type IIn SNe, or a dense component of the interstellar medium associated with the formation site of the SN progenitors. The stellar ages measured from the IFS data at the sites of our SNR candidates are younger by about 0.5 dex than the ages measured at the sites of Type II SNe in the PISCO survey, indicating that the progenitors of our SNR candidates might be more massive than those of average CC SNe.
The methods presented in this paper open a new window for the study of young SNRs in nearby galaxies. Systematic searches for broad line emission in IFS data cubes in current and future surveys should yield more SNR candidates like the ones we present here, and allow us to study their progenitor population in greater detail.
References
- Abazajian et al. (2009) Abazajian, K. N., Adelman-McCarthy, J. K., Agüeros, M. A., et al. 2009, ApJS, 182, 543
- Amorín et al. (2012) Amorín, R., Vílchez, J. M., Hägele, G. F., et al. 2012, ApJ, 754, L22
- Andrews et al. (2016) Andrews, B. H., Weinberg, D. H., Schönrich, R., & Johnson, J. A. 2016, ArXiv e-prints, arXiv:1604.08613
- Andrews et al. (2017) —. 2017, ApJ, 835, 224
- Auchettl et al. (2019) Auchettl, K., Lopez, L. A., Badenes, C., et al. 2019, ApJ, 871, 64
- Bacon et al. (2014) Bacon, R., Vernet, J., Borisova, E., et al. 2014, The Messenger, 157, 13
- Badenes et al. (2009) Badenes, C., Harris, J., Zaritsky, D., & Prieto, J. L. 2009, ApJ, 700, 727
- Bauer et al. (2008) Bauer, F. E., Dwarkadas, V. V., Brandt, W. N., et al. 2008, ApJ, 688, 1210
- Benetti et al. (2012) Benetti, S., Pastorello, A., Turatto, M., et al. 2012, The Astronomer’s Telegram, 3969, 1
- Bevan et al. (2019) Bevan, A., Wesson, R., Barlow, M. J., et al. 2019, MNRAS, 485, 5192
- Bietenholz et al. (2010) Bietenholz, M. F., Bartel, N., Milisavljevic, D., et al. 2010, MNRAS, 409, 1594
- Cardelli et al. (1989) Cardelli, J. A., Clayton, G. C., & Mathis, J. S. 1989, ApJ, 345, 245
- Castaneda et al. (1990) Castaneda, H. O., Vilchez, J. M., & Copetti, M. V. F. 1990, ApJ, 365, 164
- Castrillo et al. (2021) Castrillo, A., Ascasibar, Y., Galbany, L., et al. 2021, MNRAS, 501, 3122
- Cid Fernandes et al. (2005) Cid Fernandes, R., Mateus, A., Sodré, L., Stasińska, G., & Gomes, J. M. 2005, MNRAS, 358, 363
- Cid Fernandes et al. (2009) Cid Fernandes, R., Schoenell, W., Gomes, J. M., et al. 2009, in Revista Mexicana de Astronomia y Astrofisica Conference Series, Vol. 35, Revista Mexicana de Astronomia y Astrofisica Conference Series, 127–132
- Cid Fernandes et al. (2013) Cid Fernandes, R., Pérez, E., García Benito, R., et al. 2013, A&A, 557, A86
- Dalla Vecchia & Schaye (2012) Dalla Vecchia, C., & Schaye, J. 2012, MNRAS, 426, 140
- de Grijs et al. (2000) de Grijs, R., O’Connell, R. W., Becker, G. D., Chevalier, R. A., & Gallagher, John S., I. 2000, AJ, 119, 681
- Dessart et al. (2023) Dessart, L., Gutiérrez, C. P., Kuncarayakti, H., Fox, O. D., & Filippenko, A. V. 2023, A&A, 675, A33
- Diaz et al. (1987) Diaz, A. I., Terlevich, E., Pagel, B. E. J., Vilchez, J. M., & Edmunds, M. G. 1987, MNRAS, 226, 19
- Dwarkadas (2005) Dwarkadas, V. V. 2005, ApJ, 630, 892
- Dwarkadas (2007) —. 2007, ApJ, 667, 226
- Eibensteiner et al. (2022) Eibensteiner, C., Barnes, A. T., Bigiel, F., et al. 2022, A&A, 659, A173
- Eldridge & Xiao (2019) Eldridge, J. J., & Xiao, L. 2019, MNRAS, 485, L58
- Fox et al. (2009) Fox, O., Skrutskie, M. F., Chevalier, R. A., et al. 2009, ApJ, 691, 650
- Fox et al. (2010) Fox, O. D., Chevalier, R. A., Dwek, E., et al. 2010, ApJ, 725, 1768
- Fox et al. (2020) Fox, O. D., Fransson, C., Smith, N., et al. 2020, MNRAS, 498, 517
- Fransson et al. (1996) Fransson, C., Lundqvist, P., & Chevalier, R. A. 1996, ApJ, 461, 993
- Fransson et al. (2002) Fransson, C., Chevalier, R. A., Filippenko, A. V., et al. 2002, ApJ, 572, 350
- Galbany et al. (2014) Galbany, L., Stanishev, V., Mourão, A. M., et al. 2014, A&A, 572, A38
- Galbany et al. (2016a) Galbany, L., Anderson, J. P., Rosales-Ortega, F. F., et al. 2016a, MNRAS, 455, 4087
- Galbany et al. (2016b) Galbany, L., Stanishev, V., Mourão, A. M., et al. 2016b, A&A, 591, A48
- Galbany et al. (2017) Galbany, L., Mora, L., González-Gaitán, S., et al. 2017, MNRAS, 468, 628
- Galbany et al. (2018a) Galbany, L., Anderson, J. P., Sánchez, S. F., et al. 2018a, ApJ, 855, 107
- Galbany et al. (2018b) —. 2018b, ApJ, 855, 107
- Hogarth et al. (2020) Hogarth, L., Amorín, R., Vílchez, J. M., et al. 2020, MNRAS, 494, 3541
- Holoien et al. (2019) Holoien, T. W. S., Brown, J. S., Vallely, P. J., et al. 2019, MNRAS, 484, 1899
- Holoien et al. (2022) Holoien, T. W. S., Berger, V. L., Hinkle, J. T., et al. 2022, arXiv e-prints, arXiv:2207.07657
- Hopkins et al. (2014) Hopkins, P. F., Kereš, D., Oñorbe, J., et al. 2014, MNRAS, 445, 581
- Jennings et al. (2014) Jennings, Z. G., Williams, B. F., Murphy, J. W., et al. 2014, ApJ, 795, 170
- Katsuda et al. (2014) Katsuda, S., Maeda, K., Nozawa, T., Pooley, D., & Immler, S. 2014, ApJ, 780, 184
- Kehrig et al. (2020) Kehrig, C., Iglesias-Páramo, J., Vílchez, J. M., et al. 2020, MNRAS, 498, 1638
- Kelz et al. (2006) Kelz, A., Verheijen, M. A. W., Roth, M. M., et al. 2006, PASP, 118, 129
- Kiewe et al. (2012) Kiewe, M., Gal-Yam, A., Arcavi, I., et al. 2012, ApJ, 744, 10
- Kobayashi et al. (2006) Kobayashi, C., Umeda, H., Nomoto, K., Tominaga, N., & Ohkubo, T. 2006, ApJ, 653, 1145
- Krühler et al. (2017) Krühler, T., Kuncarayakti, H., Schady, P., et al. 2017, A&A, 602, A85
- Kuncarayakti et al. (2016) Kuncarayakti, H., Maeda, K., Anderson, J. P., et al. 2016, MNRAS, 458, 2063
- Kuncarayakti et al. (2013a) Kuncarayakti, H., Doi, M., Aldering, G., et al. 2013a, AJ, 146, 30
- Kuncarayakti et al. (2013b) —. 2013b, AJ, 146, 31
- Kuncarayakti et al. (2018) Kuncarayakti, H., Anderson, J. P., Galbany, L., et al. 2018, A&A, 613, A35
- Lacerda et al. (2020) Lacerda, E. A. D., Sánchez, S. F., Cid Fernandes, R., et al. 2020, MNRAS, 492, 3073
- Langer (2012) Langer, N. 2012, ARA&A, 50, 107
- Levenberg (1944) Levenberg, K. 1944, Quarterly Journal of Applied Mathmatics, II, 164
- Lyman et al. (2020) Lyman, J. D., Galbany, L., Sánchez, S. F., Anderson, J. P., & Kuncarayakti, H. 2020, MNRAS, doi:10.1093/mnras/staa1243
- Lyman et al. (2018) Lyman, J. D., Taddia, F., Stritzinger, M. D., et al. 2018, MNRAS, 473, 1359
- Mac Low & Klessen (2004) Mac Low, M.-M., & Klessen, R. S. 2004, Reviews of Modern Physics, 76, 125
- Maoz et al. (2014) Maoz, D., Mannucci, F., & Nelemans, G. 2014, ARA&A, 52, 107
- Markwardt (2012) Markwardt, C. 2012, MPFIT: Robust non-linear least squares curve fitting, ASCL, ascl:1208.019
- Markwardt (2009) Markwardt, C. B. 2009, in Astronomical Society of the Pacific Conference Series, Vol. 411, Astronomical Data Analysis Software and Systems XVIII, ed. D. A. Bohlender, D. Durand, & P. Dowler, 251
- Marquardt (1963) Marquardt, D. W. 1963, Journal of the Society for Industrial and Applied Mathematics, 11, 431
- Matheson et al. (2000) Matheson, T., Filippenko, A. V., Ho, L. C., Barth, A. J., & Leonard, D. C. 2000, AJ, 120, 1499
- Meza et al. (2019) Meza, N., Prieto, J. L., Clocchiatti, A., et al. 2019, A&A, 629, A57
- Milisavljevic & Fesen (2008) Milisavljevic, D., & Fesen, R. A. 2008, ApJ, 677, 306
- Milisavljevic & Fesen (2015) —. 2015, Science, 347, 526
- Milisavljevic & Fesen (2017) —. 2017, in Handbook of Supernovae, ed. A. W. Alsabti & P. Murdin, 2211
- Milisavljevic et al. (2012) Milisavljevic, D., Fesen, R. A., Chevalier, R. A., et al. 2012, ApJ, 751, 25
- Moriya et al. (2013) Moriya, T. J., Maeda, K., Taddia, F., et al. 2013, MNRAS, 435, 1520
- Moriya et al. (2023) Moriya, T. J., Galbany, L., Jiménez-Palau, C., et al. 2023, A&A, 677, A20
- Newville et al. (2016) Newville, M., Stensitzki, T., Allen, D. B., et al. 2016, Lmfit: Non-Linear Least-Square Minimization and Curve-Fitting for Python, ASCL, ascl:1606.014
- Osterbrock & Ferland (2006) Osterbrock, D. E., & Ferland, G. J. 2006, Astrophysics of gaseous nebulae and active galactic nuclei (University Science Books)
- Papaderos et al. (2013) Papaderos, P., Gomes, J. M., Vílchez, J. M., et al. 2013, A&A, 555, L1
- Patnaude et al. (2015) Patnaude, D. J., Lee, S.-H., Slane, P. O., et al. 2015, ApJ, 803, 101
- Patnaude et al. (2017) —. 2017, ApJ, 849, 109
- Pessi et al. (2022) Pessi, T., Prieto, J. L., Monard, B., et al. 2022, ApJ, 928, 138
- Pessi et al. (2023) Pessi, T., Prieto, J. L., Anderson, J. P., et al. 2023, A&A, 677, A28
- Pettini & Pagel (2004) Pettini, M., & Pagel, B. E. J. 2004, MNRAS, 348, L59
- Phillips et al. (2019) Phillips, M. M., Contreras, C., Hsiao, E. Y., et al. 2019, PASP, 131, 014001
- Prantzos et al. (2018) Prantzos, N., Abia, C., Limongi, M., Chieffi, A., & Cristallo, S. 2018, MNRAS, 476, 3432
- Quirola-Vásquez et al. (2019) Quirola-Vásquez, J., Bauer, F. E., Dwarkadas, V. V., et al. 2019, MNRAS, 490, 4536
- Rigault et al. (2013) Rigault, M., Copin, Y., Aldering, G., et al. 2013, A&A, 560, A66
- Rigault et al. (2018) —. 2018, A&A, 612, C1
- Rodríguez Del Pino et al. (2019) Rodríguez Del Pino, B., Arribas, S., Piqueras López, J., Crespo Gómez, A., & Vílchez, J. M. 2019, A&A, 630, A124
- Romano et al. (2010) Romano, D., Karakas, A. I., Tosi, M., & Matteucci, F. 2010, A&A, 522, A32
- Roth et al. (2005) Roth, M. M., Kelz, A., Fechner, T., et al. 2005, PASP, 117, 620
- Sánchez et al. (2012) Sánchez, S. F., Kennicutt, R. C., Gil de Paz, A., et al. 2012, A&A, 538, A8
- Sánchez et al. (2016) Sánchez, S. F., García-Benito, R., Zibetti, S., et al. 2016, A&A, 594, A36
- Singh et al. (2013) Singh, R., van de Ven, G., Jahnke, K., et al. 2013, A&A, 558, A43
- Smartt (2009) Smartt, S. J. 2009, ARA&A, 47, 63
- Smith (2014) Smith, N. 2014, ARA&A, 52, 487
- Smith (2017) —. 2017, in Handbook of Supernovae, ed. A. W. Alsabti & P. Murdin, 403
- Smith et al. (2011) Smith, N., Li, W., Filippenko, A. V., & Chornock, R. 2011, MNRAS, 412, 1522
- Smith et al. (2009) Smith, N., Silverman, J. M., Chornock, R., et al. 2009, ApJ, 695, 1334
- Smith et al. (2017) Smith, N., Kilpatrick, C. D., Mauerhan, J. C., et al. 2017, MNRAS, 466, 3021
- Stanishev et al. (2012) Stanishev, V., Rodrigues, M., Mourão, A., & Flores, H. 2012, A&A, 545, A58
- Stinson et al. (2006) Stinson, G., Seth, A., Katz, N., et al. 2006, MNRAS, 373, 1074
- Stritzinger et al. (2012) Stritzinger, M., Taddia, F., Fransson, C., et al. 2012, ApJ, 756, 173
- Strolger et al. (2020) Strolger, L.-G., Rodney, S. A., Pacifici, C., Narayan, G., & Graur, O. 2020, ApJ, 890, 140
- Taddia et al. (2013) Taddia, F., Stritzinger, M. D., Sollerman, J., et al. 2013, A&A, 555, A10
- Terlevich et al. (1991) Terlevich, R., Sánchez Portal, M., Díaz, A. I., & Terlevich, E. 1991, MNRAS, 249, 36
- Thornton et al. (1998) Thornton, K., Gaudlitz, M., Janka, H.-T., & Steinmetz, M. 1998, ApJ, 500, 95
- Thorstensen et al. (2001) Thorstensen, J. R., Fesen, R. A., & van den Bergh, S. 2001, AJ, 122, 297
- Verheijen et al. (2004) Verheijen, M. A. W., Bershady, M. A., Andersen, D. R., et al. 2004, Astronomische Nachrichten, 325, 151
- Vink (2012) Vink, J. 2012, A&A Rev., 20, 49
- Williams & Chu (1995) Williams, R. M., & Chu, Y.-H. 1995, ApJ, 439, 132
- Zapartas et al. (2017) Zapartas, E., de Mink, S. E., Izzard, R. G., et al. 2017, A&A, 601, A29