Absence of nematic instability in the kagome metal CsV3Sb5
Ever since the discovery of the charge density wave (CDW) transition in the kagome metal CsV3Sb5, the nature of its symmetry breaking is under intense debate. While evidence suggests that the rotational symmetry is already broken at the CDW transition temperature (), an additional electronic nematic instability well below was reported based on the diverging elastoresistivity coefficient in the anisotropic channel (). Verifying the existence of a nematic transition below is not only critical for establishing the correct description of the CDW order parameter, but also important for understanding the low-temperature superconductivity. Here, we report elastoresistivity measurements of CsV3Sb5 using three different techniques probing both isotropic and anisotropic symmetry channels. Contrary to previous reports, we find the anisotropic elastoresistivity coefficient is temperature-independent except for a step jump at . The absence of nematic fluctuations is further substantiated by measurements of the elastocaloric effect, which show no enhancement associated with nematic susceptibility. On the other hand, the symmetric elastoresistivity coefficient increases below , reaching a peak value of 90 at K. Our results strongly indicate that the phase transition at is not nematic in nature and the previously reported diverging elastoresistivity is due to the contamination from the channel.
I I. INTRODUCTION
Kagome metals have emerged as a new platform to investigate the interplay between topology and correlation owing to their unique lattice structures neupert_charge_2022 . The frustrated corner-sharing triangular lattice naturally gives rise to electronic structures with flat bands, van Hove singularities and Dirac crossings guo2009topological . Several interesting phenomena have been discovered in kagome metals, including the giant anomalous Hall effect (AHE) in Weyl semimetal Co3Sn2S2 liu_giant_2018 , massive Dirac Fermions in Fe3Sn2 ye2018massive , and charge density wave (CDW) order in FeGe, ScV6Sn6 and the AV3Sb5 (A = K, Rb, Cs) family arachchige2022charge ; teng2022discovery ; ortiz_cs_2020 . Among the kagome metals, the AV3Sb5 (A = K, Rb, Cs) family has attracted significant attention due to the exotic behavior of its CDW phase ( = 78104 K) and superconducting phase ( = 13 K) ortiz_new_2019 ; ortiz_cs_2020 ; liang_three-dimensional_2021 ; li2022discovery ; xiao_coexistence_2023 ; jiang_kagome_2023 ; li_observation_2021 ; xie_electron-phonon_2022 ; christensen_theory_2021 . In particular, the nature of the symmetry breaking in the CDW phase is not yet settled despite extensive investigations. Early studies including the measurements of AHE, optical Kerr effect, and change of muon relaxation rate have all suggested that time-reversal symmetry is broken in the CDW phase yang_giant_2020 ; yu_concurrence_2021 ; xu_three-state_2022 ; mielke_time-reversal_2022 ; yu_evidence_2021 , raising the intriguing possibility that the CDW is a form of loop current order feng_low-energy_2021 ; christensen_loop_2022-1 . Nevertheless, these observations are challenged by the most recent measurement of high resolution polar Kerr effect, which found no evidence of time-reversal symmetry breaking associated with the CDW transition saykin2022high .
In addition to time reversal symmetry, the rotational symmetry in the CDW phase has also been intensely studied. A two-fold anisotropy in the CDW phase that breaks the rotational symmetry was first reported by angle-dependent magnetoresistance measurements xiang_twofold_2021 . Further studies including scanning tunneling spectroscopy (STM) li_rotation_2022 ; li_unidirectional_2023 , Raman spectroscopy wulferding_emergent_2022 ; wu_charge_2022 , optical birefringence measurements wu_simultaneous_2022 ; xu_three-state_2022 , angle-resolved photoemission spectroscopy (ARPES) jiang_observation_2023 ; luo2022electronic ; kang2023charge , all confirmed the observed two-fold anisotropy. However, the temperature at which rotational symmetry is broken remains a key question. While most studies agree that the breaking of rotational symmetry happens at , a diverging elastoresistivity response was reported within the CDW phase nie_charge-density-wave-driven_2022 ; sur2023optimized , which was argued as evidence for an electronic nematic instability well below .
The electronic nematic phase refers to a spontaneous rotational-symmetry-breaking phase while preserving translational symmetry, which has been extensively studied in strongly correlated electronic systems fradkin2010nematic ; fernandes2014drives . In the context of Fe-based superconductor chu2012divergent ; kuo2016ubiquitous ; liu2016nematic ; gu2017unified , nematicity is understood as a vestigial order of the underlying spin density wave or CDW phases nie2014quenched ; fernandes2014drives ; fernandes2019intertwined ; bohmer2022nematicity . The partial melting of the density waves destroys long-range periodicity while continuing to break rotational symmetry, hence the nematic transition is always above the density wave transition in these materials. A salient feature of the nematicity is a diverging nematic susceptibility at temperatures above the phase transition , which can be probed by elastoresistivity measurements, where resistivity anisotropy serves as a proxy for the nematic order parameter and the anisotropic strain serves as its conjugate field. For instance, a diverging elastoresistivity coefficient in the anisotropic strain channel () with a Curie-Weiss temperature dependence was observed above the nematic transition in Ba(Fe1-xCox)2As2 chu2012divergent .
In this context, a diverging elastoresistivity in CsV3Sb5 that peaks at K, a temperature well below , is rather unusual nie_charge-density-wave-driven_2022 . It would imply the rotational symmetry is not broken at , which is inconsistent with the majority of previous experimental observations li_unidirectional_2023 ; wu_simultaneous_2022 ; xu_three-state_2022 . Another possible explanation is that the rotational symmetry is only weakly broken at by the phase shift of the CDW order between different kagome layers park2021electronic , while the CDW within the 2D kagome plane remains isotropic. At a lower temperature , the rotational symmetry within the kagome plane is broken, leading to diverging elastoresistivity grandi2023theory . In either scenario, the existence of a nematic instability below provides strong constraints to distinguish between various proposals for the CDW order parameter park2021electronic ; christensen_theory_2021 ; denner2021analysis ; grandi2023theory ; tazai2022mechanism ; christensen_loop_2022-1 ; zhou2022chern . In addition, a very recent elastoresistivity study proposed a nematic quantum critical point residing within the first superconducting dome in the phase diagram of Ti doped CsV3Sb5 sur2023optimized , which was argued as evidence for nematic fluctuation enhanced superconducting pairing. On the other hand, it has been shown that non-ideal experiment configurations, such as what is incorporated in the differential elastoresistivity technique used in reference nie_charge-density-wave-driven_2022 and sur2023optimized , may lead to the mixing of elastoresistivity signals in different symmetry channels, resulting in a false diverging nematic response even though the leading instability is in other symmetry channels wiecki2020dominant ; wiecki2021emerging ; rosenberg2019divergence ; ye2022elastocaloric . The purpose of this work is to perform a comprehensive study of elastoresistivity and the elastocaloric effect in CsV3Sb5 to elucidate the symmetry associated with the proposed transition at .
II II. RESULTS
II.1 A. Electrical transport characterization
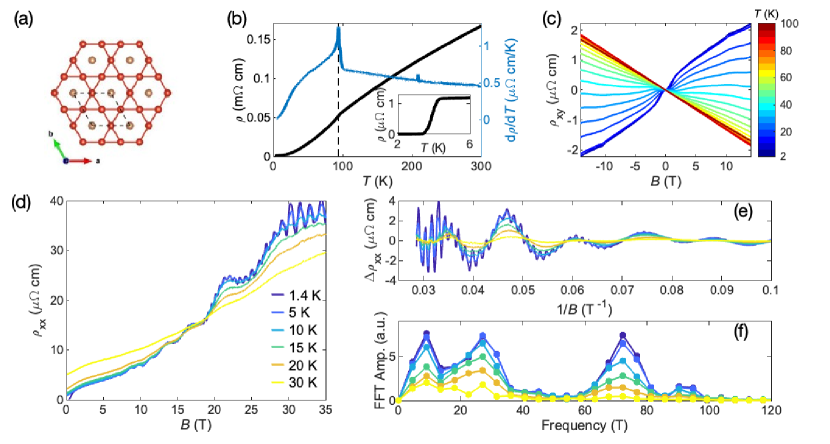
CsV3Sb5 single crystals have a hexagonal shape with the a-axis along the natural growth edges, consistent with the six-fold rotational symmetry of the kagome lattice [Fig. 1(a)]. The CDW transition occurs at K, which can be seen from a resistivity anomaly and a sharp peak in as shown in Fig. 1(b). The superconducting transition is at K. The residual resistivity ratio of indicates the high quality of the single crystals. The AHE is observed in the in-plane Hall resistivity below [Fig. 1(c)], consistent with previous experiments yu_concurrence_2021 . The Shubnikov–de Haas (SdH) quantum oscillations (QOs) can be observed in longitudinal resistivity below 30 K [Fig. 1(d)]. The oscillatory component as a function of inverse field and its fast Fourier transform (FFT) are shown in Fig. 1(e, f), respectively. Four principal frequencies at 11, 28, 73, and 90 T were observed in the low-frequency regime (with some high-frequency peaks not shown here) in high field measurements up to 35 T. These observations are all in agreement with previous reports, providing a solid foundation to further study the elasto-response in these single crystals yu_concurrence_2021 ; ortiz_fermi_2021 ; fu2021quantum .
II.2 B. Elastoresistivity
Elastoresistivity is a fourth-rank symmetric tensor that relates the change of resistivity of a system to the externally induced strains. When using Voigt notation, the elastoresistivity tensor can be expressed as a second-rank 66 tensor:
| (1) |
where the indices represent , , and etc. kuo2016ubiquitous . These elastoresistivity coefficients can be further grouped into different symmetry channels based on the irreducible representations of the point group of the crystal lattice. For example, in , the elastoresistivity coefficients associated with the isotropic irrep and the anisotropic irrep are and , respectively (See MethodsV. Methods) fernandes2020nematicity ; nie_charge-density-wave-driven_2022 . In a material with an electronic nematic instability, the diverging susceptibility associated with the nematic transition will manifest in a diverging temperature dependence of the elastoresistivity coefficient in the anisotropic symmetry channel.
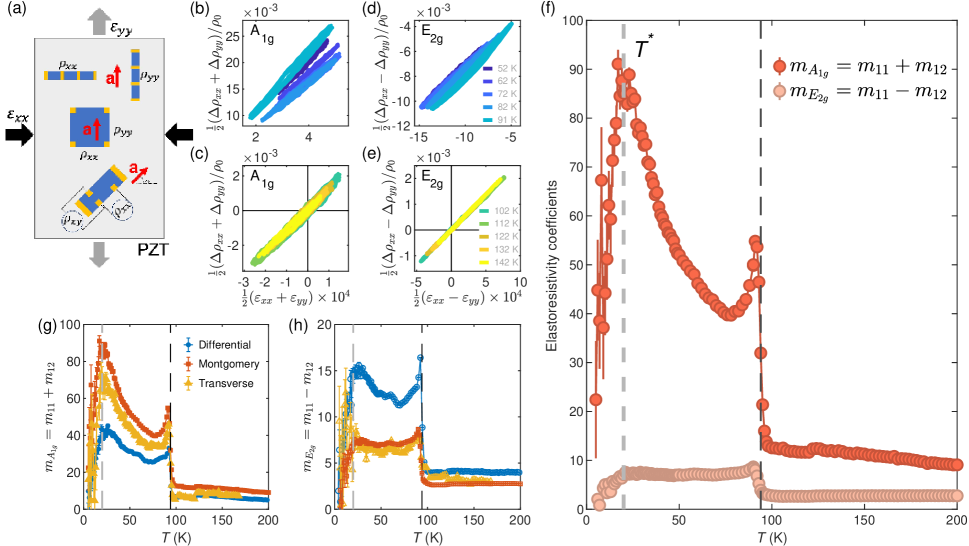
When measuring elastoresistivity, single crystal are glued on the sidewall of a piezo stack, which induces a combination of purely anisotropic strain () and isotropic strain () when an external voltage is applied to the stack. In order to separate the isotropic and anisotropic symmetry channels, both and need to be measured. Three experimental techniques have been developed to measure elastoresistivity coefficients. The first technique that was developed is the differential elastoresistivity technique chu2012divergent , which measures and using two separate bar-shape samples cut along the same crystal axes but oriented perpendicularly on the stack, as shown in the top configuration in Fig. 2(a). However, it was soon realized that this technique inevitably introduces cross-contamination between different symmetry channels wiecki2020dominant ; wiecki2021emerging . Exact symmetry decomposition requires identical strain transmission in both samples, which is never the case in any practical experiment. In fact, the bar-shaped sample results in a more effective strain transmission for the uniaxial strain along the bar direction. Therefore, a bar-shaped sample glued along the x(y) direction experiences dominantly uniaxial strain () even though nominally the same anisotropic strain was applied. To address this issue, the modified Montgomery technique kuo2016ubiquitous and the transverse method shapiro2016measurement were subsequently developed. The modified Montgomery technique allows for obtaining and using a single square sample [middle configuration in Fig. 2(a)] and the transverse technique enables the direct measurement of the resistivity anisotropy in a five-contact bar-shape sample(bottom configuration, see details in V. MethodsMethods). Both methods measure the full resistivity tensors from the same single crystalline samples, hence they do not suffer the cross-contamination issue and the symmetry decomposition is exact.
To thoroughly examine the elastoresistivity coefficients of CsV3Sb5, all three techniques mentioned above were employed. We found that resistivity as a function of strain is linear in both and symmetry channels at all temperatures for all measurements [Fig. 2(b-e)], with only weak hysteresis near likely due to structural domains. This suggests that all the measured elastoresistivity coefficients are in the near-zero strain linear response regime. Figure 2(f) shows the temperature dependence of and elastoresistivity coefficients measured by the Montgomery technique. jumps from 2 to 7 at , but it is essentially temperature independent both below and above . is also temperature independent above , albeit with a larger value ( 10). At it exhibits a sharp peak and grows continuously as temperature deceases until reaching a maximum value of 90 at K.
The measured by the Montgomery technique is very different from those reported in Refs. nie_charge-density-wave-driven_2022 and sur2023optimized , which were measured by the differential elastoresistivity technique. The reported in Refs. nie_charge-density-wave-driven_2022 and sur2023optimized is considerably larger, and shows a temperature dependence that resembles measured by the Montgomery technique. To gain more insight, we present the elastoresistivity coefficients measured by all three techniques in Fig. 2(g,h). It can be seen that and measured by the Montgomery technique and the transverse technique are consistent with each other, whereas the differential elastoresistivity technique yields a larger and smaller in comparison to the other two techniques. The temperature dependence of measured by the differential elastoresistivity technique is also more similar to . All of these are consistent with the admixture of into in the differential elastoresistivity measurement due to unequal strain transmission in the two samples. Hence we conclude that the divergent in previous reports is not intrinsic.
II.3 C. Elastocaloric effect
In addition to the elastoresistivity measurements, the elastocaloric effect (ECE) is another sensitive probe to measure the diverging susceptibility associated with a nematic phase transition ikeda2019ac ; ikeda2021elastocaloric . The elastocaloric measurement detects the temperature change of a system due to an adiabatically induced strain. Experimentally, a small AC strain is induced in sample simultaneously with a tunable DC bias strain, and the AC temperature variation is measured at the frequency of the induced strain by a thermal couple (see details in Methods). The elastocaloric coefficient () can be related to the isothermal entropy change caused by strain via the following equation:
| (2) |
where is heat capacity at a given strain and is entropy. The elastocaloric effect is sensitive to both the susceptibility of the nematic order parameter as well as its spontaneous onset. Depending on the symmetry of the induced strain, two ECE phenomena are expected near a phase transition hristov2019elastoresistive ; ikeda2021elastocaloric . The first of which is associated with inducing strain that breaks the same symmetry as the order parameter ikeda2021elastocaloric . When using such a strain to perturb the system, an enhancement of ECE above the transition temperature is expected. This enhanced ECE is described by the following equation:
| (3) |
where labels the anisotropic symmetry channels. Thus, this enhancement of ECE is proportional to both the temperature derivative of the susceptibility () and the DC bias anisotropic strain , hence it switches sign from tensile to compressive DC strain. This effect was observed in the iron-based superconductors where couples linearly to electronic nematicity and showed excellent agreement with the nematic susceptibility obtained from previous elastoresistivity measurements ikeda2021elastocaloric .
The second effect is associated with the temperature shift of the phase transition induced by strains with symmetry that do NOT couple linearly to the order parameter. For example, is expected to linearly tune . In this case we expect the ECE near the phase transition to be proportional to the critical contribution of heat capacity () times the strain derivative of transition temperature:
| (4) |
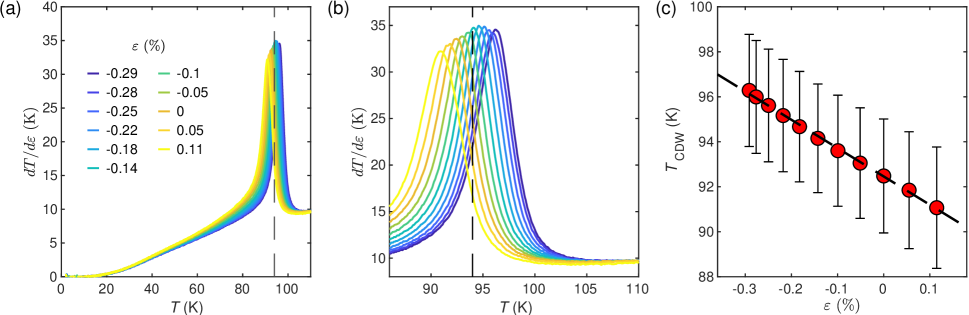
We measured the ECE of a CsV3Sb5 sample by applying a uniaxial stress, which induces both and . Figure 3(a) summarizes the ECE measured under different DC bias strains. A pronounced peak that mimics the heat capacity anomaly is observed near , and the peak is systematically shifted as a function of DC bias strain. This peak is consistent with the second effect mentioned above, where linearly shifts the transition temperature. The linear dependence of as a function of strain is also consistent with previous studies of CsV3Sb5 qian2021revealing .
However, the enhancement of the ECE due to a diverging nematic susceptibility was not observed either above or below . The signal quickly converges both above and below [Fig. 3(b)] and there is no indication of concavity or slope change in the peak from tensile to compressive strains. This result is consistent with no diverging nematic susceptibility, further corroborating the conclusion established by the elastoresistivity measurements.
III III. Discussion
Both elastoresistivity and elastocaloric effect measurements suggest the absence of the nematic instability below . The diverging reported in Refs. nie_charge-density-wave-driven_2022 and sur2023optimized is most likely due to the mixing of the diverging , a consequence of unequal strain transmissions in the differential elastoresistivity technique. We note that in Ref. sur2023optimized , the Montgomery elastoresistivity measurement was performed on one Ti doped CsV3Sb5 sample, which showed agreement with the differential elastoresistivity measurement. Given that the unequal strain transmission is a generic issue in all differential elastoresistivity measurements, a reinvestigation of the elastoresistivity of Ti doped CsV3Sb5 is highly warranted.
We also note that our result is not inconsistent with the rotational symmetry breaking at . The increase of could be a result of aligning symmetry breaking CDW domains by the anisotropic strain li_rotation_2022 ; xu_three-state_2022 ; wu2022simultaneous , but the small value of (5) indicates that the electronic anisotropy is only moderately larger than the structural anisotropy guo2023correlated , which could be consistent with the weak anisotropy introduced by the inter-layer coupling. In this scenario, given that both rotational symmetry and translational symmetry are simultaneously broken at , this transition cannot be characterized as a nematic transition. The absence of diverging elastoresistivity and elastocaloric effect above also confirms there is no vestigial nematicity associated with the rotational symmetry breaking CDW.
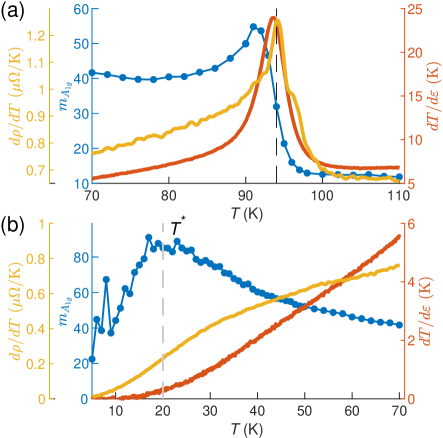
Instead of diverging , the dominant response is in the isotropic channel, manifested by the diverging . Below we discuss the possible origins of the large and strongly temperature dependent . There are two features in the temperature dependence of . The first feature is a sharp peak at , which can be understood by the generalized Fisher-Langer relation hristov2019elastoresistive . The relation states that the temperature derivative of resistivity, , the ECE and elastoresistivity coefficient all scale like the critical component of the heat capacity near a phase transition, if the strain used in the ECE and elastoresistivity is associated with the same symmetry channel that is orthogonal to the order parameter. Indeed, as shown in Fig. 4(a) all three quantities follow the same temperature dependence near . As a side note, this phenomenon can appear in the channel as well, if the sample is at a nonzero strain, since is potentially a quadratic function of .
Below , the increases rapidly as temperature decreases, showing a diverging behavior that peaks at . In contrast to the sharp peak at , we do not see similar temperature dependence in the ECE, and only shows a broad hump centered at that barely resembles the feature in [Fig. 4(b)]. The lack of any feature in the ECE and the strong divergence in elastoresistivity is rather striking. If we attribute the divergence of to a phase transition at , it implies that the order parameter has a very weak coupling to strain, such that it causes a minimum entropy change induced by strain, yet it has a very strong coupling to the conducting quasi-particles, leading to the strong divergence in elastoresistivity. This phenomenon has been observed in iron-based superconductors, where the magnitude of ECE decreases by factor of 35 as the doping approaches the nematic quantum critical point while the elastoresistivity is enhanced by fivefold ikeda2021elastocaloric . It was understood as a consequence of simultaneous reduction of nemato-elastic coupling and enhancement of nemato-transport coupling.
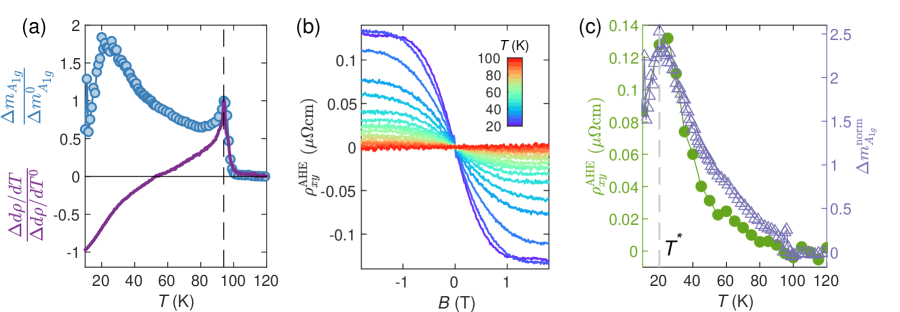
Another notable observation is that the temperature dependence of shows a striking resemblance to that of the AHE discovered in the CDW phase of AV3Sb5 family yang_giant_2020 ; liu_giant_2018 ; yu_concurrence_2021 . Since potentially has contributions from both the diverging behavior towards as well as a more trivial contribution from scattering represented in , we subtracted a normalized ( shown in Fig. 5(a)) to isolate the diverging behavior. The anomalous Hall resistivity was extracted by removing the ordinary Hall from the data in Fig. 1(c) by linearly fitting from fields between 1 T and 2 T, shown in Fig. 5(b). The extracted as a function of temperature is plotted against the background subtracted , shown in Fig. 5(c). We notice that the recently observed non-reciprocal transport behavior in CsV3Sb5 also shows a similar temperature dependence to AHE guo2022switchable . The remarkable resemblance of all three transport observables again highlights the impact of the potential instability on the quasi-particles at the Fermi level saykin2022high .
IV IV. Conclusion
In summary, we investigated the isotropic and anisotropic elastoresistivity coefficients, and , as well as the elastocaloric effect in CsV3Sb5. The lack of enhancement in elastocaloric effect and the temperature-independent below are both consistent with the absence of nematic instability in this system. The previously reported diverging elastoresistivity is likely due to the cross contamination from . Both the elastoresistivity coefficient and the ECE show a peak at , which is a consequence of the tuning of by strain and it is consistent with the extended Fisher-Langer relation. In addition to the peak at , also shows a diverging temperature dependence below that reaches a maximum at , but there is no corresponding elastocaloric anomaly. Our results show that there is no nematic phase transition within the CDW phase in CsV3Sb5, and the nature of requires further investigation.
V. Methods
Transport measurements. - Single crystals of CsV3Sb5 were synthesized using a self-flux method described elsewhere ortiz_cs_2020 ; wang_electronic_2021 ; qian2021revealing . The electrical transport measurements were performed in Dynalcool 14 T (Quantum Design, Inc.). The high magnetic field experiments were carried out in a 35 T resistive magnet at the National High Magnetic Field Laboratory in Tallahassee, FL.
Elastoresistivity tensor in point group. - The symmetry decomposition of elastoresistivity tensor in point group is different from that in . There are two irreducible representations in that are relevant to this study: isotropic and anisotropic symmetry. The in-plane biaxial strain employed in this study can be decomposed into these two symmetry channels: and . We note that is a two-dimensional irreducible representations and and are the two bases. We also note that in the experiment there is also a component in . The in-plane resistivity tensors can also be decomposed into these two irreducible representations i: and . Therefore, the elastoresistivity coefficients in isotropic and anisotropic symmetry channels are related to the elastoresistivity tensors in the Cartesian coordinate systems by the following expressions:
| (5) |
We note that because is a two-dimensional irreducible representation, . In Voigt notation, , , hence and .
Elastoresistivity techniques. - A tunable strain was applied to single crystal samples by gluing them on the sidewall of a piezo stack (P-885.11, from PI-USA) using a thermally conductive epoxy (Stycast 2850FT with Catalyst 24LV, from Loctite). The uniaxial strain along the polling direction of the piezo stack, [Fig. 2(a)], was measured by a foil strain gauge (CEA-06-062UWA-350, from Micro-Measurements), which was glued to the other side of the piezo stack. The uniaxial strain along the orthogonal direction, , was determined by the known in-plane Poisson’s ratio of the piezo stack. As discussed in the main text, the elastoresistivity coefficients can be measured by three techniques:
-
•
Differential technique. Two bar-shaped sample are glued to the piezo stack. The bar directions are aligned to the transverse and poling directions of the piezo stack. Using the standard four-terminal technique, the resistivity and are measured separately in each sample.
-
•
Modified Montgomery technique. Four electric contacts are made at the corners of a square-shape sample, which is glued on the piezo stack with the edges aligned to the poling direction. and are measured by sourcing current using the contacts on one side and measuring the voltage using the contacts on the other side. The measured resistance and can then be converted to resistivity and following the procedure in Ref. kuo2016ubiquitous .
-
•
Transverse technique. The transverse technique measures the transverse resistivity induced by shear strain , which is different from the other two techniques that measures the longitudinal resistivity and shapiro2016measurement . The shear strain is equivalent to an anisotropic strain under 45 degrees rotation. In the transverse technique, a Hall bar with five electrical contacts is glued onto the piezo stack and is aligned at a 45∘ angle with respect to the -axis.. Note that there is no magnetic field, hence the transverse resistivity is not due to Hall effect.
The main problem with the differential technique is the contamination of isotropic strain channel to other anisotropic channels due to unequal strain transmission between two samples. This effect is inevitable as long as the samples are cut into bar-shape and glued along orthogonal directions shapiro2016measurement ; kuo2016ubiquitous . This effect becomes crucial when the elastoresistivity coefficient in the isotropic channel is much larger than the anisotropic channel. In this respect, both modified Montgomery and transverse techniques can perfectly eliminate this effect by measuring a single sample.
Elastocaloric effect measurement - The elastocaloric effect was measured using an AC (dynamic) ECE technique with a homemade three-piezo-stack uniaxial strain cell, similar to the piezoelectric strain cell developed by Hicks et. al. The sample was glued across the gap of the sample mounts of the strain cell. The temperature of the sample was measured at the center of the sample using a thermocouple Chromel-AuFe0.07% ( wire diameter). To apply a dynamical strain together with a static offset, AC and DC voltages were applied to the piezo stacks using a TEGAM 2350 high-voltage amplifier sourced by a Stanford Research SR860 Lock-in amplifier and Keithley 2450 voltage supply, respectively. The signals from the sample and thermocouple were amplified by the Stanford Research SR554 preamplifier at appropriate frequencies and measured by SR860. The details of the AC ECE technique can be found in Refs. ikeda2019ac ; ikeda2021elastocaloric .
Data Availability
Source data are available for this paper. All other data that support the plots within this paper and other findings of this study are available from the corresponding author upon reasonable request.
Acknowledgments
We thank L. Balents, R. M. Fernandes, S. D. Wilson, Z. Wang, I. Zeljkovic and L. Zhao for helpful discussions. This work was mainly supported by NSF MRSEC at UW (DMR-2308979) and the Air Force Office of Scientific Research under grant FA9550-21-1-0068. Material synthesis at University of Washington was partially supported as part of Programmable Quantum Materials, an Energy Frontier Research Center funded by the U.S. Department of Energy (DOE), Office of Science, Basic Energy
Sciences (BES), under award no. DE-SC0019443. J.-H.C. also acknowledges support from the David and Lucile Packard Foundation and the support from the State of Washington funded Clean Energy Institute. The work at Beijing Institute of Technology was supported by the National Science Foundation of China (NSFC) (grant No. 92065109), Beijing Natural Science Foundation (grant nos Z210006 and Z190006). Z.W. thanks the Analysis and Testing Center at BIT for assistance in facility support. A portion of this work was performed at the National High Magnetic Field Laboratory, which is supported by the National Science Foundation Cooperative Agreement No. DMR-1644779 and the State of Florida.
Author contributions
J.-H.C. supervised the project. Z.L. performed the measurements with the help of Y.S., Q.J., E.R., J.D., C.H. and Y.Z. The single crystals were provided by J.L., Z.W. and Y.Y. High magnetic field measurements were supported by D.G. Z.L. and J.-H.C. analyzed the data and wrote the paper with comments from all coauthors on the paper.
Competing interests
The authors declare no competing interests.
Additional Information
Correspondence and requests for materials should be addressed to Z.L. and J.-H.C.
References
- (1) Neupert, T., Denner, M. M., Yin, J. X., Thomale, R. & Hasan, M. Z. Charge order and superconductivity in kagome materials. Nature Physics 18, 137–143 (2022). URL https://doi.org/10.1038/s41567-021-01404-y.
- (2) Guo, H.-M. & Franz, M. Topological insulator on the kagome lattice. Physical Review B 80, 113102 (2009). URL https://link.aps.org/doi/10.1103/PhysRevB.80.113102.
- (3) Liu, E. et al. Giant anomalous Hall effect in a ferromagnetic kagome-lattice semimetal. Nature Physics 14, 1125–1131 (2018). URL https://www.nature.com/articles/s41567-018-0234-5.
- (4) Ye, L. et al. Massive Dirac fermions in a ferromagnetic kagome metal. Nature 555, 638–642 (2018). URL https://doi.org/10.1038/nature25987.
- (5) Arachchige, H. W. S. et al. Charge density wave in kagome lattice intermetallic ScV6Sn6. Physical Review Letters 129, 216402 (2022). URL https://doi.org/10.1103/PhysRevLett.129.216402.
- (6) Teng, X. et al. Discovery of charge density wave in a kagome lattice antiferromagnet. Nature 609, 490–495 (2022). URL https://doi.org/10.1038/s41586-022-05034-z.
- (7) Ortiz, B. R. et al. CsV3Sb5: A Z2 Topological Kagome Metal with a Superconducting Ground State. Physical Review Letters 125, 247002 (2020). URL https://doi.org/10.1103/PhysRevLett.125.247002.
- (8) Ortiz, B. R. et al. New kagome prototype materials: Discovery of KV3Sb5, RbV3Sb5, and CsV3Sb5. Physical Review Materials 3, 94407 (2019). URL https://doi.org/10.1103/PhysRevMaterials.3.094407.
- (9) Liang, Z. et al. Three-Dimensional Charge Density Wave and Surface-Dependent Vortex-Core States in a Kagome Superconductor CsV3Sb5. Physical Review X 11, 031026 (2021). URL https://link.aps.org/doi/10.1103/PhysRevX.11.031026.
- (10) Li, H. et al. Discovery of conjoined charge density waves in the kagome superconductor CsV3Sb5. Nature Communications 13, 6348 (2022). URL https://doi.org/10.1038/s41467-022-33995-2.
- (11) Xiao, Q. et al. Coexistence of multiple stacking charge density waves in kagome superconductor CsV3Sb5. Physical Review Research 5, L012032 (2023). URL https://link.aps.org/doi/10.1103/PhysRevResearch.5.L012032.
- (12) Jiang, K. et al. Kagome superconductors AV3Sb5 (A = K, Rb, Cs). National Science Review 10, nwac199 (2023). URL https://doi.org/10.1093/nsr/nwac199.
- (13) Li, H. et al. Observation of Unconventional Charge Density Wave without Acoustic Phonon Anomaly in Kagome Superconductors CsV3Sb5 (A=Rb, Cs). Physical Review X 11, 1–9 (2021). URL https://doi.org/10.1103/PhysRevX.11.031050.
- (14) Xie, Y. et al. Electron-phonon coupling in the charge density wave state of CsV3Sb5. Physical Review B 105, L140501 (2022). URL https://link.aps.org/doi/10.1103/PhysRevB.105.L140501.
- (15) Christensen, M. H., Birol, T., Andersen, B. M. & Fernandes, R. M. Theory of the charge density wave in AV3Sb5 kagome metals. Physical Review B 104, 1–15 (2021). URL https://doi.org/10.1103/PhysRevB.104.214513.
- (16) Yang, S. Y. et al. Giant, unconventional anomalous Hall effect in the metallic frustrated magnet candidate, KV3Sb5. Science Advances 6, 1–8 (2020). URL https://www.science.org/doi/10.1126/sciadv.abb6003.
- (17) Yu, F. H. et al. Concurrence of anomalous Hall effect and charge density wave in a superconducting topological kagome metal. Phys. Rev. B 104, L041103 (2021). URL https://link.aps.org/doi/10.1103/PhysRevB.104.L041103.
- (18) Xu, Y. et al. Three-state nematicity and magneto-optical Kerr effect in the charge density waves in kagome superconductors. Nature physics 18, 1470–1475 (2022). URL https://doi.org/10.1038/s41567-022-01805-7.
- (19) Mielke, C. et al. Time-reversal symmetry-breaking charge order in a kagome superconductor. Nature 602, 245–250 (2022). URL http://dx.doi.org/10.1038/s41586-021-04327-z.
- (20) Yu, L. et al. Evidence of a hidden flux phase in the topological kagome metal CsV3Sb5. arXiv preprint arXiv:2107.10714 (2021). URL http://arxiv.org/abs/2107.10714.
- (21) Feng, X., Zhang, Y., Jiang, K. & Hu, J. Low-energy effective theory and symmetry classification of flux phases on the kagome lattice. Phys. Rev. B 104, 165136 (2021). URL https://link.aps.org/doi/10.1103/PhysRevB.104.165136.
- (22) Christensen, M. H., Birol, T., Andersen, B. M. & Fernandes, R. M. Loop currents in AV3Sb5 kagome metals: Multipolar and toroidal magnetic orders. Physical Review B 106, 144504 (2022). URL https://link.aps.org/doi/10.1103/PhysRevB.106.144504.
- (23) Saykin, D. R. et al. High resolution polar kerr effect studies of CsV3Sb5: Tests for time-reversal symmetry breaking below the charge-order transition. Phys. Rev. Lett. 131, 016901 (2023). URL https://link.aps.org/doi/10.1103/PhysRevLett.131.016901.
- (24) Xiang, Y. et al. Twofold symmetry of c-axis resistivity in topological kagome superconductor CsV3Sb5 with in-plane rotating magnetic field. Nature communications 12, 6727 (2021). URL https://doi.org/10.1038/s41467-021-27084-z.
- (25) Li, H. et al. Rotation symmetry breaking in the normal state of a kagome superconductor KV3Sb5. Nature Physics 18, 265–270 (2022). URL https://doi.org/10.1038/s41567-021-01479-7.
- (26) Li, H. et al. Unidirectional coherent quasiparticles in the high-temperature rotational symmetry broken phase of AV3Sb5 kagome superconductors. Nature Physics 1–7 (2023). URL https://www.nature.com/articles/s41567-022-01932-1.
- (27) Wulferding, D. et al. Emergent nematicity and intrinsic versus extrinsic electronic scattering processes in the kagome metal CsV3Sb5. Physical Review Research 4, 023215 (2022). URL https://link.aps.org/doi/10.1103/PhysRevResearch.4.023215.
- (28) Wu, S. et al. Charge density wave order in the kagome metal AV3Sb5 ( A = Cs , Rb , K ). Physical Review B 105, 155106 (2022). URL https://link.aps.org/doi/10.1103/PhysRevB.105.155106.
- (29) Wu, Q. et al. Simultaneous formation of two-fold rotation symmetry with charge order in the kagome superconductor CsV3Sb5 by optical polarization rotation measurement. Physical Review B 106, 205109 (2022). URL https://link.aps.org/doi/10.1103/PhysRevB.106.205109.
- (30) Jiang, Z. et al. Observation of electronic nematicity driven by the three-dimensional charge density wave in kagome lattice KV3Sb5. Nano Letters 23, 5625–5633 (2023). URL https://doi.org/10.1021/acs.nanolett.3c01151.
- (31) Luo, H. et al. Electronic nature of charge density wave and electron-phonon coupling in kagome superconductor KV3Sb5. Nature communications 13, 273 (2022). URL https://doi.org/10.1038/s41467-021-27946-6.
- (32) Kang, M. et al. Charge order landscape and competition with superconductivity in kagome metals. Nature Materials 22, 186–193 (2023). URL https://doi.org/10.1038/s41563-022-01375-2.
- (33) Nie, L. et al. Charge-density-wave-driven electronic nematicity in a kagome superconductor. Nature 604, 59–64 (2022). URL https://www.nature.com/articles/s41586-022-04493-8.
- (34) Sur, Y., Kim, K.-T., Kim, S. & Kim, K. H. Optimized superconductivity in the vicinity of a nematic quantum critical point in the kagome superconductor Cs(V1-xTix)3Sb5. Nature Communications 14, 3899 (2023). URL https://doi.org/10.1038/s41467-023-39495-1.
- (35) Fradkin, E., Kivelson, S. A., Lawler, M. J., Eisenstein, J. P. & Mackenzie, A. P. Nematic fermi fluids in condensed matter physics. Annu. Rev. Condens. Matter Phys. 1, 153–178 (2010). URL https://doi.org/10.1146/annurev-conmatphys-070909-103925.
- (36) Fernandes, R., Chubukov, A. & Schmalian, J. What drives nematic order in iron-based superconductors? Nature physics 10, 97–104 (2014). URL https://doi.org/10.1038/nphys2877.
- (37) Chu, J.-H., Kuo, H.-H., Analytis, J. G. & Fisher, I. R. Divergent nematic susceptibility in an iron arsenide superconductor. Science 337, 710–712 (2012). URL https://doi.org/10.1126/science.1221713.
- (38) Kuo, H.-H., Chu, J.-H., Palmstrom, J. C., Kivelson, S. A. & Fisher, I. R. Ubiquitous signatures of nematic quantum criticality in optimally doped Fe-based superconductors. Science 352, 958–962 (2016). URL https://doi.org/10.1126/science.aab0103.
- (39) Liu, Z. et al. Nematic quantum critical fluctuations in BaFe2-xNixAs2. Physical Review Letters 117, 157002 (2016). URL https://doi.org/10.1103/PhysRevLett.117.157002.
- (40) Gu, Y. et al. Unified phase diagram for iron-based superconductors. Physical Review Letters 119, 157001 (2017). URL https://doi.org/10.1103/PhysRevLett.119.157001.
- (41) Nie, L., Tarjus, G. & Kivelson, S. A. Quenched disorder and vestigial nematicity in the pseudogap regime of the cuprates. Proceedings of the National Academy of Sciences 111, 7980–7985 (2014). URL https://doi.org/10.1073/pnas.1406019111.
- (42) Fernandes, R. M., Orth, P. P. & Schmalian, J. Intertwined vestigial order in quantum materials: Nematicity and beyond. Annual Review of Condensed Matter Physics 10, 133–154 (2019). URL https://doi.org/10.1146/annurev-conmatphys-031218-013200.
- (43) Böhmer, A. E., Chu, J.-H., Lederer, S. & Yi, M. Nematicity and nematic fluctuations in iron-based superconductors. Nature Physics 18, 1412–1419 (2022). URL https://doi.org/10.1038/s41567-022-01833-3.
- (44) Park, T., Ye, M. & Balents, L. Electronic instabilities of kagome metals: saddle points and landau theory. Physical Review B 104, 035142 (2021). URL https://doi.org/10.1103/PhysRevB.104.035142.
- (45) Grandi, F., Consiglio, A., Sentef, M. A., Thomale, R. & Kennes, D. M. Theory of nematic charge orders in kagome metals. Physical Review B 107, 155131 (2023). URL https://doi.org/10.1103/PhysRevB.107.155131.
- (46) Denner, M. M., Thomale, R. & Neupert, T. Analysis of charge order in the kagome metal AV3Sb5 (A= K, Rb, Cs). Physical Review Letters 127, 217601 (2021). URL https://doi.org/10.1103/PhysRevLett.127.217601.
- (47) Tazai, R., Yamakawa, Y., Onari, S. & Kontani, H. Mechanism of exotic density-wave and beyond-migdal unconventional superconductivity in kagome metal av3sb5 (a= k, rb, cs). Science Advances 8, eabl4108 (2022). URL https://doi.org/10.1126/sciadv.abl4108.
- (48) Zhou, S. & Wang, Z. Chern fermi pocket, topological pair density wave, and charge-4e and charge-6e superconductivity in kagomé superconductors. Nature Communications 13, 7288 (2022). URL https://doi.org/10.1038/s41467-022-34832-2.
- (49) Wiecki, P. et al. Dominant in-plane symmetric elastoresistance in CsFe2As2. Physical Review Letters 125, 187001 (2020). URL https://doi.org/10.1103/PhysRevLett.125.187001.
- (50) Wiecki, P. et al. Emerging symmetric strain response and weakening nematic fluctuations in strongly hole-doped iron-based superconductors. Nature Communications 12, 4824 (2021). URL https://doi.org/10.1038/s41467-021-25121-5.
- (51) Rosenberg, E. W., Chu, J.-H., Ruff, J. P., Hristov, A. T. & Fisher, I. R. Divergence of the quadrupole-strain susceptibility of the electronic nematic system YbRu2Ge2. Proceedings of the National Academy of Sciences 116, 7232–7237 (2019). URL https://doi.org/10.1073/pnas.1818910116.
- (52) Ye, L. et al. Elastocaloric signatures of symmetric and antisymmetric strain-tuning of quadrupolar and magnetic phases in DyB2C2. arXiv:2211.12453 (2022). URL https://arxiv.org/abs/2211.12453.
- (53) Ortiz, B. R. et al. Fermi surface mapping and the nature of charge density wave order in the kagome superconductor CsV3Sb5. Physical Review X 11, 41030 (2021). URL https://doi.org/10.1103/PhysRevX.11.041030.
- (54) Fu, Y. et al. Quantum transport evidence of topological band structures of kagome superconductor CsV3Sb5. Physical Review Letters 127, 207002 (2021). URL https://doi.org/10.1103/PhysRevLett.127.207002.
- (55) Fernandes, R. M. & Venderbos, J. W. Nematicity with a twist: Rotational symmetry breaking in a moiré superlattice. Science Advances 6, eaba8834 (2020). URL https://doi.org/10.1126/sciadv.aba8834.
- (56) Shapiro, M., Hristov, A., Palmstrom, J., Chu, J.-H. & Fisher, I. Measurement of the B1g and B2g components of the elastoresistivity tensor for tetragonal materials via transverse resistivity configurations. Review of Scientific Instruments 87, 063902 (2016). URL https://doi.org/10.1063/1.4953334.
- (57) Ikeda, M. S. et al. AC elastocaloric effect as a probe for thermodynamic signatures of continuous phase transitions. Review of Scientific Instruments 90, 083902 (2019). URL https://doi.org/10.1063/1.5099924.
- (58) Ikeda, M. S. et al. Elastocaloric signature of nematic fluctuations. Proceedings of the National Academy of Sciences 118, e2105911118 (2021). URL https://doi.org/10.1073/pnas.2105911118.
- (59) Hristov, A. T., Ikeda, M. S., Palmstrom, J. C., Walmsley, P. & Fisher, I. R. Elastoresistive and elastocaloric anomalies at magnetic and electronic-nematic critical points. Phys. Rev. B 99, 100101 (2019). URL https://link.aps.org/doi/10.1103/PhysRevB.99.100101.
- (60) Qian, T. et al. Revealing the competition between charge density wave and superconductivity in CsV3Sb5 through uniaxial strain. Physical Review B 104, 144506 (2021).
- (61) Wu, Q. et al. Simultaneous formation of two-fold rotation symmetry with charge order in the kagome superconductor CsV3Sb5 by optical polarization rotation measurement. Physical Review B 106, 205109 (2022). URL https://link.aps.org/doi/10.1103/PhysRevB.106.205109.
- (62) Guo, C. et al. Correlated order at the tipping point in the kagome metal CsV3Sb5. arXiv preprint arXiv:2304.00972 (2023). URL https://doi.org/10.48550/arXiv.2304.00972.
- (63) Guo, C. et al. Switchable chiral transport in charge-ordered kagome metal CsV3Sb5. Nature 611, 461–466 (2022). URL https://doi.org/10.1038/s41586-022-05127-9.
- (64) Wang, Z. et al. Electronic nature of chiral charge order in the kagome superconductor CsV3Sb5. Physical Review B 104, 075148 (2021). URL https://link.aps.org/doi/10.1103/PhysRevB.104.075148.