MEMO: Dataset and Methods for Robust Multimodal Retinal Image Registration with Large or Small Vessel Density Differences
Abstract
The measurement of retinal blood flow (RBF) in capillaries can provide a powerful biomarker for the early diagnosis and treatment of ocular diseases. However, no single modality can determine capillary flowrates with high precision. Combining erythrocyte-mediated angiography (EMA) with optical coherence tomography angiography (OCTA) has the potential to achieve this goal, as EMA can measure the absolute 2D RBF of retinal microvasculature and OCTA can provide the 3D structural images of capillaries. However, multimodal retinal image registration between these two modalities remains largely unexplored. To fill this gap, we establish MEMO, the first public multimodal EMA and OCTA retinal image dataset. A unique challenge in multimodal retinal image registration between these modalities is the relatively large difference in vessel density (VD). To address this challenge, we propose a segmentation-based deep-learning framework (VDD-Reg) and a new evaluation metric (MSD), which provide robust results despite differences in vessel density. VDD-Reg consists of a vessel segmentation module and a registration module. To train the vessel segmentation module, we further designed a two-stage semi-supervised learning framework (LVD-Seg) combining supervised and unsupervised losses. We demonstrate that VDD-Reg outperforms baseline methods quantitatively and qualitatively for cases of both small VD differences (using the CF-FA dataset) and large VD differences (using our MEMO dataset). Moreover, VDD-Reg requires as few as three annotated vessel segmentation masks to maintain its accuracy, demonstrating its feasibility.
Erythrocyte mediated angiography, optical coherence tomography angiography, multi-modal retinal image registration.
1 Introduction
Retinal blood flow (RBF) is a key functional biomarker, implicated in three of the four major causes of blindness worldwide, glaucoma [1], diabetic retinopathy [2], age-related macular degeneration [3], as well as in neurodegenerative diseases such as Alzheimer’s dementia [4, 5]. Specifically, RBF in capillaries may provide sensitive biomarkers for the early diagnosis of ocular diseases, and could aid in the development of novel therapies. Unfortunately, accurately measuring RBF in capillaries is challenging because it requires the precise measurement of both absolute erythrocyte velocities and capillary width. Moreover, it also has high requirements of sensor resolution and repeatability.
Current methods of measuring RBF are limited. For instance, laser Doppler imaging [6] is limited by high variability of measured flowrates. Dynamic OCTA [7, 8] and color Doppler imaging [9] can only measure relative flowrates, leading to poor intra-platform and cross-platform measurement repeatability. Adaptive optics scanning laser ophthalmoscopy (AO-SLO) [10, 11] and AO-OCT [12, 13] have a limited field of view. Erythrocyte mediated angiography (EMA) [14], on the other hand, is a novel technique which has the capability of determining absolute erythrocyte flowrates of arterioles and venules in vivo with high precision and a large field of view. EMA determines the flowrates by following the motion of individual fluorescently labelled erythrocyte ghosts in the retinal capillary circulation which can be visualized in vivo [15, 16, 17]. Despite the aforementioned advantages, a major limitation of EMA is that it cannot determine the axial location of capillaries. EMA images are captured in 2D using a scanning laser ophthalmoscope, but capillaries are located across different retinal layers [18].
One potential solution to address the limitation of EMA is to combine it with other modalities providing 3D structural imaging of retinal capillaries. Optical coherence tomography angiography (OCTA) is an ideal candidate, as it can generate high-resolution 3D structural images of retinal capillaries [19, 20, 21]. Combining EMA and OCTA may enable absolute capillary RBF measurement for diagnosis and treatments of ocular diseases. A key requirement for this is accurate registration. Manual approaches to registration are time-consuming, necessitating the development of an automated approach to registration of EMA and OCTA image pairs.
Multimodal retinal image registration has been extensively studied in recent years [22, 23, 24, 25, 26, 27, 28, 29]. However, current approaches have primarily utilized the public CF-FA dataset [30] (color fundus and fluorescein angiography) or private datasets with modalities other than EMA and OCTA, such as CF and fundus autofluorescence (FAF) [22, 23], and CF and infrared reflectance (IR) imaging [23, 27, 28]. The lack of new and publicly available multimodal retinal image datasets not only makes it difficult for researchers to fairly and thoroughly compare every method, but also prevents the identification of new challenges of registering image pairs from different modalities.
To fill in this gap, we conducted experiments on nonhuman primates, to create a public dataset of EMA and OCTA pairs [31]. This dataset has the unique features of being well-controlled, one of the few datasets that includes OCtA images and the only dataset to include EMA sequences. We intend to expand the dataset to include human images. This dataset is described as the multimodal EMA and OCTA (MEMO) retinal image dataset. MEMO contains EMA and OCTA image pairs with manually labeled matched points for studying multimodal retinal image registration. Additionally, MEMO includes OCTA projection images [32] from three different layers (superficial vascular plexus (SVP), intermediate capillary plexus (ICP) and deep capillary plexus (DCP)) and EMA image sequences with moving erythrocytes.
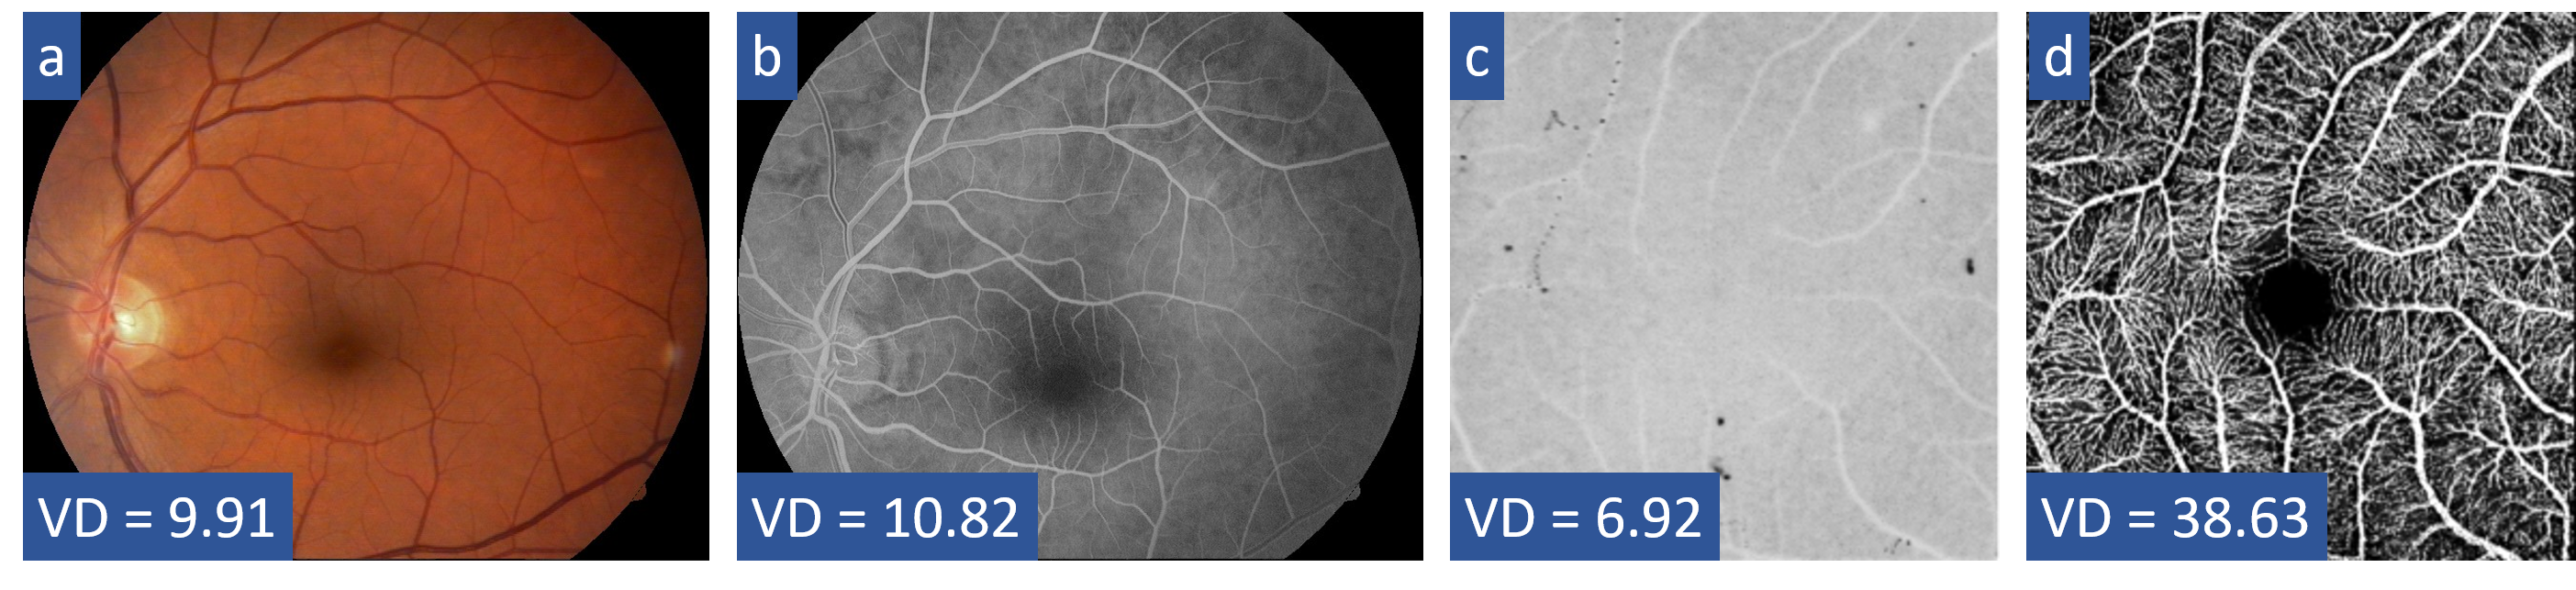
Using the MEMO dataset, we address a unique challenge in multimodal retinal image registration between EMA and OCTA images arising from the relatively large difference in vessel density between the two modalities. In this paper, the vessel density (VD) is defined as the proportion of image area occupied by vessels divided by the entire captured area. As compared to other modalities available in public datasets, such as CF-FA [30], EMA and OCTA have a VD difference over 30% between the two modalities (Fig. 1). Through extensive experiments, we found that large VD differences dramatically decrease registration performance, as the majority of smaller vessels in OCTA could not be visualized in EMA due to fundamental differences in image acquisition.
To overcome the challenges posed by large VD differences, we further propose VDD-Reg, a segmentation-based deep-learning framework for multimodal retinal image registration that can robustly register two imaging modalities despite vessel density differences. VDD-Reg consists of a vessel segmentation module and a registration module. For the vessel segmentation module, we also designed a novel two-stage semi-supervised learning framework, LVD-Seg, which requires only a few (e.g., three) labeled vessel segmentation masks from the modality with lower vessel density (EMA in our case). Specifically, LVD-Seg first uses a supervised loss (i.e., MSE) to stabilize the training of the vessel segmentation module, and then uses an unsupervised loss (i.e., style loss [33]) to further improve the segmentation and registration results.
Finally, we found that Soft Dice [27], a recently proposed image registration metric extended from Dice, could not accurately distinguish which method was better when large VD differences were present and when the results of each method did not exhibit significant differences. As a result, we propose a new registration metric called Masked Soft Dice (MSD). MSD considers only the pixels within the ground truth vessel segmentation masks of the modality with lower VD, which can more accurately evaluate each method in our MEMO dataset. With both MSD and standard registration metrics, we show that VDD-Reg can not only achieve the same level of accuracy as competing methods in datasets with similar vessel densities (CF-FA [30]), but also maintain high performance with large differences in VD, as in our MEMO dataset.
The contributions of our work can be summarized as follows:
-
1.
We establish MEMO, the first public multimodal EMA and OCTA retinal image dataset. MEMO provides registration ground truth, three layers of OCTA projection images and EMA image sequences containing moving erythrocytes. This has the potential for use in any resaerch involving OCtA registration with other modalities that use a scanning laser ophthalmoscope. MEMO is available at https://chiaoyiwang0424.github.io/MEMO/.
-
2.
We address the unique challenge of retinal image registration between modalities with a large difference in vessel density (VD). To the best of our knowledge, MEMO is the first public multimodal retinal image dataset having this characteristic.
-
3.
We propose a segmentation-based deep-learning framework, VDD-Reg, for multimodal retinal image registration that is robust with respect to vessel density differences. To train the segmentation module in VDD-Reg, we further designed a two-stage semi-supervised learning framework, LVD-Seg, which requires as few as three labeled vessel segmentation masks.
-
4.
We introduce a registration metric, Masked Soft Dice (MSD), specifically designed for multimodal retinal image datasets with large VD differences.
The rest of the paper is organized as follows. Section 2 summarizes the existing public retinal image datasets with image pairs and multimodal retinal image registration methods. Section 3 illustrates the details of our MEMO dataset. In Section 4, we describe the proposed VDD-Reg framework. Section 5 illustrates our experimental settings. Section 6 and Section 7 present the results and discussion. Section 8 includes the conclusion of the paper.
| Dataset | Multi-modal | Modality | Pair / Image Number | Global Registration Ground truth | ||
|---|---|---|---|---|---|---|
| e-ophtha [34] | - | Color Fundus | 144 pairs | - | ||
| RODREP [35] | - | Color Fundus | 1400 pairs | - | ||
| VARIA [36] | - | Fundus Image | 154 pairs | - | ||
| FIRE [37] | - | Color Fundus | 134 pairs | ✓ | ||
| FLORI21 [38] | - | Ultra-widefield fluorescein angiography | 15 pairs | ✓ | ||
| CF-FA [30] | ✓ | 1. Color Fundus 2. Fluorescein Angiography | 59 pairs | - | ||
| PRIME-FP20 [39] | ✓ |
|
15 pairs | - | ||
| OCTA-500 [40] | ✓ | 1. OCTA 2. OCT | 500 pairs | - | ||
| MEMO (Our Dataset) | ✓ | 1. EMA 2. OCTA | 30 pairs | ✓ |
2 Related Works
2.1 Retinal Image Datasets with Image Pairs
Existing public retinal image datasets with image pairs are listed in Table 1. Here, we focus on datasets with image pairs as they are more relevant to the main scope of this paper on multimodal retinal image registration. Private (in-house) datasets were excluded as they cannot be freely used to evaluate methods.
The datasets listed in Table 1 can be divided into monomodal and multimodal ones. Among the monomodal datasets, only FLORI21 [38] provides ultra-widefield fluorescein angiography images while the others [34, 35, 36, 37] provide fundus images. To be more specific, e-ophtha [34] contains 144 image pairs with large and small overlapping regions. RODREP [35] provides 1400 image pairs acquired from 140 eyes, but the overlap of each pair is limited. VARIA [36] provides 154 image pairs with only large overlapped areas due to its small FOV. The above three datasets do not provide a registration ground truth. In contrast, FIRE [37] provides registration ground truth, consisting of 134 fundus image pairs with both large and small areas of overlap. Ten corresponding points are provided for each image pair. FLORI21 [38] also provides registration ground truth and contains image pairs from 5 different subjects. Although FIRE and FLORI21 are useful for image registration research, they contain images from only one modality.
Table 1 demonstrates that public multimodal retinal image datasets with image pairs are relatively rare. CF-FA [30] contains 59 pairs of color fundus (CF) and fluorescein angiograms (FA). Twenty-nine pairs were collected from healthy eyes, while the rest were collected from eyes with diseases. Although CF-FA has been widely used for multimodal retinal image registration, the registration ground truth is not officially provided and the vessel density (VD) difference between the two modalities is relatively small. PRIME-FP20 [39] contains several ultra-wide field fundus photography (FP) and ultra-wide field fundus angiography (FA) retinal image pairs. However, it provides only the vessel segmentation ground truth of ultra-wide field fundus photography without providing the registration ground truth. OCTA-500 [40] provides 500 pairs of OCT and OCTA images with vessel segmentation ground truth. Despite its large size, the image pairs of OCT and OCTA were completely aligned, limiting its usage for multimodal retinal image registration.
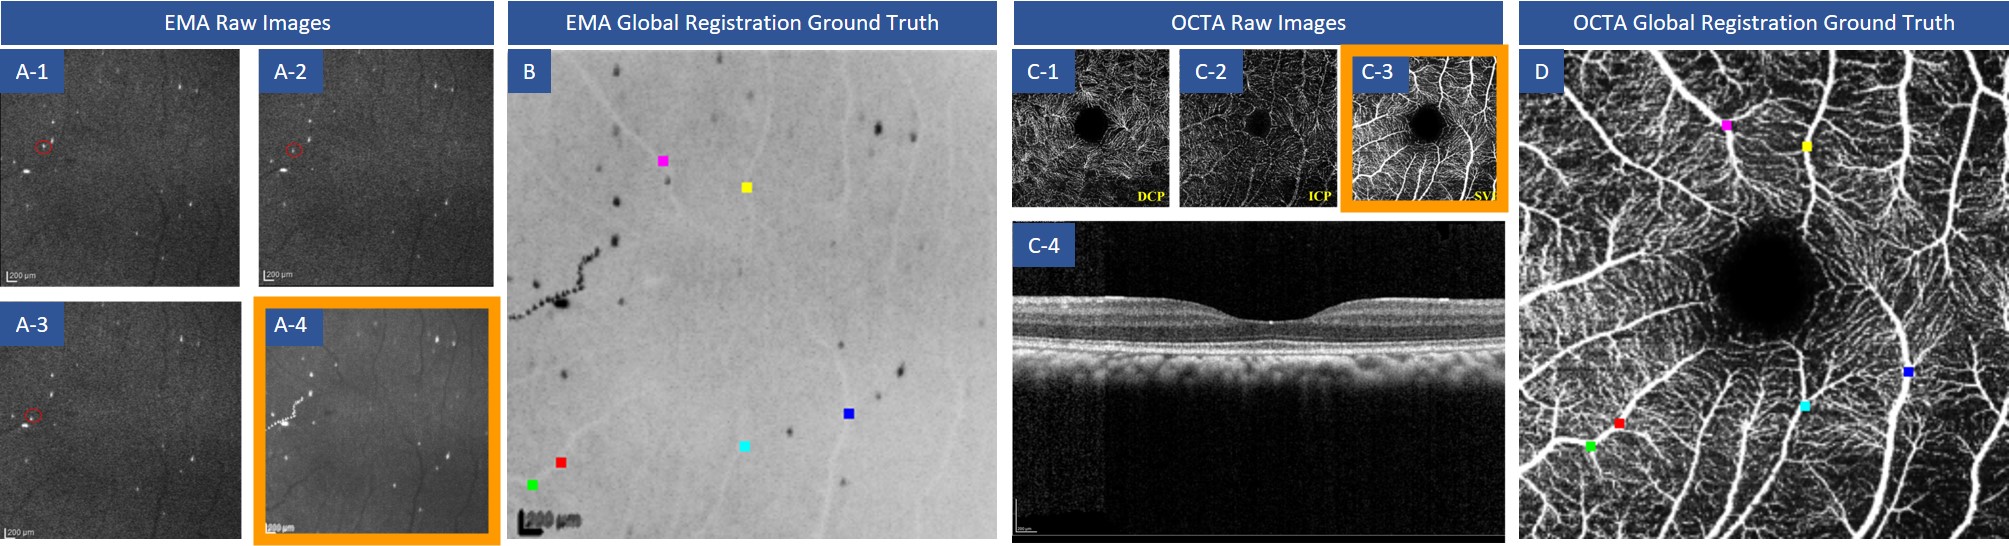
Compared to the above datasets, MEMO has three major advantages. Firstly, MEMO is the first public multimodal retinal image dataset providing two modalities with relatively large VD differences. Secondly, the global registration ground truth is provided by manually labeling six corresponding point pairs per image pair. Finally, MEMO additionally provides raw EMA image sequences and OCTA projection images, which may be useful for multiple research fields such as automated erythrocyte tracking.
2.2 Multi-Modal Retinal Image Registration
Multimodal retinal image registration methods can be categorized into conventional and deep learning-based methods. The conventional methods can be further divided into two types: direct and indirect methods. The direct conventional methods try to detect and match features directly on the raw images by manually designing more powerful feature descriptors or more robust matching algorithms. For example, Chen et al. [41] proposed a partial intensity invariant feature descriptor (PIIFD) and designed an image registration framework called Harris-PIIFD based on the proposed descriptor. Ghassabi et al. [42] combined UR-SIFT and PIIFD for image registration with large content or scale changes. Wang et al. [43] presented an image registration framework combining SURF, PIIFD and robust point matching. Lee et al. [44] introduced a low-dimensional step pattern analysis method to align retinal image pairs that were poorly aligned with baseline methods. Hossein-Nejad et al. [45] adopted adaptive Random Sample Consensus (A-RANSAC) for feature matching. On the other hand, the indirect conventional methods attempt to first transfer the images from different modalities into a similar ”style”, such as the vessel mask or the phase image, before detecting and matching features. For instance, Hernandez et al. [46] proposed line structures segmentation with a tensor-voting approach to improve registration. Hervella et al. [47] combined feature-based and intensity-based registration methods and employed a domain-adapted similarity metric to detect vessel bifurcations and crossovers. Motta et al. [48] proposed a registration framework based on optimal transport theory for vessel extraction on retinal fundus images. Li et al. [49] proposed a two-step registration method which converted raw images into phase images and adopted log-Gabor filters for global registration.
Recently, many deep learning-based multimodal retinal image registration methods have been proposed, demonstrating comparable or superior performance as compared to conventional methods. Similar to the conventional methods, deep learning-based methods can also be roughly divided into direct and indirect methods. The direct deep learning-based methods usually try to directly learn a feature matching network using raw image datasets. For example, De Silva et al. [23] proposed an end-to-end network following the conventional feature point-based registration steps, using a VGG-16 feature extractor [50] and a feature matching network for predicting patch displacements. Lee et al. [26] extracted pattern patches surrounding the intersection points and used a Convolutional Neural Network (CNN) to select matched patches. The indirect deep learning-based methods, on the other hand, try to learn a transformation network to first transform the two modalities into the same domain such as the vessel mask instead of directly performing image registration. For instance, Arikan et al. [25] used a U-Net for vessel segmentation and a mask R-CNN for vessel junctions detection based on supervised learning before multimodal image registration. Luo et al. [24] proposed a two-stage affine registration framework. The first stage used two individual U-Nets to segment the optic discs in two modalities, and the second stage adopted ResNet for fine registration. Zhang et al. [27] proposed a vessel segmentation-based two-step registration method integrating global and deformable registration. Their vessel segmentation networks were trained with a deformable registration network using ground truth registration affine matrices. Wang et al. [28] proposed a content-adaptive multimodal retinal image registration method, which adopted pixel-adaptive convolution (PAC) [51] and style loss [33] in their vessel segmentation network. In addition to transforming images into the vessel masks, Santarossa et al. [22] and Sindel et al. [29] applied CycleGAN [52] to transform the images from one modality to the other before extracting features.
Although many methods have been proposed for multimodal retinal image registration, none of them tackle the registration between EMA and OCTA. Compared to the modalities used in existing works, the vessel density (VD) difference between EMA and OCTA used in our MEMO dataset is relatively large, making image registration much more challenging.
3 The MEMO Dataset
3.1 Overview
A sample EMA and OCTA image pair from the MEMO dataset is shown in Fig. 2. The dataset contains 30 pairs of EMA and OCTA images. For each image pair, 6 corresponding point pairs were manually annotated. The annotated points were chosen from the visually distinctive points in EMA and OCTA images, such as vessel bifurcation points and vessel bending points. All images were acquired following a protocol approved by Institutional Animal Care and Use Committee of the University of Maryland, Baltimore. Four eyes from two rhesus monkeys (macaca mulatta) were used to acquired paired EMA and OCTA images. Each pair was collected in the same session on the same date. Prior to the experimental session, the animal was sedated with ketamine and xylazine (5-10 and 0.2-0.4 mg/kg by intramuscular injection). The animal was intubated by trained veterinary technicians with an endotracheal tube and general anesthesia was maintained with 1.5% to 3% isoflurane with 100% oxygen. The animal was paralyzed with vecuronium (40-60 ug/kg, followed by 0.35-45 ug/kg/min), preventing eye movement during image acquisition. Body temperature was maintained at physiologic levels using a thermal blanket and blood pressure was monitored using a blood pressure cuff on the arm. The animal was laid in a prone position during the imaging session. A wire lid speculum was used to keep the eyelids open during imaging and tropicamide 1% was administered for pupillary dilation.
3.2 EMA
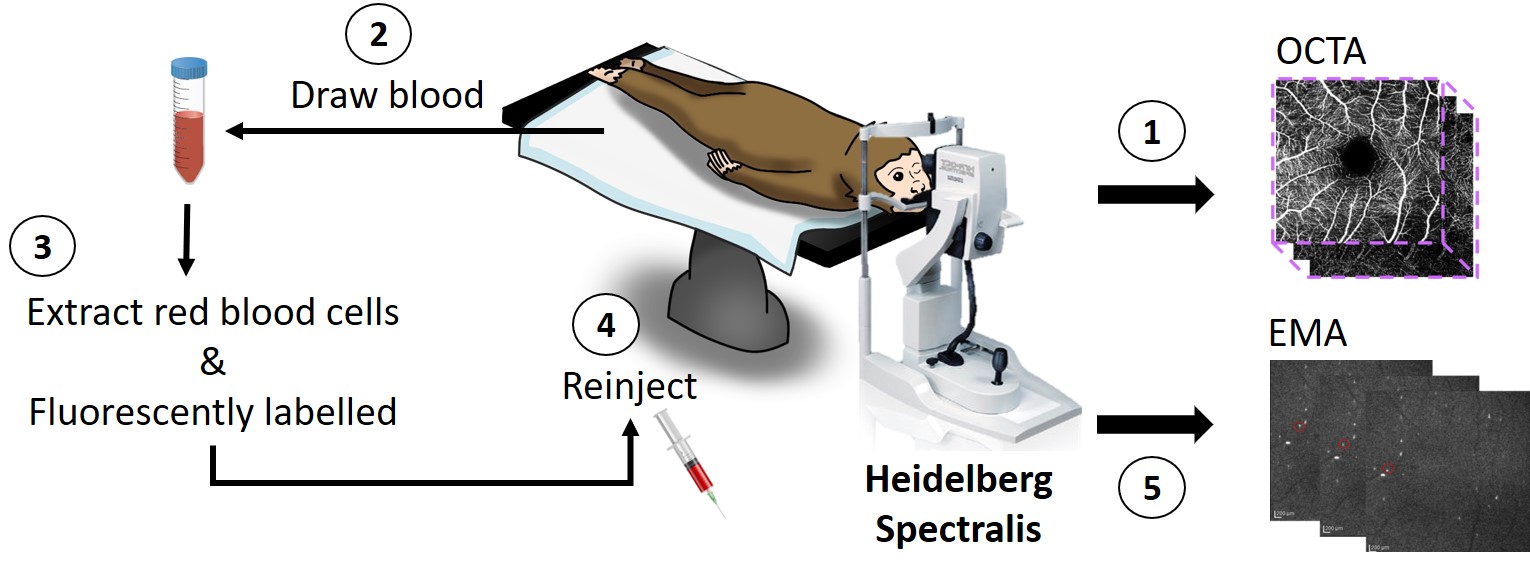
The procedure for EMA image acquisition is shown in Fig. 3. All EMA image sequences were captured by a Heidelberg Spectralis platform (Heidelberg Engineering, Heidelberg Germany). Approximately 17 mL of blood was drawn for processing with 5,6-carboxyfluorescein diacetate succinimidyl ester (CFSE) (Molecular Probes, USA) reconstituted in anhydrous dimethyl sulfoxide. Autologous erythrocytes were isolated from whole blood and loaded with 7.5 mM of CFSE using the osmotic shock method that has been detailed in prior publications [53]. Following cell preparation, up to 1.2 mL of CFSE-loaded cells were intravenously injected during image acquisition. After the cells were injected, ten-second angiograms centered on the macula were obtained with the Heidelberg Spectralis (Heidelberg Engineering GmbH, Germany) using a high speed 15-degree horizontal x 15-degree vertical field of view taken at 15 frames per second.
All image frames from the EMA image sequences were stored in TIF format. Six image sequences had the resolution of pixels, while the other 24 had the resolution of pixels. The pixel size of every EMA image sequence was provided. The stacked image of each EMA image sequence was used for registration ground truth labeling.
3.3 OCTA
The procedure for OCTA image acquisition is also shown in Fig. 3. OCTA scans centered on the fovea were taken using the same Heidelberg Spectralis with a degree protocol, consisting of 512 a-scans 512 b-scans with 5-10 microns between b-scans and 5-7 frames averaged per b-scan location. Projection images of the superficial vascular plexus (SVP), intermediate capillary plexus (ICP), and deep capillary plexus (DCP) were generated using the segmentation algorithms and slab definitions provided by the Spectralis software (Heidelberg Eye Explorer, version 1.10.3.0, Heidelberg Engineering, Germany). The SVP slab was defined as between the internal limiting membrane to the anterior border of the inner plexiform layer, the ICP included the entire inner plexiform layer, and the DCP ranged from the posterior border of the inner plexiform layer to the anterior border of the outer plexiform layer. The projection images were processed using projection artifact removal (PAR).
All images from the OCTA image groups were stored in TIF format. Each of the OCTA image groups contained three images from the three layers (i.e., SVP, ICP and DCP). Fifteen OCTA image groups had the resolution of pixels, while the other 15 had a resolution of pixels. The SVP image from each OCTA image group was used for registration ground truth labeling.
4 Proposed Method
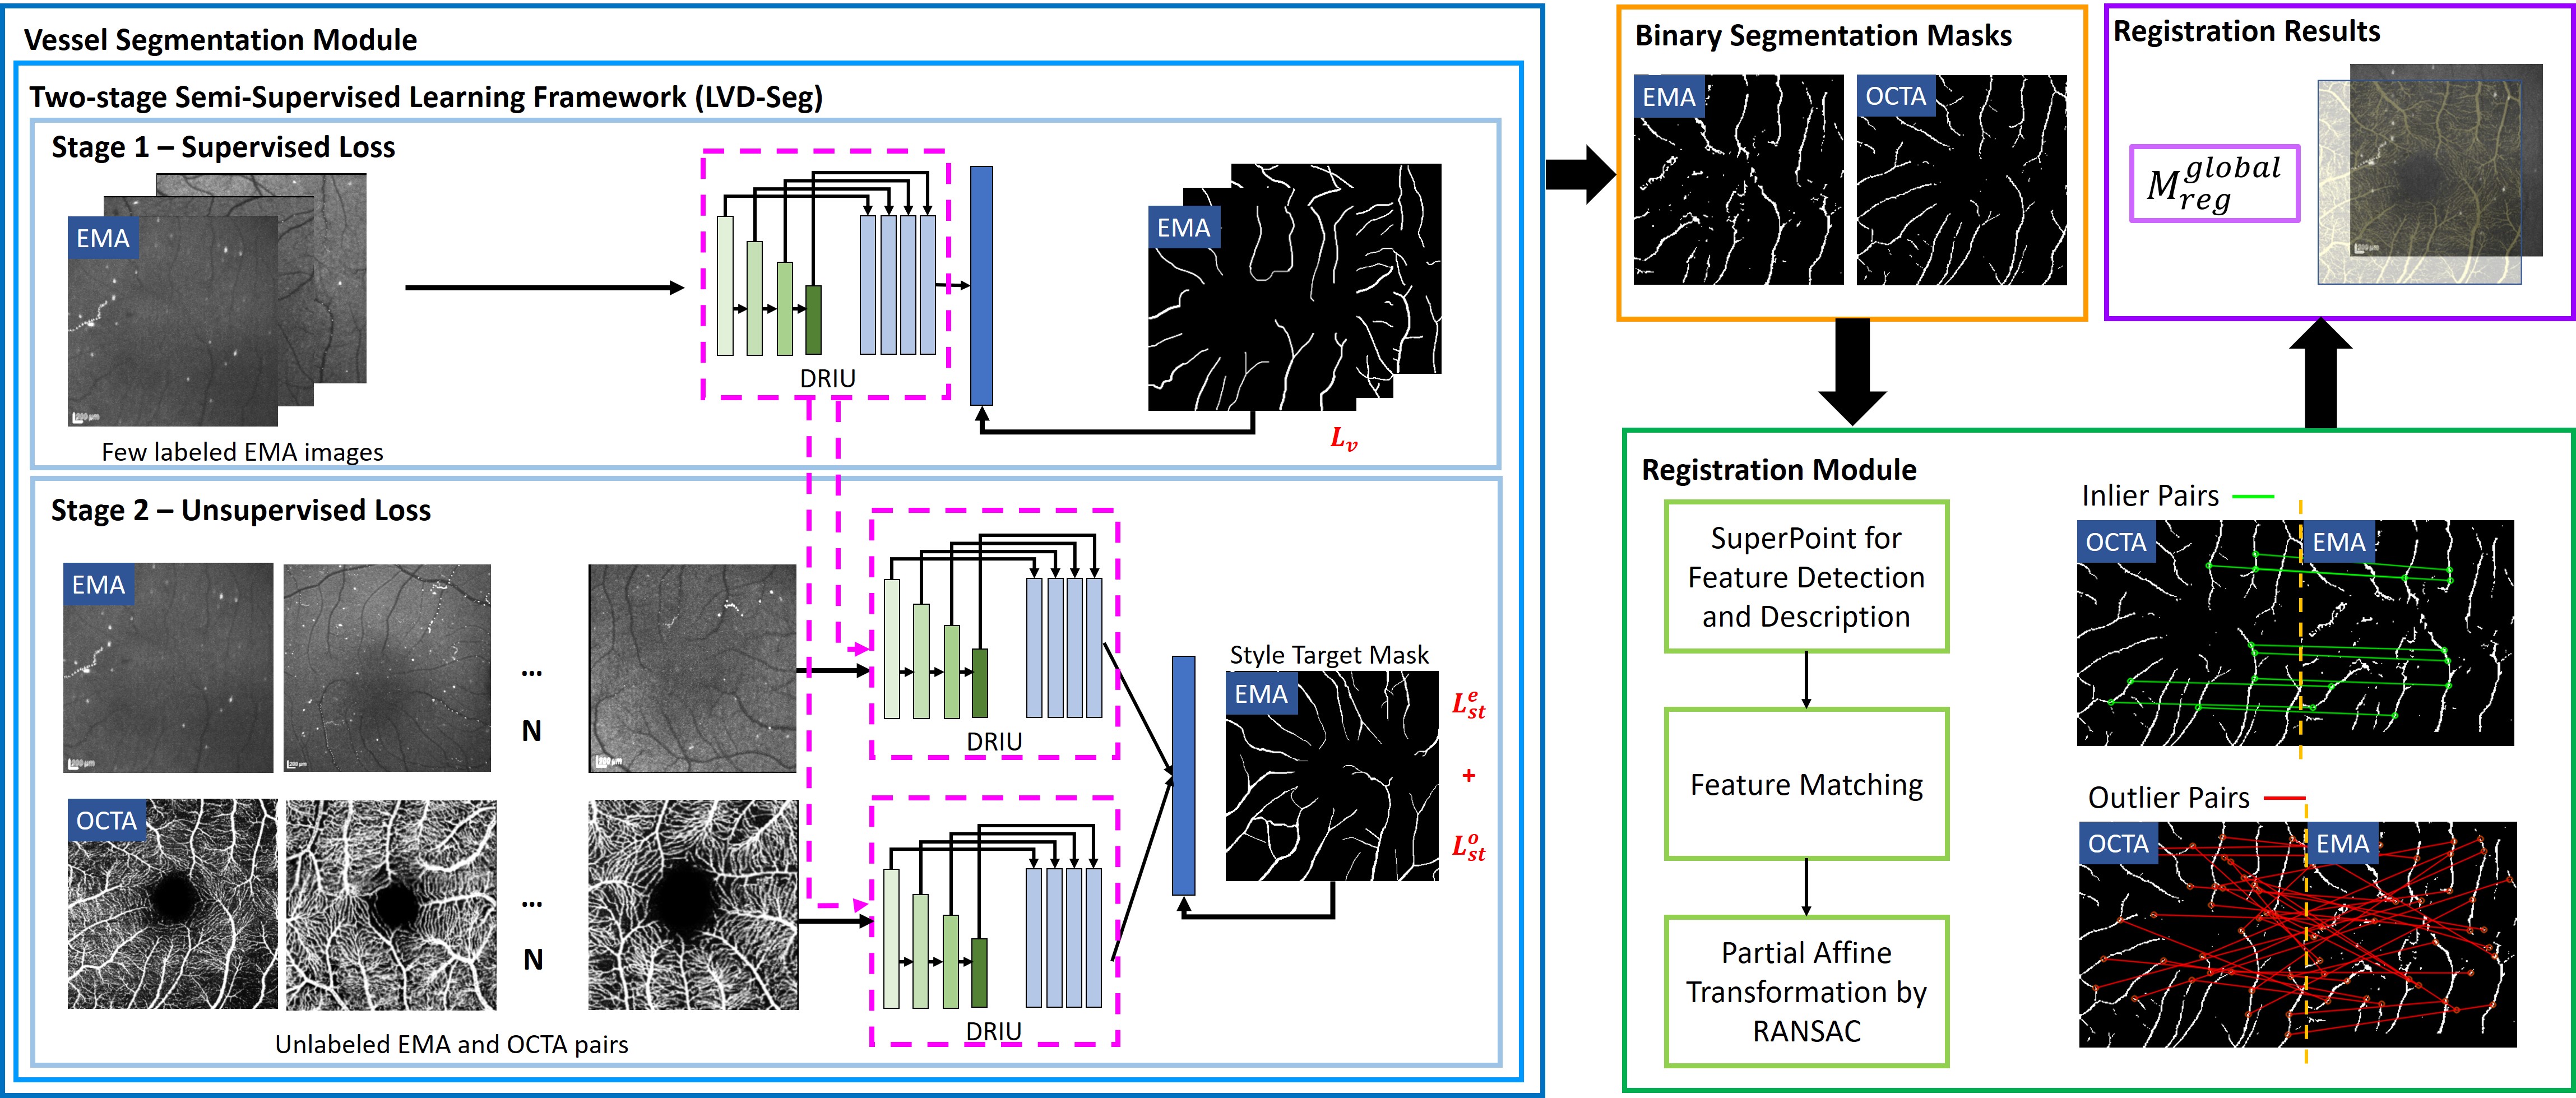
The overview of the proposed framework, VDD-Reg, for multimodal retinal image registration is shown in Fig. 4, which consists of a vessel segmentation module and a registration module. In VDD-Reg, multimodal images were first transformed into binary vessel masks by the vessel segmentation module. The global registration matrix was then estimated by the registration module from the two binary vessel masks.
4.1 Vessel Segmentation Module
4.1.1 LVD-Seg Background
As discussed in Section 2.2, vessel segmentation has been frequently used as the first step for multimodal retinal image registration [25, 27, 28, 47, 46, 48], primarily because features of vessels are considered to be more consistent across different modalities. Recently, deep learning-based vessel segmentation methods have shown superior performance. They can be categorized into two groups, supervised [25, 54] and unsupervised methods [27, 28], which present different limitations. The supervised vessel segmentation methods [25, 54] usually require a large number of high-quality pixel-level vessel masks for training to ensure test performance. However, such high-quality pixel-level vessel masks are often difficult and time-consuming to acquire. To avoid the need for pixel-level ground truth, an unsupervised vessel segmentation method based on style transfer has been proposed [27, 28]. However, because of the lack of direct supervision, we found that training the segmentation networks with style loss alone produced unreliable results on our MEMO dataset due to the large VD difference between EMA and OCTA images (Sec. 7.1). To alleviate the limitations of both supervised and unsupervised vessel segmentation methods, we designed a novel two-stage semi-supervised learning framework, LVD-Seg, to train our vessel segmentation module. Details of the two stages are described as follows.
4.1.2 LVD-Seg Stage 1 - Supervised Loss
In this stage, we trained our vessel segmentation module on manually-annotated EMA vessel segmentation masks, where could be as few as three according to our experiment results (Sec. 7.2). We used EMA vessel segmentation masks because the VD of EMA is much smaller than that of OCTA. This is because OCTA images contain a plethora of small capillaries which do not present in the corresponding EMA images and are not helpful for image registration. Moreover, labeling the less complex EMA vessel segmentation masks is much more feasible in terms of efficiency than labeling OCTA vessel segmentation masks.
Following [27, 28], we adopted the DRIU [54] network for segmenting EMA images. The DRIU network used a pre-trained VGG-16 network [50] for feature extraction and was followed by a segmentation prediction layer. The mean squared error (MSE), denoted as , was adopted to train the network, which is defined as
| (1) |
represents the input EMA image and represents the ground truth EMA mask. represents the predicted segmentation mask of . represents the pixel of the predicted segmentation mask or the ground truth mask. denotes the total number of pixels. In addition to MSE, the self-comparison loss [27, 28], denoted as , was also adopted to make the prediction robust against input image rotation. Specifically, is defined as
| (2) |
where represents rotated by . Here, can be seen as an alternative way to perform data augmentation. Overall, the training loss for stage 1, denoted as , can be written as
| (3) |
where and represent the weighting factors for the MSE and the self-comparison loss. In this paper, and were set to 1 and 1e-3, respectively. The trained weights of the EMA vessel segmentation network in stage 1 were used to initialize both the EMA and OCTA vessel segmentation networks in stage 2.
4.1.3 LVD-Seg Stage 2 - Unsupervised Loss
Training a vessel segmentation network directly with supervised losses on very few ground truth vessel masks may not work well on a larger test set. Moreover, it is unknown whether the segmentation network trained on EMA images can extract vessels well in OCTA images for multimodal image registration, especially when a relatively large VD difference exists between the two modalities. To deal with these potential issues, we further optimized the segmentation networks using style loss [27, 28, 33] with a joint style target mask, a stand-alone EMA ground truth segmentation mask. Using a joint style target mask with style loss encouraged the EMA and OCTA segmentation networks to segment shared vessels.
Style loss penalized the difference between the predicted segmentation mask and the style target mask using Gram matrices. The Gram matrix was used to capture the style information but remove the spatial information, which can be written as
| (4) |
Here, denotes the feature map with shape obtained from the layer of the pre-trained VGG-16 network [50] by feeding the network with input image . Style loss () is then defined as the squared Frobenius norm of the difference between the Gram matrices of the predicted segmentation mask () and the style target mask (), which can be written as
| (5) |
| (6) |
represents the input EMA or OCTA image. Style loss was computed at four different layers of the VGG-16 network. Overall, the training loss for stage 2, denoted as , can be written as
| (7) |
Note that the two different modalities used different weighting factors for style loss. The self-comparison loss was also adopted as an additional constraint for the predicted segmentation masks. In this paper, , and were set to 100, 1 and 1e-3, respectively.
The outputs of the segmentation module were EMA and OCTA pixel-wise probability maps, which represented the probability of each pixel belonging to a vessel. The probability maps were transformed into binary segmentation masks with threshold set to 0.5.
4.2 Registration Module
4.2.1 Feature Detection and Description
We adopted pre-trained SuperPoint [55] as our feature detector and descriptor since it demonstrated good performance on detecting feature points of binary segmentation masks [27]. SuperPoint contains a shared encoder, an interest point decoder and a descriptor decoder. It was first trained on a synthetic dataset with labeled interest points to detect feature points. Next, Homographic Adaptation was used to self-label a large unlabeled real world image dataset. Finally, the model was jointly-trained to extract feature points and their corresponding descriptors with self-supervision. We refer the readers to [55] for more details. In this paper, the non-maximum suppression distance was set to 4 and the detector confidence threshold was set to 0.015 for keypoint detection.
4.2.2 Feature Matching and Registration
We determined the matched feature points based on bidirectional calculation of the minimum Euclidean distance. That is, a feature point X in an OCTA image is said to match a feature point Y in the corresponding EMA image only when the Euclidean distance between each other’s feature descriptors is smaller than (1) the Euclidean distance between X and any other feature point in the EMA image and (2) the Euclidean distance between Y and any other feature point in the OCTA image. The Random Sample Consensus (RANSAC) [56] method was applied to remove outliers and estimate the partial affine transformation matrix between the EMA and OCTA pair. Here, the partial affine transformation (i.e., 4 degrees of freedom) was adopted because the EMA and OCTA images in MEMO already have the same pixel density (i.e., scale factor).
5 Experimental Settings
5.1 Dataset
We used our MEMO dataset and the CF-FA [30] dataset to conduct the experiments. The two datasets were chosen to examine how the proposed and the competing methods performed for both scenarios of small VD differences (using the CF-FA dataset) and large VD differences (using our MEMO dataset).
5.1.1 The MEMO Dataset
The MEMO dataset contains 30 pairs of images. Fifteen pairs (with even indices) were selected as the training set, and the rest of the pairs (with odd indices) were used as the test set. For OCTA, the SVP layer projection images were used in our experiments because they contained clearer arterioles and venules, which could also be observed in EMA images. For EMA, the stacked image of each EMA image sequence was used for the purpose of denoising. Furthermore, we annotated the vessel segmentation mask of each EMA stacked image for the proposed VDD-Reg and MSD. We also annotated one EMA stacked image that is not part of the MEMO dataset as the style target. Note that even though we annotated the vessel masks for all EMA images, our VDD-Reg actually required only three of those to maintain its performance.
For the image pre-processing, the OCTA images were first resized to pixel. Then, the EMA images were resized using the same scaling factors of the corresponding OCTA images. Next, to meet the requirement of our model, the resized EMA images were then cropped to ensure that their widths and heights were multiples of 8. Finally, the annotated EMA vessel segmentation masks and the registration ground truth were pre-processed accordingly to ensure their correct scale. To ensure the quality and consistency of annotation, all annotations were drawn by the same human annotator and checked by an experienced ophthalmologist (OJS).
5.1.2 The CF-FA Dataset
The CF-FA dataset contains 59 pairs of color fundus (720 576, RGB) and fluorescein angiography (720 576, grayscale) images. We manually labeled 6 pairs of corresponding points for all image pairs as the registration ground truth. We selected 29 image pairs (with odd indices) as the training set, 29 image pairs (with even indices) as the test set, and 1 image pair (normal/1-1) as the style target. Similar to the MEMO dataset, we manually annotated the vessel segmentation masks of the style target and three selected color fundus images from the training set for the proposed VDD-Reg.
5.2 Baseline Methods
Deep learning-based indicates whether the method includes any deep neural network. Indirect indicates whether the method applies a transfer method. ∗ indicates that the official implementation is not available, so we implement the method on our own. Some differences might exist, which are discussed in Section 5.2.
We compared VDD-Reg with five baseline methods listed in Table 2. For fair comparison, we made all methods except for SURF-PIIFD-RPM estimate the partial affine transformation matrix and adopt RANSAC with the same hyperparameters. For SURF-PIIFD-RPM, as we directly adopted the official code, the affine transformation matrix was applied and RANSAC was not used. Moreover, for methods that used SuperPoint [55] for keypoint detection and description, including SG, CycleGAN, Content-Adaptive and VDD-Reg, the official pretrained network was adopted without fine-tuning. More details about the baseline methods are listed as follows:
-
•
SURF-PIIFD-RPM [43]: This method utilized SURF and PIIFD for more robust feature extraction and RPM for outliers rejection. The official MATLAB code was used.
- •
-
•
SuperGlue (SG) [58]: This method used a graph neural network (GNN) for finding correspondences and rejecting non-matchable points between two sets of local features. SuperPoint was used for feature detection and description. The official pretrained networks were adopted, where the SuperPoint detection threshold was set as 0.015 and the SuperGlue match threshold was set as 0.1.
-
•
CycleGAN-based [29]: This method combined a keypoint detection and description network designed for retinal images (i.e., RetinaCraquelureNet [60]) with SuperGlue. The networks were trained using self-supervised learning on synthetic multimodal images generated by CycleGAN [52]. As the code was unavailable, we implemented a simplified alternative of this approach by using CycleGAN to transfer images from one modality to another and adopting SuperPoint for feature detection and description.
-
•
Content-Adaptive [28]: This method designed a content-adaptive vessel segmentation network based on the pixel-adaptive convolution (PAC) [51] guided by the phase images. The network was trained with style loss (Eq. 6) and the self-comparison loss (Eq. 2). The image registration loss based on the ground truth transformation matrix was also used. We implemented this method based on the code from [61]. Unlike the original paper [28], we ignored the outlier rejection network and did not fine-tuned SuperPoint because these were general techniques applicable to all the other competing methods, which were not within the scope of this paper.
5.3 Training and Testing Details
All networks in our method were implemented in PyTorch. For the vessel segmentation module, both stages took 1000 epochs for training. The trained networks in stage 1 were used to initialize the networks in stage 2. The Adam optimizer [62] with learning rate 1e-4 was used. A batch size of 1 was used due to the limitation of our GPU memory. OpenCV was used for data pre-processing and the RANSAC algorithm, where was adopted by setting the maximum reprojection error to 5 pixels and the maximum iteration to 2000.
5.4 Evaluation Metrics
5.4.1 RMSE
Based on the predicted registration matrices, the labeled points in all test OCTA images were reprojected to the corresponding test EMA images. Then, the root-mean-square-error (RMSE) [42] between the reprojected points and the labeled points was computed.
5.4.2 Success rate
The success rate was defined as the number of image pairs with successful registration over the total number of test image pairs. A registration was successful when its RMSE 10, based on the clinical tolerance.
5.4.3 Soft Dice (SD)/ Masked Soft Dice (MSD)
Dice is widely used to evaluate the registration quality by calculating the pixel alignment between the warped source vessel masks and the target vessel masks. Soft Dice (SD) [27] has been proposed as an extension of Dice for assessing registration quality. For SD, CLAHE [63] was first applied to enhance the contrast of two input images and the Frangi vesselness filter [64] was then used to generate the vesselness probability masks of the two input images. We calculated SD by
| (8) |
where and are the vesselness probability masks of the warped source images and the target images, and denotes the total number of pixels. In our experiments, FA and EMA images were viewed as the source images.
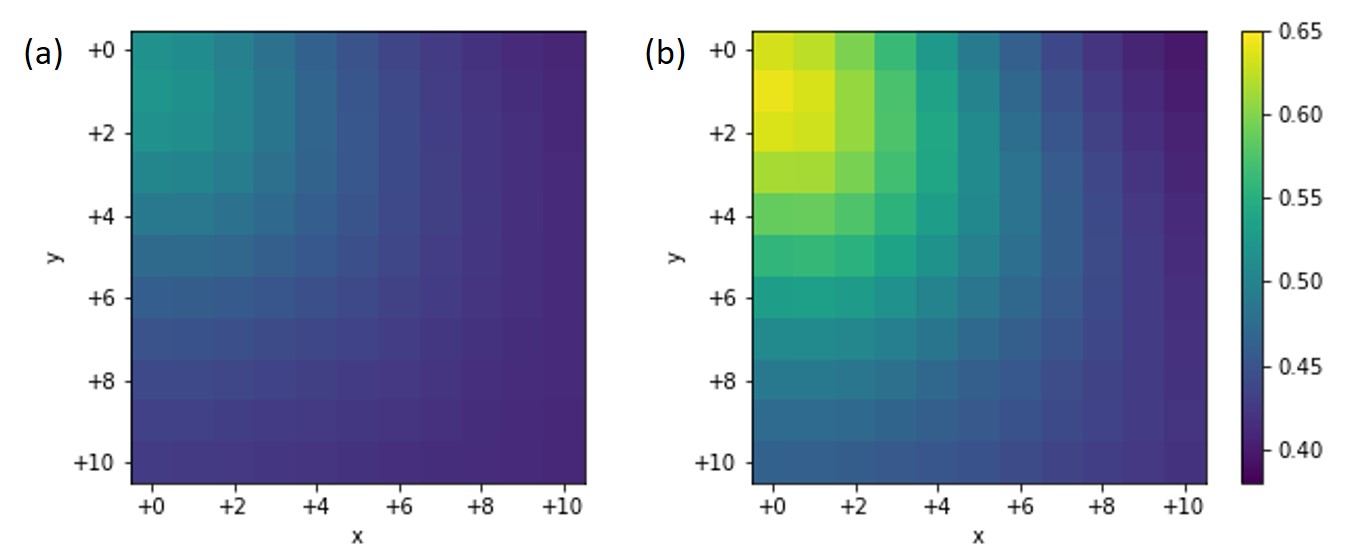
Additionally, we found that SD could not accurately represent performance when a relatively large VD difference was present between the two modalities, such as in our MEMO dataset. Moreover, it was particularly unreliable when the results of each competing method had relatively small differences. As most vessels in OCTA images do not exist in the corresponding EMA images, calculating SD based on every pixel is not ideal. Hence, when evaluating on the MEMO dataset, we extended SD to Masked Soft Dice (MSD) which considered only the pixels within the ground truth segmentation masks of EMA images. MSD is defined as
| (9) |
where and are the vesselness probability masks of the warped EMA images and the OCTA images, and represents the warped ground truth segmentation masks of EMA images. In Fig. 5, we demonstrated that MSD has better ability to assess the registration performance on our MEMO dataset, as it is less sensitive to the VD difference and noise.
6 Results
6.1 The CF-FA Dataset
| Methods | Success rate | RMSE | SD |
|---|---|---|---|
| Before Registration | 0.00% | 68.35 | - |
| SURF-PIIFD-RPM | 82.76% | 15.21 | 0.51 |
| LoFTR | 41.28% | 45.13 | 0.51 |
| SG | 82.76% | 23.68 | 0.52 |
| CycleGAN-based (FACF) | 100.00% | 4.86 | 0.52 |
| CycleGAN-based (CFFA) | 86.21% | 20.09 | 0.52 |
| Content-Adaptive∗ | 89.67% | 14.03 | 0.51 |
| VDD-Reg (Ours) | 100.00% | 3.19 | 0.51 |
∗The authors of Content-Adaptive [28] have demonstrated better performance on the CF-FA dataset by fine-tuning SuperPoint and adding an outlier rejection network.
Table 3 illustrates the quantitative results of our method and the baseline methods on the CF-FA dataset. The MSD metric was not used as the VD difference of the CF-FA dataset is relatively small. From Table 3, we can observe that our VDD-Reg achieved 100% success rate and the lowest RMSE among all the methods on the CF-FA dataset. Surprisingly, SURF-PIIFD-RPM, the only conventional multimodal registration method in Table 3, achieved decent performance (82.76%) compared to the other methods. This might indicate that a well-designed conventional method is still competitive if the target dataset is not too difficult. LoFTR and SG are two direct and deep learning-based registration methods in Table 3. LoFTR, despite performing well on a general homography estimation dataset [57, 65], achieved the worst performance (41.28%) on the CF-FA dataset according to Table 3. Fine-tuning LoFTR on the CF-FA dataset might be helpful. However, as LoFTR was originally trained on the ground-truth labels obtained from a large-scale synthetic indoor scenes datasets [66], it is unclear how to effectively fine-tune LoFTR on a multimodal retinal image registration dataset such as the CF-FA dataset. Compared to LoFTR, SG demonstrated better generalization to the CF-FA dataset (82.76%), even though it was trained on the same synthetic dataset [66] as LoFTR. This was possibly because SuperPoint (SP), the feature detection and description network used by SG, had good generalization capability. Compared to the direct methods, indirect deep learning-based methods in Table 3 generally achieved better registration performance on the CF-FA dataset. CycleGAN-based (FACF), which transformed FA images to CF images with CycleGAN first before registration, also achieved 100% success rate as our VDD-Reg. Its counterpart, CycleGAN-based (CFFA), had a slightly lower success rate (86.21%) mainly because the transformation from FA to CF worked better than the opposite direction using CycleGAN. Content-Adaptive, a segmentation-based method similar to our VDD-Reg, performed slightly worse (89.67%) than our method. Thanks to our two-stage semi-supervised learning framework, VDD-Seg could produce better vessel segmentation masks for image registration.
6.2 The MEMO Dataset
| Methods | Success rate | RMSE | SD | MSD |
|---|---|---|---|---|
| Before Registration | 6.67% | 88.48 | - | - |
| SURF-PIIFD-RPM | 6.67% | 58.48 | 0.42 | 0.41 |
| LoFTR | 13.33% | 53.55 | 0.43 | 0.49 |
| SG | 0.00% | 257.01 | 0.28 | 0.44 |
| CycleGAN-based (OE) | 33.33% | 110.79 | 0.42 | 0.51 |
| CycleGAN-based (EO) | 60.00% | 47.96 | 0.47 | 0.56 |
| Content-Adaptive | 33.33% | 78.69 | 0.41 | 0.48 |
| VDD-Reg (Ours) | 86.67% | 21.99 | 0.50 | 0.61 |
OE indicates OCTAEMA, and EO indicates EMAOCTA.
Table 4 shows the quantitative registration results of our method and the baseline methods on our MEMO dataset. Due to the relatively large VD difference, all the methods performed worse compared to the results on the CF-FA dataset. Still, our VDD-Reg outperformed all the baseline methods by a large margin (86.67%). From Table 4, we observed that SURF-PIIFD-RPM performed poorly (6.67%) on our MEMO dataset, which suggested that the hand-crafted features might be insufficiently powerful for this scenario. The two deep learning-based direct methods, LoFTR and SG, also produced unsatisfactory results (13.33% and 0%) due to the large distribution gap between their training dataset [66] and our MEMO dataset. CycleGAN-based with pretrained SuperPoint (SP) achieved relatively better performance compared to other competing methods, demonstrating its potential to solving difficult multimodal registration problems. Content-Adaptive, which is also a segmentation-based method, performed much worse (33.33%) than our method on the MEMO dataset. We attributed this to our use of annotated vessel segmentation masks from a single modality (EMA in our case). Different from our two-stage semi-supervised learning framework (LVD-Seg), Content-Adaptive trained the segmentation networks naively with style loss, the self-comparison loss and the image registration loss. To improve the segmentation quality, Content-Adaptive additionally guided the segmentation networks with mean phase images of input images using pixel-adaptive convolution (PAC) [51]. However, due to the high complexity of OCTA images, the OCTA mean phase images were usually too noisy to correctly guide the segmentation networks. On the other hand, our LVD-Seg framework used very few (e.g., three) annotated vessel segmentation masks from one modality to guide the segmentation networks to segment similar vessels in EMA and OCTA image pairs for both stages. In addition, the two-stage design also enhanced training stability when style loss was involved. These are particularly important for multimodal retinal image registration when a large VD difference exists between the two modalities.
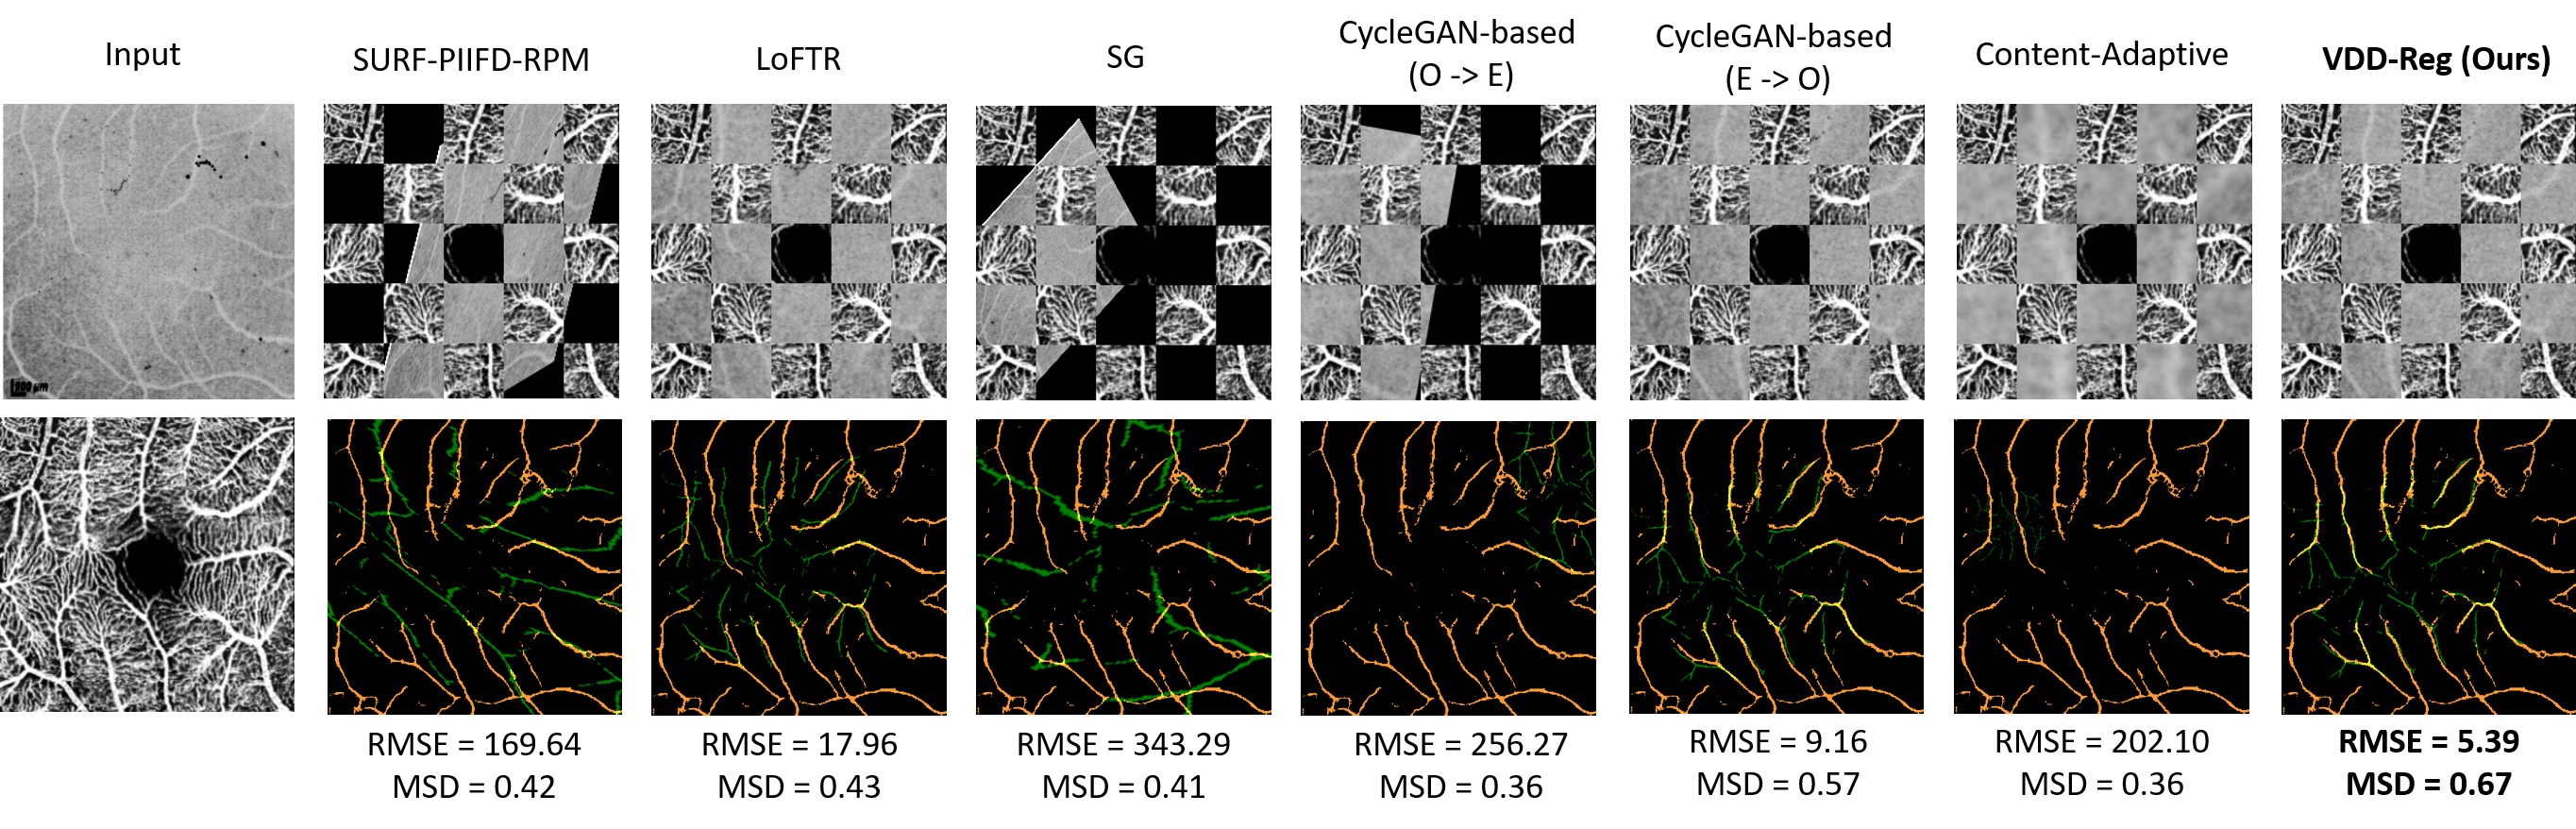
In Figure 6, we also demonstrated the qualitative registration results of our method and the baseline methods on a selected image pair from our MEMO dataset. Two different approaches were used to present the results, including grid images (top) and overlay images (bottom). The RMSE and MSD are listed below the overlay images. Our method demonstrated more accurate alignment compared to all the baseline methods.
7 Discussion
7.1 Ablation Study on the Two-stage Learning Framework
| Method | Success rate | RMSE | SD | MSD |
|---|---|---|---|---|
| Stage 1 only | 13.33% | 108.54 | 0.42 | 0.45 |
| Stage 2 only | 33.33% | 48.63 | 0.43 | 0.45 |
| Full LVD-Seg | 86.67% | 21.99 | 0.50 | 0.61 |
In this section, we investigated the benefits of each stage in the proposed two-stage semi-supervised learning framework (LVD-Seg) by removing one of the stages from the framework. The results are shown in Table 5. For Stage 1 only, we trained the EMA vessel segmentation network following the procedure described in Section 4.1.2 and used the same EMA vessel segmentation network for segmenting OCTA images. For Stage 2 only, we trained the segmentation networks with style loss only. In general, the performance of both variants decreased significantly. Stage 1 only performed the worst probably due to the limited number (three in our case) of annotated vessel segmentation masks used for supervised training, making the segmentation network generalize poorly on the test images and resulting in poor registration performance. Furthermore, Stage 1 only directly applied the trained EMA segmentation network on OCTA images, which may not work due the relatively large VD difference between the two modalities. Although Stage 2 only worked better than Stage 1 only, it still significantly lagged behind our LVD-Seg. This implied that relying purely on style loss could let the training become unstable and resulted in unreliable registration. All these results emphasized the effectiveness of the proposed two-stage semi-supervised learning framework (LVD-Seg).
7.2 Ablation Study on Number of Required Vessel Masks
| # of annotated masks | Success rate | RMSE | SD | MSD |
|---|---|---|---|---|
| 3 (default) | 86.67% | 21.99 | 0.50 | 0.61 |
| 5 | 86.67% | 11.42 | 0.51 | 0.63 |
| 10 | 86.67% | 8.91 | 0.52 | 0.65 |
| 15 | 93.33% | 11.88 | 0.52 | 0.64 |
The major advantage of our method lies in the requirement for few manually annotated vessel segmentation masks during stage 1 of the LVD-Seg framework. In this section, we further investigated the performance of our method on the MEMO dataset by using different numbers of labeled EMA vessel segmentation masks for supervised training. Specifically, during stage 1 of LVD-Seg, we trained our vessel segmentation module using randomly sampled 3, 5, 10 and 15 annotated EMA vessel segmentation masks. In stage 2, we used all 15 training pairs as our default setting. The results are shown in Table 6. We found that using more annotated EMA vessel segmentation masks during the supervised training (i.e., stage 1 of LVD-Seg) did not affect the performance significantly. For instance, there was only a 6.66% difference between the highest and the lowest success rates. In other words, the proposed method required very few (e.g., three) annotated vessel segmentation masks to maintain its accuracy, demonstrating its feasibility.
7.3 Ablation Study on Data Used for Supervised Training
As mentioned in the previous section, the primary cost of our method lies in the requirement for few manually annotated vessel segmentation masks. In this section, we further investigated whether existing retinal image segmentation datasets could potentially be used to train our segmentation module during stage 1 of LVD-Seg. We selected two datasets, HRF [67] and DRIVE [68], to conduct the experiments. Specifically, HRF and DRIVE are two retinal color fundus (CF) image datasets providing ground truth vessel segmentation masks. We randomly chose three images from each dataset to train our segmentation network during stage 1 of LVD-Seg. Other than that, the default settings were adopted. The results are shown in Table 7. Compared to the performance of using our MEMO dataset, the performance of using the HRF and DRIVE datasets in stage 1 both decreased. Additionally, using the HRF dataset achieved superior performance than using the DRIVE dataset. One possible reason for this was that the HRF dataset had a more similar VD with our MEMO dataset. The average VD of MEMO (EMA), HRF and DRIVE are 4.71%, 10.05% and 11.21%, respectively. This implies that selecting the ground truth vessel segmentation masks whose VD is closer to the target images (EMA images in our case) might be very important for achieving better results when using the proposed framework.
7.4 Potential of the Proposed Method
The proposed VDD-Reg requires very little labeling. It could potentially be applied to other vessel imaging modalities, especially for modalities with large differences on vessel structures. This has wider applications for any comparison of SLO images with OCTA. For instance, the registration of FAF to OCTA images may benefit from this approach [69]. Furthermore, multimodal adaptive optics devices which use both AO-SLO and AO-OCT methods could also benefit from this approach [70, 71].
8 Conclusion
In this paper, we present MEMO, the first public multimodal EMA and OCTA retinal image dataset. MEMO provides registration ground truth, EMA image sequences and OCTA projection images, desirable for various research fields. With MEMO, we first uncover a unique challenge of multimodal retinal image registration between modalities with large VD differences. After that, we propose a segmentation-based deep-learning registration framework, VDD-Reg, and a new evaluation metric, Masked Soft Dice (MSD), to deal with the large vessel density difference between EMA and OCTA in multimodal retinal image registration. Moreover, to train the segmentation module in our VDD-Reg, we design a novel two-stage semi-supervised learning framework, LVD-Seg, which combines supervised and unsupervised losses. Both quantitative and qualitative results demonstrate that VDD-Reg outperforms the baseline methods in both small VD differences (i.e., CF-FA) and large VD differences (i.e., MEMO). Additionally, VDD-Reg requires as few as three annotated vessel segmentation masks to maintain its performance, which demonstrates its promising potential for registering other modalities.
Acknowledgment
The authors would like to acknowledge the funding support from the University of Maryland Strategic Partnership: MPowering the State, a formal collaboration between the University of Maryland College Park and the University of Maryland Baltimore.
References
- [1] M. T. Nicolela, B. E. Walman, A. R. Buckley, and S. M. Drance, “Ocular hypertension and primary open-angle glaucoma: a comparative study of their retrobulbar blood flow velocity.,” Journal of glaucoma, vol. 5, no. 5, pp. 308–310, 1996.
- [2] V. Patel, S. Rassam, R. Newsom, J. Wiek, and E. Kohner, “Retinal blood flow in diabetic retinopathy.,” British Medical Journal, vol. 305, no. 6855, pp. 678–683, 1992.
- [3] T. A. Ciulla et al., “Color doppler imaging discloses reduced ocular blood flow velocities in nonexudative age-related macular degeneration,” American journal of ophthalmology, vol. 128, no. 1, pp. 75–80, 1999.
- [4] G. T. Feke, B. T. Hyman, R. A. Stern, and L. R. Pasquale, “Retinal blood flow in mild cognitive impairment and alzheimer’s disease,” Alzheimer’s & Dementia: Diagnosis, Assessment & Disease Monitoring, vol. 1, no. 2, pp. 144–151, 2015.
- [5] F. Berisha, G. T. Feke, C. L. Trempe, J. W. McMeel, and C. L. Schepens, “Retinal abnormalities in early alzheimer’s disease,” Investigative ophthalmology & visual science, vol. 48, no. 5, pp. 2285–2289, 2007.
- [6] C. E. Riva, M. Geiser, B. L. Petrig, and O. B. F. R. Association, “Ocular blood flow assessment using continuous laser doppler flowmetry,” Acta ophthalmologica, vol. 88, no. 6, pp. 622–629, 2010.
- [7] B. Lee et al., “En face doppler optical coherence tomography measurement of total retinal blood flow in diabetic retinopathy and diabetic macular edema,” JAMA ophthalmology, vol. 135, no. 3, pp. 244–251, 2017.
- [8] Y. Jia et al., “Split-spectrum amplitude-decorrelation angiography with optical coherence tomography,” Optics express, vol. 20, no. 4, pp. 4710–4725, 2012.
- [9] W. Goebel, W. E. Lieb, A. Ho, R. C. Sergott, R. Farhoumand, and F. Grehn, “Color doppler imaging: a new technique to assess orbital blood flow in patients with diabetic retinopathy.,” Investigative ophthalmology & visual science, vol. 36, no. 5, pp. 864–870, 1995.
- [10] A. Roorda, “Applications of adaptive optics scanning laser ophthalmoscopy,” Optometry and vision science: official publication of the American Academy of Optometry, vol. 87, no. 4, p. 260, 2010.
- [11] S. Arichika, A. Uji, M. Hangai, S. Ooto, and N. Yoshimura, “Noninvasive and direct monitoring of erythrocyte aggregates in human retinal microvasculature using adaptive optics scanning laser ophthalmoscopy,” Investigative ophthalmology & visual science, vol. 54, no. 6, pp. 4394–4402, 2013.
- [12] M. Pircher and R. J. Zawadzki, “Review of adaptive optics oct (ao-oct): principles and applications for retinal imaging,” Biomedical optics express, vol. 8, no. 5, pp. 2536–2562, 2017.
- [13] J. Carroll, D. B. Kay, D. Scoles, A. Dubra, and M. Lombardo, “Adaptive optics retinal imaging–clinical opportunities and challenges,” Current Eye Research, vol. 38, no. 7, pp. 709–721, 2013.
- [14] R. Flower, E. Peiretti, M. Magnani, L. Rossi, S. Serafini, Z. Gryczynski, and I. Gryczynski, “Observation of erythrocyte dynamics in the retinal capillaries and choriocapillaris using icg-loaded erythrocyte ghost cells,” Investigative ophthalmology & visual science, vol. 49, no. 12, pp. 5510–5516, 2008.
- [15] O. Saeedi et al., “Determination of absolute erythrocyte velocity and flow in the human retinal microvasculature by direct visualization of icg-labelled erythrocytes,” Investigative Ophthalmology & Visual Science, vol. 59, no. 9, pp. 3950–3950, 2018.
- [16] B. M. Tracey et al., “Measurement of retinal microvascular blood velocity using erythrocyte mediated velocimetry,” Scientific reports, vol. 9, no. 1, p. 20178, 2019.
- [17] S. Asanad, A. Park, J. Pottenburgh, A. Siddiqui, L. Mayo, and O. J. Saeedi, “Erythrocyte-mediated angiography: quantifying absolute episcleral blood flow in humans,” Ophthalmology, vol. 128, no. 5, pp. 799–801, 2021.
- [18] D. Wang, A. Haytham, L. Mayo, Y. Tao, and O. Saeedi, “Automated retinal microvascular velocimetry based on erythrocyte mediated angiography,” Biomedical optics express, vol. 10, no. 7, pp. 3681–3697, 2019.
- [19] A. H. Kashani et al., “Optical coherence tomography angiography: a comprehensive review of current methods and clinical applications,” Progress in retinal and eye research, vol. 60, pp. 66–100, 2017.
- [20] S. S. Gao et al., “Optical coherence tomography angiography,” Investigative ophthalmology & visual science, vol. 57, no. 9, pp. OCT27–OCT36, 2016.
- [21] Y. Watanabe, Y. Takahashi, and H. Numazawa, “Graphics processing unit accelerated intensity-based optical coherence tomography angiography using differential frames with real-time motion correction,” Journal of biomedical optics, vol. 19, no. 2, pp. 021105–021105, 2014.
- [22] M. Santarossa et al., “Medregnet: unsupervised multimodal retinal-image registration with gans and ranking loss,” in Medical Imaging 2022: Image Processing, vol. 12032, pp. 321–333, SPIE, 2022.
- [23] T. De Silva, E. Y. Chew, N. Hotaling, and C. A. Cukras, “Deep-learning based multi-modal retinal image registration for the longitudinal analysis of patients with age-related macular degeneration,” Biomedical Optics Express, vol. 12, no. 1, pp. 619–636, 2021.
- [24] G. Luo et al., “Multimodal affine registration for icga and mcsl fundus images of high myopia,” Biomedical Optics Express, vol. 11, no. 8, pp. 4443–4457, 2020.
- [25] M. Arikan, A. Sadeghipour, B. Gerendas, R. Told, and U. Schmidt-Erfurt, “Deep learning based multi-modal registration for retinal imaging,” in Interpretability of Machine Intelligence in Medical Image Computing and Multimodal Learning for Clinical Decision Support: Second International Workshop, iMIMIC 2019, and 9th International Workshop, ML-CDS 2019, Held in Conjunction with MICCAI 2019, Shenzhen, China, October 17, 2019, Proceedings 9, pp. 75–82, Springer, 2019.
- [26] J. A. Lee, P. Liu, J. Cheng, and H. Fu, “A deep step pattern representation for multimodal retinal image registration,” in Proceedings of the IEEE/CVF International Conference on Computer Vision, pp. 5077–5086, 2019.
- [27] J. Zhang et al., “Two-step registration on multi-modal retinal images via deep neural networks,” IEEE Transactions on Image Processing, vol. 31, pp. 823–838, 2021.
- [28] Y. Wang, J. Zhang, M. Cavichini, D.-U. G. Bartsch, W. R. Freeman, T. Q. Nguyen, and C. An, “Robust content-adaptive global registration for multimodal retinal images using weakly supervised deep-learning framework,” IEEE Transactions on Image Processing, vol. 30, pp. 3167–3178, 2021.
- [29] A. Sindel, B. Hohberger, A. Maier, and V. Christlein, “Multi-modal retinal image registration using a keypoint-based vessel structure aligning network,” in International Conference on Medical Image Computing and Computer-Assisted Intervention, pp. 108–118, Springer, 2022.
- [30] S. Hajeb Mohammad Alipour, H. Rabbani, and M. R. Akhlaghi, “Diabetic retinopathy grading by digital curvelet transform,” Computational and mathematical methods in medicine, vol. 2012, 2012.
- [31] S.-E. Chen, V. Chen, J. Pottenburgh, and O. Saeedi, “In vivo measurement of plexus-specific retinal erythrocyte velocity and acceleration in human subjects and nhps,” Investigative Ophthalmology & Visual Science, vol. 63, no. 7, pp. 3502–3502, 2022.
- [32] R. Rocholz, F. Corvi, J. Weichsel, S. Schmidt, and G. Staurenghi, “Oct angiography (octa) in retinal diagnostics,” High resolution imaging in microscopy and ophthalmology: new frontiers in biomedical optics, pp. 135–160, 2019.
- [33] J. Johnson, A. Alahi, and L. Fei-Fei, “Perceptual losses for real-time style transfer and super-resolution,” in Computer Vision–ECCV 2016: 14th European Conference, Amsterdam, The Netherlands, October 11-14, 2016, Proceedings, Part II 14, pp. 694–711, Springer, 2016.
- [34] E. Decenciere et al., “Teleophta: Machine learning and image processing methods for teleophthalmology,” Irbm, vol. 34, no. 2, pp. 196–203, 2013.
- [35] K. M. Adal, P. G. van Etten, J. P. Martinez, L. J. van Vliet, and K. A. Vermeer, “Accuracy assessment of intra-and intervisit fundus image registration for diabetic retinopathy screening,” Investigative ophthalmology & visual science, vol. 56, no. 3, pp. 1805–1812, 2015.
- [36] M. Ortega, M. G. Penedo, J. Rouco, N. Barreira, and M. J. Carreira, “Retinal verification using a feature points-based biometric pattern,” EURASIP Journal on Advances in Signal Processing, vol. 2009, pp. 1–13, 2009.
- [37] C. Hernandez-Matas, X. Zabulis, A. Triantafyllou, P. Anyfanti, S. Douma, and A. A. Argyros, “Fire: fundus image registration dataset,” Modeling and Artificial Intelligence in Ophthalmology, vol. 1, no. 4, pp. 16–28, 2017.
- [38] L. Ding et al., “Flori21: Fluorescein angiography longitudinal retinal image registration dataset,” IEEE Dataport, 2021.
- [39] L. Ding, A. E. Kuriyan, R. S. Ramchandran, C. C. Wykoff, and G. Sharma, “Weakly-supervised vessel detection in ultra-widefield fundus photography via iterative multi-modal registration and learning,” IEEE Transactions on Medical Imaging, vol. 40, no. 10, pp. 2748–2758, 2020.
- [40] M. Li et al., “Image projection network: 3d to 2d image segmentation in octa images,” IEEE Transactions on Medical Imaging, vol. 39, no. 11, pp. 3343–3354, 2020.
- [41] J. Chen, J. Tian, N. Lee, J. Zheng, R. T. Smith, and A. F. Laine, “A partial intensity invariant feature descriptor for multimodal retinal image registration,” IEEE Transactions on Biomedical Engineering, vol. 57, no. 7, pp. 1707–1718, 2010.
- [42] Z. Ghassabi, J. Shanbehzadeh, A. Sedaghat, and E. Fatemizadeh, “An efficient approach for robust multimodal retinal image registration based on ur-sift features and piifd descriptors,” EURASIP Journal on Image and Video Processing, vol. 2013, pp. 1–16, 2013.
- [43] G. Wang, Z. Wang, Y. Chen, and W. Zhao, “Robust point matching method for multimodal retinal image registration,” Biomedical Signal Processing and Control, vol. 19, pp. 68–76, 2015.
- [44] J. Addison Lee et al., “A low-dimensional step pattern analysis algorithm with application to multimodal retinal image registration,” in Proceedings of the IEEE Conference on Computer Vision and Pattern Recognition, pp. 1046–1053, 2015.
- [45] Z. Hossein-Nejad and M. Nasri, “A-ransac: Adaptive random sample consensus method in multimodal retinal image registration,” Biomedical Signal Processing and Control, vol. 45, pp. 325–338, 2018.
- [46] M. Hernandez, G. Medioni, Z. Hu, and S. Sadda, “Multimodal registration of multiple retinal images based on line structures,” in 2015 IEEE Winter Conference on Applications of Computer Vision, pp. 907–914, IEEE, 2015.
- [47] Á. S. Hervella, J. Rouco, J. Novo, and M. Ortega, “Multimodal registration of retinal images using domain-specific landmarks and vessel enhancement,” Procedia Computer Science, vol. 126, pp. 97–104, 2018.
- [48] D. Motta, W. Casaca, and A. Paiva, “Vessel optimal transport for automated alignment of retinal fundus images,” IEEE Transactions on Image Processing, vol. 28, no. 12, pp. 6154–6168, 2019.
- [49] Z. Li et al., “Multi-modal and multi-vendor retina image registration,” Biomedical optics express, vol. 9, no. 2, pp. 410–422, 2018.
- [50] K. Simonyan and A. Zisserman, “Very deep convolutional networks for large-scale image recognition,” arXiv preprint arXiv:1409.1556, 2014.
- [51] H. Su, V. Jampani, D. Sun, O. Gallo, E. Learned-Miller, and J. Kautz, “Pixel-adaptive convolutional neural networks,” in Proceedings of the IEEE/CVF Conference on Computer Vision and Pattern Recognition, pp. 11166–11175, 2019.
- [52] J.-Y. Zhu, T. Park, P. Isola, and A. A. Efros, “Unpaired image-to-image translation using cycle-consistent adversarial networks,” in Proceedings of the IEEE international conference on computer vision, pp. 2223–2232, 2017.
- [53] J. Pottenburgh et al., “Use of fitc and cfse labeled erythrocytes for in vivo retinal imaging in non-human primates,” Investigative Ophthalmology & Visual Science, vol. 61, no. 7, pp. 897–897, 2020.
- [54] K.-K. Maninis, J. Pont-Tuset, P. Arbeláez, and L. Van Gool, “Deep retinal image understanding,” in Medical Image Computing and Computer-Assisted Intervention–MICCAI 2016: 19th International Conference, Athens, Greece, October 17-21, 2016, Proceedings, Part II 19, pp. 140–148, Springer, 2016.
- [55] D. DeTone, T. Malisiewicz, and A. Rabinovich, “Superpoint: Self-supervised interest point detection and description,” in Proceedings of the IEEE conference on computer vision and pattern recognition workshops, pp. 224–236, 2018.
- [56] M. A. Fischler and R. C. Bolles, “Random sample consensus: a paradigm for model fitting with applications to image analysis and automated cartography,” Communications of the ACM, vol. 24, no. 6, pp. 381–395, 1981.
- [57] J. Sun, Z. Shen, Y. Wang, H. Bao, and X. Zhou, “Loftr: Detector-free local feature matching with transformers,” in Proceedings of the IEEE/CVF conference on computer vision and pattern recognition, pp. 8922–8931, 2021.
- [58] P.-E. Sarlin, D. DeTone, T. Malisiewicz, and A. Rabinovich, “Superglue: Learning feature matching with graph neural networks,” in Proceedings of the IEEE/CVF conference on computer vision and pattern recognition, pp. 4938–4947, 2020.
- [59] A. Vaswani, N. Shazeer, N. Parmar, J. Uszkoreit, L. Jones, A. N. Gomez, Ł. Kaiser, and I. Polosukhin, “Attention is all you need,” Advances in neural information processing systems, vol. 30, 2017.
- [60] A. Sindel, B. Hohberger, S. F. Dehcordi, C. Mardin, R. Lämmer, A. Maier, and V. Christlein, “A keypoint detection and description network based on the vessel structure for multi-modal retinal image registration,” in Bildverarbeitung für die Medizin 2022: Proceedings, German Workshop on Medical Image Computing, Heidelberg, June 26-28, 2022, pp. 57–62, Springer, 2022.
- [61] J. Zhang et al., “Joint vessel segmentation and deformable registration on multi-modal retinal images based on style transfer,” in 2019 IEEE International Conference on Image Processing (ICIP), pp. 839–843, IEEE, 2019.
- [62] D. P. Kingma and J. Ba, “Adam: A method for stochastic optimization,” arXiv preprint arXiv:1412.6980, 2014.
- [63] K. J. Zuiderveld, “Contrast limited adaptive histogram equalization,” in Graphics gems, 1994.
- [64] A. F. Frangi, W. J. Niessen, K. L. Vincken, and M. A. Viergever, “Multiscale vessel enhancement filtering,” in Medical Image Computing and Computer-Assisted Intervention—MICCAI’98: First International Conference Cambridge, MA, USA, October 11–13, 1998 Proceedings 1, pp. 130–137, Springer, 1998.
- [65] V. Balntas, K. Lenc, A. Vedaldi, and K. Mikolajczyk, “Hpatches: A benchmark and evaluation of handcrafted and learned local descriptors,” in Proceedings of the IEEE conference on computer vision and pattern recognition, pp. 5173–5182, 2017.
- [66] A. Dai, A. X. Chang, M. Savva, M. Halber, T. Funkhouser, and M. Nießner, “Scannet: Richly-annotated 3d reconstructions of indoor scenes,” in Proceedings of the IEEE conference on computer vision and pattern recognition, pp. 5828–5839, 2017.
- [67] A. Budai, R. Bock, A. Maier, J. Hornegger, G. Michelson, et al., “Robust vessel segmentation in fundus images,” International journal of biomedical imaging, vol. 2013, 2013.
- [68] J. Staal, M. D. Abràmoff, M. Niemeijer, M. A. Viergever, and B. Van Ginneken, “Ridge-based vessel segmentation in color images of the retina,” IEEE transactions on medical imaging, vol. 23, no. 4, pp. 501–509, 2004.
- [69] H. Narasimha-Iyer, B. Lujan, J. Oakley, S. Meyer, and S. Dastmalchi, “Registration of cirrus hd-oct images with fundus photographs, fluorescein angiographs and fundus autofluorescence images,” Investigative Ophthalmology & Visual Science, vol. 49, no. 13, pp. 1831–1831, 2008.
- [70] Z. Liu, J. Tam, O. Saeedi, and D. X. Hammer, “Trans-retinal cellular imaging with multimodal adaptive optics,” Biomedical optics express, vol. 9, no. 9, pp. 4246–4262, 2018.
- [71] C. T. Le et al., “Novel application of long short-term memory network for 3d to 2d retinal vessel segmentation in adaptive optics—optical coherence tomography volumes,” Applied Sciences, vol. 11, no. 20, p. 9475, 2021.