Unraveling xenon primary scintillation yield for cutting-edge rare event experiments
Abstract
Xenon scintillation has been widely used in rare event detection experiments, such as in neutrinoless double beta decay, double electron captures and dark matter searches. Nonetheless, experimental values for primary scintillation yield in gaseous xenon (GXe) remain scarce and dispersed. The mean energy required to produce a scintillation photon, , in GXe in the absence of recombination has been measured to be in the range of 34–111 eV. Lower -values were reported for -particles when compared to electrons produced by - or x-rays. Since is expected to be similar for x-, -rays or electrons and almost equal to that obtained for -particles, the above difference can not be understood. In addition, at present one may also pose the question of a dependence of on photon energy. We carried out a systematic study on the absolute primary scintillation yield in GXe under reduced electric fields in the 70–300 V cm-1 bar-1 range and near atmospheric pressure, 1.2 bar, supported by a robust geometrical efficiency simulation model.
We were able to clear-out the above standing problems: was determined for x/-rays in the 5.9–60 keV energy range as well as for -particles in the 1.5–2.5 MeV range, and no significant dependency neither on radiation type nor on energy has been observed. Our experimental -values agree well with both state-of-art simulations and literature data obtained for -particles. The discrepancy between our results and the experimental values found in the literature for x/-rays is discussed in this work and attributed to unaddressed large systematic errors in those previous studies. These findings can be extrapolated to other gases, and have impact on experiments such as double beta decay, double electron capture and directional dark matter searches while also on potential future detection systems such as DUNE-Gas.
Neglecting the 3rd continuum emission, as is the case of most of the literature values, a mean -value of 38.7 0.6 (sta.) (sys.) eV was obtained. If the Xe 3rd continuum emission is to be considered, the average energy to produce a 2nd and a 3rd continuum photon was calculated as 43.5 0.7 (sta.) (sys.) eV and 483 7 (sta.) (sys.) eV, respectively, while the energy to produce either a 3rd or a 2nd continuum photon is 39.9 0.6 (sta.) (sys.) eV.
1 Introduction
Gaseous xenon (GXe) is playing an increasingly significant role in important areas of neutrino physics such as double beta decay and double electron capture experiments NEXT:2019gtz ; Obara:2019tnh ; Gomez-Cadenas:2019ges ; Galan:2019ake ; Gavriljuk:2018pez ; NEXT:2020sux , and it may be used as detection medium in directional dark matter experiments as well as in MeV-region -ray imaging nygren2013columnar ; mimura2009xenon ; 10.1117/1.OE.53.2.021108 . The capability for simultaneous readout of both ionization and scintillation signals and for topology reconstruction of the ionizing particle tracks are important advantages of GXe. In addition, GXe allows for improved energy resolution when compared to liquid xenon (LXe) BOLOTNIKOV1997360 due to the observed fluctuations in energy deposition between the ionization and the scintillation channels in LXe EXO-200:2003bso , an effect that can be corrected to some extent by combining both channels EXO-200:2012pdt . Better energy resolution may lead to improved electron/nuclear recoil discrimination, being also a major asset for the neutrinoless double beta decay sensitivity, and the topology of the ionization track will be an additional tool, providing information about the direction of the WIMP scatter or discrimination between single and double electron ionization tracks.
The precise knowledge of the xenon response to radiation interactions in both scintillation and ionization channels is of utmost importance for the exact understanding and modelling of the detector. The primary scintillation yield of GXe is far less understood than the ionization yield due to the limited number of studies existing in the literature. Mimura et al. 10.1143/JJAP.48.076501 discusses the results obtained until then, while Serra et al. 10.1088/1748-0221/10/03/P03025 provides an update with further results published meanwhile.
The dominant scintillation mechanism in xenon at the atmospheric pressure is the so-called 2nd continuum, a Gaussian-like emission spectrum, 10 nm in width. Its centroid has been reported in the 172–178 range 10.1016/0167-5087(83)90028-5 ; 10.1016/0029-554X(79)90453-1 ; 10.1063/1.436349 ; 10.1063/1.440803 ; 10.1016/j.nima.2015.05.065 ; 10.1103/RevModPhys.82.2053 . In this work we consider the most recent value, 175 nm 10.1016/j.nima.2015.05.065 . Nonetheless, other non-conventional scintillation mechanisms have been observed, such as the broadband Neutral Bremsstrahlung (NBrS) NBrS_prx emission and the 3rd continuum emission in the 250–400 nm range 10.1063/1.436349 . All the -values present in the literature, except for the most recent study carried out for -particles 10.1140/epjc/s10052-022-10385-y , consider the 3rd continuum and neutral bremsstrahlung emissions to be negligible.
At reduced electric fields, i.e. the electric field normalized by the gas pressure, , above 60 V cm-1 bar-1, the recombination of primary electrons/ions produced during the radiation interaction is negligible 10.1088/1748-0221/10/03/P03025 ; 10.1088/1748-0221/8/05/P05025 ; 10.1143/JJAP.48.076501 ; 10.1109/tns.2004.836030 . In those conditions, the average energy required to excite a xenon atom, , is similar to the average energy expended per scintillation photon , where is the number of scintillation photons and the deposited energy 10.1088/1748-0221/10/03/P03025 ; 10.1088/1748-0221/8/05/P05025 . does not depend on gas density, below 0.2 g/cm3, 20 bar at room temperature 10.1143/JJAP.48.076501 .
Several measurements of the for x- and -ray interactions have become available, although with highly dispersed values from 61 to 111 eV 10.1088/1748-0221/5/09/P09006 ; 10.1088/1748-0221/3/07/P07004 ; 10.1016/j.nima.2023.168038 ; 10.1109/23.106674 ; 10.1016/j.nima.2015.04.057 . The -values obtained for 5.5-MeV -particle interactions are less dispersed, in the 34–60 eV range, and % lower on average than its x/-ray counterpart despite being obtained for similar working conditions 10.1088/1748-0221/10/03/P03025 ; 10.1143/JJAP.48.076501 ; 10.1109/TNS.2003.820615 ; 10.1109/tns.2004.836030 ; 10.1140/epjc/s10052-022-10385-y . An overview of the -values present in the literature can be found in Table 1.
The average energy expended per excited atom in GXe is expected to be similar for x-, -rays or electrons and almost equal to that obtained for -particles 10.1143/JJAP.48.076501 . However, results presented in the literature are inconsistent with that expectation. The difference between the above results is presently not fully understood, as can be only partially ascribed to the different gas density and/or drift field conditions. In addition, at present one may also pose the question of a dependence of on photon energy.
These inconsistencies motivated us to pursue further experimental studies in a dedicated setup where the primary scintillation could be isolated and studied in detail. In this work, we report new results on the xenon -value in absence of recombination, for -particles in the 1.5- to 2.5-MeV range and for x/-rays in the 6–60-keV range. These findings can be extrapolated to other noble gases, like Ar and Kr, and might have also impact on potential future detectors such as DUNE-Gas 10.48550/arXiv.2203.06281 .
| (eV) | radiation | energy (keV) | observations |
|---|---|---|---|
| 74 10 | x-rays | 5.9 | 1 bar, 10.1088/1748-0221/5/09/P09006 |
| 111 16 | x-rays | 5.9 | 1 bar, 10.1088/1748-0221/3/07/P07004 |
| 80 12 | x-rays | 5.9 | 1 bar, 10.1016/j.nima.2023.168038 |
| 76 12 | -rays | 59.5 | 15 bar, 10.1109/23.106674 |
| 61 18 | -rays | 662 | 14 bar, 10.1016/j.nima.2015.04.057 |
| 39.2 3.2 | -particles | 5486 | 10 bar 10.1088/1748-0221/10/03/P03025 |
| 34.1 2.4 | -particles | 5486 | 5 bar 10.1143/JJAP.48.076501 |
| 34.5 1.7 | -particles | 5486 | 1-10 bar 10.1109/TNS.2003.820615 |
| 59.4 1.5 | -particles | 5486 | 1-2 bar 10.1109/tns.2004.836030 |
| 50.5 5.9 | -particles | 5486 | 1 bar, VUV 10.1140/epjc/s10052-022-10385-y |
2 Experimental setup
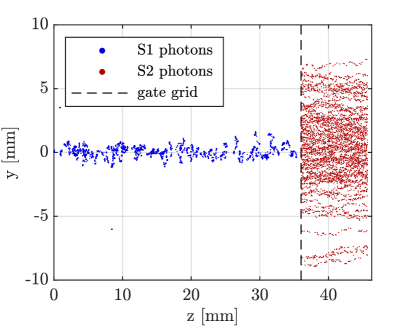
For detailed studies of the primary scintillation, we built a gas proportional scintillation chamber (GPSC) with photomultiplier tube (PMT) readout, Fig. 1. This apparatus allows us to study both primary and secondary scintillation signals, S1 and S2, respectively. The primary scintillation occurs mostly in the absorption region, where a weak electric field prevents electron-ion recombination and guides the ionization electrons toward a stronger electric field region, where the secondary scintillation produced by electron impact, also known as electroluminescence (EL), takes place.
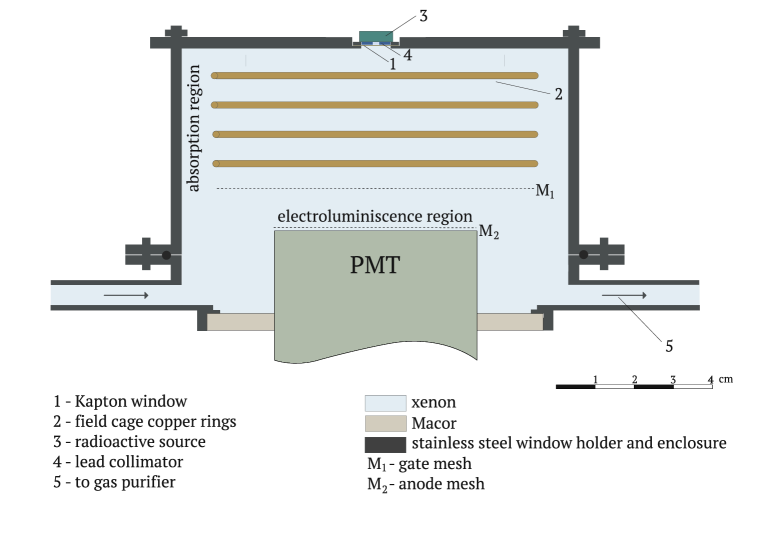
The absorption region is delimited by a Kapton window, 12-m thick, aluminized on the inner side, and the gate wire mesh, 0.9-mm pitch stainless-steel wires with 80 m in diameter. The anode is made from a similar wire mesh, placed above the photosensor. The chamber, filled with 1.2 bar of xenon, consists of a stainless-steel cylinder, 10 cm in diameter, the bottom part of the body being a Macor disc epoxied to the PMT and to the detector wall for electrical insulation. The GPSC is operated at room temperature, with the xenon gas circulating by convection through St707 SAES getters saes , heated to temperatures up to 250 ∘C. A field cage of four equally-spaced copper rings interconnected through resistors was assembled in the absorption region to ensure electric field uniformity. A polytetrafluoroethylene (PTFE) structure supports the copper rings. Electric field maps of the GPSC were obtained using a finite element method solver elmer . The electric field was found to vary by 8% along the 3.6-cm thick absorption region and by 0.7% along the 1-cm electroluminescence region. These values are conservative, as they represent the maximum field variation in a 7-mm radius cylindrical volume, where 95% of the transversely diffused electrons are contained within.
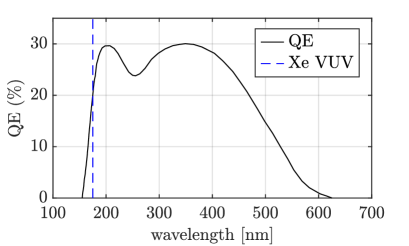
The PMT is an eight dynode model EMI D676QB with a diameter of 52 mm, an effective cathode diameter of 45 mm, and a spectral sensitivity in the range of 155–625 nm. The PMT quantum efficiency (QE) curve as provided by the manufacturer is depicted in Fig. 2. Accordingly, a QE of , is expected for the Xe 2nd continuum, the error stemming from the differences between emission spectra in the literature.
The PMT signals are directly recorded with a WaveRunner 610Zi oscilloscope from LeCroy, featuring a sampling rate of 10 GS/s. The PMT output is connected to a load resistor of 200-Ω to convert the signal current into voltage. A 50-Ω resistor would be preferable to match the cable impedance and to reduce wave reflections. However, due to the low gain of our PMT, , a higher resistor value was required to increase the signal-to-noise ratio up to acceptable levels. Nonetheless, wave reflections in the cable terminations are properly handled, as will be explained in the following sections.
Four radioactive sources, 109Cd, 244Cm, 241Am, and 55Fe having the 6.4 keV x-rays removed by means of a chromium filter, collimated up to 2 mm and positioned 1 mm above the detector window, were used in the present study to produce x/-rays in the range of 5.9–60 keV and 5.5-MeV alpha particles (being 2 MeV deposited in the Xe gas). In addition, a Tb target was irradiated with 59.5 -rays to provide fluorescence x-rays in the 14-50 keV range. Overall, the counting rate was kept around 10 Hz to avoid pulse pileup, maintaining the cleanliness of the waveform baseline.
3 Monte Carlo simulations
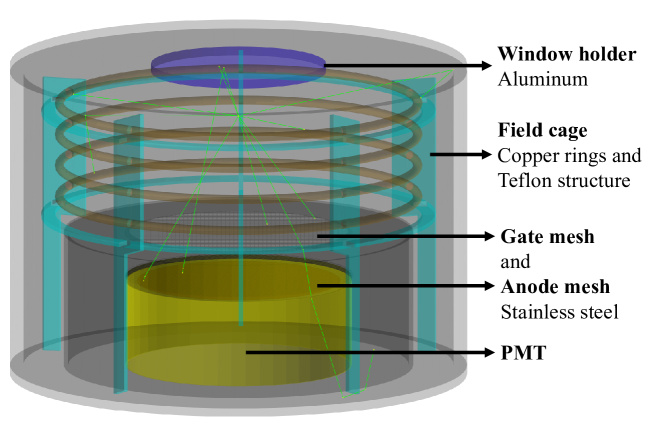
Despite the large solid angle subtended by the PMT with respect to the secondary scintillation region, most of the primary scintillation photons are produced near the detector window, far away from the photosensor (see Fig. 1). Consequently, photon reflections on the detector materials play an important role in the optical geometrical efficiency. Since this parameter is crucial to estimate the number of emitted primary and secondary scintillation photons, we developed a detailed optical simulation of the detector geometrical efficiency (GE) using the GEANT4 toolkit 10.1016/j.nima.2016.06.125 .
Detector components were designed and meshed with the software FreeCAD. Components made from the same materials were grouped and their CAD geometries were directly imported into GEANT4 using the open-source CADMesh header 10.1007/s13246-012-0159-8 . Optical processes such as photon reflection and refraction are handled by the G4OpticalPhysics class. The GEANT4 simulation was developed to account for the full wavelength range from 150 nm to 650 nm, allowing to study other light emission mechanisms beyond the Xe 2nd second continuum, such as the 3rd continuum and the neutral bremsstrahlung 10.1140/epjc/s10052-022-10385-y ; NBrS_prx . The refractive indexes of the fused silica PMT window and Xe gas were implemented as a function of photon wavelength, allowing for full simulation of Fresnel reflections and refractions 10.1364/JOSA.55.001205 ; 10.1109/tdei.2006.1657967 . The glisur model was used for boundary processes, and the respective optical surface properties, e.g. reflectivity, absorption, and finishing, were defined. Some of the most relevant parameters comprise the reflectivity of both aluminium and stainless steel; the former covers the detector window inner surface, and the latter is used in most of the inner surfaces, including the gate and anode meshes. Experimental reflectivity values measured in 10.1016/j.nuclphysbps.2007.08.059 were considered for the 2nd continuum of xenon scintillation, while the remaining wavelength region was covered with values reported in 10.1364/JOSA.51.000719 ; 10.1016/0165-1633(89)90039-7 . Less relevant materials like the PMT Macor holder, the field cage’s copper rings and the PTFE structure were also included in the GEANT4 simulation, their reflectivity values being taken from 10.1063/1.3318681 ; silva2010reflection ; macor .
Figure 3 shows a 3-dimensional view of the GEANT4 simulation model and the ray-tracing of 10 scintillation photons generated 36 mm away from the PMT. The detector GE along the central axis perpendicular to the PMT can be found in Figure 5. The GE refers to the ratio of photons reaching the PMT photocathode, i.e. a sensitive area placed below the PMT window, when photons are generated with random directions at different distances from the PMT. The impact of radial effects, such as the incident beam divergence, the size of the ionization electron cluster and the electron transverse diffusion of the ionization electron cloud have been taken into account.
3.1 Primary scintillation emission
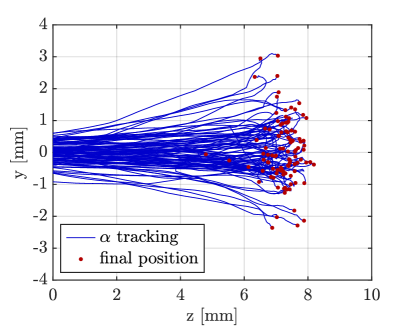
The beam divergence of -particles and x/-rays was obtained from a non-optical GEANT4 simulation, considering the aperture of the collimators used in the experimental campaign. Alpha-particles and x/-rays are generated isotropically at random positions above the collimator and tracked. For -particles the energy deposition along the track is computed with a small step size and used to estimate the distribution of primary photons and ionization electrons produced in the xenon gas. Figure 4 left shows an example of -particle tracks inside the gas volume. However, for x/-rays we rely on the more accurate Degrad model, a Fortran toolkit developed by S. Biagi degrad , to simulate the primary cluster of xenon excited states and ionization electrons, including the shell absorption by photoelectric effect and subsequent Auger, shake-off and fluorescence emission. For this reason, the GEANT4 tracking of x/-rays is stopped as soon as they interact inside the xenon volume, the interaction positions being recorded. This is only possible for x/-rays because -particles are not supported by Degrad.
The working conditions used in our experimental campaign were assumed in Degrad, including the electric field values, pure xenon pressure of 1.2 bar, and estimated temperature of 296 K. Incident x-rays with energies in the 5.9-59.5 keV range were simulated and the total number of primary electrons and xenon excitations per event were obtained, along with their (x,y,z) coordinates. The overall distributions of the primary scintillation photons and electrons are computed, combining the distributions of xenon excited states and electrons obtained from Degrad with the x/-ray interaction positions obtained from GEANT4. Figure 4 right shows an example of the positions where primary scintillation photons are generated for 22.1-keV x-rays.
Finally, the GEANT4 optical simulation is supplied with a randomized sample of photons emitted isotropically following the aforementioned distributions, allowing to compute the GE curve in the absorption region.
3.2 Secondary scintillation emission
The cluster of ionization electrons obtained for -particles from GEANT4 and for x/-rays from the GEANT4-Degrad combination are imported into Garfield++, a toolkit for the detailed simulation of detectors that use gases or semi-conductors as the sensitive media garfieldpp . Garfield++ provides an interface to Magboltz, a simulation tool that computes the electron transport parameters in the gas Magboltz . In Garfield++ the geometry is defined using the class GeometrySimple and the uniform electric field is set using the ComponentConstant. This is done independently for the absorption and the EL region, allowing to set different drift models for computational time requirements, enabling to achieve a better balance between computational efficiency and accuracy of the simulation results. Gas parameters are also set for both regions using the class MediumMagboltz. The drift path is computed using Monte Carlo integration with the class AvalancheMC. After the electrons drift throughout the absorption region, their final positions are imported to the electroluminescence region where the electric field value is higher than the gas scintillation threshold. The movement of the electrons in this region is modelled using the class AvalancheMicroscopic, where the electron is tracked from collision to collision. This model enables the detailed calculation of ionisation and excitation processes. With this method both the coordinates and the number of excited xenon atoms are retrieved and subsequently imported into GEANT4 where the optical simulation takes place. Accordingly, the radial distribution of the excited states of xenon in the EL region obtained from Garfield++ accounts for the x/-ray beam divergence, the initial electron cloud size and the transverse electron diffusion in both regions. Figure 4 also shows an example of a distribution for xenon excited states in the EL region simulated for 22.1-keV x-rays.
3.3 Geometrical efficiency simulation results
Figure 5 depicts the GEANT4 GE simulation results for photon emission as a function of distance to the PMT window. For obtaining the GE curves two different cases were considered, namely assuming the on-axis approximation and, for -particles and for three different x/-ray energies, considering radial effects, taking into account the respective collimator sizes and experimental working conditions. The simplistic GE curve calculated considering only the solid angle and the transparency of gate and anode meshes is also depicted for comparison.
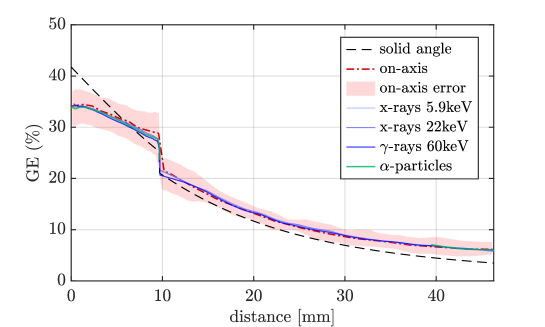
As expected, calculations based solely on solid angle considerations are highly inaccurate. The GE near the detector window can be underestimated by almost 50% due to the relatively higher contribution of photon reflections. Moreover, the simplistic assumption of the mesh transparency fails when neglecting photons hitting the mesh planes at wide angles. Figure 5 also shows the 68%-confidence level error of the GEANT4 on-axis simulation, which is dominated by the uncertainty in reflectivity and unknown polishing degree of some materials.
The degradation of the GE arising from radial effects is about 5% in the EL region and negligible in the absorption region. Remarkably, the GE curves obtained for different x/-ray energies and -particles are comparable even in the EL region. For simplicity, the four GE curves considering radial effects depicted in Fig. 5 are averaged, the result being used in further GE corrections.
4 Analysis methodology
4.1 Waveforms sampling and pre-processing
The PMT signal is split into two oscilloscope channels: a “full-channel” that is used to record the S2 pulse without saturation, and a “zoomed-channel” that is optimized for S1 measurements. The signal of the oscilloscope is triggered on the “full-channel” using the rising edge of the S2 pulse. This setup allows us to measure simultaneously the S2 and S1 pulses with high amplitude resolution. Moreover, the “zoomed-channel” delivers lower baseline fluctuations dominated by the oscilloscope electronic noise.
PMT waveforms have been sampled at 5–10 GS/s. Nevertheless, we were forced to compress the data due to memory limitations in larger x/-ray acquisitions. This was accomplished by averaging successive waveform data points at periodic intervals. On the one hand, such a procedure degrades the time resolution of waveforms, from 0.1–0.2 ns to 10–70 ns, which is still adequate for our studies. On the other hand, it increases the amplitude resolution beyond the 8-bit limit of the oscilloscope. For convenience, the PMT waveforms are inverted, i.e., waveforms presented from now on have positive amplitude, despite the PMT signal being negative.
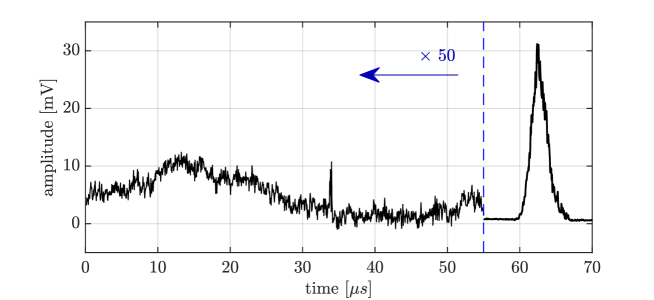
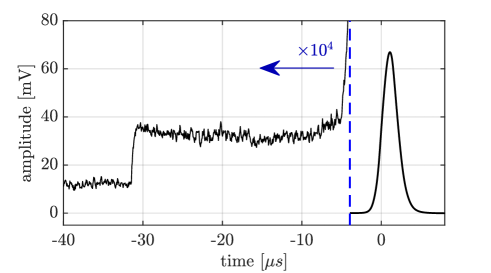
Figure 6 depicts a typical, already compressed PMT waveform obtained for 5.9-keV x-rays. The large pulse around 63 s is the S2 pulse of an x-ray event, and the small spike around 34 s is likely an S1 single photoelectron. The x-ray and gamma-ray energy range, from 6 to 60 keV, studied in this work produce on average only 1 to 15 photoelectrons per interaction, which combined with the low gain of our PMT makes the primary scintillation yield difficult to quantify in a per-event basis. Therefore, despite the S1 footprint being clearly seen in the example of Fig. 6, it might be indistinguishable from the electronic noise for other events. For this reason, we rely on waveform averaging to cancel out the electronic noise hence revealing the primary scintillation signal. Low-frequency fluctuations of the oscilloscope baseline are the major source of statistical error in the S1 measurements. Yet, this can be mitigated with a sufficiently large accumulation of waveforms. Each of the data runs comprises between 105 and 2106 waveforms, and can span 1 to 3 days of continuous data acquisition. The stability of the system has been continuously monitored during such long acquisition periods, by surveilling the centroid of the highest peak in the energy spectrum of the radioactive source being in use, obtained from the S2 pulse integration.
A pre-processing algorithm was developed to discriminate background events (e.g., cosmic radiation), as well as waveforms with features that are unsuitable for further analysis. This is particularly important for the accuracy of primary scintillation measurements. Since S2 pulses are 4 orders of magnitude larger than S1 pulses, a single background event can jeopardize the entire sample of events over which S1 is averaged. An example is a waveform with two S2 pulses for which one of them falls into the S1 region. Therefore, the discrimination algorithm rejects waveforms based on the baseline cleanliness, as well as on the duration, time offset and shape of the S2 pulse. In addition, the oscilloscope baseline offset is measured at the beginning of every recorded waveform and corrected accordingly.
4.2 PMT calibration
An accurate calibration of the photosensor gain is crucial to quantify both primary and secondary scintillation yields. A blue LED biased with direct current was used to obtain the single photoelectron charge distribution of the PMT. Since the detector radiation window can transmit visible light into the PMT, there was no need to place the LED inside the gas chamber. PMT waveforms were digitized with a sampling rate of 10 GS/s, allowing to resolve the short pulses of single-photoelectrons. The oscilloscope trigger threshold was set as low as possible without being overly saturated by background spikes. The LED light intensity was adjusted for the probability of having more than one photoelectron event in the same waveform to be negligible. Several measurements with different trigger levels and LED intensities were carried out to access the experimental uncertainty. The PMT gain calibration was performed several times along the full experimental campaign to monitor its performance. The gain variation was found to be within experimental errors.
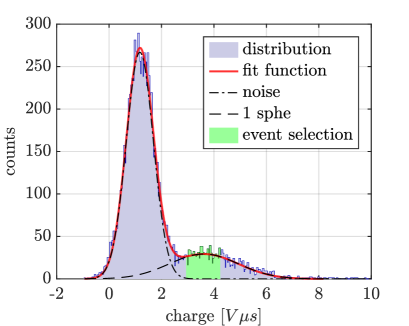
Since a 200-Ω load resistor is used to collect the anode signal, wave reflections at both ends of the signal cable are significant and needed to be account for. However, due to the relatively large baseline fluctuations, waveform integration of the single photoelectron pulse for time durations above 200 ns, necessary to take into account those reflections, results in a large noise peak in the PMT charge distribution, engulfing the single photoelectron peak. Therefore, instead of integrating the full single photoelectron signal, only a short region of the waveform containing the first pulse was integrated, between -2 and 7 ns with respect to the oscilloscope trigger time. This small integration time alleviates the impact of the baseline fluctuations, with the disadvantage of excluding the reflected pulses. Figure 7 left shows the charge distribution resulting from that integration. A sum of three Gaussians was fitted to this charge distribution: the first Gaussian accounts for the electronic noise with area, centroid, and sigma being left as free parameters, while the other two Gaussians account for single- and double-photoelectron emission. Their centroids follow the scaling and , respectively, where is the centroid of the single-photoelectron Gaussian, with standard deviations following and , respectively, and the areas being related through Poisson statistics. The centroid and the standard deviation of the single-photoelectron Gaussian were left as free parameters, as well as the rate parameter, , of the Poisson distribution.
This charge distribution was, then, used to select a sample of single-photoelectron events, with charge values between and , falling outside the electronic noise and the double-photoelectron Gaussians, Fig. 7 left. The waveforms of these selected events are then averaged and the baseline offset, measured before the photoelectron pulse, subtracted. Figure 7 right shows a typical average waveform obtained from those selected events, highlighting the full pulse and the baseline offset regions. The chain of reflected pulses is, now, clear, due to the cancellation of the electronic noise. As expected, the spacing between pulses, 16 ns, corresponds to twice the cable delay, which is 8 ns. The full photoelectron signal was integrated between -10 and 200 ns. A mean charge value per single photoelectron of 10.9 0.3 mV ns was obtained for a PMT biasing of 1450 V.
As a crosscheck for the above value, a second method was used: subtracting previously the baseline to each individual waveform, by considering its baseline as a straight line defined by the two offset values in the regions just before the starting of the pulse and just after the 200-ns pulse duration, and integrating the full waveform. Averaging over all waveform integrals, one obtains a charge value 4% lower than what was obtained by the former method, being this difference most likely due to the baseline correction constraints.
We note that the probability of double-photoelectron emission from the PMT photocathode is negligible in the visible region, but may reach 20% for VUV photons Faham:2015kqa . Accordingly, one could expect that our experimental results would also be affected by the double-photoelectron effect. However, this contribution is cancelled out in calculations, since we use the PMT QE curve provided by the manufacturer, which also includes this effect.
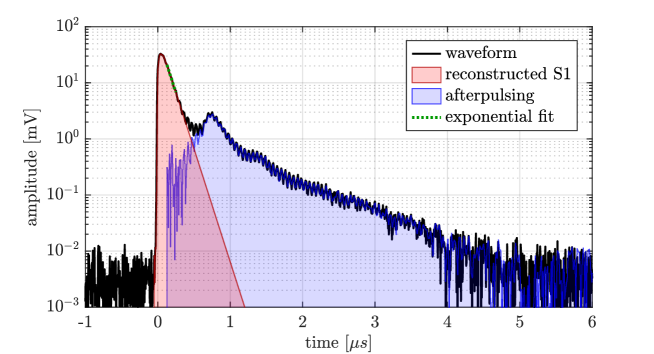
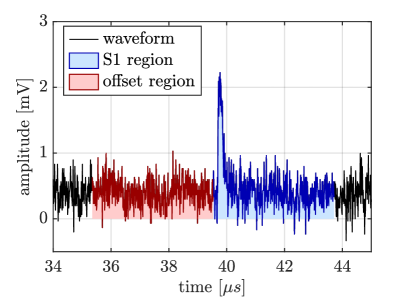
As the PMT used in this work is old, we also took into account in its calibration the effect of the afterpulsing, generated by the ionization of residual gases inside the PMT and the subsequent drift of the positive ions towards the photocathode where they induce the emission of further electrons. The PMT afterpulsing contribution can be quantified using primary scintillation events, because they are sufficiently separated in time from the afterpulsing, given the short scintillation pulse of pure Xe, 100 ns decay time for the dimer triplet state. Figure 8 depicts a typical waveform averaged over 1.5 103 primary scintillation waveforms, obtained from -particle interactions. The reduced electric field in the absorption region was set to 140 V cm-1 bar-1 to prevent ion recombination 10.1088/1748-0221/10/03/P03025 ; 10.1088/1748-0221/8/05/P05025 ; 10.1143/JJAP.48.076501 ; 10.1109/tns.2004.836030 , while keeping the neutral bremsstrahlung emission at residual levels NBrS_prx . The primary scintillation waveforms were aligned using the rising edge at 50% of the pulse’s height. The PMT afterpulsing is noticeable well separated from the primary scintillation tail. An exponential function was fitted between 130 ns and 250 ns to avoid the contributions from both the fast xenon scintillation component of the singlet state and the afterpulsing. In this way, the afterpulsing signal could be obtained subtracting the reconstructed S1 pulse from the average waveform, as illustrated in Fig. 8. An afterpulsing contribution of (24.9 1.3) % was measured. This value was crosschecked using waveforms obtained from a fast pulsed LED, attaining a 6% lower value, relative to the former result.
We note that the results of Fig. 8 allow us to infer upper limits for the impurity content in our chamber 10.1016/j.nima.2017.08.049 ; 10.1016/j.physletb.2017.09.017 ; 10.1007/JHEP01(2019)027 . From the above fit, a value of 108 5 ns was obtained for the decay time of the Xe dimer triplet state, to be compared with an average reference value of 100.9 0.7 ns 10.1063/1.454313 . Using Eq. (1) from 10.1016/j.nima.2017.08.049 together with the two-body quenching rates for excited xenon atoms reported in the literature, N2, CO2, O2, and CH4 from 10.1063/1.436447 and H2O from 10.1021/j100211a041 , an upper limit of 21 ppm can be inferred for H2O, O2, CO2, and CH4 concentrations at 95% confidence level, and 409 ppm for N2. Lower values can be derived for heavier molecules based on the same references. Therefore, our absolute measurements of primary or secondary scintillation yields are unlikely to be biased by impurity quenching, since higher concentrations are typically required to have a sizable impact on Xe scintillation 10.1016/j.nima.2017.08.049 ; 10.1016/j.physletb.2017.09.017 ; 10.1007/JHEP01(2019)027 .
4.3 X-ray and -ray runs
4.3.1 Energy and pulse duration cuts
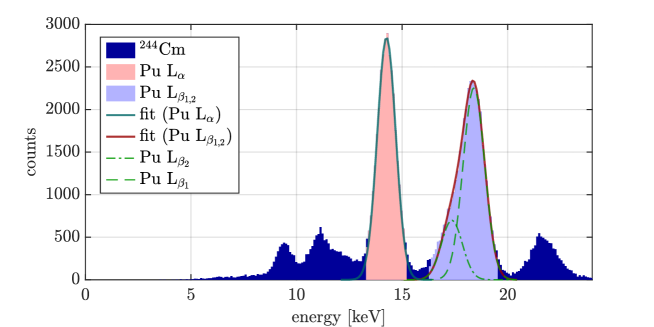
Secondary scintillation pulses were integrated, allowing to build the energy spectrum of the radioactive sources, being the highest peak used as reference for energy calibration. The reconstructed energy spectra have shown good linearity, with a deviation lower than 3% from the different theoretical values. In this way, waveforms originated for different energies can be selected for subsequent S1 measurements. The peaks of interest were fitted to Gaussian functions, and events within 1.4 sigma, , with respect to their centroids, , were selected. A double Gaussian fit was applied when the energy peak is highly asymmetrical due to the presence of two different energies, e.g. and lines, with both the ratio between the centroids, , and the dependence on being fixed. Accordingly, in those latter cases, the selected energy ranged from , of the first Gaussian, to , of the second Gaussian. The ratio between the areas of the two fitted Gaussian functions was used to estimate the weighted theoretical energy of the selected double peak, required for further calculations. Figure 9 shows two examples of energy cuts performed for the x-ray energy spectrum of a 244Cm radioactive source, including the Gaussian fits used for calibration and energy cuts.
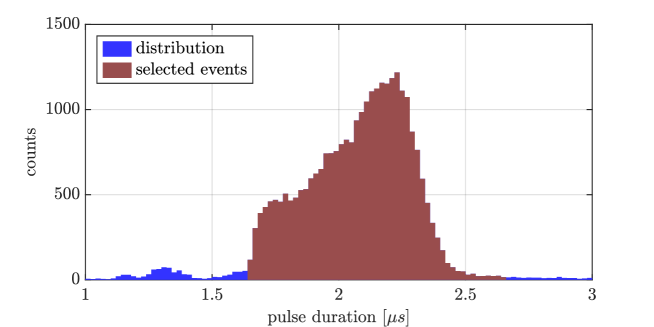
Since S2 pulse duration is directly proportional to the path length drifted by the primary electron cloud along the EL region, this parameter was used to further discriminate the waveforms. Figure 10 shows the distribution of S2 pulse duration, measured between the 50%-thresholds of the S2 rising- and falling-edges, obtained from 14.3-keV interactions that passed in the energy cut, Fig. 9. The shape of the distribution is attributed to the longitudinal electron diffusion: the longer the path length drifted by the electrons in the absorption region, the larger the electron cloud, therefore producing longer S2 pulses. The pulse width selection region was defined to be between the 15% and 1.5% thresholds of the rising and falling edges, respectively, as illustrated in Fig. 10. The lower cut discriminates events corresponding to x-ray interactions occurring inside the EL region, e.g. from x-ray interactions with higher energies, while the higher cut rejects some background and anomalous waveforms.
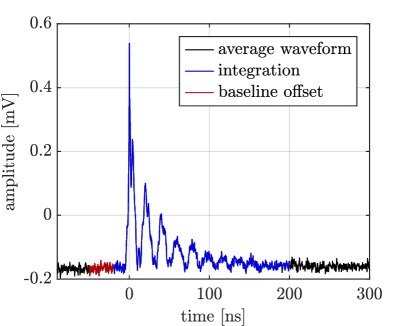
Finally, waveforms passing both the energy and the pulse duration cuts are averaged to cancel out the electronic noise. The 50%-threshold of the S2 rising edge was chosen for the alignment of waveforms avoiding the jitter introduced by S2 pulse-width fluctuations. Figure 11 shows an average waveform obtained for 14.3-keV x-rays, being computed from the events sampled in Fig. 9 and Fig. 10. Owing the large x/ -ray penetration along the absorption region, a S1 continuum is unveiled, due to interactions occurring at different depths, despite being 4 order of magnitude weaker when compared to S2. This continuum can’t be separated from the S2 rising tail.
4.3.2 Spatial cuts
To avoid contaminating S1 measurements with the S2 contribution, the primary scintillation yield obtained from the average waveforms was determined selecting only x/-ray interactions occurring in the first few centimetres of the absorption region. These spatial cuts were defined using the electron drift velocity, which was measured for all the studied energy peaks and all the reduced electric fields applied to the drift region. Electron drift velocities were computed from the time elapsed between S1 and S2 rising edges of the average waveform, corresponding to the transit time of electrons across the full absorption region. Figure 12 shows the electron drift velocity obtained for all studied peak energies as a function of reduced electric field. Our experimental data agree within two sigma with the theoretical curve obtained from a Magboltz simulation, which is also depicted.
The electron drift velocity can be used to plot the waveform as a function of distance travelled by the primary electron cloud in the drift region. The integration of the S1 continuum of the average waveform was performed for the first 2.5 cm of the absorption region. This region was chosen to maximize the S1 statistics while keeping possible S2 contribution negligible.

4.3.3 S1 yield determination
The waveform of Fig. 11 can be, now, corrected for the detector geometrical efficiency, section 3, to estimate the isotropic primary scintillation emission. Figure 13 shows a typical average waveform obtained for 14.3-keV x-rays, corrected for the GE curve, in terms of the depth where the scintillation occurs: -3.6 cm and 0 cm correspond to the detector window and gate mesh positions, respectively. The baseline offset is measured immediately before the S1 integration region and subtracted to the waveform.
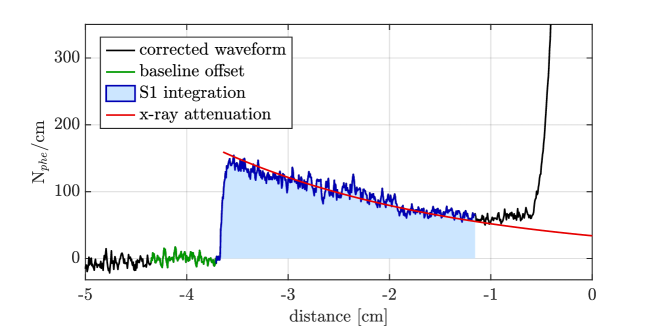
As shown, the GE-corrected waveform follows the theoretical exponential x/-ray absorption law, which is also plotted in Fig. 13. This observation supports the reliability of the developed GE simulation model.
The average waveform was composed by all events under a specific energy peak that occurred inside the whole absorption region. Therefore, the ratio of events in the S1 integration region to the total number of S1 events occurring in the absorption region had to be accounted for in the determination of the primary scintillation yield. This parameter, , was estimated from the exponential absorption law of x/-rays in xenon expected for the respective experimental working conditions, i.e. the theoretical energy of the impinging x/-ray, the gas pressure and the temperature.
From the integration of the waveform amplitude, the total charge induced in the PMT anode by the x/-ray interactions was determined. This charge was converted into number of photoelectrons produced in the PMT photocathode from the single-photoelectron mean charge, , corrected for the afterpulsing contribution, as obtained in section 4.2. Therefore, the number of primary scintillation photons per event was calculated from the amplitude of the corrected average waveform, , according to the following equation:
| (1) |
where is the PMT quantum efficiency at 175 nm, is the experimental electron drift velocity, the waveform amplitude and the geometrical efficiency, both as a function of distance to the detector window , integrated over the -3.6 to -1.1 cm interval.
The energy required to produce one scintillation photon was obtained assuming the theoretical deposited energy of the peak being studied or, in the case of double peaks, the theoretical weighted energy:
| (2) |
4.3.4 S2 yield determination
In addition to the primary scintillation determination, our setup allows measuring the electroluminescence yield. This parameter was calculated using the average charge of the S2 signal, , obtained from the centroid of a Gaussian fitted to the selected energy peak of the S2 charge distribution, as can be seen in Fig. 9. In this way, the number of EL photons produced per drift path length, per ionization electron and per unit of pressure, , was computed according to the equation:
| (3) |
where is the average geometrical efficiency in the EL region, 31%, see Fig. 5; is the EL gap length; is the gas pressure, 1.2 bar; and is the mean number of ionization electrons produced in a x/-ray interaction. where is the mean energy required to create one electron-ion pair in xenon. A -value of 21.6 0.2 eV was considered, as measured experimentally for xenon at a pressure around 1 bar in 10.1109/TNS.2008.2003075 .
As a cross-check, the parameter can also be obtained from the integration of the S2 pulse average waveform, as was done for the primary scintillation analysis method. The obtained for both the S2 charge distribution method and the average waveform integration method were found to agree within a 3%-error, supporting the reliability of the average waveform analysis used in primary scintillation studies. The former method for calculations has been henceforth applied, the difference between the two methods being included in the experimental uncertainty.
4.4 Alpha-particle runs
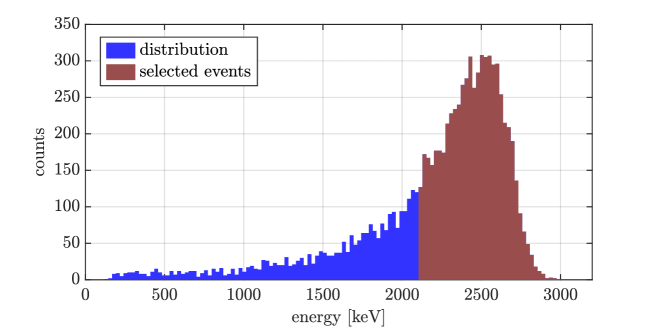
The energy of 241Am -particles is 2 orders of magnitude higher than the studied x/-ray energy range. To avoid PMT saturation for S2 pulses, it was biased at a lower voltage, 800 V instead of 1450 V. The PMT gain scaling factor was measured using the centroid of the 5.9-keV x-ray peak from the 55Fe energy spectrum, acquired for both PMT voltages and using the same reduced electric field values. The theoretical energy deposited by -particles in GXe cannot be accurately simulated, due to the unknown thickness of both the aluminium-deposited film on the detector window and the gold protective layer of the radioactive source. Therefore, the detector was calibrated with the 5.9-keV peak from the 55Fe radioactive source, using the same reduced electric field values and gas pressure as in -particle runs. Figure 14 shows a typical energy spectrum obtained for the S2 charge distribution of -particles after calibration. The different layers of materials degraded energy and trajectory of -particles before they reached the xenon gas, resulting in a left-tailed peak. Low energy events were discriminated as they might have occurred too close to the detector window where the electric field is weaker, and some of the produced ionization electrons could have been lost to the window electrode. Thus, only events with energies higher than 40% of the height of the energy peak were accounted for in primary scintillation calculations, as illustrated in Fig. 14. Pulse duration cuts were not required for -particles because they did not reach the EL region.
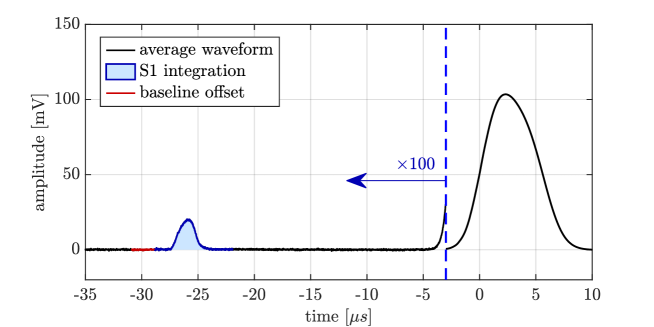
As in the x/-ray analysis method, the average waveform was computed from selected events and corrected for the baseline offset that is measured before S1. Figure 15 depicts a typical waveform averaged over 6 103 events. Since the -particle penetration is short and the electron cloud drift time is similar for all the events, the S1 pulse is sharp and localized. Therefore, the primary scintillation yield can be obtained directly from the integration over the full S1 pulse, hence avoiding the need for spatial cuts. Figure 15 illustrates as well the waveform regions used for baseline offset correction and for S1 integration.
The GE correction was calculated from the simulated GE curve, Fig. 5, weighted over the energy deposition along the -particle interaction depth, Fig. 4 left, as obtained from GEANT4 -particle tracking, described in section 3.1. Mylar films with different thicknesses were used to degrade the -particle energies in order to irradiate the detector with -particles of different energies. Accordingly, for every data acquisition, the energy of simulated -particles was adjusted for the deposited energy distribution to match the mean energy measured experimentally after the energy cuts were applied. The mean geometrical efficiency value, , was found to be in the 6% to 7% range, depending on the -particle energy being studied. In this way, the number of primary scintillation photons generated per event, , was computed as:
| (4) |
where is the amplitude of the average waveform integrated between -2 and 5 with respect to 50% of the S1 pulse rising edge. and are the same values as in the x/-ray analysis method. Finally, the -value was obtained from:
| (5) |
Where is the measured deposited energy, averaged over the selected events, Fig. 14.
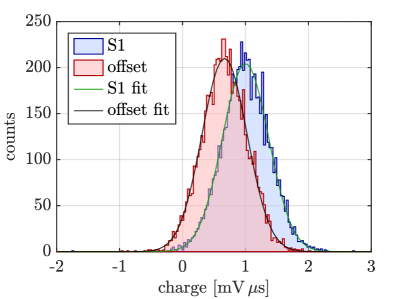
In contrast to x/-ray runs, the S1 pulse was large enough to be detected in the individual -particle waveforms, allowing to perform per-event statistics. For this analysis method the S1 pulse-time was automatically detected as the maximum amplitude in the S1 region of the waveform, which was previously processed with a software-implemented differentiator and a moving average to remove both low- and high-frequency fluctuations. Finally, the baseline offset and the S1 pulse were integrated in the intervals -4.2 to -0.2 and -0.2 to 3.8 , respectively, with respect to the S1 peaking time. Figure 16 left shows an example of a single -particle waveform with highlighted integration regions. Figure 16 right shows the distribution of integration values for both baseline offset and S1 pulse. Despite the energy of the selected -particle events not obeying a Gaussian distribution, the S1 integral distribution is roughly Gaussian due to the large number of statistical fluctuations. Therefore, both S1 mean charge value and mean baseline offset could be estimated from the centroid of a Gaussian function fitted to each distribution, as shown in Fig. 16 right.
The difference between -values obtained from both methods, average waveform and per-event statistics, was under 2%. This agreement supports our assumption that the waveform average method does not introduce a meaningful systematic error in the results. results for -particles reported henceforth correspond to the mean value obtained with both methods.
5 Results and discussion
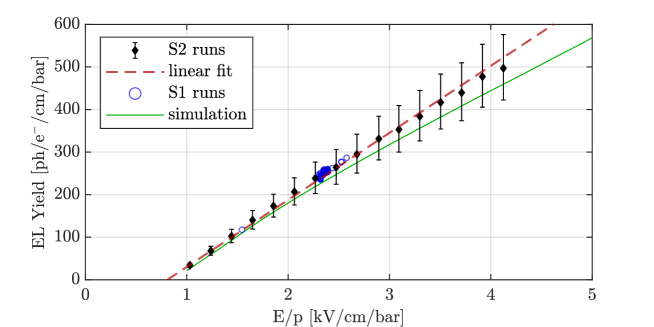
The reduced electroluminescence yield, , as a function of reduced electric field, , in the EL region is shown in Fig. 17, together with the theoretical curve obtained with Garfield++ simulation, as described in section 3.2. 5.9-keV x-rays from a 55Fe radioactive source were used, although with much lower acquisition times when compared with primary scintillation runs. Only the systematic error is depicted since the statistical uncertainty was lower than 3%, thus negligible. EL yield values that were obtained from the primary scintillation acquisition runs are depicted as well. The typical approximately linear dependency of EL yield with electric field is observed. A line fitted to the experimental data is also depicted, having the following fit parameters: , where and have units of and , respectively. The interception of the fitted line with the axis, defined as the EL threshold is . The experimental EL yield is about 7% higher than theoretical predictions and 14% higher when compared to the experimental values obtained in a driftless GPSC 10.1088/1748-0221/2/05/P05001 . Nevertheless, these differences are within experimental uncertainties.
5.1 absolute measurements
The -value was measured for different electric field values in the absorption and in the EL region to evaluate possible systematic errors and the role of electron-ion recombination. In the absorption region, the electric field was varied in the 70–300 V cm-1 bar-1 range. At moderately high electric field values, the recently unveiled neutral bremsstrahlung emission in xenon becomes significant when compared with the weak primary scintillation emission. We resorted to the NBrS photoelectron yield measured in NBrS_prx to estimate its contribution in our data. The NBrS contribution in the S1 integration region was estimated considering the geometrical efficiency model and the distribution of event position along the absorption region. For the highest electric field value, 300 V cm-1 bar-1, the NBrS accounted for 11% of the total S1 charge, being negligible below 150 V cm-1 bar-1. These corrections were included in the calculations. For -particle runs the NBrS impact was negligible because only a short region of the waveforms was integrated. We did not find any significant dependency of the -value, duly corrected for NBrS contribution, on the electric fields either in the absorption region or in the EL region, within the studied ranges. Therefore, any major systematic error associated to electric field is unlikely to occur.
Figure 18 shows the -values measured in the absence of recombination for x/-ray and -particle interactions in the energy range between 5.9 keV and 2.5 MeV, assuming a negligible 3rd continuum emission. Data points corresponding to the same energy were statistically combined for clarity. Systematic and statistical errors at the 68% confidence level are displayed with separated error bars. The systematic uncertainty arises mainly from the detector geometrical efficiency simulation, Fig. 5, though with sizeable contributions from the PMT single-photoelectron calibration and quantum efficiency, 9% and 7%, respectively. Whereas the latter two contributions are energy-independent, the GE uncertainty is generally lower for high energy x/-rays, since the relevance of photon reflection becomes smaller for interactions occurring closer to the PMT. This partially explains the large systematic error in -particle runs, which also includes an additional error source stemming from the detector energy calibration, 14%. The statistical uncertainty was dominated by the oscilloscope’s baseline fluctuations. Therefore, this error was lower in -particle data due to the much higher S1 amplitude when compared to the baseline fluctuations.
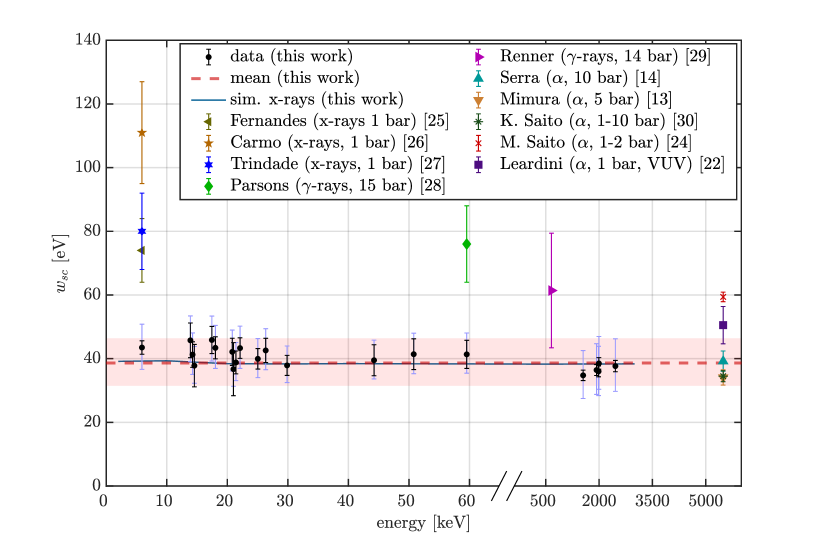
The mean -value of our experimental data, 38.7 0.6 (sta.) (sys.) eV, is also depicted in Fig. 18, being computed from the entire dataset weighted over the respective statistical errors. When the dataset was split into x/-ray and -particle runs, the mean -values obtained were 41.8 1.0 (sta.) (sys.) eV and 36.6 0.8 (sta.) (sys.) eV, respectively. These differences are within the experimental uncertainty, preventing us from precisely observe any fundamental distinction between the primary scintillation yield for electrons and alpha particles.
All the values depicted in Fig. 18 assume the 3rd continuum emission to be negligible, except the value reported by Leardini et al., which refers to the 2nd continuum only, as they used optical filters to suppress the most part of the 3rd continuum emission 10.1140/epjc/s10052-022-10385-y . However, the measured values for the primary scintillation yield includes the contribution of both the 2nd and the 3rd continuum, as the PMT is sensitive to wavelengths in the 150-650 nm region. Our PMT QE, Fig. 2, was a factor of 1.32 higher for the xenon 3rd continuum with respect to the 2nd continuum, while the GE of the detector was a factor of 1.05 higher, as obtained from the GE simulation model. At 1.2 bar, the ratio between the contributions from the 3rd and the 2nd continuum to the primary scintillation emission in the absence of recombination was measured to be 0.09 0.01 10.1140/epjc/s10052-022-10385-y . Therefore, the mean energy required to produce a 2nd continuum scintillation photon was estimated to be = 43.5 0.7 (sta.) (sys.) eV, where is the measured value when neglecting the 3rd continuum emission. The mean energy required to produce a 3rd continuum photon was computed as 483 7 (sta.) (sys.) eV and the mean energy required to produce a primary scintillation photon was obtained as 39.9 0.6 (sta.) (sys.) eV.
As a crosscheck, instead of relying on the PMT single photoelectron response and the absolute simulated GE for optical calibration of the detector, one could use the S2 charge distribution and the corresponding yield value given by simulation. Since the experimental EL yield depicted in Fig. 17 is 7% higher than the simulation value, one may argue that data obtained by the former method are overestimated, e.g. due to a systematic uncertainty related to the PMT calibration. Accordingly, the -values obtained with that method could be underestimated. Assuming this second method, the results obtained with the former method could be normalized considering the ratio between theoretical and experimental EL yields, as the latter was measured for every run by integrating the S2 pulses of the waveforms. Such a correction would make -values 7% higher on average, which nevertheless is still within the 68% confidence level of the present data of Fig. 18. If, on one hand, this second analysis method has the advantage of eliminating the systematic uncertainty introduced by both PMT calibration and QE, as well as a sizeable part of the GE uncertainty. On the other hand, it introduces new error sources, such as the width of the EL region and the gas temperature, both contributing 5%. For this reasons, we consider the absolute -values depicted in Fig. 18 to be more accurate than EL-corrected values.
As another crosscheck to our -values we applied the same analysis method used in this work to other two gas scintillation chambers filled with Xe, namely a driftless GPSC used in NBrS_prx ; 10.1016/j.physletb.2017.09.017 ; 10.1007/JHEP01(2019)027 and a similar chamber built for Kr-gas studies daniel . The -values obtained for 5.9-keV x-rays and 2-MeV -particles agree within experimental uncertainties with the values presented here.
5.2 comparison with literature values
Figure 18 illustrates well how dispersed is the data from the literature. Despite the theoretical values, around 40 eV, are compatible with most of the -particle results, there is a clear disagreement with x/-ray data. is expected to be similar for x-, -rays or electrons and almost equal to that obtained for -particles 10.1143/JJAP.48.076501 . However, the results presented so far in the literature are inconsistent with that expectation, being this difference not understood. The results presented in this work agree with both theoretical predictions and most of -particle experimental values. In addition, the present results do not show a dependency of with the nature or the energy of the impinging radiation, being incompatible with literature’s values obtained for x/-rays, even considering the experimental uncertainties. The different experimental conditions reported in the literature seem insufficient to explain the discrepancies. The impact of gas pressure is expected to be minor up to 20 bar 10.1016/j.nima.2017.08.049 ; 10.1143/JJAP.48.076501 ; 10.1140/epjc/s10052-022-10385-y and for electric field values above 60 V cm-1 bar-1, recombination is negligible 10.1088/1748-0221/10/03/P03025 ; 10.1088/1748-0221/8/05/P05025 ; 10.1143/JJAP.48.076501 ; 10.1109/tns.2004.836030 .
In order to clarify this puzzle, we attempted to replicate the experimental methodology of Fernandes’ and Carmo’s works 10.1088/1748-0221/3/07/P07004 ; 10.1088/1748-0221/5/09/P09006 , since their experimental apparatus were similar to the one we have used. A major difference was the fact that the data acquisition system in those works consisted of conventional x-ray spectroscopy electronics, i.e. instead of feeding the PMT signal directly into the oscilloscope, the PMT signal was first integrated and shaped by a pre-amplifier and a linear amplifier chain. Like in our analysis method, the weak primary scintillation signal was unveiled by averaging several PMT waveforms, though with far less statistics, 128 against 106 events. Due to hardware signal integration, the S1 and S2 heights were proportional to the PMT charge produced by the primary and secondary scintillation emissions. Hence, the S1 and S2 pulse heights from 5.9 keV x-rays were measured from two averaged waveforms acquired in different runs: one with a low amplification level set in the linear amplifier to avoid S2 pulse saturation, and the other with high amplification to reveal the S1 pulses. The ratio between the two pulse heights was corrected for the difference between the solid angles subtended by the PMT with respect to the primary and secondary scintillation emissions, being the absolute EL yield established in the literature used to estimate the total number of primary scintillation photons, in spite of the 4 orders of magnitude difference between them.
We were able to reproduce Fernandes’ and Carmo’s findings by replicating the above methodology. We identified several issues in the analysis method leading to large systematic errors, which in our opinion were not properly accounted for in those works. The lack of an adequate light propagation model to quantify the geometrical efficiency in the absorption and in the EL region was the most obvious one. Figure 5 illustrates how important photon reflection is. From our simulation data, a 50% underestimation of the -value would be expected, yet this is the opposite that is shown in Fig. 18. Therefore, a much larger and opposite experimental error would be required to explain those results.
A major source of systematic errors is the oscilloscope trigger threshold, which serves in this analysis as the only method of event selection and discrimination. Since S1 and S2 pulses were averaged over every waveform, their heights include all background events occurring above the trigger threshold, such as cosmic rays. Indeed, we observed a 100% increase of the parameter just by tightly collimating the 55Fe radioactive source, thus increasing the ratio between background and 5.9-keV x-ray events. This finding is disruptive, since it demonstrates how the measurement can be easily biased by the radioactive source activity and by the background levels of a given experiment. When measuring the S1 height of the average waveform, the signal needs to be amplified by about 3 orders of magnitude by the linear amplifier. Consequently, the maximum setting of the oscilloscope’s trigger threshold is much lower than S2 amplitudes. In such conditions, all S2 pulses with energies above 0.0059 keV are triggered, and even some S1 pulses can be triggered as if they were S2 pulses. Many of these backgrounds or badly sampled waveforms do not actually have any photon emission in the S1 region, thus leading to an underestimation of the average S1 height. Indeed, we found out that by simply decreasing the trigger threshold, the -value could increase from 60 eV to 150 eV.
6 Conclusions
We have carried out an experimental campaign to measure the gaseous xenon primary scintillation yield, – the average energy to produce a primary scintillation photon, for interactions of alpha particles in the 1.5 – 2.5 MeV range and for x/-rays in the 6 to 60 keV range. We used a gas scintillation chamber instrumented with a PMT to readout both the primary scintillation, S1, produced upon radiation interaction and the secondary proportional scintillation, S2, produced by the primary ionization electrons. For the purpose we digitized the PMT waveforms using the large S2 pulses to trigger the digitizer, and averaged a very large number of pulses, 106, to cancel out the electronic noise and unveil the signal from the primary scintillation.
Two methods have been used: optical calibration through single photoelectron response and optical calibration using the area of the S2 waveform being the corresponding yield value given by simulation. Both methods agree within the experimental uncertainties.
Measuring the -value is far more challenging for low energy x-rays than for -particles. Whereas per-event statistics can be used in -particle runs, waveforms averaging is required for x/-rays. We validated the latter method by comparing it with per-event statistics for -particles, achieving similar results well within the experimental uncertainties.
We obtained a -value that is simultaneously compatible with well-established literature data reported for -particles and in good agreement with state-of-the-art simulations performed for x/-ray interactions. In addition, the present results do not show a significant dependency of with the nature or the energy of the impinging radiation. These arguments sustain our hypothesis that some literature -values obtained for x/-ray are unreliable due to undressed systematic errors.
The results obtained in this work are summarized in Table 2 for the absolute -value. We chose to present the mean -value of all our experimental data, being computed from the entire dataset weighted for the respective statistical errors. In addition, we present the -value for second and third continua separately, assuming a 3rd-to-2nd continuum yield ratio of 0.09, as recently disclosed in the literature, and the -value for the emission of either 3rd or 2nd continuum photon.
| (eV) | observations |
|---|---|
| 38.7 0.6 (sta.) (sys.) | 3rd continuum neglected |
| 43.5 0.7 (sta.) (sys.) | 2nd continuum |
| 483 7 (sta.) (sys.) | 3rd continuum |
| 39.9 0.6 (sta.) (sys.) | 2nd+3rd continua |
Acknowledgements.
This work was fully funded by national funds, through FCT – Fundação para a Ciência e a Tecnologia, I.P., under Projects No. UIDP/04559/2020, UIDB/04559/2020, CERN/FIS-TEC/0038/2021 and PTDC/FIS-NUC/3933/2021, and under Grant No. UI/BD/151005/2021. We thank C.D.R Azevedo for introducing to simulation inter-using Magboltz, Garfield++ and Degrad. We thank D. Gonzalez-Dias for fruitful discussions.References
- (1) P. Ferrario, J.M. Benlloch-Rodríguez, G.D. López, J.A.H. Morata, M. Kekic, J. Renner et al., Demonstration of the event identification capabilities of the NEXT-White detector, J. High Energy Phys. 10 (2019) 052 [1905.13141].
- (2) S. Obara, S. Ban, M. Hirose, A.K. Ichikawa, T. Kikawa, K.Z. Nakamura et al., AXEL: High-pressure Xe gas TPC for BG-free decay search, Nucl. Instrum. Meth. A 958 (2020) 162803 [1909.09343].
- (3) J.J. Gomez-Cadenas, F. Monrabal Capilla and P. Ferrario, High Pressure Gas Xenon TPCs for Double Beta Decay Searches, Front. in Phys. 7 (2019) 51 [1903.02435].
- (4) J. Galan, X. Chen, H. Du, C. Fu, K. Giboni, F. Giuliani et al., Topological background discrimination in the PandaX-III neutrinoless double beta decay experiment, J. Phys. G 47 (2020) 045108 [1903.03979].
- (5) Y.M. Gavriljuk, A.M. Gangapshev, V.V. Kazalov, V.V. Kuzminov, S.I. Panasenko, S.S. Ratkevich et al., 2K-Capture in 124Xe: Results of Data Processing for an Exposure of 37.7 kg day, Phys. Part. Nucl. 49 (2018) 563 [1806.03060].
- (6) G. Martínez-Lema, M. Martínez-Vara, M. Sorel, C. Adams, V. Álvarez, L. Arazi et al., Sensitivity of the NEXT experiment to Xe-124 double electron capture, J. High Energy Phys. 21 (2020) 203 [2006.07320].
- (7) D.R. Nygren, Columnar recombination: a tool for nuclear recoil directional sensitivity in a xenon-based direct detection WIMP search, in J. Phys. Conf. Ser., vol. 460, p. 012006, 2013.
- (8) M. Mimura, H. Kusano, S. Kobayashi, M. Miyajima and N. Hasebe, Xenon time projection chamber for next-generation planetary missions, J. Phys. Soc. Japan 78 (2009) 157.
- (9) A.S. Novikov, S.E. Ulin, V.V. Dmitrenko, Z.M. Uteshev, K.F. Vlasik, V.M. Grachev et al., New modification of xenon gamma-ray detector with high energy resolution, Opt. Eng. 53 (2013) 021108.
- (10) A. Bolotnikov and B. Ramsey, The spectroscopic properties of high-pressure xenon, Nucl. Instrum. Meth. A 396 (1997) 360.
- (11) E. Conti, R. DeVoe, G. Gratta, T. Koffas, S. Waldman, J. Wodin et al., Correlated fluctuations between luminescence and ionization in liquid xenon, Phys. Rev. B 68 (2003) 054201 [hep-ex/0303008].
- (12) M. Auger, D.J. Auty, P.S. Barbeau, E. Beauchamp, V. Belov, C. Benitez-Medina et al., Search for Neutrinoless Double-Beta Decay in 136Xe with EXO-200, Phys. Rev. Lett. 109 (2012) 032505 [1205.5608].
- (13) M. Mimura, S. Kobayashi, N. Masuyama, M. Miyajima and N. Hasebe, Average Numbers of Scintillation Photons and Electrons Produced by an Alpha Particle in High-Density Xenon Gas, Jpn. J. Appl. Phys. 48 (2009) 076501.
- (14) L. Serra, M. Sorel, V. Álvarez, F.I.G. Borges, M. Camargo, S. Cárcel et al., An improved measurement of electron-ion recombination in high-pressure xenon gas, J. Instrum. 10 (2015) P03025 [1412.3573].
- (15) T. Takahashi, S. Himi, M. Suzuki, J.-Z. Ruan(Gen) and S. Kubota, Emission spectra from Ar-Xe, Ar-Kr, Ar-N2, Ar-CH4, Ar-CO2 and Xe-N2 gas scintillation proportional counters, Nucl. Instrum. Methods Phys. Res. 205 (1983) 591.
- (16) M. Suzuki and S. Kubota, Mechanism of proportional scintillation in argon, krypton and xenon, Nucl. Instrum. Meth. 164 (1979) 197.
- (17) P. Millet, A. Birot, H. Brunet, J. Galy, B. Pons-Germain and J. Teyssier, Time resolved study of the uv and near uv continuums of xenon, J. Chem. Phys. 69 (1978) 92.
- (18) Y. Salamero, A. Birot, H. Brunet, H. Dijols, J. Galy, P. Millet et al., Energy transfer kinetics of the VUV emissions for Kr–Xe mixtures, J. Chem. Phys. 74 (1981) 288.
- (19) K. Fujii, Y. Endo, Y. Torigoe, S. Nakamura, T. Haruyama, K. Kasami et al., High-accuracy measurement of the emission spectrum of liquid xenon in the vacuum ultraviolet region, Nucl. Instrum. Meth. A 795 (2015) 293.
- (20) E. Aprile and T. Doke, Liquid Xenon Detectors for Particle Physics and Astrophysics, Rev. Mod. Phys. 82 (2010) 2053 [0910.4956].
- (21) C.A.O. Henriques, P. Amedo, J.M.R. Teixeira, D. González-Díaz, C.D.R. Azevedo, A. Para et al., Neutral Bremsstrahlung Emission in Xenon Unveiled, Phys. Rev. X 12 (2022) 021005 [2202.02614].
- (22) S. Leardini, E. Sánchez García, P. Amedo, A. Saa-Hernández, D. González-Díaz, R. Santorelli et al., Time and band-resolved scintillation in time projection chambers based on gaseous xenon, Eur. Phys. J. C 82 (2022) 425 [2112.04750].
- (23) V. Álvarez, F.I.G. Borges, S. Cárcel, S. Cebrián, A. Cervera, C.A.N. Conde et al., Ionization and scintillation response of high-pressure xenon gas to alpha particles, J. Instrum. 8 (2013) P05025 [1211.4508].
- (24) M. Saito, T. Nishikawa and M. Miyajima, Electric field dependence of luminescence due to alpha particles in gaseous xenon and the energy expended per photon, IEEE Trans. Nucl. Sci. 51 (2004) 2125.
- (25) L.M.P. Fernandes, E.D.C. Freitas, M. Ball, J.J. Gomez-Cadenas, C.M.B. Monteiro, N. Yahlali et al., Primary and secondary scintillation measurements in a xenon Gas Proportional Scintillation Counter, J. Instrum. 5 (2010) P09006 [1009.2719].
- (26) S.J.C. do Carmo, F.I.G.M. Borges, F.P. Santos, T.H.V.T. Dias and C.A.N. Conde, Absolute primary scintillation yield of gaseous xenon under low drift electric fields for 5.9 keV X-rays, J. Instrum. 3 (2008) P07004.
- (27) A.M.F. Trindade, J. Escada, M.R. Silva, A.P. Marques, F.I.G.M. Borges and F.P. Santos, Absolute primary scintillation yield in gaseous xenon and in xenon – trimethylamine mixtures, Nucl. Instrum. Meth. A 1049 (2023) 168038.
- (28) A. Parsons, T.K. Edberg, B. Sadoulet, S. Weiss, J. Wilkerson, K. Hurley et al., High pressure gas scintillation drift chambers with wave-shifter fiber readout, IEEE Trans. Nucl. Sci. 37 (1990) 541.
- (29) J. Renner, V.M. Gehman, A. Goldschmidt, H.S. Matis, T. Miller, Y. Nakajima et al., Ionization and scintillation of nuclear recoils in gaseous xenon, Nucl. Instrum. Meth. A 793 (2015) 62 [1409.2853].
- (30) K. Saito, S. Sasaki, H. Tawara, T. Sanami and E. Shibamura, Simultaneous measurements of absolute numbers of electrons and scintillation photons produced by 5.49-Mev alpha particles in rare gases, IEEE Trans. Nucl. Sci. 50 (2003) 2452.
- (31) A.A. Abud, B. Abi, R. Acciarri, M.A. Acero, M.R. Adames, G. Adamov et al., A Gaseous Argon-Based Near Detector to Enhance the Physics Capabilities of DUNE, preprint arXiv:2203.06281 (2022) .
- (32) “SAES, st 707 pills and pieces.” https://www.saesgetters.com/products-functions/products/getters/non-evaporable-getters/pills-pieces.
- (33) J. Keränen, J. Pippuri, M. Malinen, J. Ruokolainen, P. Råback, M. Lyly et al., Efficient parallel 3-d computation of electrical machines with elmer, IEEE Transactions on Magnetics 51 (2015) 1.
- (34) J. Allison et al., Recent developments in GEANT4, Nucl. Instrum. Meth. A 835 (2016) 186.
- (35) C.M. Poole, I. Cornelius, J.V. Trapp and C.M. Langton, A CAD interface for GEANT4, Australas. Phys. Eng. Sci. Med. 35 (2012) 329.
- (36) I.H. Malitson, Interspecimen Comparison of the Refractive Index of Fused Silica, J. Opt. Soc. Am. 55 (1965) 1205.
- (37) A. Baldini, C. Bemporad, F. Cei, T. Doke, M. Grassi, T. Haruyama et al., Liquid xenon scintillation calorimetry and Xe optical properties, IEEE Trans. Dielectr. Electr. Insul. 13 (2006) 547.
- (38) S. Bricola, A. Menegolli, M. Prata, M.C. Prata, G.L. Raselli, M. Rossella et al., Noble-gas liquid detectors: measurement of light diffusion and reflectivity on commonly adopted inner surface materials, Nucl. phys. B Proc. suppl. 172 (2007) 260.
- (39) G.B. Irani, T. Huen and F. Wooten, Optical constants of silver and gold in the visible and vacuum ultraviolet, J. Opt. Soc. Am. 61 (1971) 128.
- (40) A. Roos, C.G. Ribbing and B. Karlsson, Stainless steel solar mirrors – A material feasibility study, Sol. Energy Mater. 18 (1989) 233.
- (41) C. Silva, J. Pinto da Cunha, A. Pereira, V. Chepel, M.I. Lopes, V. Solovov et al., Reflectance of polytetrafluoroethylene for xenon scintillation light, J. Appl. Phys. 107 (2010) 064902.
- (42) C.F.P. Silva, Reflection Distribution of the Fluoropolymers for the Xenon Scintillation Light, Ph.D. thesis, University of Coimbra, 2010.
- (43) “Accuratus, MACOR Machinable Glass Ceramic Optical Properties.” http://accuratus.com/macorprps5.html.
- (44) “S. Biagi, Degrad – Cluster size distribution and primary cluster distribution in gas mixtures for minimum ionising particles and X-rays.” http://degrad.web.cern.ch/degrad.
- (45) “H. Schindler, Garfield++ – Simulation of Tracking Detectors.” https://garfieldpp.web.cern.ch/garfieldpp.
- (46) “S. Biagi, Magboltz – transport of electrons in gas mixtures.” https://magboltz.web.cern.ch/magboltz.
- (47) C.H. Faham, V.M. Gehman, A. Currie, A. Dobi, P. Sorensen and R.J. Gaitskell, Measurements of wavelength-dependent double photoelectron emission from single photons in VUV-sensitive photomultiplier tubes, J. Instrum. 10 (2015) P09010 [1506.08748].
- (48) C.D.R. Azevedo, D. González-Díaz, S.F. Biagi, C.A.B. Oliveira, C.A.O. Henriques, J. Escada et al., Microscopic simulation of xenon-based optical TPCs in the presence of molecular additives, Nucl. Instrum. Meth. A 877 (2018) 157 [1705.09481].
- (49) C.A.O. Henriques, E.D.C. Freitas, C.D.R. Azevedo, D. González-Díaz, R.D.P. Mano, M.R. Jorge et al., Secondary scintillation yield of xenon with sub-percent levels of CO2 additive for rare-event detection, Phys. Lett. B 773 (2017) 663 [1704.01623].
- (50) C.A.O. Henriques, C.M.B. Monteiro, D. González-Díaz, C.D.R. Azevedo, E.D.C. Freitas, R.D.P. Mano et al., Electroluminescence TPCs at the Thermal Diffusion Limit, J. High Energy Phys. 01 (2019) 027 [1806.05891].
- (51) P. Moutard, P. Laporte, J.L. Subtil, N. Damany and H. Damany, Pressure effects on kinetics and decay processes in xenon after selective photoexcitation, J. Chem. Phys. 88 (1988) 7485.
- (52) K. Tamagake, D.W. Setser and J.H. Kolts, Interpretations of XeI and XeBr bound–free emission spectra and reactive quenching of Xe (3P2) atoms by bromine and iodine containing molecules, J. Chem. Phys. 74 (1981) 4286.
- (53) J. Balamuta and M.F. Golde, Formation of electronically excited oxygen atoms in the reactions of argon (3P0, 2) and xenon (3P2) atoms with oxygen molecules, J. Phys. Chem. 86 (1982) 2765.
- (54) S.J.C. do Carmo, F.I.G.M. Borges, F.L.R. Vinagre and C.A.N. Conde, Experimental Study of the -Values and Fano Factors of Gaseous Xenon and Ar-Xe Mixtures for X-Rays, IEEE Trans. Nucl. Sci. 55 (2008) 2637.
- (55) C.M.B. Monteiro, L.M.P. Fernandes, J.A.M. Lopes, L.C.C. Coelho, J.F.C.A. Veloso, J.M.F. dos Santos et al., Secondary Scintillation Yield in Pure Xenon, J. Instrum. 2 (2007) P05001 [physics/0702142].
- (56) “R. D. P. Mano, Private communication.”