XXXX-XXXX
Radiopurity of NaI(Tl) crystals for PICOLON dark matter experiment
Abstract
The dark matter observation claim by the DAMA/LIBRA collaboration has been a long-standing puzzle within the particle physics community. Efforts of other research groups to verify the claim have been insufficient by significant radioactivity of present NaI(Tl) crystals. PICOLON (Pure Inorganic Crystal Observatory for LOw-energy Neut(ra)lino) experiment conducts independent search for Weakly Interacting Massive Particles (WIMPs) using NaI(Tl) crystals. Our NaI(Tl) crystal manufactured in 2020 (Ingot #85) reached the same purity level as DAMA/LIBRA crystals. In this report, we describe the radiopurity of the new Ingot #94 crystal produced using the same purification technique as Ingot #85. The -ray events were selected by pulse-shape discrimination method. The impurities in the Ingot #94, 232Th , 226Ra and 210Po radioactivity were , , and , which are equivalent to those of the DAMA/LIBRA crystals. The background rate in the energy region of 2–6 , was 2–5 without applying a veto trigger.
F40, F41
1 Introduction
1.1 Present status of dark matter search
Dark matter (DM) is one of the important subjects in both cosmology and particle physics. Observations of the cosmic microwave background have shown that the DM accounts for 26.4% of the total energy density of the universe refId0A ; refId0B . A new physics theory beyond the Standard Model has to be developed. We expect that direct detection of DM may accelerate the progress on the theoretical front as well. Weakly Interacting Massive Particles (WIMPs) remain one of the most important candidates for DM. Lighter WIMPs on the order of sub-GeV have recently been proposed making low-energy, low-background detectors essential for WIMP searches 10.1093/ptep/ptac097 .
At present, the most sensitive DM detector in the world is the XENONnT experiment using 8.5 tons of liquid Xe xenon2023dark . Attempts to verify annual modulation of the signal using NaI(Tl) detectors led to contradiction results. The annual modulation of the signal reported by the DAMA/LIBRA group 10.21468/SciPostPhysProc.12.025 has not been confirmed by other groups operating similar NaI(Tl) detectors. As it stands, the ANAIS group ruled out the possibility of annual modulation ANAIS2021Modulation , while the COSINE group reported annual modulation in the opposite phase Adhikari2023 through DAMA-like analysis. It is essential to mention that concentrations of impurities causing the background at the region of interest were high for all experiments exploiting NaI(Tl) detectors. Even the DAMA/LIBRA experiment, that reported the highest sensitivity with NaI(Tl) detectors, has background about 6 orders of magnitude higher than those of the XENONnT experiment.
1.2 PICOLON experiment
The main background (BG) sources in NaI(Tl) crystals are 40K (natK), 232Th (Th-series), 226Ra and 210Pb (U-series). In particular, 40K and 232Th are the main BG contributors at energies below 100 , where is an observed energy that is calibrated by electron energy.
| RIs | DAMA/LIBRA | COSINE | ANAIS-112 | SABRE | Ingot #85 | Our goal |
|---|---|---|---|---|---|---|
| BERNABEI2008297 | COSINE2020Clystals | ANAIS2021Modulation ; ANAIS2019Clystal | SABRE2205 ; SABRENaITl2022 | fushimi2021development | ||
| natK [] | – | |||||
| 232Th [] | 1.21.4 | |||||
| 226Ra [] | 134 | |||||
| 210Pb [] | 5.7 | |||||
| BG rate (dru) | 1 | 3 | 3.6050.003 | 1.390.02 | – | 1 |
PICOLON (Pure Inorganic Crystal Observatory for LOw-energy Neut(ra)rino) is a project designed for DM search using ultra high-purity NaI(Tl) detectors. Understanding of the nature of annual modulations reported by the DAMA/LIBRA group is one of the PICOLON objectives. Table 1 shows the concentrations of radioactive impurities (RIs) in the NaI(Tl) crystals used by DAMA/LIBRA, COSINE, ANAIS-112, SABRE, and PICOLON experiments. In 2020, we developed a ultra high-purity NaI(Tl) crystal named Ingot #85 using an optimized purification method that includes recrystallization and use of resins. Recently, we produced new NaI(Tl) crystal, called Ingot #94, using the same purification method as for Ingot #85. We will discuss the experimental setup and data acquisition system (DAQ) in Sect. 2. The BG analysis, energy calibration and noise reduction method are explained in Sect. 3.
2 Experimental setup
2.1 Detector and shielding
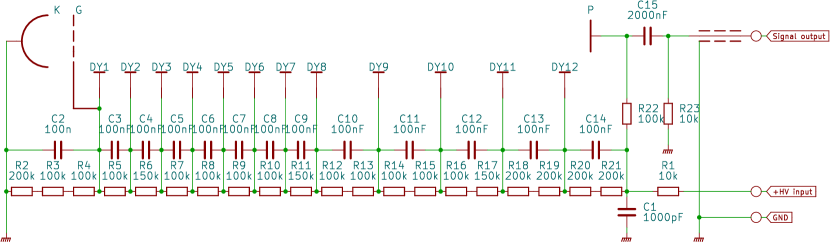
We assembled two detector modules using NaI(Tl) crystals Ingot #85 and #94. The cylindrical crystals have a diameter of 76.2 mm and a length of 76.2 mm. The bottom and side surfaces of the crystals were covered with Enhanced Specular Reflector Films (ESR™) to guide scintillation photons into optical window. The crystal was encapsulated into an acrylic housing and sealed with a 1cm-thick optical window of synthetic quartz. The assembled NaI(Tl) crystal was viewed by a 3-inch low BG Hamamatsu R11065-20 photomultiplier tube (PMT). The voltage divider circuits, for PMTs were optimized to reduce the distortion of large amplitude pulses, as shown in Fig. 1.
The experimental site is located at the KamLAND facility in Kamioka underground laboratory at 2700 m.w.e., where m.w.e. stands for meter water equivalent. Ingots #85 and #94 were installed into the shielding made of 5 cm thick oxygen-free copper blocks and 15 cm thick low-activity lead blocks. The concentration of radon in laboratory air is 20–50 . Therefore, we continuously supplied a pure nitrogen gas into the shield to purge out radon.
2.2 Data acquisition system
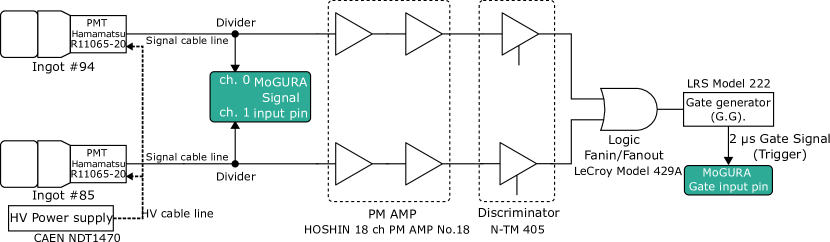
A block diagram of trigger generation and data acquisition (DAQ) system is shown in Fig. 2. Signals from two PMTs produce a trigger for the DAQ without any external veto signal. The logic signals generated from both detectors create a trigger of DAQ. A long gate signal of 2 is supplied to the gate input of MoGURA electronic board MoGURA to avoid a re-triggering.
3 Analysis
3.1 Energy calibration
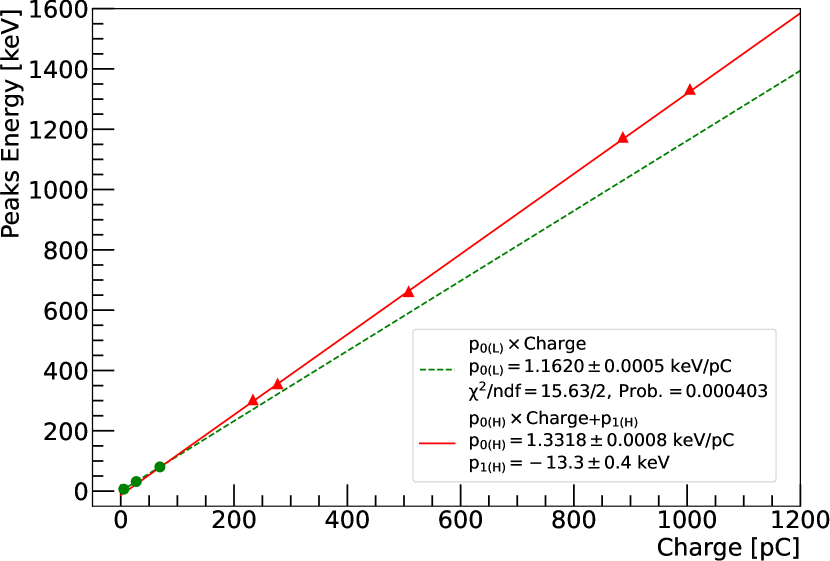
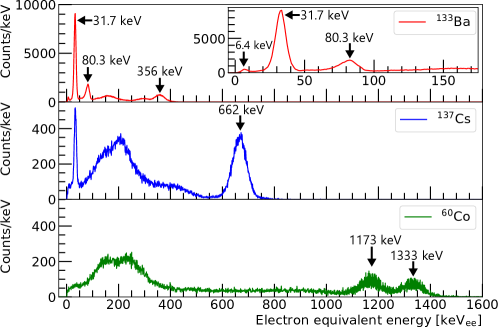
Energy calibration of NaI(Tl) detectors was performed using 133Ba, 137Cs, and 60Co standard sources. Figure 4 shows resulting calibration curves. Due to a non-linearity of a scintillation response in NaI(Tl), we calibrated energy regions below and above 100 keV separately. The region below keV was calibrated using 6.4 keV, 31 keV, and 81 keV peaks from the 133Ba source. The 6.4 keV peak from the 133Ba source is created in a two step process. First, 34.9 or 35.8 keV X-rays from electron capture in 133Ba cause a photoelectric effect on an iodide atom located near the surface of the crystal. Second, the resulting iodine ion emits X-rays (28.6, 28.3 keV) that escape the sodium iodine crystal. As a result, about 6 keV of energy remains inside the NaI(Tl) crystal. The energy region above keV is calibrated using 303 keV and 356 keV gamma lines of 133Ba, and gamma lines from 137Cs and 60Co .
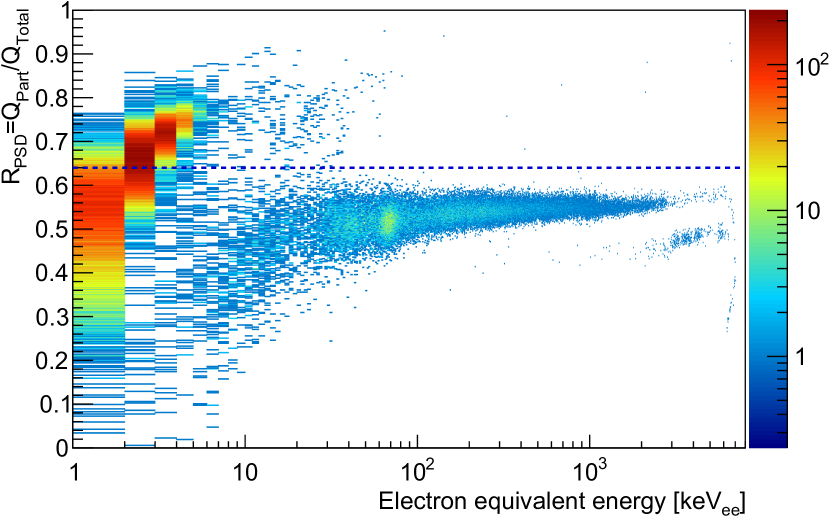
3.2 Pulse-shape discrimination between -rays and -rays
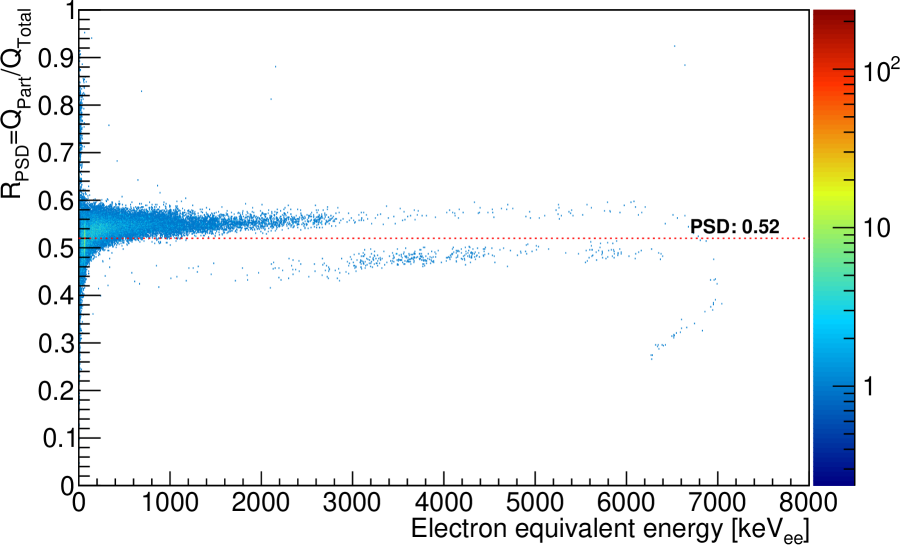
The difference in pulse shapes allows us to discriminate -rays events from those induced by -rays. We applied Pulse Shape Discrimination (PSD) to distinguish events caused by -ray from all other events. Figure 8 shows a typical pulses of -rays and -rays Kotera2023picolon . The pulse-shape parameter named is defined as a ratio of integrated currents over two different time windows after the pulse starts:
| (2) |
where is the current pulse, and are the integrated charges over two different time intervals since pulse start: [0 ns, 1200 ns] for , [200 ns, 1200 ns] for .
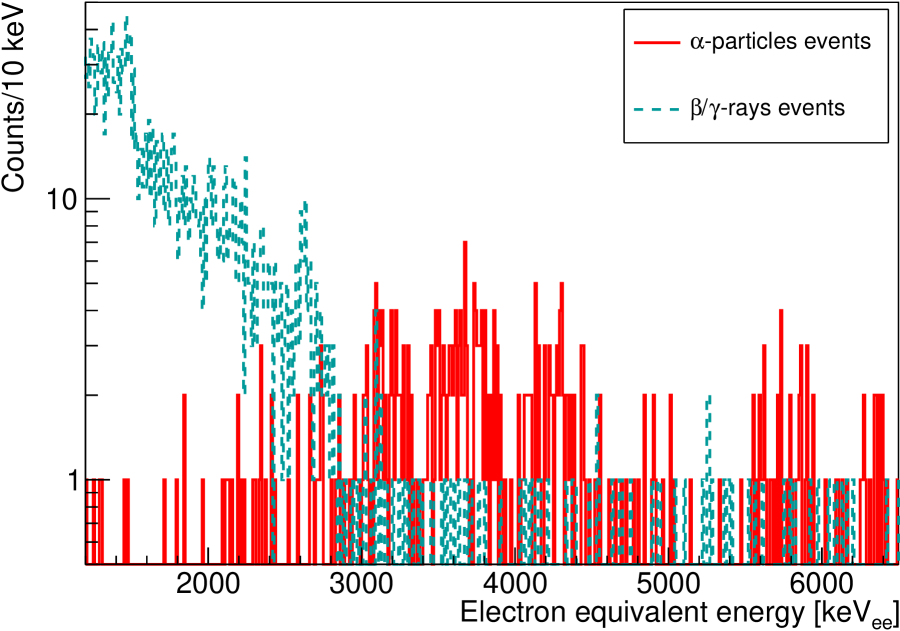
Figure 8 shows the scatter plot of the electron equivalent energy versus . We selected a threshold to be 0.52 to achieve a clear separation between -rays and -ray events. The resulting spectra of the -rays events and -rays events shown in Fig. 8 after applying the PSD selection cut. The PSD selection is valid in the region between 1200 to 6000 where -ray events do not mix with the -ray events spectrum.

3.3 Low energy region analysis
To search for DM, we need to remove noise events in the low energy region below 100 . The Cherenkov radiation and dark current in PMTs generate a large number of noise pulses. We use two noise reduction methods: a single noise reduction to separate single-pulse noise from scintillation pulses; and the PSD noise reduction to remove noise events below 10 .
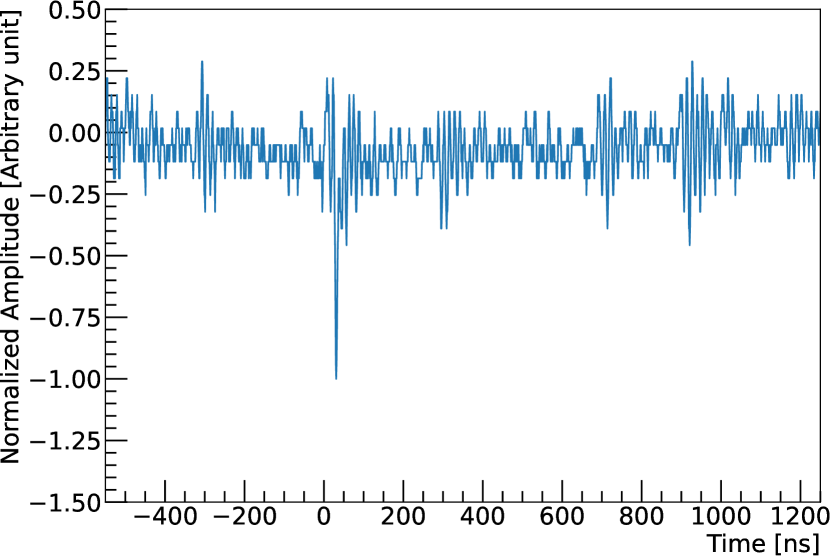
3.3.1 Single pulse noise reduction
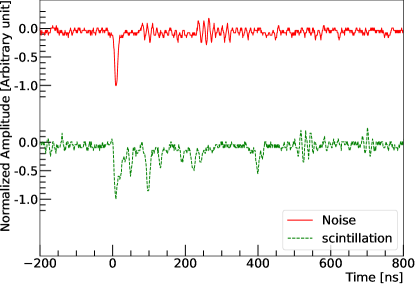
Figure 9 shows typical noise and scintillation pulses. The noise waveform consists of a single pulse followed by no pulse after 200 ns. In contrast, the scintillation signal consists of many pulses spread over the scintillation decay time. Therefore, the scintillation events are discriminated from all events using the timing window ns after the first pulse, where is the time difference between two single pulses.
3.3.2 PSD noise reduction
We applied a simple noise threshold to the PSD scatter plot in Fig. 8 to reject PMT noise events below 10 . A magnified part of the Fig. 8 is shown in Fig. 11 using a logarithmic scale. One can see two clearly separated event distributions below 100 . We investigated noise events with energy lower than 100 and . A typical waveform for such events is shown in Fig. 11, confirming that those events are noise pulse from PMTs. In addition, Noise signals from VME bus traffic and power lines cause the baseline instability. Consequently, the increases and we can remove these events from Fig. 11. Figure 12 shows the energy spectrum before and after applying two reduction methods. The effect of noise reduction is clearly seen. However, we have to admit that the peak around 3 is caused by insufficiency of the simple PSD reduction methods.
4 Result
4.1 Concentration of radioactive impurities in Ingot #94
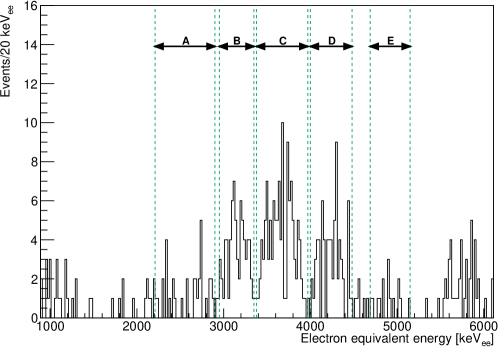
We extracted -rays by PSD analysis. The energy spectrum of -rays is shown in Fig. 13. We found 5 prominent peaks between 3000 and 6000 , which consist of -rays from U-series and Th-series. We analyzed each RI in the prominent peaks as shown in Table 2. Closely located peaks are combined into one peak. For example, two peaks (index A in Table 2) of 238U (U-series) and 232Th (Th-series) cannot be resolved due to the low energy resolution.
| Index | RIs | Energy Range [] | Events |
|---|---|---|---|
| A | 238U(U)+232Th(Th) | 2210–2900 | 336 |
| B | 234U(U)+230Th(U)+226Ra(U) | 2950–3350 | 729 |
| C | 228Th(Th)+224Ra*(Th)+222Rn(U)+210Po(U) | 3380–3970 | 11811 |
| D | 218Po(U)+212Bi(Th)+224Ra*(Th) + 220Rn(Th) | 4000–4480 | 719 |
| E | 216Po(Th) | 4690–5150 | 154 |
The RI concentration [Bq/kg] was calculated using the formula
| (3) |
where and are number of RI events and statistical error, is livetime and is the mass of NaI(Tl) crystal. For the Ingot #94, the exposure is . The concentrations of RI are shown in Table 3.
| RI | Ingot #94 | Our goal | DAMA/LIBRA BERNABEI2008297 |
|---|---|---|---|
| 232Th [] | 4.61.2 | ||
| 226Ra [] | 7.94.4 | ||
| 210Pb [] | 196 |
The NaI(Tl) crystal Ingot #94 was confirmed to be highly radiopure with RI activity equivalent to DAMA/LIBRA crystals.
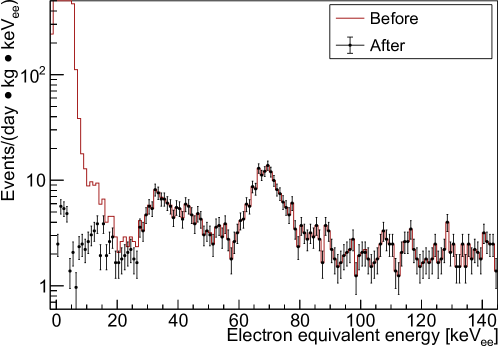
4.2 The low energy region
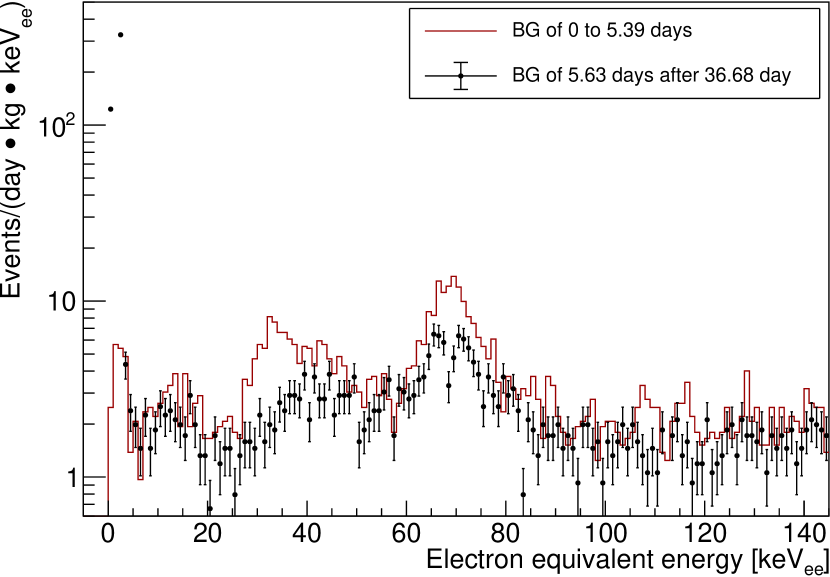
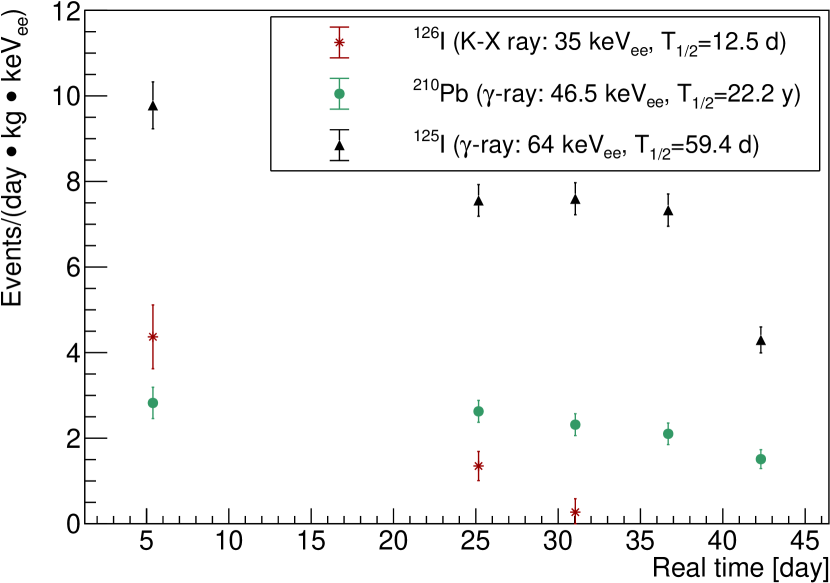
There were many intense peaks from 126,125I, 210Pb and 40K below 100 . We investigated temporal variation of the BG at low energies. Figure 15 shows the variation of some peaks 126I (35 keV X-ray, half-time d), 210Pb (46.5 keV -ray, y) and the 125I (64 keV -ray, d) energy spectrum (red histogram) . The iodine peaks quickly diminished after 42.31 days of data taking (black histogram). The temporal variation of the BG rate is shown in Fig. 15. The spectra were fitted to the three peaks composed of superposition of three Gaussians and constant terms. Although, we have no data from 7.4 to 21.4 days due to a HV hardware malfunction, we obtained a clear time dependence of the BG rate.
5 The detector sensitivity
The expected sensitivity of the Ingot #94 detector in the absence of the annual modulation was estimated from the BG spectra.
| Energy region | BG rate | Upper limit of BG error |
|---|---|---|
| [] | [] | |
| (all) | 0.94 | |
| (noisy) | 0.94 | |
| (not noisy) | 0.80 | |
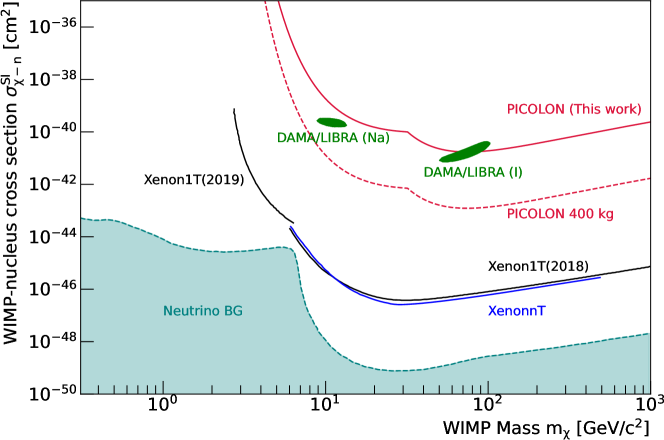
A flat BG was assumed for the first 5.4 days of the BG spectra (red line spectra in Fig. 15), because the BG decreases with time, conversely there is an excess of events due to noise around 3 . The flat background is calculated for three energy regions as shown in Table 4. The sensitivity of the Ingot #94 detector is calculated using the [4, 6] (not noisy) BG rate. From the flat BG, the expected event rate was calculated to obtain an upper limit of 90% C.L. with Poisson statistics. Figure 16 shows the sensitivity to spin-independent (SI) DM interaction for Ingot #94 (red solid line). The solid red line is the upper limit of BG for the Ingot #94 crystal that partially covers the search region of the DAMA/LIBRA experiment. The red dashed line is a simulation of the case where 400 kg of NaI(Tl) crystals with BG equivalent to Ingot #94 are prepared and measured for one year, which completely covers the search of the DAMA/LIBRA experiment.
6 Summary and remarks
We have developed high-purity NaI(Tl) crystals with the radiopurity similar to that of the DAMA/LIBRA crystals, and confirmed the reproducibility of the crystal purification method. A BG reduction of about one order of magnitude would be necessary for verification of the DAMA/LIBRA result, which is one of the objectives of the PICOLON project. The present detector is comparable sensitivity to the DAMA/LIBRA crystals. We will construct a DM search apparatus that is able to cover the DAMA/LIBRA DM search area using 400 kg ultra high-purity NaI(Tl) crystals with a BGs similar to those of the Ingot #94 crystal Kfushimi2023picolon . We will also optimize the BG and noise reduction methods.
Acknowledgments
This work was supported by JSPS KAKENHI (Grant Nos.: 26104008, 19H00688, and 20H05246), a discretionary expense of the president of Tokushima University, and the World Premier International Research Center Initiative (WPI Initiative).
References
- (1) N. Aghanim et al., A&A, 641, A1 (2020).
- (2) N. Aghanim et al., A&A, 641, A6 (2020).
- (3) R. L. Workman et al., PTEP, 2022(8), 083C01 (2022).
- (4) E. Aprile et al., Phys. Rev. Lett., 131, 041003 (2023).
- (5) R. Bernabei et al., SciPost Phys. Proc., page 025 (2023).
- (6) J. Amaré et al., Phys. Rev. D, 103, 102005 (2021).
- (7) G. Adhikari et al., Scientific Reports, 13, 4676 (2023).
- (8) R. Bernabei et al., Nucl. Insr. and Methods in Phys. Res. Sect. A, 592(3), 297–315 (2008).
- (9) B. J. Park et al., Eur. Phys. J. C, 80, 814 (2020).
- (10) J. Amaré et al., Eur. Phys. J. C, 79, 412 (2019).
- (11) F. Calaprice et al., Eur. Phys. J. C, 82, 1158 (2022).
- (12) A. Mariani et al., Journal of Physics: Conference Series, 2156, 012022 (2022).
- (13) K. Fushimi et al., PTEP, 2021(4), 043F01 (2021).
- (14) A. Terashima et al., Journal of Physics: Conference Series, 120, 052029 (2008).
- (15) K. Kotera et al., KEK Proceedings, Radiation Detectors and Their Uses, 37th Workshop (to be published, in Japanese) (2023).
- (16) E. Aprile et al., J. Cosmol. Astropart. Phys., 2016(04), 027 (2016).
- (17) K. Fushimi et al., KEK Proceedings, Radiation Detectors and Their Uses, 37th Workshop (to be published) (2023).