The - Transition in Solid Oxygen
Abstract
The structure of solid oxygen has been studied at pressures from 50 to 140 GPa using static structure search methods and molecular dynamics simulations with density functional theory and a hybrid exchange functional. Several crystalline structures with space group symmetries Pnma, P 21/m, Pm and P 63/mmc have been identified as candidates for the phase of oxygen at 0 K. Within the hybrid exchange functional framework and at 300 K temperature, Pm is shown to be energetically most favorable above 111 GPa. A comparison with experimental X-ray diffraction, spectroscopic and superconductivity measurements is provided for all competing structures.
Oxygen is in many ways a unique element: fundamental, abundantly available on Earth, and the only known diatomic molecule that carries a magnetic moment Lundegaard et al. (2006). Its phase diagram is a good example of the abundance of interesting physical properties, which emerge under compression. Multiple phases have been discovered at low pressure, including the and phases Freiman et al. (2018); Akahama et al. (1995); Freiman and Jodl (2004); Lundegaard et al. (2006); Hörl (1962); LeSar and Etters (1988); Lundegaard et al. (2009); Meier and Helmholdt (1984); Schiferl et al. (1983); Gorelli et al. (2002); Goncharenko et al. (2004); Desgreniers et al. (1990); Shimizu et al. (1998); Zhu et al. (2012); Nomura et al. (2014); Militzer et al. (2003), which are molecular and the structural differences among them are in the relative arrangements of the O2 molecules. At room temperature, solid oxygen exists in the non-magnetic Chavez et al. (2005) insulating phase between 10 GPa and 96 GPa Fujihisa et al. (2006); Lundegaard et al. (2006), above which it undergoes an insulator-to-metal transformation to the phase Akahama et al. (1995). The latter transition appears to be gradual and completed by 110 GPa Weck et al. (2002).
The -phase, which remains stable across a wide range of pressures, has attracted a lot of interest, encompassing both theoretical investigations Meng et al. (2008); Serra et al. (1998); Gebauer et al. (2000); Neaton and Ashcroft (2002); Elatresh (2015); Elatresh and Bonev (2013); Anh et al. (2019); Ochoa-Calle et al. (2015a, b, c); Ramirez-Solis et al. (2017) and experimental examinations employing X-ray diffraction Johnson et al. (1993); Akahama et al. (1995); Weck et al. (2002); Fukui et al. (2019) and spectroscopic measurements Akahama and Kawamura (1996); Gorelli et al. (1999); Akahama and Kawamura (2000); Agnew et al. (1987); Akahama et al. (2019). Powder Fujihisa et al. (2006); Akahama et al. (1995) and single-crystal Weck et al. (2002) X-ray diffraction studies indicated that the phase has a monoclinic C 2/m symmetry with a primitive cell with a single O8 cluster consisting of four molecules. A theoretical GW analysis of the phase reported that the structural transformation to is accompanied by an insulator-metal transition at 51.7 GPa Kim et al. (2008) while a later GW study suggested a transition pressure of about 100 GPa Tse et al. (2008).
Although the structure of the phase is experimentally known Lundegaard et al. (2006); Fujihisa et al. (2006); Meng et al. (2008), that of the phase remains a subject of continued debate. Raman measurements Goncharov et al. (2003) demonstrated that the phase is molecular with at least four pairs in the primitive unit cell, while conductivity data Shimizu et al. (1998) suggested superconductivity below 0.6 K. Although powder X-ray diffraction Akahama et al. (1995), and single-crystal X-ray and Raman studies Weck et al. (2009) proposed the structure of -O2 to be monoclinic with symmetry C 2/m (hereafter referred to as -C 2/m to distinguish it from -C 2/m, which we will refer to as -O8), Raman and single-crystal X-ray diffraction experiments Weck et al. (2002); Goncharov et al. (2003) seemed to imply that the and phases are not isostructural. Ab initio crystal structure prediction methodology Ma et al. (2007) performed within the generalized gradient approximation (GGA) to density dunctional theory (DFT) also proposed the structure of -O2 to be C 2/m. However, several discrepancies exist between the theoretical predictions and experimental data.
We recall that the lowest-enthalpy structure for the phase was initially predicted to be Cmcm and not the experimentally determined O8 (-C 2/m). In addition, DFT calculations within GGA initially suggested that the - transition occurs at approximately 40 GPa, in contrast to the experimental value of 96 GPa. These discrepancies were recently resolved by independent theoretical studies Elatresh and Bonev (2020); Ochoa-Calle et al. (2015d, b); Ramírez-Solís et al. (2018) where the researchers emphasized the significance of employing accurate exchange-correlation (XC) functionals beyond the GGA.
The present study is focused on the - transition and determining the structure of the phase. Several new candidate structures for the phase are found using the Universal Structure Predictor Evolutionary Xtallography (USPEX) code Oganov and Glass (2006); Glass et al. (2006); Oganov et al. (2006); Lyakhov et al. (2010); Oganov et al. (2011); Lyakhov et al. (2013). In light of the the recent studies Elatresh and Bonev (2020); Ochoa-Calle et al. (2015d, b); Ramírez-Solís et al. (2018) elucidating the importance of using accurate exchange-correlation functionals, we have performed hybrid exchange calculations within the Heyd-Scuseria-Ernzerhof approximation (HSE06) Heyd et al. (2006). Based on them, a new, HSE06-modified phase diagram is proposed. Furthermore, molecular dynamics simulations of the candidate structures are performed and their HSE06-corrected Gibbs free energies computed for a final relative stability ordering of the candidate structures.
Electronic structure calculations and structural relaxations were performed within DFT using the Vienna ab initio simulation package (VASP) Kresse and Hafner (1993); Kresse and Furthmüller (1996). The generalized gradient approximation (GGA) along with projector augmented Wave (PAW) Perdew-Burke-Ernzerhof (PBE) pseudopotential in which the 2s22p4 states were treated as valence states with a core radius of 1.1 a.u. was employed Kresse and Joubert (1999); Perdew et al. (1996). The geometry was optimized using the conjugate gradient algorithm. The Brillouin zone (BZ) -point sampling was performed with the Monkhorst–Pack scheme Monkhorst and Pack (1976). The electronic density-of-states (DOS) was calculated on a 202020 grid in the BZ by the tetrahedron method with Blöchl corrections Blöchl et al. (1994). Raman modes were calculated by density functional perturbation theory as implemented in the ABINIT package Gonze et al. (2009).
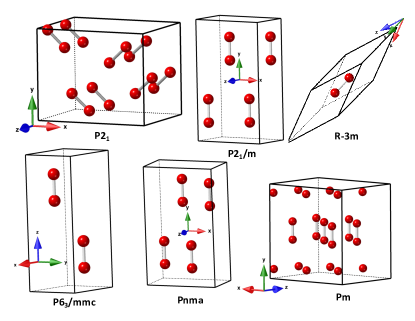
Search for new structures were conducted for 16 and 24 atoms at 35 GPa and 150 GPa using the USPEX code Oganov and Glass (2006); Glass et al. (2006); Oganov et al. (2006); Lyakhov et al. (2010); Oganov et al. (2011); Lyakhov et al. (2013). In each case, starting from an initial population of 50 random structures, variable-cell relaxation was performed by VASP using a cutoff energy of 800 eV, a 444 Monkhorst-Pack grid and Methfessel-Paxton smearing Methfessel and Paxton (1989) with a width of 0.1 eV. In addition to several of the lowest-enthalpy structures that automatically moved on to the next generation, 70% of each generation was used to create the next generation by hereditary and mutation. After over 30 generations, the lowest-enthalpy structures (Fig. 1) were further relaxed with an energy cutoff of 1000 eV, denser BZ sampling grids (listed for each structure in the caption of Fig. 2(a)), and force convergence requirement of 1 meV/. Based on convergence tests, these parameters were sufficient to converge the total PBE energies to better than 1 meV/atom.
It is well know that GGA (DFT) underestimates the electronic band gap. Therefore, the HSE06 functional Heyd et al. (2006) was employed to describe the molecular and electronic properties of solid oxygen. The electron correlation interaction and the long-range part of the exchange interaction were maintained at the PBE level while 25% of Hartree-Fock exact exchange and 75% of the PBE exchange were combined to form the short-range part of the electron-electron exchange interaction. To carry out the demanding HSE06 calculations within a reasonable time, the number of k-points were lowered (see Fig. 2(b) caption), which introduced an estimated error of 2 meV/atom in the calculated energy values.
The space groups of the new structures were identified with the FINDSYM code Stokes and Hatch (2005). Powder X-ray diffraction patterns were simulated by PowderCell Kraus and Nolze (1996). Using VASP, constant volume molecular dynamics simulations were performed on P 21/m, Pnma, Pm, -C 2/m and P 63/mmc with PBE pseudopotential and Nosé-Hoover Nosé (1984); Hoover (1985) thermostat at 116 GPa and 140 GPa at 300 K. The simulation supercells contained 192 atoms for Pm with -point sampling and 64 atoms for the other four structures with 222 BZ sampling grids. In addition, a supercell of 48 atoms for Pm with a 222 BZ grid was included. A cutoff energy of 1000 eV and an integration time step of 0.75 fs were used.
Note that theoretical generation of the -O8 structure above 50 GPa using the PAW method implemented in VASP is impossible, as the structure spontaneously converts to the metallic -C 2/m Ma et al. (2007). In the present work, -O8 between 30 and 140 GPa is constructed by restricting the electronic occupancies so that the lowest 24 electronic bands remain occupied, thus ensuring that -O8 remains a semiconductor. We have confirmed that the HSE06-relaxed -O8 remains a semiconductor up to 107 GPa at 0 K (see plots of the electron bands structure computed within PBE and HSE in Supplementary Material, Fig. S1 (a) & (b)). At finite temperature, band broadening due to the atomic motion should lead to gap closure at lower pressure, in better agreement with the experimental value of 96 GPa Akahama et al. (1995) measured at room temperature.
In addition to the previously suggested C 2/m and C 2/c candidate structures for the phase Ma et al. (2007), our structure searches yield several new candidates, namely, R -3m, P 63/mmc, Cmcm, P 21, Pnma, P 21/m, and Pm (Fig. 1). Their lattice parameters are reported in the Supplemental Material Table I. The first three structures are unlikely candidates for the phase because their primitive cells have bases of only two and four atoms, which are insufficient to account for the measured Raman mode mupltiplicities Goncharov et al. (2003). The remaining structures consist of 16, 8, 8, and 24 atoms, respectively.
Figure 2(a) compares the PBE enthalpies of the generated phases of oxygen with USPEX. As noted by Ma et al. Ma et al. (2007), C 2/m is the dominant structure at the pressures considered here. However, the enthalpy differences between Pnma, P 21/m, Pm, and C 2/c are less than 1 meV/atom. The discontinuity in the enthalpy curve of Cmcm is due to a transition to another structure with the same space group, Cmcm, above 90 GPa, as seen in the discontinuity of its lattice parameters at this pressure (see Fig. S2). All these structures are molecular with O2 bond distance of about 1.18 Å and the differences among them are in the relative arrangement of the molecules (see Fig.’s S3 to S8 for neighbor distance distribution analysis). Furthermore, all candidate structures for the phase are metallic, which is consistent with the experimental observation Akahama et al. (1995). Their electronic properties were evaluated at 0 K (see electronic DOS at 140 GPa in Fig. S9) and for the P 21/m, Pnma, Pm and -C 2/m structures at 300 K and 116 GPa. The latter was done by calculating average DOS over molecular dynamics simulations (see below) and employing the HSE06 functional at the electronic level. In all cases, the electronic band gap is closed.
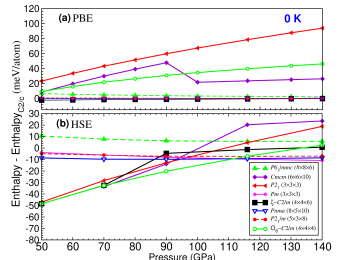
After inclusion of the HSE06 hybrid functional in the geometrical optimization, the relative stability of the candidate structures changes significantly. The modified enthalpy curves are shown in Fig. 2(b). In contrast to the PBE result, -O8 is the energetically preferred structure below 111 GPa, while Pnma and Pm are the lowest-enthalpy structures above this pressure. Within HSE06, the enthalpy of -C 2/m becomes about 9 meV/atom higher than that of both Pnma or Pm at 116 GPa. These are small enthalpy differences, which can be overcome by the phonon free energies even at room temperature.
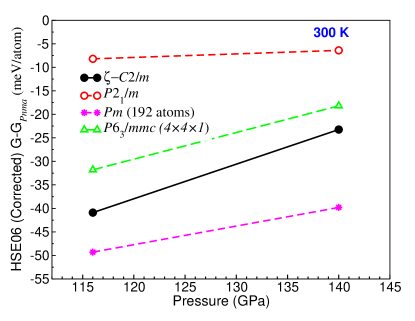
To determine thermodynamic stability at finite temperature, we have performed constant-volume first principles molecular dynamics (FPMD) simulations at densities corresponding to pressures of about 116 and 140 GPa and temperature of 300 K for P 21/m, Pnma, Pm, P 63/mmc and -C 2/m. Equilibrium was established within the first 2 ps of the simulations and data was collected in the following 5 ps. The enthalpies of all structures, , were obtained directly from the FPMD at the level of DFT-PBE, with and as statistical averages of the instantaneous energy and pressure. HSE06 corrections to the enthalpy were then made as , where and are HSE and PBE energies, respectively, of atomic configurations taken from the FPMD trajectories, and indicates statistical average within the PBE-FPMD ensemble. To obtain the Gibbs free energy, , the entropies, , of all structures were computed by integrating their vibrational density of states assuming a harmonic partition function. The vibrational density of states were obtained by Fourier transforming velocity autocorrelation functions from the FPMD trajectories. The relative HSE-corrected Gibbs free energies of the relevant structures are shown in Fig. 3.
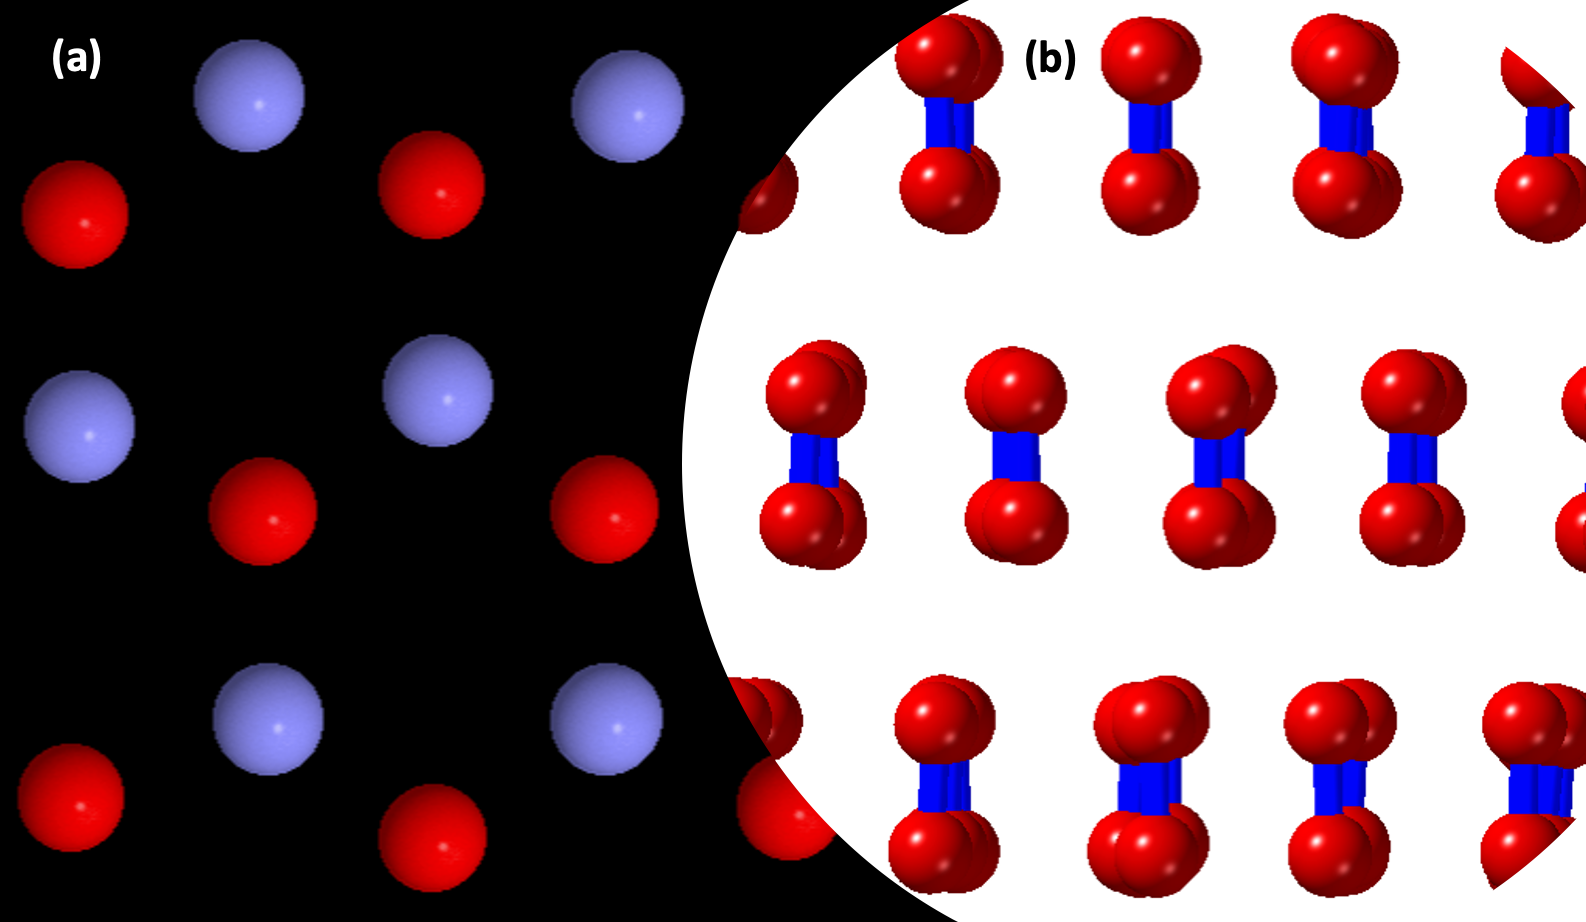
Note that the differences among the Gibbs free energies of the candidate structures are more significant than the 0 K enthalpy differences, which allows us to draw stronger conclusions for their stability. Based on the HSE06-corrected Gibbs free energy data presented in Fig. 3, we conclude that the structure for the phase for oxygen is Pm. The Pm structure has a near hexagonal closed packed (P 63/mmc) symmetry with a 24-atom unit cell with oxygen atoms at the 2c Wyckoff positions. Fig. 4 shows two neighboring basal planes of Pm at 116 GPa. Here a layer is shown in blue and the next one in red; the layers have stacking.
In what follows, we compare properties of the energetically most competitive structures to experimental measurements of -oxygen phase.
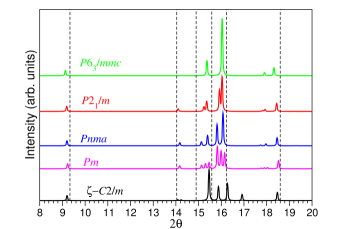
Simulated powder X-ray diffraction patterns for the HSE06-relaxed P 21/m, Pnma, Pm, -C 2/m and P 63/mmc at 116 GPa are shown in in Fig. 5, along with the X-ray peak positions (dashed black lines) from experimental measurements obtained at the same pressure Akahama et al. (1995). The patterns for P 21/m and Pnma are almost identical to each other, as these two structures are nearly isostructural. Previous analysis of X-ray data Akahama et al. (1995); Weck et al. (2009) has suggest that the structure of the phase is monoclinic C 2/m. Additionally, it has been suggested that the experimental peak at 14.9∘ belongs to the phase, as the and coexist from 96 to 128 GPa. However, we see here that all five structures show a reasonable agreement with the experimental data, though none of them matches the data perfectly. The measured Akahama et al. (1995) X-ray peaks between 14∘ and 16∘ are rather broad and overlapping. One can argue that there are multiple peaks in this region, which are difficult to separate, in which case Pm provides the best agreement with the data.
Metallic oxygen in the phase has been found to be superconducting with a measured Shimizu et al. (1998) critical temperature () of 0.6 K. Here we have estimated the values of for the HSE06-relaxed P 21/m, Pnma, Pm, -C 2/m and P 63/mmc structures at 116 GPa. They were calculated using the ABINIT Gonze et al. (2009) package, with the McMillan’s formula Allen and Dynes (1975) and an average electron-electron Coulomb interaction length of 0.136. The estimates for the above phases are 30, 1.6, 6.2, 0.02, and 9.4 K, respectively. The computed for Pnma (1.6 K) and -C 2/m (0.02 K) are closest to the experimental value. However, except for P 21/m, the differences are small and the McMillan formula estimate is insufficient to discriminate among them, while more accurate superconducting calculations are beyond the scope of this paper.
Raman measurements on the phase Goncharov et al. (2003) indicate the presence of (at least) seven optical modes. P 63/mmc has only three Raman active modes. Pnma and -C 2/m cannot account for all Raman modes either (see Fig. S10 in Supplementary Material). Finally, Pm has 69 optical modes, which are both infrared and Raman active. It accounts for all measured Raman peaks, but exhibits extra modes as well. A possible explanation for this seeming discrepancy is that many of the optical modes are too weak to observe experimentally. Similarly to the x-ray data, the Raman peaks in the 400 to 900 cm-1 range are broad and overlapping. This is the frequency region where most of the extra Pm modes are. Thus, another possibility is that individual modes are hard to identify from the available experimental data.
In summary, we have performed first-principles crystal structure searches identifying several new candidate structures for the phase of oxygen. DFT calculations with a hybrid exchange functional (HSE06), which correctly predicts the phase and the insulator-to-metal transition of oxygen at 0 K, significantly alter the relative stability of these structures compared to DFT-GGA. Even bigger effect has the inclusion of finite-temperature effects. The final energetic ordering is established from Gibbs free energies calculated using molecular dynamics simulations performed at room temperature and with HSE06 corrections at the level of thermodynamic perturbation theory. Based on this analysis, the equilibrium structure for the phase of oxygen is a nearly hexagonal close-packed structure with the Pm symmetry and a 24 atom-unit cell. Comparison with available experimental data shows a reasonable agreement with X-ray and Raman measurements – as good, if not better, than that of the previously proposed C 2/m structure. Nevertheless, the agreement is not perfect. Higher resolution measurements will be useful for validating our prediction. A possible difficulty in collecting high quality experimental data probably comes from the presence of a mixed-phase state, as reported in Raman studies Goncharov et al. (2003) in the 96-124 GPa range. Reaching higher pressures could mitigate this problem.
Acknowledgments
S.F.E. and V.A. contributed equally to this work. S.F.E. acknowledges support from King Fahd University of Petroleum and Minerals, Saudi Arabia and the Deanship of Scientific Research through Project No. SR211002. Computational resources were provided by ACEnet and the Canadian Foundation for Innovation. The work at LLNL was performed under the auspices of the U.S. DOE, Contract No. DE-AC52-07NA27344.
Supplementary Information:
Supplementary Information accompanies this
paper at https://journals.aps.org/prl/xxx
References
- Lundegaard et al. (2006) L. F. Lundegaard, G. Weck, M. I. McMahon, S. Desgreniers, and P. Loubeyre, Nature 443, 201 (2006).
- Freiman et al. (2018) Y. Freiman, H. Jodl, and Y. Crespo, Physics Reports 743, 1 (2018), ISSN 0370-1573, solid oxygen revisited, URL http://www.sciencedirect.com/science/article/pii/S0370157318300504.
- Akahama et al. (1995) Y. Akahama, H. Kawamura, D. Häusermann, M. Hanfland, and O. Shimomura, Phys. Rev. Lett. 74, 4690 (1995), URL https://link.aps.org/doi/10.1103/PhysRevLett.74.4690.
- Freiman and Jodl (2004) Y. Freiman and H. Jodl, Physics Reports 401, 1 (2004), ISSN 0370-1573, URL http://www.sciencedirect.com/science/article/pii/S037015730400273X.
- Hörl (1962) E. M. Hörl, Acta Crystallographica 15, 845 (1962), URL https://onlinelibrary.wiley.com/doi/abs/10.1107/S0365110X62002248.
- LeSar and Etters (1988) R. LeSar and R. D. Etters, Phys. Rev. B 37, 5364 (1988), URL http://link.aps.org/doi/10.1103/PhysRevB.37.5364.
- Lundegaard et al. (2009) L. F. Lundegaard, C. Guillaume, M. I. McMahon, E. Gregoryanz, and M. Merlini, The Journal of Chemical Physics 130, 164516 (2009), eprint https://doi.org/10.1063/1.3118970, URL https://doi.org/10.1063/1.3118970.
- Meier and Helmholdt (1984) R. J. Meier and R. B. Helmholdt, Phys. Rev. B 29, 1387 (1984), URL http://link.aps.org/doi/10.1103/PhysRevB.29.1387.
- Schiferl et al. (1983) D. Schiferl, D. T. Cromer, L. A. Schwalbe, and R. L. Mills, Acta Crystallographica Section B 39, 153 (1983), URL http://dx.doi.org/10.1107/S0108768183002219.
- Gorelli et al. (2002) F. A. Gorelli, M. Santoro, L. Ulivi, and M. Hanfland, Phys. Rev. B 65, 172106 (2002), URL http://link.aps.org/doi/10.1103/PhysRevB.65.172106.
- Goncharenko et al. (2004) I. N. Goncharenko, O. L. Makarova, and L. Ulivi, Phys. Rev. Lett. 93, 055502 (2004), URL https://link.aps.org/doi/10.1103/PhysRevLett.93.055502.
- Desgreniers et al. (1990) S. Desgreniers, Y. K. Vohra, and A. L. Ruoff, The Journal of Physical Chemistry 94, 1117 (1990), eprint http://pubs.acs.org/doi/pdf/10.1021/j100366a020, URL http://pubs.acs.org/doi/abs/10.1021/j100366a020.
- Shimizu et al. (1998) K. Shimizu, K. Suhara, M. Ikumo, M. I. Eremets, and K. Amaya, Nature 393, 767 (1998), URL http://dx.doi.org/10.1038/31656.
- Zhu et al. (2012) L. Zhu, Z. Wang, Y. Wang, G. Zou, H.-k. Mao, and Y. Ma, Proceedings of the National Academy of Sciences 109, 751 (2012), eprint http://www.pnas.org/content/109/3/751.full.pdf+html, URL http://www.pnas.org/content/109/3/751.abstract.
- Nomura et al. (2014) T. Nomura, Y. H. Matsuda, S. Takeyama, A. Matsuo, K. Kindo, J. L. Her, and T. C. Kobayashi, Phys. Rev. Lett. 112, 247201 (2014), URL https://link.aps.org/doi/10.1103/PhysRevLett.112.247201.
- Militzer et al. (2003) B. Militzer, F. m. c. Gygi, and G. Galli, Phys. Rev. Lett. 91, 265503 (2003), URL https://link.aps.org/doi/10.1103/PhysRevLett.91.265503.
- Chavez et al. (2005) M. Chavez, D.-U. Hwang, A. Amann, H. G. E. Hentschel, and S. Boccaletti, Phys. Rev. Lett. 94, 218701 (2005), URL https://link.aps.org/doi/10.1103/PhysRevLett.94.218701.
- Fujihisa et al. (2006) H. Fujihisa, Y. Akahama, H. Kawamura, Y. Ohishi, O. Shimomura, H. Yamawaki, M. Sakashita, Y. Gotoh, S. Takeya, and K. Honda, Phys. Rev. Lett. 97, 085503 (2006), URL http://link.aps.org/doi/10.1103/PhysRevLett.97.085503.
- Weck et al. (2002) G. Weck, P. Loubeyre, and R. LeToullec, Phys. Rev. Lett. 88, 035504 (2002), URL http://link.aps.org/doi/10.1103/PhysRevLett.88.035504.
- Meng et al. (2008) Y. Meng, P. J. Eng, J. S. Tse, D. M. Shaw, M. Y. Hu, J. Shu, S. A. Gramsch, C.-c. Kao, R. J. Hemley, and H.-k. Mao, Proceedings of the National Academy of Sciences 105, 11640 (2008), eprint http://www.pnas.org/content/105/33/11640.full.pdf+html, URL http://www.pnas.org/content/105/33/11640.abstract.
- Serra et al. (1998) S. Serra, G. Chiarotti, S. Scandolo, and E. Tosatti, Phys. Rev. Lett. 80, 5160 (1998), URL http://link.aps.org/doi/10.1103/PhysRevLett.80.5160.
- Gebauer et al. (2000) R. Gebauer, S. Serra, G. L. Chiarotti, S. Scandolo, S. Baroni, and E. Tosatti, Phys. Rev. B 61, 6145 (2000), URL http://link.aps.org/doi/10.1103/PhysRevB.61.6145.
- Neaton and Ashcroft (2002) J. B. Neaton and N. W. Ashcroft, Phys. Rev. Lett. 88, 205503 (2002), URL http://link.aps.org/doi/10.1103/PhysRevLett.88.205503.
- Elatresh (2015) S. Elatresh, Ph.D. thesis, Dalhousie University (2015), URL https://dalspace.library.dal.ca/xmlui/handle/10222/59433.
- Elatresh and Bonev (2013) S. Elatresh and S. Bonev, in APS Shock Compression of Condensed Matter Meeting Abstracts (2013), APS Meeting Abstracts, p. B3.005.
- Anh et al. (2019) L. T. Anh, M. Wada, H. Fukui, T. Kawatsu, and T. Iitaka, Scientific Reports 9, 8731 (2019), ISSN 2045-2322, URL https://doi.org/10.1038/s41598-019-45314-9.
- Ochoa-Calle et al. (2015a) A. J. Ochoa-Calle, C. M. Zicovich-Wilson, R. Hernández-Lamoneda, and A. Ramírez-Solís, Journal of Chemical Theory and Computation 11, 1195 (2015a), pMID: 26579768, eprint https://doi.org/10.1021/acs.jctc.5b00017, URL https://doi.org/10.1021/acs.jctc.5b00017.
- Ochoa-Calle et al. (2015b) A. J. Ochoa-Calle, C. M. Zicovich-Wilson, and A. Ramírez-Solís, Phys. Rev. B 92, 085148 (2015b), URL https://link.aps.org/doi/10.1103/PhysRevB.92.085148.
- Ochoa-Calle et al. (2015c) A. Ochoa-Calle, C. Zicovich-Wilson, and A. Ramírez-Solís, Chemical Physics Letters 638, 82 (2015c), ISSN 0009-2614, URL https://www.sciencedirect.com/science/article/pii/S0009261415006338.
- Ramirez-Solis et al. (2017) A. Ramirez-Solis, C. M. Zicovich-Wilson, R. Hernandez-Lamoneda, and A. J. Ochoa-Calle, PCCP 19, 2826 (2017).
- Johnson et al. (1993) S. W. Johnson, M. Nicol, and D. Schiferl, Journal of Applied Crystallography 26, 320 (1993), URL http://dx.doi.org/10.1107/S0021889892008422.
- Fukui et al. (2019) H. Fukui, L. T. Anh, M. Wada, N. Hiraoka, T. Iitaka, N. Hirao, Y. Akahama, and T. Irifune, Proceedings of the National Academy of Sciences 116, 21385 (2019), ISSN 0027-8424, eprint https://www.pnas.org/content/116/43/21385.full.pdf, URL https://www.pnas.org/content/116/43/21385.
- Akahama and Kawamura (1996) Y. Akahama and H. Kawamura, Phys. Rev. B 54, R15602 (1996), URL http://link.aps.org/doi/10.1103/PhysRevB.54.R15602.
- Gorelli et al. (1999) F. A. Gorelli, L. Ulivi, M. Santoro, and R. Bini, Phys. Rev. Lett. 83, 4093 (1999), URL http://link.aps.org/doi/10.1103/PhysRevLett.83.4093.
- Akahama and Kawamura (2000) Y. Akahama and H. Kawamura, Phys. Rev. B 61, 8801 (2000), URL http://link.aps.org/doi/10.1103/PhysRevB.61.8801.
- Agnew et al. (1987) S. F. Agnew, B. I. Swanson, and L. H. Jones, The Journal of Chemical Physics 86, 5239 (1987), URL http://scitation.aip.org/content/aip/journal/jcp/86/10/10.1063/1.452547.
- Akahama et al. (2019) Y. Akahama, H. Fujihisa, N. Hirao, and Y. Ohishi, Japanese J. App. Phys. 58, 095502 (2019).
- Kim et al. (2008) D. Y. Kim, S. Lebègue, C. M. Araújo, B. Arnaud, M. Alouani, and R. Ahuja, Phys. Rev. B 77, 092104 (2008), URL https://link.aps.org/doi/10.1103/PhysRevB.77.092104.
- Tse et al. (2008) J. S. Tse, D. D. Klug, Y. Yao, and S. Desgreniers, Phys. Rev. B 78, 132101 (2008), URL https://link.aps.org/doi/10.1103/PhysRevB.78.132101.
- Goncharov et al. (2003) A. F. Goncharov, E. Gregoryanz, R. J. Hemley, and H.-k. Mao, Phys. Rev. B 68, 100102 (2003), URL https://link.aps.org/doi/10.1103/PhysRevB.68.100102.
- Weck et al. (2009) G. Weck, S. Desgreniers, P. Loubeyre, and M. Mezouar, Phys. Rev. Lett. 102, 255503 (2009), URL https://link.aps.org/doi/10.1103/PhysRevLett.102.255503.
- Ma et al. (2007) Y. Ma, A. R. Oganov, and C. W. Glass, Phys. Rev. B 76, 064101 (2007), URL http://link.aps.org/doi/10.1103/PhysRevB.76.064101.
- Elatresh and Bonev (2020) S. F. Elatresh and S. A. Bonev, Phys. Chem. Chem. Phys. 22, 12577 (2020), URL http://dx.doi.org/10.1039/C9CP05267D.
- Ochoa-Calle et al. (2015d) A. J. Ochoa-Calle, C. M. Zicovich-Wilson, R. Hernández-Lamoneda, and A. Ramírez-Solís, Journal of Chemical Theory and Computation 11, 1195 (2015d), ISSN 1549-9618, URL https://doi.org/10.1021/acs.jctc.5b00017.
- Ramírez-Solís et al. (2018) A. Ramírez-Solís, A. J. Ochoa-Calle, and R. Hernández-Lamoneda, Theoretical Chemistry Accounts 137, 32 (2018), ISSN 1432-2234, URL https://doi.org/10.1007/s00214-018-2213-4.
- Oganov and Glass (2006) A. R. Oganov and C. W. Glass, The Journal of Chemical Physics 124 (2006), ISSN 0021-9606, 244704, eprint https://pubs.aip.org/aip/jcp/article-pdf/doi/10.1063/1.2210932/13690624/244704_1_online.pdf, URL https://doi.org/10.1063/1.2210932.
- Glass et al. (2006) C. W. Glass, A. R. Oganov, and N. Hansen, Computer Physics Communications 175, 713 (2006), ISSN 0010-4655, URL https://www.sciencedirect.com/science/article/pii/S0010465506002931.
- Oganov et al. (2006) A. R. Oganov, C. W. Glass, and S. Ono, Earth and Planetary Science Letters 241, 95 (2006), ISSN 0012-821X, URL https://www.sciencedirect.com/science/article/pii/S0012821X05006928.
- Lyakhov et al. (2010) A. O. Lyakhov, A. R. Oganov, and M. Valle, Computer Physics Communications 181, 1623 (2010), ISSN 0010-4655, URL https://www.sciencedirect.com/science/article/pii/S0010465510001840.
- Oganov et al. (2011) A. R. Oganov, A. O. Lyakhov, and M. Valle, Accounts of Chemical Research 44, 227 (2011), ISSN 0001-4842, URL https://doi.org/10.1021/ar1001318.
- Lyakhov et al. (2013) A. O. Lyakhov, A. R. Oganov, H. T. Stokes, and Q. Zhu, Computer Physics Communications 184, 1172 (2013), ISSN 0010-4655, URL https://www.sciencedirect.com/science/article/pii/S0010465512004055.
- Heyd et al. (2006) J. Heyd, G. E. Scuseria, and M. Ernzerhof, The Journal of Chemical Physics 124, 219906 (2006), eprint https://doi.org/10.1063/1.2204597, URL https://doi.org/10.1063/1.2204597.
- Kresse and Hafner (1993) G. Kresse and J. Hafner, Phys. Rev. B 47, 558 (1993), URL http://link.aps.org/doi/10.1103/PhysRevB.47.558.
- Kresse and Furthmüller (1996) G. Kresse and J. Furthmüller, Phys. Rev. B 54, 11169 (1996), URL https://link.aps.org/doi/10.1103/PhysRevB.54.11169.
- Kresse and Joubert (1999) G. Kresse and D. Joubert, Phys. Rev. B 59, 1758 (1999), URL https://link.aps.org/doi/10.1103/PhysRevB.59.1758.
- Perdew et al. (1996) J. P. Perdew, K. Burke, and M. Ernzerhof, Phys. Rev. Lett. 77, 3865 (1996), URL https://link.aps.org/doi/10.1103/PhysRevLett.77.3865.
- Monkhorst and Pack (1976) H. J. Monkhorst and J. D. Pack, Phys. Rev. B 13, 5188 (1976), URL https://link.aps.org/doi/10.1103/PhysRevB.13.5188.
- Blöchl et al. (1994) P. E. Blöchl, O. Jepsen, and O. K. Andersen, Phys. Rev. B 49, 16223 (1994), URL https://link.aps.org/doi/10.1103/PhysRevB.49.16223.
- Gonze et al. (2009) X. Gonze, B. Amadon, P.-M. Anglade, J.-M. Beuken, F. Bottin, P. Boulanger, F. Bruneval, D. Caliste, R. Caracas, M. Cote, et al., Computer Physics Communications 180, 2582 (2009), ISSN 0010-4655, URL http://www.sciencedirect.com/science/article/pii/S0010465509002276.
- Methfessel and Paxton (1989) M. Methfessel and A. T. Paxton, Phys. Rev. B 40, 3616 (1989), URL https://link.aps.org/doi/10.1103/PhysRevB.40.3616.
- Stokes and Hatch (2005) H. T. Stokes and D. M. Hatch, Journal of Applied Crystallography 38, 237 (2005), URL https://onlinelibrary.wiley.com/doi/abs/10.1107/S0021889804031528.
- Kraus and Nolze (1996) W. Kraus and G. Nolze, Journal of Applied Crystallography 29, 301 (1996), URL https://doi.org/10.1107/S0021889895014920.
- Nosé (1984) S. Nosé, The Journal of Chemical Physics 81, 511 (1984), ISSN 0021-9606, eprint https://pubs.aip.org/aip/jcp/article-pdf/81/1/511/9722086/511_1_online.pdf, URL https://doi.org/10.1063/1.447334.
- Hoover (1985) W. G. Hoover, Phys. Rev. A 31, 1695 (1985), URL https://link.aps.org/doi/10.1103/PhysRevA.31.1695.
- Allen and Dynes (1975) P. B. Allen and R. C. Dynes, Phys. Rev. B 12, 905 (1975), URL https://link.aps.org/doi/10.1103/PhysRevB.12.905.