JWST MIRI and NIRCam Unveil Previously Unseen Infrared Stellar Populations in NGC 6822
Abstract
NGC 6822 is a nearby (490 kpc) non-interacting low-metallicity (0.2 ) dwarf galaxy which hosts several prominent H ii regions, including sites of highly embedded active star formation. In this work, we present an imaging survey of NGC 6822 conducted with the NIRCam and MIRI instruments onboard JWST. We provide a description of the data reduction, source extraction, and stellar population identifications from combined near- and mid-infrared (IR) photometry. Our NIRCam observations reach seven magnitudes deeper than previous JHKs surveys of this galaxy, which were sensitive to just below the tip of the red giant branch (TRGB). These JWST observations thus reveal for the first time in the near-IR the red clump stellar population and extend nearly three magnitudes deeper. In the mid-IR, we observe roughly two magnitudes below the TRGB with the MIRI F770W and F1000W filters. With these improvements in sensitivity, we produce a catalogue of 900,000 point sources over an area of arcmin2. We present several NIRCam and MIRI colour-magnitude diagrams and discuss which colour combinations provide useful separations of various stellar populations to aid in future JWST observation planning. Finally, we find populations of carbon- and oxygen-rich asymptotic giant branch stars which will assist in improving our understanding of dust production in low-metallicity, early Universe analogue galaxies.
keywords:
galaxies: dwarf – galaxies: irregular – galaxies: individual (NGC 6822) – infrared: galaxies – infrared: stars – stars: AGB and post-AGB1 Introduction
The dwarf irregular galaxy NGC 6822 is one of the closest ( kpc; Sibbons et al., 2012; Fusco et al., 2012) in the Local Group. It is famously home to some of the largest, brightest star-forming regions in the local universe (Kennicutt, 1979; Hodge et al., 1989; O’Dell et al., 1999; Jones et al., 2019) with active star formation throughout its disk and central bar. Its low metallicity ([Fe/H] ; 30% ; Skillman et al., 1989; Lee et al., 2006), elevated star formation rate, and overall youth make it a nearby analogue of galaxies at the universal epoch of peak star formation (; Madau & Dickinson, 2014), at which point a majority of the universe’s star formation and chemical enrichment is expected to have taken place. We note that while NGC 6822 is generally considered to be isolated (de Blok & Walter, 2000; Battinelli et al., 2006) without any detectable satellites, Zhang et al. (2021) postulate a 200 kpc close passage within the virial radius of the Milky Way Gyr ago. Table 1 lists properties of NGC 6822 that have been adopted for this study.
As a target of many stellar populations studies, NGC 6822 has been extensively surveyed in both the optical and infrared (IR). An old (11 Gyr) stellar component within the galaxy was inferred with the first discovery of RR-Lyrae stars (Clementini et al., 2003; Baldacci et al., 2003), while several localised bright H ii regions in the central bar Cannon et al. (2006) show the galaxy is still actively forming stars (Jones et al., 2019). After steady star formation over its evolution, NGC 6822 began a burst of star formation 3 Gyr ago (Tolstoy et al., 2001) and has continued to increase over the last Myr (Gallart et al., 1996). Optical surveys with the Hubble Space Telescope (HST; Wyder, 2001) and Subaru (Tantalo et al., 2022) detect intermediate age red clump (RC) and red giant branch (RGB) stars. The asymptotic giant branch (AGB) stars within the galaxy trace the intermediate to old stellar populations and have been extensively studied in the IR (see e.g., Cioni & Habing, 2005; Sibbons et al., 2012; Hirschauer et al., 2020). These cool luminous stars evolve from low- to intermediate-mass ( ) main sequence (MS) progenitors and may play a vital role in the dust evolution of galaxies.
The dust contribution from evolved stars in metal-poor environments and at high redshift is not currently well defined. In particular, for young galaxies inhabiting the early universe, it can be expected that insufficient time has elapsed for MS stars to reach the AGB phase, which suggests that they do not contribute significantly to the overall dust budget. Observations have thus far shown, however, that large reservoirs of dust appear to exist at redshifts out to 6 (Bertoldi et al., 2003; Robson et al., 2004; Beelen et al., 2006; Algera et al., 2023). Studies of nearby metal-poor systems such as dwarf galaxies and globular clusters have shown that dust can originate from AGB stars in these environments (McDonald et al., 2010; Whitelock et al., 2018; Jones et al., 2018), however the effects of metallicity on AGB star dust production are disputed (van Loon et al., 2005; McDonald et al., 2011; Sloan et al., 2012, 2016). The Surveying the Agents of a Galaxy’s Evolution (SAGE) surveys (Meixner et al., 2006; Gordon et al., 2011) mapped the Magellanic Clouds with Spitzer from 3.6 to 160 µm. These data enabled detailed studies characterising the evolved stellar populations within the Magellanic Clouds and their contributions to dust production (Blum et al., 2006; Srinivasan et al., 2009; Boyer et al., 2011). Boyer et al. (2011) find that the very dusty “extreme” carbon-rich AGB stars dominate the return of dust into the interstellar medium (ISM) in both galaxies (90% of the dust input from evolved stars; Boyer et al., 2012), while supergiant (SG) stars do not contribute significantly (4%). The authors also find that in the higher metallicity Large Magellanic Cloud (LMC), oxygen-rich AGBs produce overall more dust than the lower-mass carbon-rich AGB stars, while in the Small Magellanic Cloud they contribute dust roughly equally.
While studies such as SAGE have made great progress towards understanding dust production mechanisms at low metallicity, it is now possible to extend this work to more distant systems with JWST. The JWST imaging program of NGC 6822 (program ID: 1234, PI: M. Meixner) that we present in this work allows us to investigate the evolved star population out to 500 kpc at the resolution and depth that was achieved by Spitzer in the Magellanic Clouds. This work builds upon the studies of Jones et al. (2017), Hirschauer et al. (2020), and Kinson et al. (2021) that characterised the stellar populations of NGC 6822.
This paper presents the overview of the NGC 6822 JWST imaging program, including the observation details, data reduction, photometric extraction, and combined NIRCam and MIRI colour-magnitude diagrams (CMDs) used to identify its various stellar populations, with a focus on the evolved stars. Section 2 presents the observational strategy in detail. We describe the data reduction and photometric extractions in Section 3. In Section 4, we present and discuss our resulting images, stellar classifications, and luminosity functions. Finally, we summarise the results in Section 5.
2 Observation Strategy
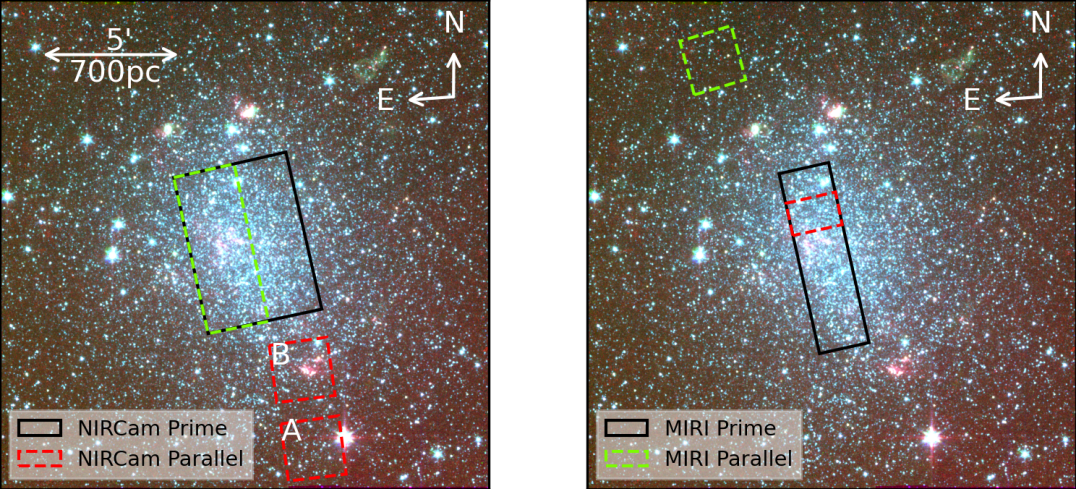
We have imaged the central bar of the galaxy NGC 6822 with JWST (Program ID: 1234; PI: M. Meixner), utilizing both the Near Infrared Camera (NIRCam; Rieke et al., 2005, 2023) and Mid-Infrared Instrument (MIRI; Rieke et al., 2015). In total, 19.92 hours of integration time were split between NIRCam (4.80 hours) and MIRI (15.12 hours). The spatial coverage for the two instruments, which focus on the central stellar bar of NGC 6822, is illustrated in Figure 1. The FoV of both instruments includes the newly-discovered young, massive, embedded super star cluster (SSC) candidate region Spitzer I (e.g., Jones et al., 2019; Hirschauer et al., 2020; Lenkić et al., 2023), in addition to a plethora of IR-bright, dusty sources in the galaxy’s central stellar bar (Sibbons et al., 2012; Jones et al., 2019; Hirschauer et al., 2020; Kinson et al., 2022). Additionally, we obtained coordinated parallel observations of off-target regions.
| Properties of NGC 6822 | |
|---|---|
| Nominal centre point | 19:44:56 -14:47:51 |
| Distance | 490 40 kpc (Fusco et al., 2012) |
| Distance modulus | 23.45 |
| E(B-V) | 0.35 0.04 (Tantalo et al., 2022) |
| Metallicity | [Fe/H] (Lee et al., 2006) |
| NIRCam Observation Properties | |
|---|---|
| Survey area () | 29.0 |
| Total time (hr) | 4.80 |
| Filters | F115W, F200W, F356W, F444W |
| Central () | 1.154, 1.990, 3.563, 4.421 |
| FWHM at (pixel) | 1.194, 2.065, 1.810, 2.222 |
| Completeness limits at (mag) | 26.56 26.49 24.99 25.34 |
| MIRI Observation Properties | |
|---|---|
| Survey area () | 14.5 |
| Total time (hr) | 15.12 |
| Filters | F770W, F1000W, F1500W, F2100W |
| Central () | 7.528, 9.883, 14.932, 20.563 |
| FWHM at (pixel) | 2.445, 2.982, 4.436, 6.127 |
| Completeness limits at (mag) | 23.81 23.7 24.55 20.48 |
2.1 NIRCam
Our observations with NIRCam comprised a total of 4.80 hours of integration time and were obtained on 2022 September 4 utilizing the F115W and F200W short-wavelength filters and the F356W and F444W long-wavelength filters. The observations were taken with a full subarray and implemented the fullbox 4tight primary dither pattern, which ensures that the gaps between the four short-wavelength detector subarrays in each module are filled, as is the 43″ gap between the A and B modules. We positioned the east and west portions of our mosaic such that there is a 10.0% overlap in both the rows and columns of the resultant 21 mosaic. The bright2 readout pattern was selected to optimize the signal-to-noise ratio (S/N), with one integration per exposure and seven groups per integration. With a three-point sub-pixel dither pattern to sample the point spread function (PSF), this resulted in 12 total dithers, with an overall total exposure time of 1803.8 seconds for each of the short- + long-wavelength filter combinations (i.e., F115W + F356W and F200W + F444W). See also Table 2 for filter properties and appendix Table 5 for a complete summary of exposure parameters.
Coverage of NGC 6822’s central stellar bar was achieved by restricting the aperture position angle (PA) of the JWST spacecraft to between 92.0∘ and 93.0∘. Finally, observations of the east and west halves of the mosaic were grouped to be non-interruptible, ensuring a consistent relative orientation. The NIRCam mosaic was centred at RA = 19:44:56.1990, Dec. = –14:47:51.29; the tile with a MIRI coordinated parallel is centred at RA = 19:45:00.2644, Dec. = –14:47:55.23.
Our selection of NIRCam filters was based upon prior work on stellar populations at similar wavelengths. The F115W and F200W filters are the closest equivalent to standard Johnson J and Ks filters, respectively, while the F356W and F444W filters are equivalent to Spitzer IRAC [3.6] and [4.5], respectively. With these filter selections, we are able to construct a standard collection of diagnostic near-IR CMDs, such as F115W – F200W vs. F200W (equivalent to J – Ks vs. ). This allows for comparative study with previous observations made of other galaxies, including the SAGE studies of the Magellanic Clouds (e.g., Blum et al., 2006; Meixner et al., 2006; Whitney et al., 2008; Gordon et al., 2011), the DUST in Nearby Galaxies with Spitzer (DUSTiNGS) project which surveyed local group dwarf galaxies in the mid-IR (e.g., Boyer et al., 2015a; McQuinn et al., 2017; Goldman et al., 2019), and others (e.g., Jones et al., 2015, 2018, 2019; Hirschauer et al., 2020).
2.2 MIRI
MIRI observations totalling 15.12 hours were obtained between 2022 September 4 and 2022 September 15. The 16 mosaic was restricted to a PA of 93∘ and positioned to run along the central stellar bar of NGC 6822. Each pointing in the mosaic included a 10.0% overlap between the rows to ensure smooth background matching between the fields. Due to an error in the program implementation, only five of the six MIRI tiles in the mosaic were observed on 2022 September 4. The final MIRI tile (and its coordinated NIRCam parallel observations) were subsequently obtained on 15 September 2022. Our program employed the F770W, F1000W, F1500W, and F2100W filters using a small four-point cycling dither pattern, the full subarray and fastr1 readout pattern. A list of filter properties can be found in Table 3 and a list of exposure parameters including groups per integration and integrations per exposure for each filter is provided in appendix Table 6. The MIRI mosaic was centred at RA = 19:44:58.0949, Dec. = –14:48.20.62; the MIRI tile with a NIRCam coordinated parallel was centred at RA = 19:44:58.4923, Dec. = –14:46:40.85.
Our selection of MIRI filters was guided by the predicted MIRI colours of mid-IR bright stellar populations from Jones et al. (2017): CMDs constructed from these wavelengths reveal the reddest and dustiest sources, distinguishing evolved (SGs and AGB stars) and young (YSOs) stellar populations. In addition, the F770W filter traces polycyclic aromatic hydrocarbon (PAH) emission which is expected to be prevalent in star-forming regions, while the F1000W filter is sensitive to the 10 m silicate absorption present in the spectral signatures of dusty, embedded YSOs.
2.3 Parallel Imaging
Accompanying our primary pointings, we obtained parallel observations in both NIRCam and MIRI. Only one of the two 21 mosaic tiles in our primary NIRCam observations has an associated MIRI coordinated parallel (see Figure 1). This parallel observation was designed to provide background comparison images by observing a field offset from the primary target by the intrinsic physical separation between NIRCam and MIRI on the JWST focal plane. We were able to position our pointing such that the eastern tile of our primary NIRCam mosaic was placed along the galaxy’s main body, and the coordinated MIRI parallel was located north of the disk, offset from the Hubble X star-forming region. The MIRI parallel images were obtained at this location in the F1000W and F1500W filters using a full subarray, a slowr1 readout pattern, with five groups per integration and one integration per exposure over the 12 total dithers, resulting in a total exposure time of 1433.4 seconds per filter (appendix Table 6). The total footprint encompasses 74″113″. This readout pattern was selected in contrast with the MIRI prime observations which used fastr1 (see subsection 2.2) due to data rate limits.
One of our six mosaic tiles in the primary MIRI observation has a NIRCam coordinated parallel (second from the top; see Figure 1). This tile was selected due to the advantageous position in the instrument focal plane of the Hubble IV star-forming region, which falls into NIRCam’s Module B. Module A is situated further from the galaxy and is thus a useful pointing for obtaining information on a region of the galaxy that is not actively forming stars. The two regions image an area of 132″132″each. These parallels imaged in the F140M, F150W, F277W, and F335M bands. A complete summary of the NIRCam parallel observing parameters including read mode, groups, integrations, and total exposure time is given in appendix Table 5.
3 Data reduction and Photometry
3.1 NIRCam Image Processing
The uncalibrated NIRCam images were processed through all three stages of the JWST pipeline using version 1.9.6 and Calibration Reference Data System (CRDS) version 11.16.20. For Stage-1 processing, we used CRDS context 1063 (jwst_1063.pmap). We implemented the frame0 correction to recover stars that saturated in the first group (21 s), but were unsaturated in the first 10.7 seconds comprising frame0 (ramp_fit.suppress_one_group=False). Stage-2 processing was run with CRDS context 1075 (jwst_1075.pmap). The output of Stage-2 (*_cal.fits) were corrected for 1/f noise using the image1overf.py tool from Willott (2022). The resulting files were then aligned to Gaia DR3 using the JWST/Hubble Alignment Tool (JHAT; Rest, 2023). Stage-3 mosaics were created with CRDS context 1077 (jwst_1077.pmap). We skipped the tweakreg step in Stage-3 since the WCS alignment was provided already by JHAT. The difference in pmap for each stage of the pipeline occurred due to a rapid succession of reference file deliveries while we were processing the data. The only update relevant to this dataset between the 1063 and 1075 pmaps is an update to the snowball correction step. Snowballs are rare in this dataset, so we did not apply that correction.
3.2 MIRI Image Processing
A description of the MIRI processing for this observational program is given in Lenkić et al. (2023) but we give a short overview here and describe the treatment of the background in more detail. To create calibrated MIRI images we used JWST pipeline version 1.9.5 with CRDS version 11.16.21 and context jwst_1084.pmap. Each of the raw MIRI files was processed through Dectector1Pipeline and the output through Image2Pipeline with default parameters. The resulting images were then aligned to Gaia DR3 using the tweakreg step in the pipeline.
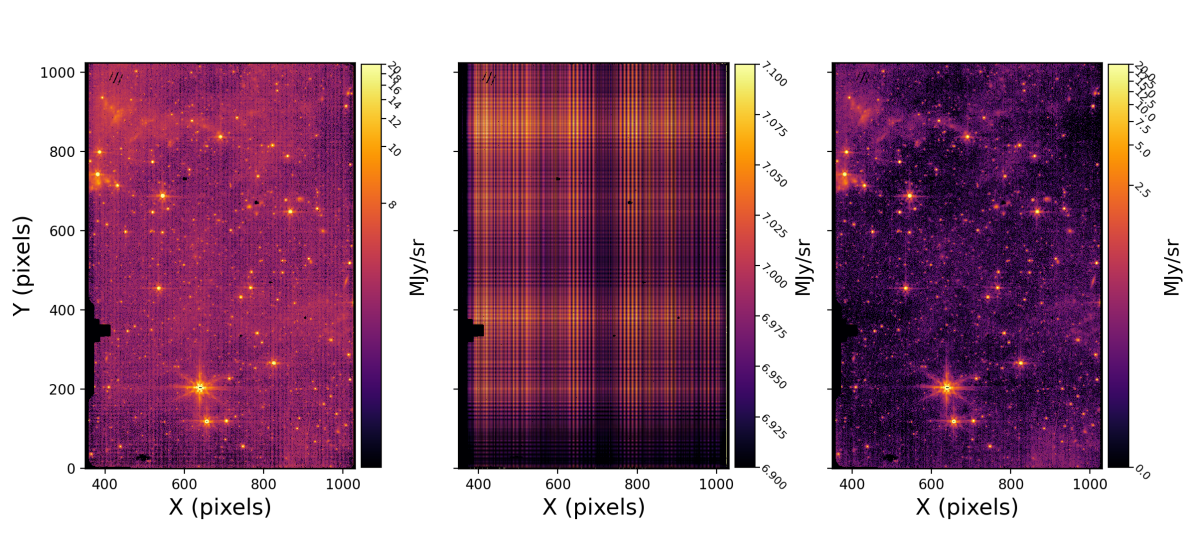
We generated instrumental backgrounds from Visits 001 and 005 of Observation 007 (i.e., the two tiles at the mosaic edges), as these are least affected by real diffuse emission. While this is not the ideal strategy, it helps to mitigate detector effects and reveal fainter sources in the galaxy. To generate an instrumental background image free of point sources and diffuse emission, we median combined all dithers of a given filter in both tiles. However, in the case of the F770W and F1000W filters, significant structure due to the extent of real diffuse emission in these tiles rendered these backgrounds unusable. For these filters we instead created a model instrumental background by taking comparatively unaffected detector rows and columns in the median combined background in order to create a representative median row and column. These were then mapped onto the detector plane to produce the model background which also accounts for row and column calibration artefacts (Dicken et al., in prep.). An example of this is shown in Figure 2.
For the F1500W and F2100W filters, only minimal structure around the brightest sources remained in the median background. Even though the residual contamination is low, it can still manifest in background subtracted images as faint shadows dispersed on the image. To remove the residuals we manually masked their location and applied an approximate ‘filling’ of the gaps using the ndimage.distance_transform_edt module in SciPy. Once backgrounds were created for all filters, we subtracted the instrumental background images from each dither in the mosaic tiles. Since Visit 001 of Observation 009 was performed 10 days after the other visits, we found that the background levels had increased slightly and corrected for this by determining a simple background offset from regions on the detector free of diffuse emission. Overall we found that our background subtraction methods performed well in reducing the background level across all mosaic tiles in all filters. We then constructed mosaics from the background subtracted images using Image3Pipeline.
3.3 Source Detection
Point-source photometry was extracted using the starbugii (Nally & Jones, 2022) photometric tool and pipeline which is optimised for JWST observations of crowded stellar populations within complex environments (e.g. Jones et al., 2023). This pipeline performs point-source extraction and band merging across multiple observations and wavelengths utilising core functions from the python photutils (Bradley et al., 2022) package. A complete set of relevant starbugii parameters and their values adopted for our photometric extractions are listed in appendix Table 7.
The individual exposures from the Gaia-aligned Stage-2 images are used for source detection with starbug2 detect. Sources with a detection above the sky, which is initially estimated locally within an annulus, are first located by centroid fitting. The geometry of each point source is calculated and sharpness and roundness values are assigned. We remove cosmic rays from the catalogue by setting an upper limit on sharpness and faint peaks in the dust structure by setting a lower limit. The source symmetry is measured using roundness; we are able to remove most resolved background galaxies and further spurious detections within the dust structure by limiting the allowed level of asymmetry.
The NIRCam fullbox 4tight dither mode results in four sets of three overlapping exposures for a given pointing. Only sources detected in at least two frames of each set are retained in the resulting catalogue; any sporadic source not meeting this threshold is discarded as a likely cosmic ray or other detector artefact while retaining true sources at the detector edges. For the MIRI images, the full cycling, small mode results in four dithers, so we stipulate that a source must be detected in three or more exposures. The flux distribution between the exposures is examined and sources with asymmetric distributions (the mean and median differ by more than 5%) are assigned the flag SRC_VAR. Matching between frames in the image stack is done with a nearest neighbour calculation with a threshold separation of 0.1 arcseconds.
We conduct aperture photometry on these sources in each individual frame. A fixed aperture radius of 1.5 pixels and a sky annulus with an inner and outer radius of 3.0 and 4.5 pixels, respectively, is used for all NIRCam bands, and the aperture correction is interpolated between values given in CRDS jwst_nircam_apcorr_0004.fits. The MIRI images are treated the same but we increase the aperture radius to 2.5 pixels for F770W and F1000W, and 3.0 pixels for F1500W and F2100W to account for the larger PSFs at longer wavelengths. The backgrounds are calculated within a 4.0-5.5 and 4.5-6.0 pixel annuli respectively, and aperture corrections are calculated from jwst_miri_apcorr_0005.fits. The data quality array within the aperture of each source is inspected and we flag sources with saturated or DO_NOT_USE pixels with the starbugii flag SRC_BAD and pixels that contained a jump during detection with SRC_JMP.
We present Table 4 containing a list of source counts for every filter and an estimate of sensitivity values.
3.4 PSF Photometry
The nebulous background emission underlying our images of NGC 6822 is modelled using starbug2 background. This routine places masking apertures of varying sizes, calculated on the flux of each source, and fills them with the median pixel value within a local annulus. For every pixel in the image, the background is measured by averaging all the local pixels within a set box size. This process creates an effective representation of the nebulous emission; by subtracting this diffuse emission background from a single exposure, we create a clean image of our field with nebulous emission removed onto which PSFs can be accurately fit.
For each detector subarray within NIRCam, we generated a five arcsecond PSF with webbpsf (Perrin et al., 2014) version 1.1.1. The single exposures have their nebulous background estimated and subtracted, and we run PSF photometry using starbug2 psf on the residual image at the source positions from the combined and cleaned source list generated in our aperture photometry step. The centroid position is left as a free parameter, allowing both flux and position to be fit during the routine. If the newly fitted centroid position differs from the initial guess by greater than 0.1 arcseconds, we refit the flux but hold the position fixed at the initial guess. This results in a poorer fit and therefore we flag the source with SRC_FIX.
Unfortunately, the MIRI PSFs simulated by webbpsf do not currently include the cruciform structure which is known to contain up to 26% of the flux in the F770W band (Gáspár et al., 2021), resulting in poor PSF fits and some flux which is unaccounted for. In this work, we therefore use aperture photometry for all the MIRI detections in our catalogue, rather than PSF photometry.
3.5 Photometric Corrections
We calculate and apply instrumental zero point magnitudes to calibrate the PSF photometry because they are not normalised to physical units. For each filter, a cleaned aperture photometry catalogue which retains only the most reliable point sources is used as the base to determine the zero point. To produce the clean source list from the main catalogue, both the faintest and brightest sources are removed to limit sources with low S/N, partially-saturated objects, and any potential remaining detector artefacts. Sources must have a photometric error of less than 0.1 and must not have any poor-quality data flags. These cuts eliminate over 80% of the sources in the main catalogue. Finally, these sources are matched to the equivalent source in the PSF catalogue. We use starbug2 calc-instr-zp to calculate the median difference in the source magnitudes measured by aperture photometry and PSF fitting to obtain instrumental zero point magnitudes which are subsequently used to calibrate the PSF photometry from starbugii to the AB magnitude system. For easier comparison with past works, we convert these magnitudes to the Vega system using the reference files jwst_nircam_abvegaoffset_0001.asdf and jwst_miri_abvegaoffset_0001.asdf.
Finally, as NGC 6822 is located at a low galactic latitude it is necessary to correct the NIRCam photometry for foreground reddening. We adopt the value E(BV) (Tantalo et al., 2022) to correct for the moderate Galactic foreground extinction and apply the extinction curve of Cardelli et al. (1989) assuming . No extinction corrections were applied to the MIRI data, as foreground reddening in mid-IR wavelengths is negligible. Nor was differential extinction internal to NGC 6822 accounted for as this is assumed to be insignificant compared to photometric uncertainties due to crowding.
3.6 Catalogue
Individual filter band catalogues are merged together to form a combined NIRCam and MIRI point-source catalogue for NGC 6822 with starbug2-match band. Prior to any matching, the photometric uncertainty of each source is assessed, and anything with a magnitude error greater than 10% is removed from the individual catalogues. This reduces the likelihood of mismatching high-quality sources with any remaining spurious sources, producing a reliable band-matched catalogue at the possible cost of completeness.
Initially, we treat the NIRCam and MIRI catalogues separately, applying the same methodology to the band matching within each instrument. The matching routine starts with the shortest-wavelength catalogue, as the smaller PSF full width at half maximum (FWHM) leads to the highest astrometric certainty. This is matched with a nearest neighbours method to the next-shortest wavelength catalogue, with any unmatched sources above the separation threshold appended to the end. The position used for each source is taken from the shortest-wavelength catalogue in which it initially appeared, allowing for faint red objects such as highly dust-enshrouded AGB stars that are not visible in the near-IR to be retained. We used a separation threshold that increases as the PSF size increases, as using a single threshold larger than the astrometric uncertainty of the longest MIRI wavelengths would cause mismatching in the shortest NIRCam filters. We match short wavelength NIRCam filters using a threshold of 0.06″ and long wavelength NIRCam filters with 0.1″. Within MIRI we adopt 0.15″ for F770W and F1000W, 0.2″ for F1500W, and 0.25″ for F2100W.
Finally, we merge the NIRCam and MIRI catalogues with a separation threshold of 0.3″. We expect many of the reddest and most dust-enshrouded sources detected in the long-wavelength MIRI data to be missing from the shortest-wavelength NIRCam images. However, the depth and sensitivity of F115W and F200W result in a catalogue populated by many faint blue sources. Consequently, a simple positional matching approach between a long-wavelength MIRI band and a short-wavelength NIRCam band would likely result in a significant number of mismatches because of the many sources present at short wavelengths which lie along similar lines of sight. To combat this issue we require any sources matched between NIRCam and MIRI to have an F444W detection. In other words, a source in our MIRI catalogue will be compared with all sources in the NIRCam catalogue within the matching radius and paired with the nearest source for which a detection in the F444W band exists. If no NIRCam sources within the matching radius are detected in the F444W band, the MIRI source will be assumed to have no NIRCam counterpart and will subsequently be appended to the catalogue as a new object. Thus both blue and red objects in the catalogue will be retained and the chance of a mismatch between co-located sources reduced.
3.7 Foreground Contamination
To remove foreground Milky Way stars from our JWST NGC 6822 source list we examine Gaia Data Release 3 (DR3 Gaia Collaboration et al., 2021) for foreground contamination. First, the Gaia catalogue is cleaned of sources with poor astrometry and possible non-single objects within our JWST FoV, as outlined by Fabricius et al. (2021). This involves keeping sources with: RUWE1.4, astrometric_excess_noise_sig2.0, visibility_periods_used9 and ipd_gof_harmonic_amplitude0.1. The cleaned Gaia catalogue is matched to our NGC 6822 photometry, resulting in 656 positive matches within the main field. Sources that exhibit a significant () parallax or proper motion are considered to be foreground sources and are thus removed from our catalogue. Due to the relative proximity of NGC 6822, we check that the proper motion of the sources do not deviate significantly from the global proper motion of the galaxy, as outlined by Dimitrova et al. (2021).
In total, we find that 179 sources exhibit proper motion above the threshold with all but one also deviating significantly from that of the galaxy. We also find that every source with significant parallax also exhibits proper motion. This allows for 178 sources to be removed from the catalogue as foreground contaminates. Despite NGC 6822’s proximity to the galactic plane, we see a low number of foreground stars in our data set. Our detection routine is unable to recover many of the bright foreground stars due to the saturation limits of our data. Furthermore, Gaia only detects the brightest IR sources in NGC 6822; this paired with the small FoV of our observations means that the number of foreground contaminating stars in our catalogue is low, as expected.
4 Results and Discussion
4.1 Mosaic Images
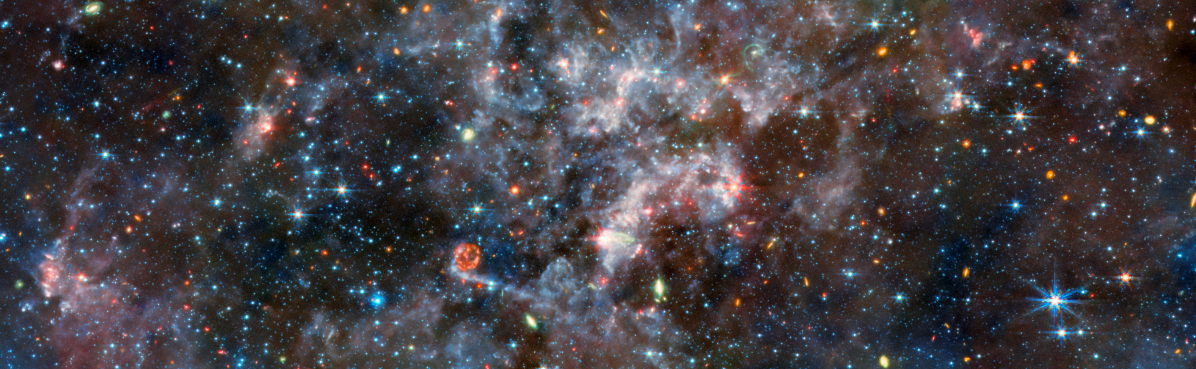
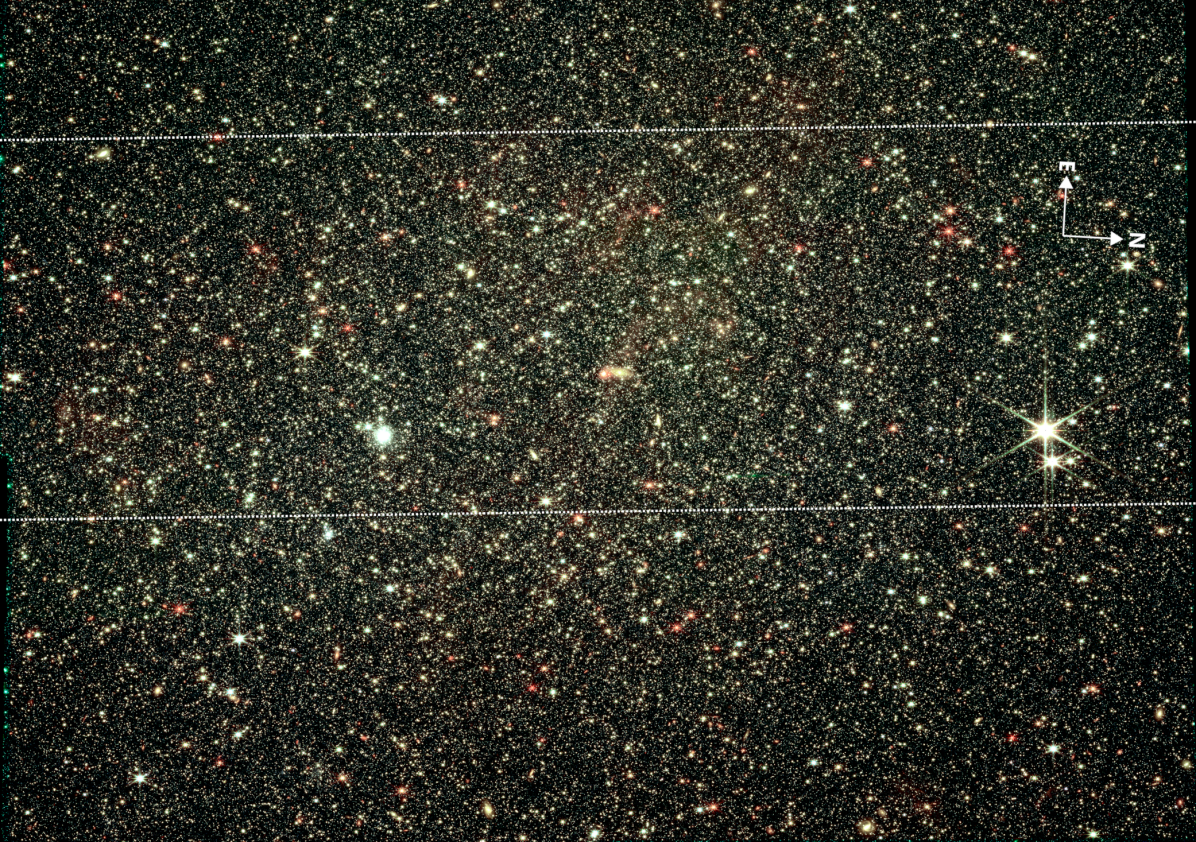
The NIRCam prime mosaics shown in Figure 3 cover a FoV of 29.0 arcmin2, whilst the MIRI mosaic covers a 14.5 arcmin2 FoV, with the NIRCam FoV overlapping nearly the entirety of that of MIRI. These mosaics image NGC 6822, located at a distance of 490 kpc, with resolutions from 0.037″ (0.087 pc) to 0.139″ (0.332 pc) in NIRCam, and from 0.268″ (0.638 pc) to 0.673″ (1.601 pc) in MIRI. This provides an improvement over existing Spitzer imaging by up to a factor of 10.
The NIRCam field shows a smooth distribution of stars increasing in density towards the centre of the FoV. Scanning by eye reveals an assortment of clear extreme candidates with bright blue or red colours on a backdrop of many faint stars. The background galaxies are evenly distributed across the image, with some showing detailed spiral structures and others only visible in the longest wavelengths. A dense globular cluster (Hubble VII) is visible in the centre right of the image. The extent of the MIRI footprint is overlaid as a white dotted line. The NIRCam data is devoid of all dust structure whereas the MIRI data of the same region is completely dominated by complex diffuse emissions. The centre of our FoV covers the young massive star forming region Spitzer I, for which a detailed study of the young stellar objects has been conducted by Lenkić et al. (2023).
4.2 Stellar Population Classification
This section presents JWST CMDs covering the galaxy within the full extent of our survey. We select colour combinations that highlight significant population separation and those which represent similar wavelength coverage as Spitzer filters used in the SAGE surveys (Meixner et al., 2006; Gordon et al., 2011). We adapt classification boundaries from prior work (Blum et al., 2006; Hirschauer et al., 2020) and investigate the location various stellar populations occupy in different JWST colour combinations, which we anticipate will be useful in future stellar surveys.
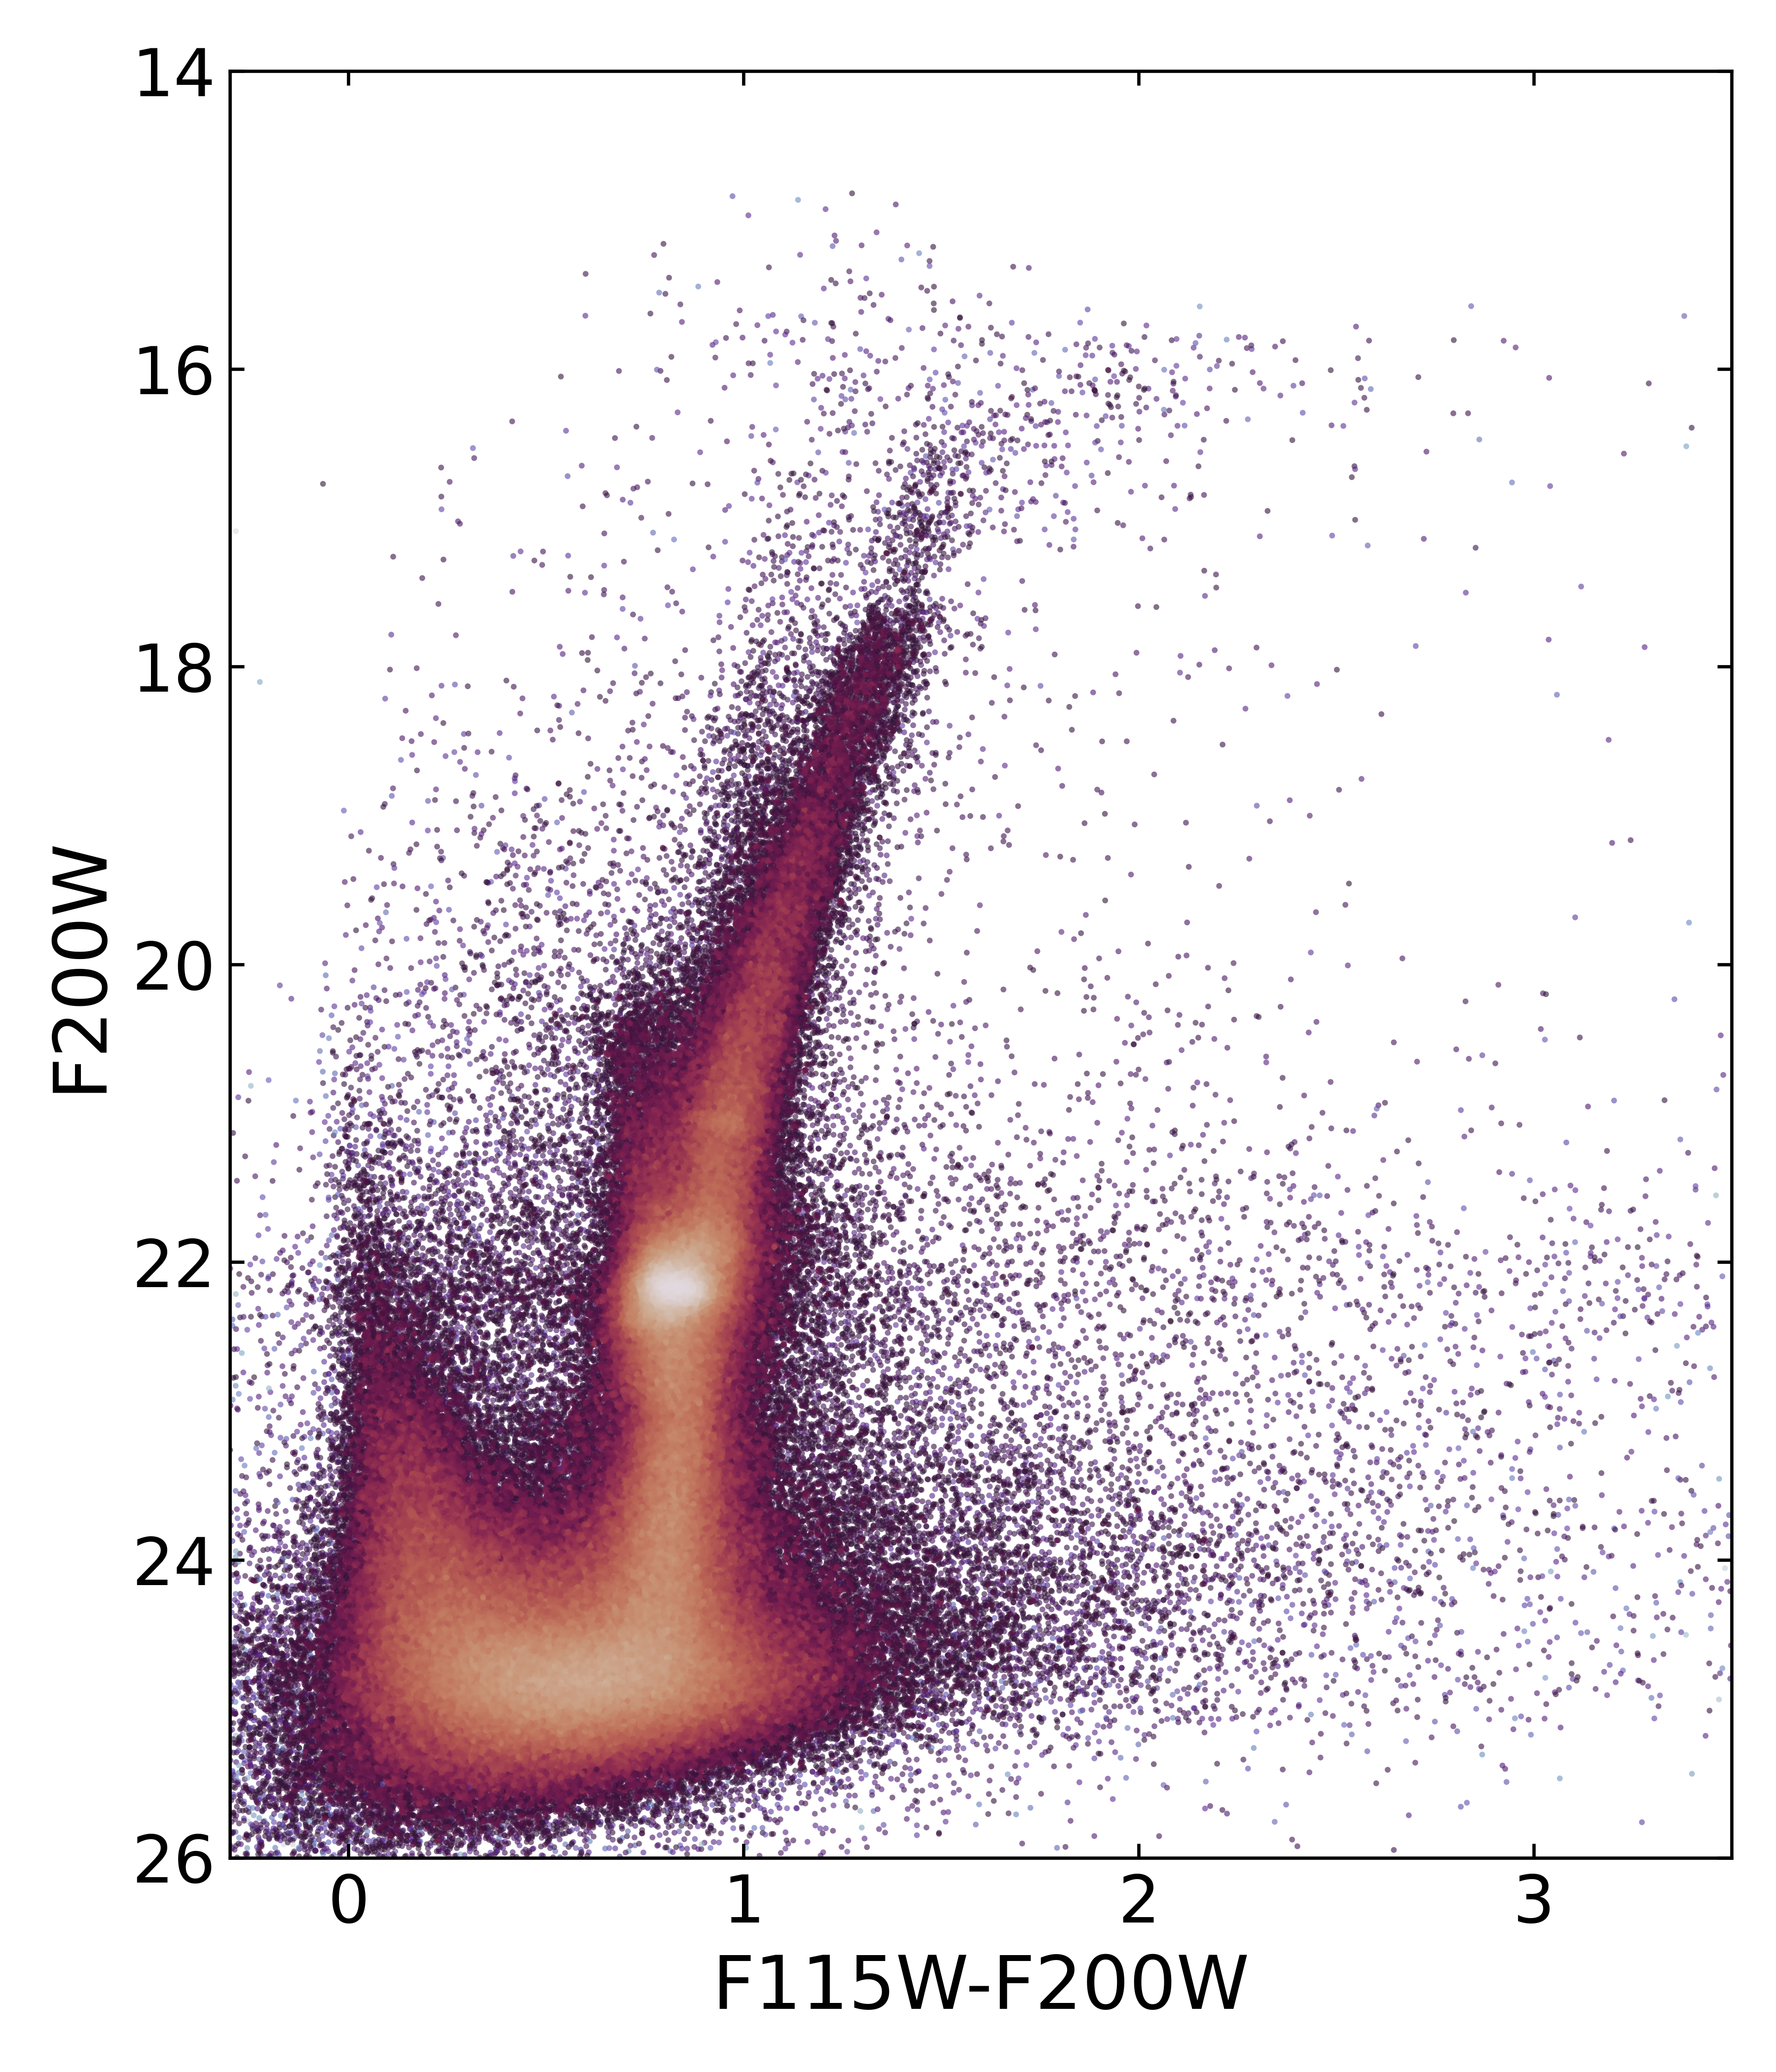
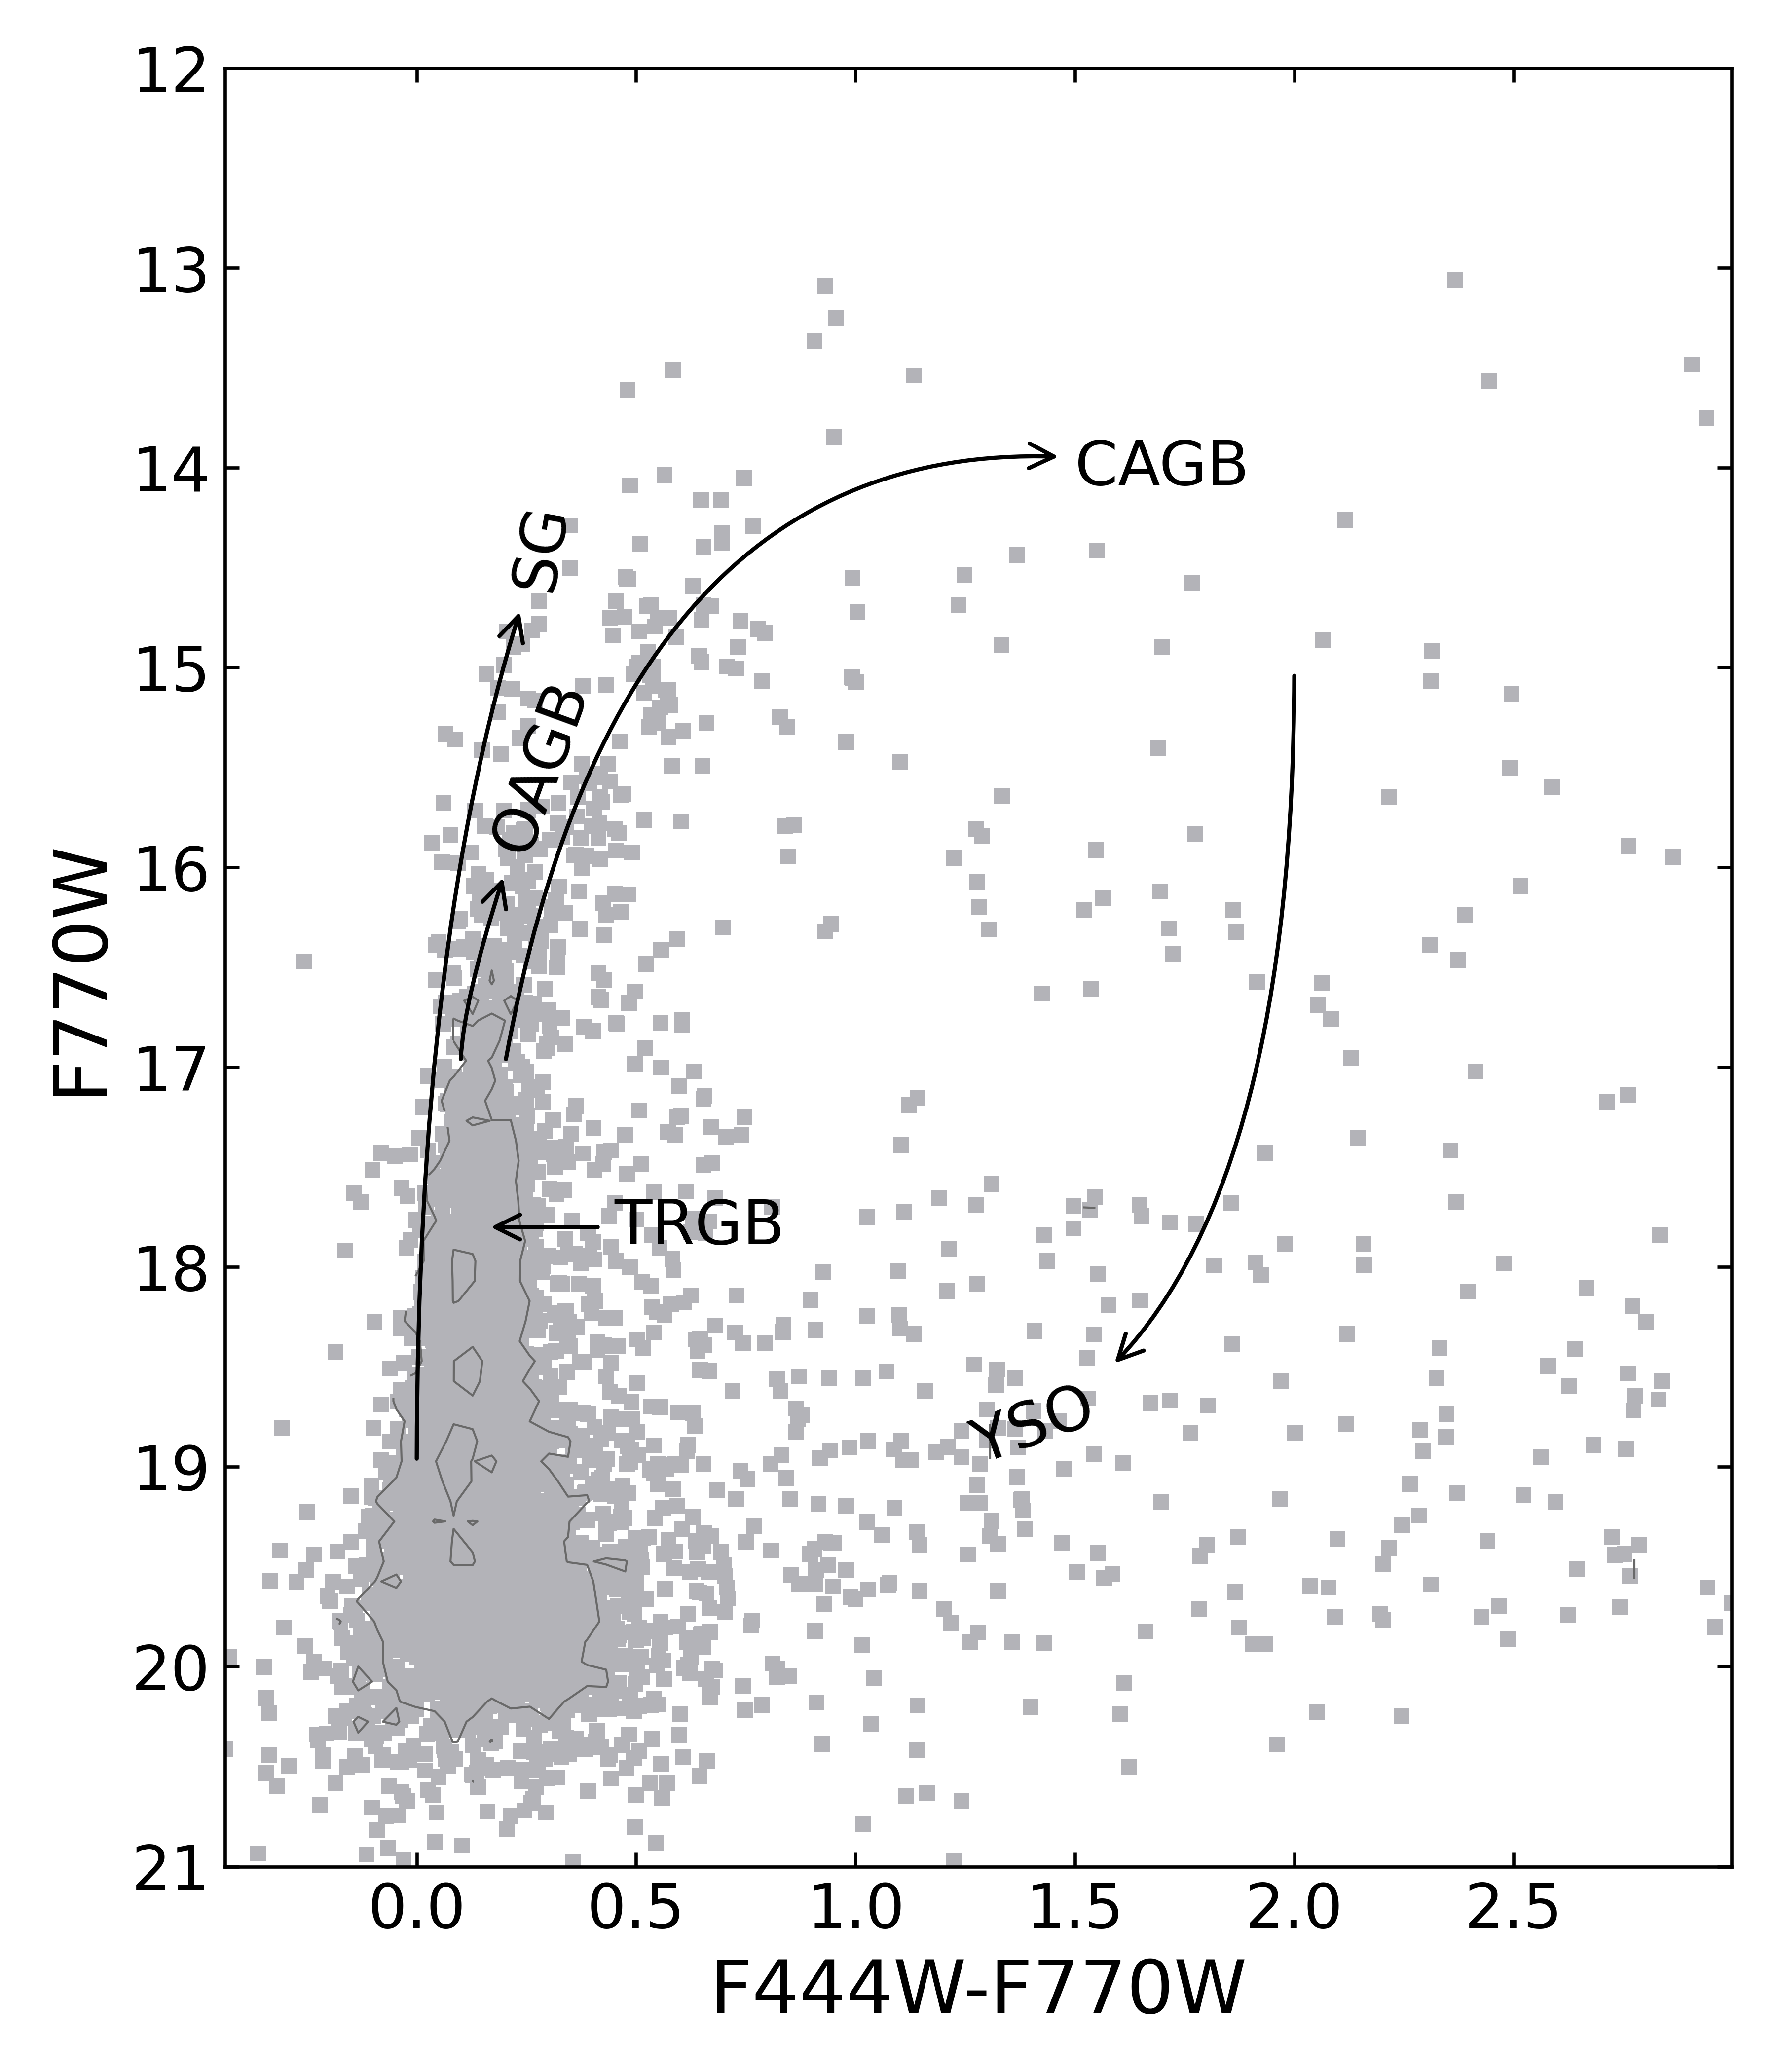
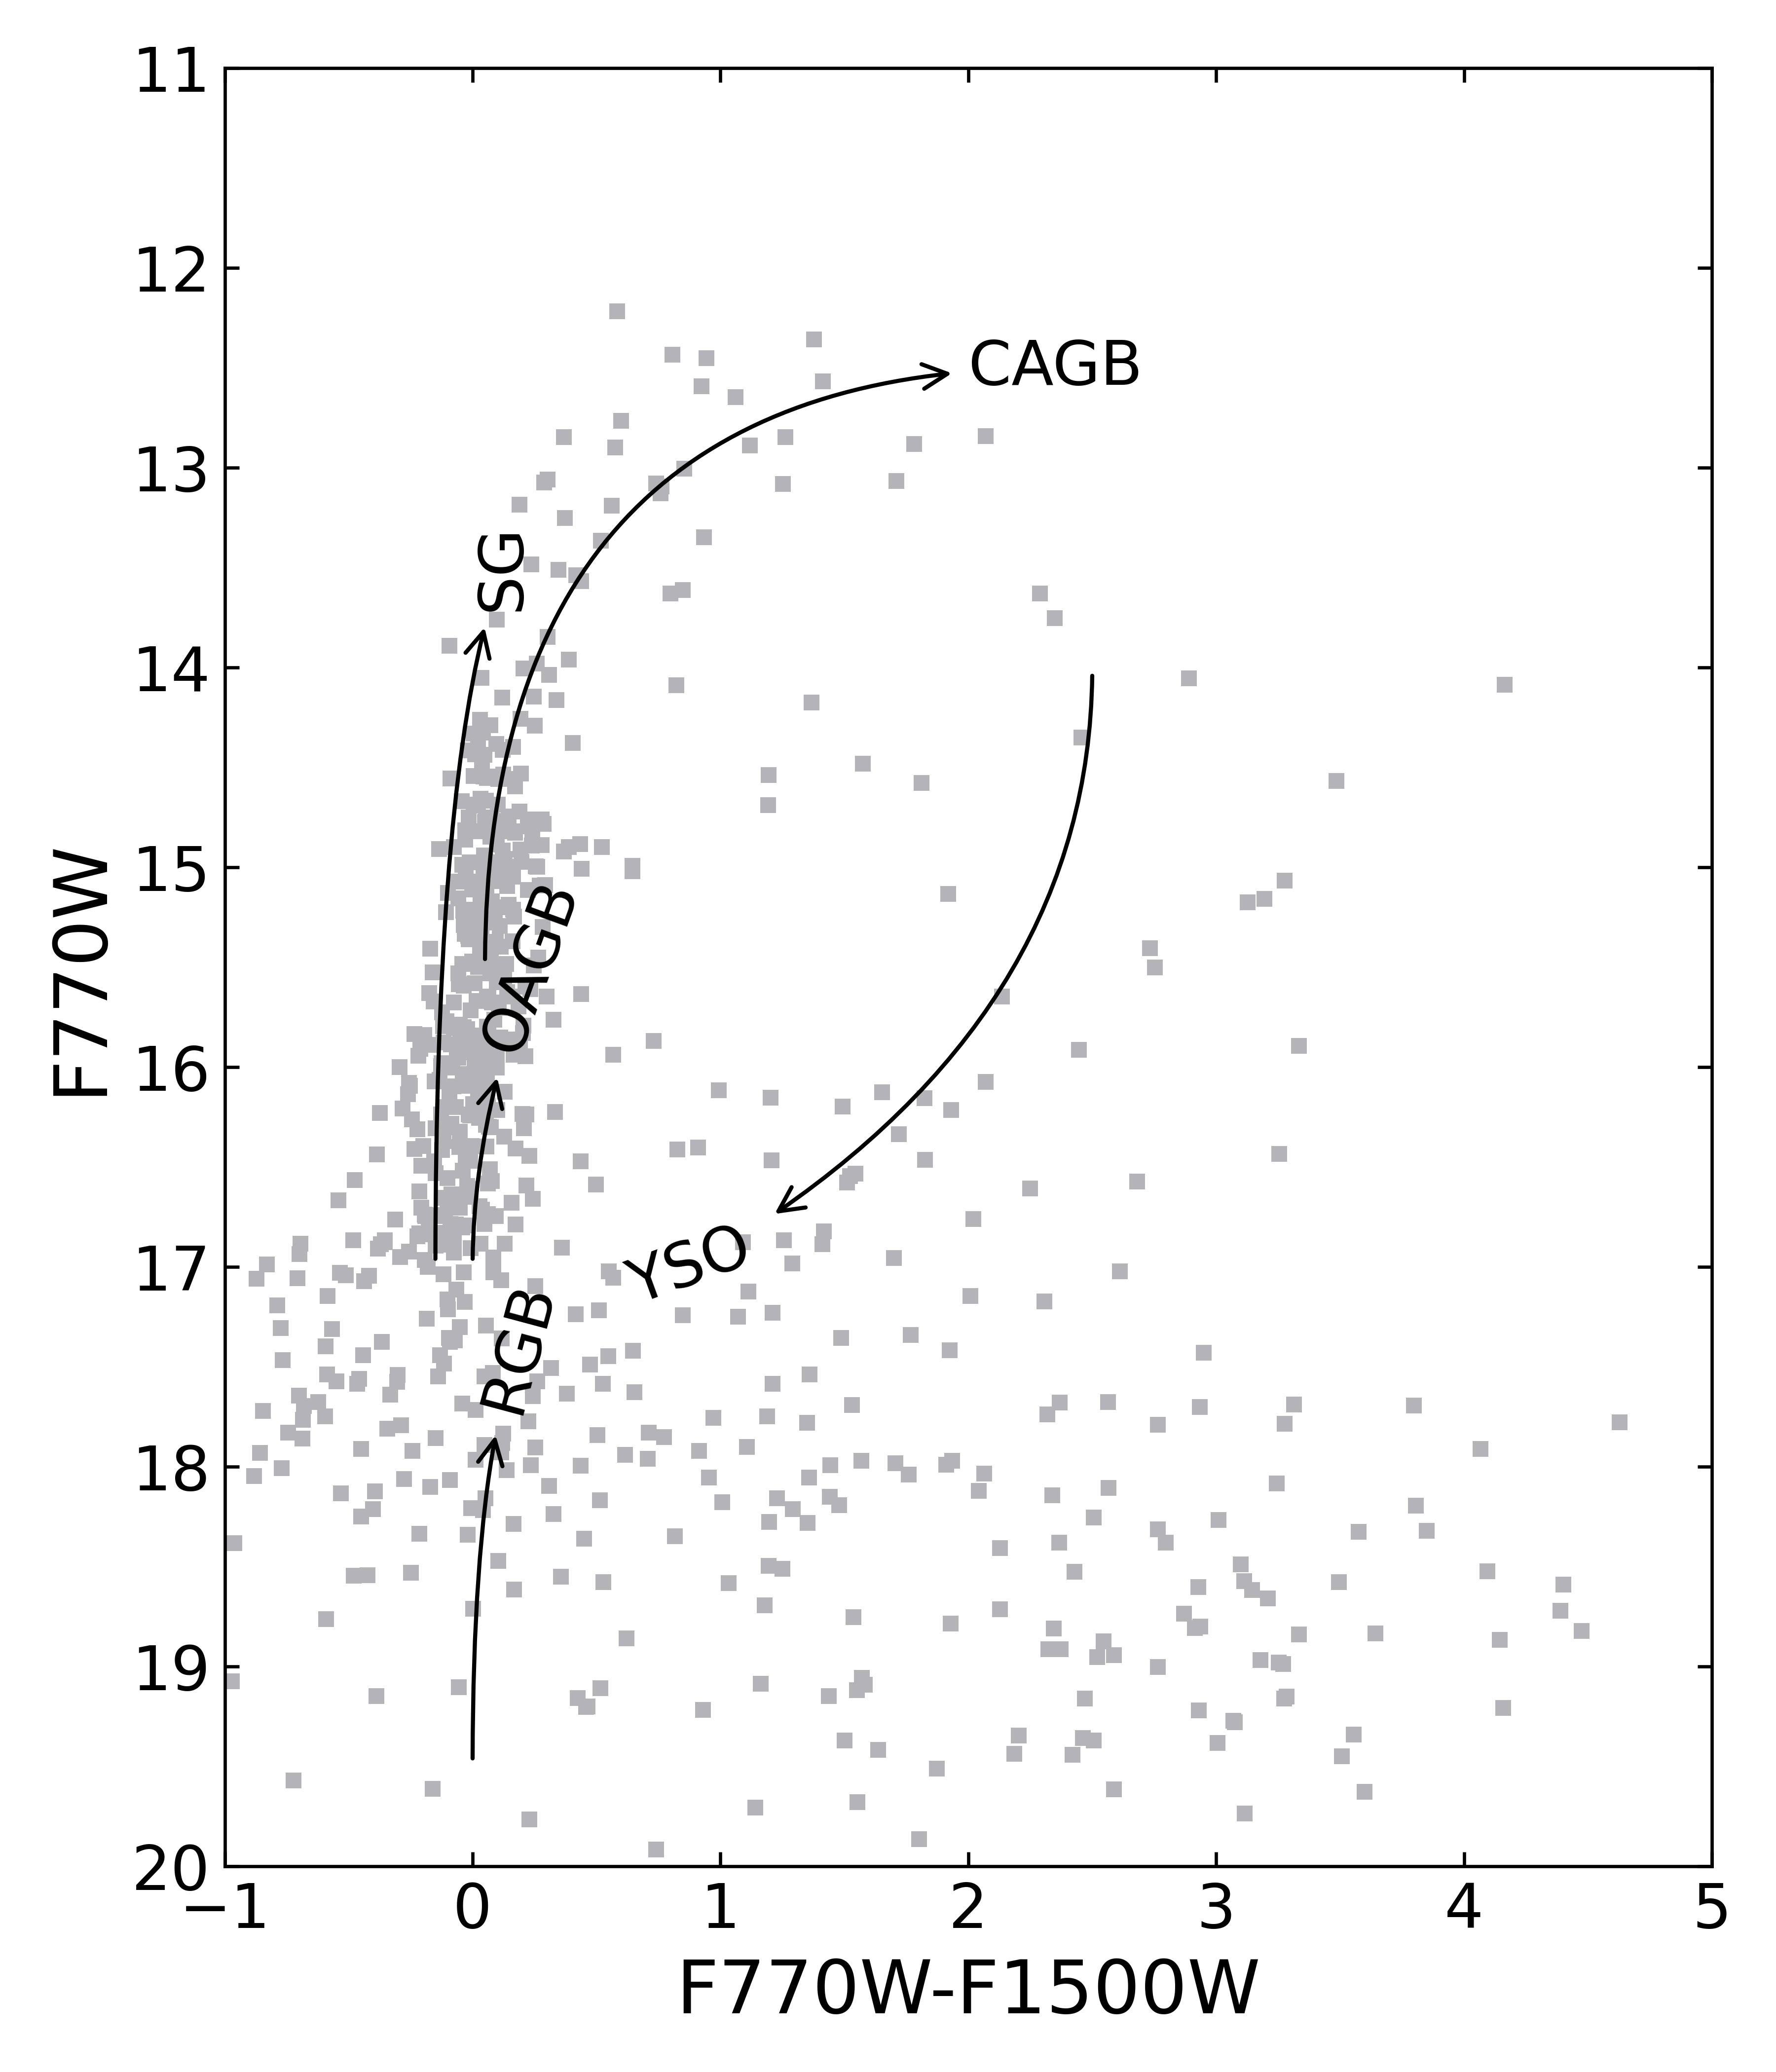
Figure 4 shows one NIRCam-only CMD (F115WF200W vs. F200W) in contour and Hess diagram format, one MIRI-only CMD (F770WF1500W vs. F770W), and one combined CMD (F444WF770W vs. F770W) with the most identifiable populations overlaid. The first CMD, with a filter combination most similar to the ( vs. ) CMDs of previous NGC 6822 studies (e.g., Cioni & Habing, 2005; Sibbons et al., 2012; Whitelock et al., 2013), was chosen as it utilizes the most sensitive photometry and therefore reveals the faintest populations. The diagram is shaped as a collection of sources that splits vertically into two main fingers from the base, with the broadness of the base likely being a product of greater scatter as the sensitivity limit of the photometry is approached. The blue finger follows the Upper Main Sequence (UMS), with more massive stars appearing higher up. The right-hand fork is primarily the Red Giant Branch (RGB), with the Red Clump (RC) appearing as a dense bulge at F200W22.0 and the AGB bump (AGBb) embedded just above at F200W21.0. The vertical track seen above the RC is formed by red helium burning (RHeB) stars evolving toward the AGB. The supergiant (SG) track splits from the RGB below the Tip of the RGB (TRGB) and runs diagonally upward, consisting of some of the brightest sources in the galaxy. Above the TRGB the thermally pulsing AGB (TP-AGB) stars separate into oxygen-rich AGB (OAGB) and carbon-rich AGB (CAGB). A fraction of the TP-AGB will likely be mid thermal pulse and sit below the TRGB. Formal separation of these stars is difficult photometrically but they make up only a small percentage () of the overall count (Boyer et al., 2015a).
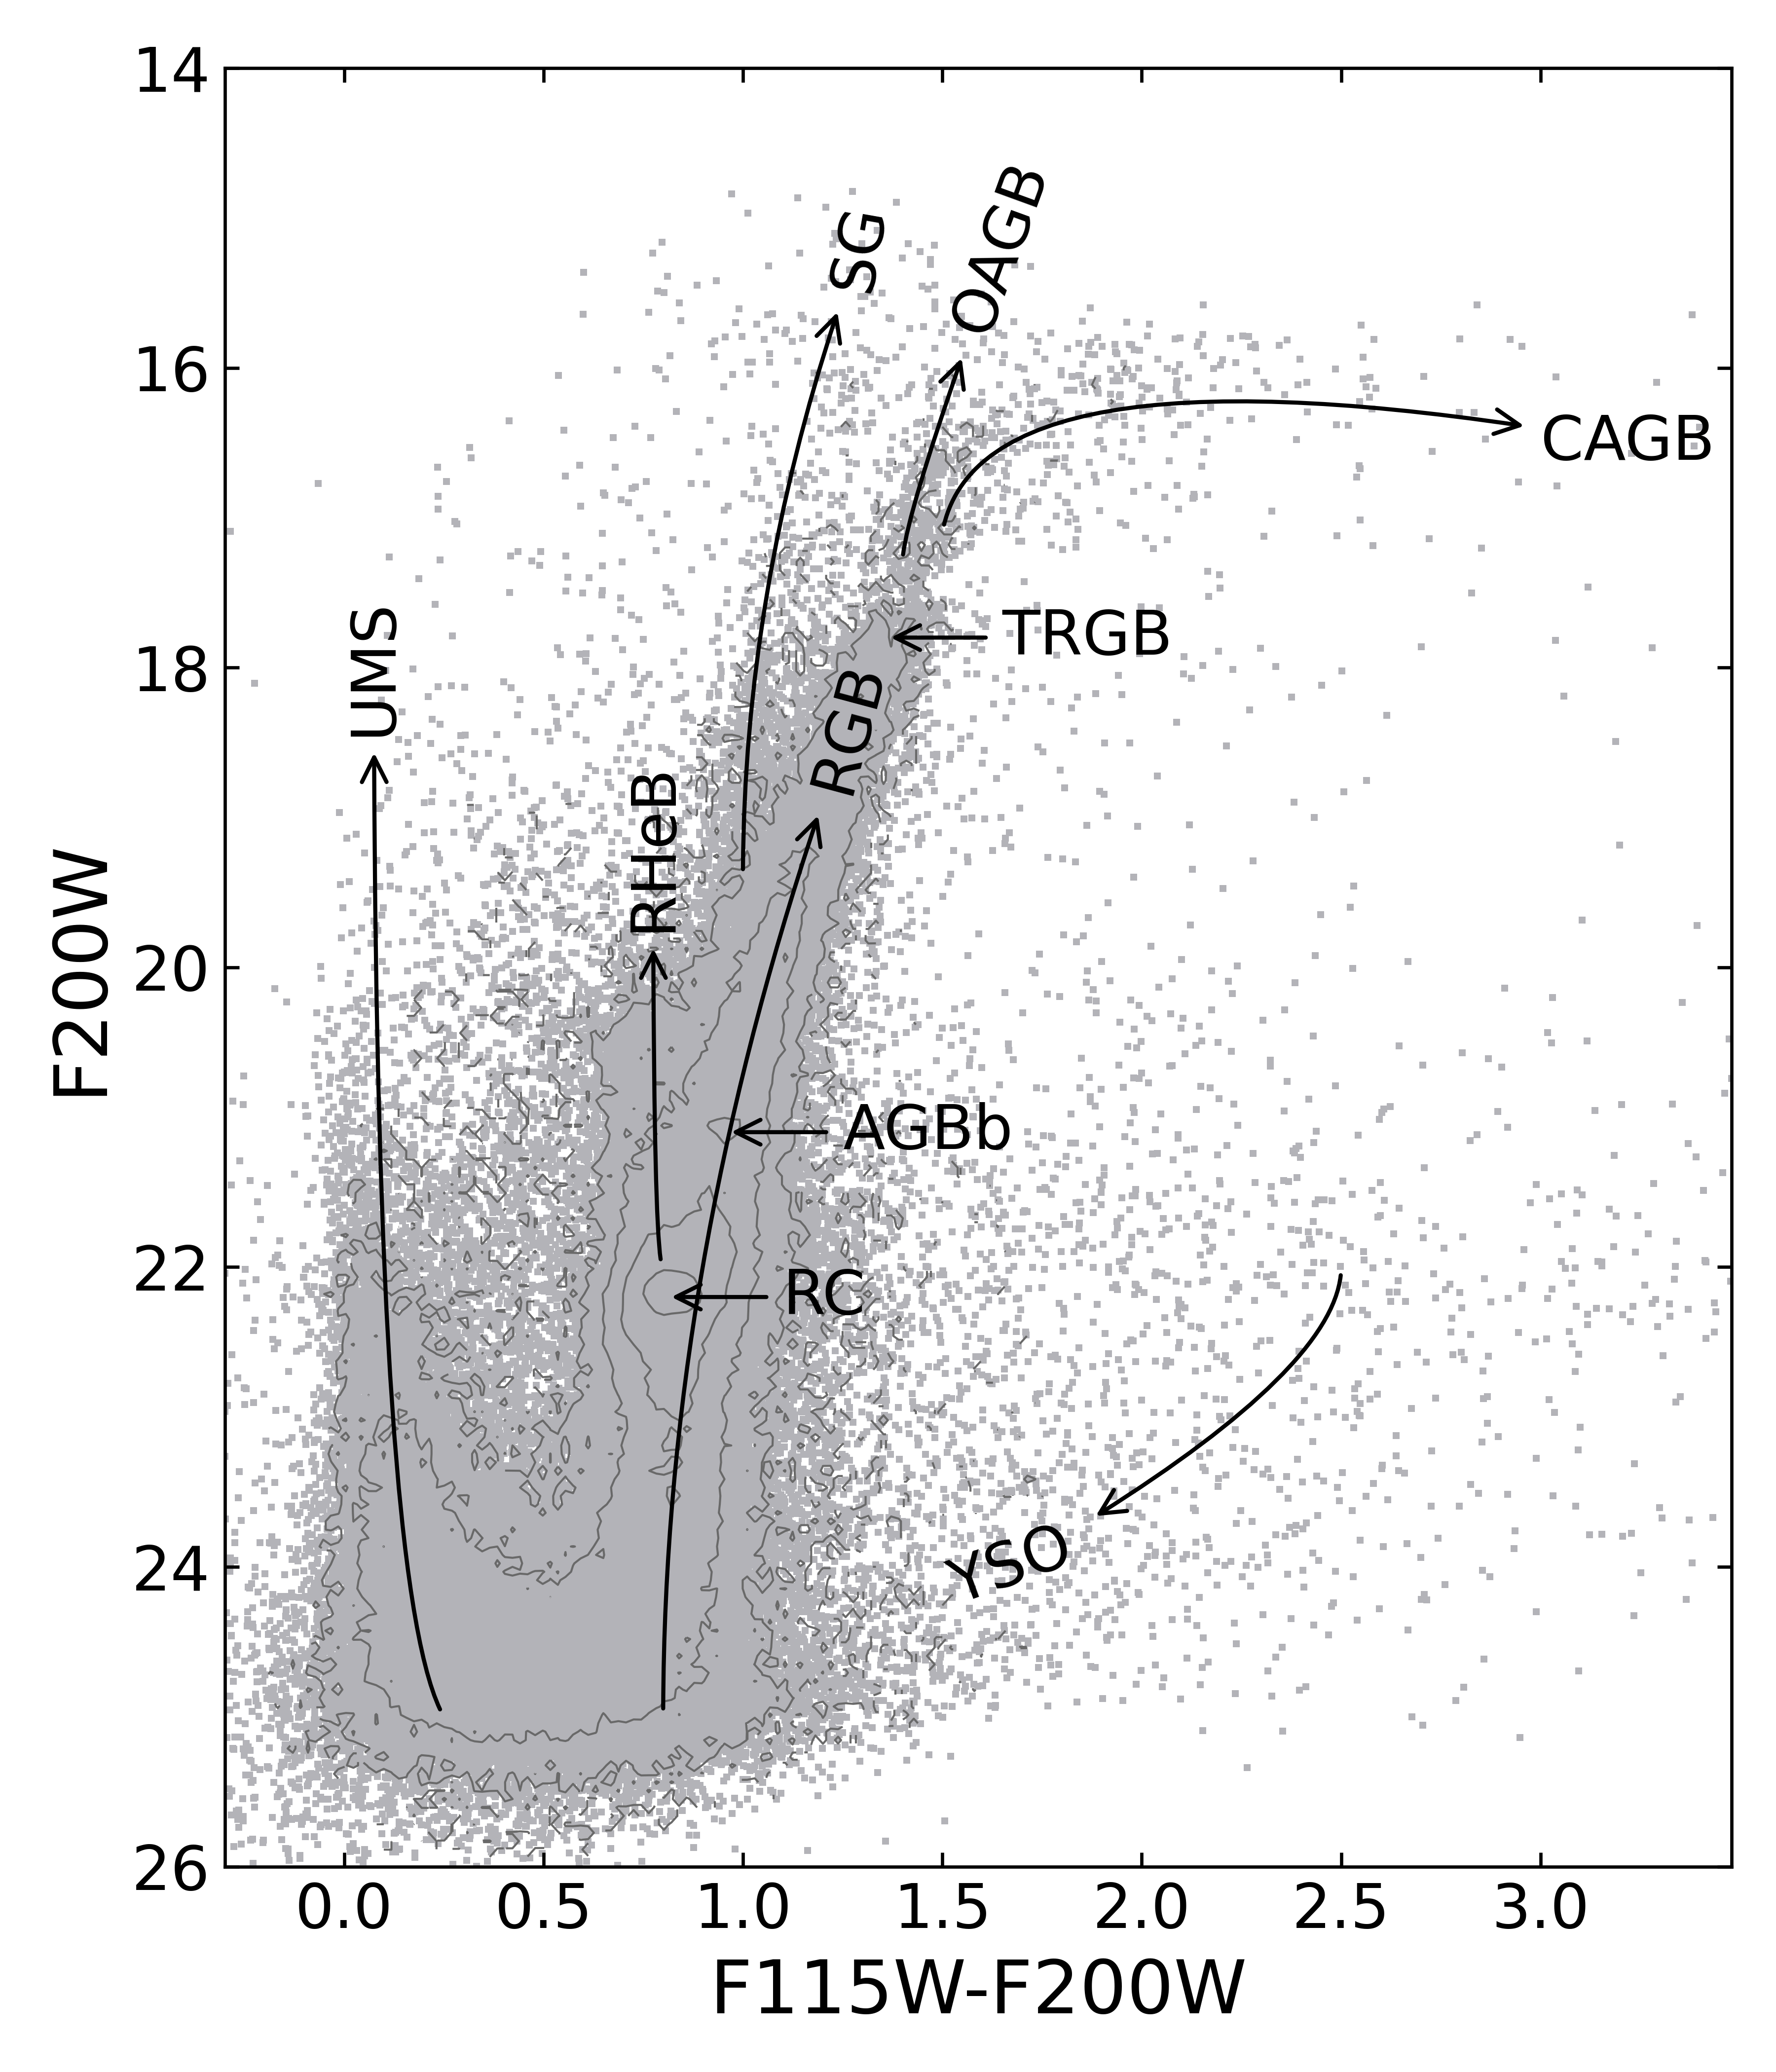
4.2.1 Upper Main Sequence
The upper main sequence population is clearly visible in the top left panel of Figure 4 as the prominent branch located at and approaching . At this branch connects with the base of the RGB, though it is unclear if this constitutes the Main Sequence Turn-Off (MSTO) for an aged population as the confusion introduced into the photometry as it approaches the completeness limit merges the populations together. An optical survey of NGC 6822 by Zhang et al. (2021) isolated the UMS with ages 100 Myr and confirmed that the population perfectly traced the HI gas distribution that lies orthogonal to the bulk of the stellar component of the galaxy. Because they trace recent star formation, these stars offer information about the underlying gas and how it evolves over time.
UMS stars are generally very bright and have dispelled any nearby dust, they possess spectral energy distributions (SEDs) peaking in blue wavelengths. As such, they are detectable in the short NIRCam filters but become difficult to detect at longer wavelengths.
4.2.2 Red Giant Branch
The RGB begins at and in the top left panel of Figure 4 and extends vertically in a steep diagonal towards the red. This sequence is formed by stars that have just left the MS and have begun H-shell burning. In a single-aged population the MSTO will appear as a tight track connecting the MS to the base of the RGB. The multi-aged population of NGC 6822, a product of continuous star formation, elongates the RGB and is consistent with an old population spanning Gyr. Previously Zhang et al. (2021) isolated the brighter portion of this branch to show that the old stars contribute to the galaxy’s eccentric elliptical stellar component that twists radially and is perpendicular to the younger stellar component.
The TRGB is well defined in the shorter wavelengths in Figure 4 but unresolved in the longer MIRI filters. Our method of roughly calculating its position is discussed in Section 4.3.
The positioning of the RGB on a given CMD is fairly independent of star formation history (SFH) but there are two effects that cause it to spread in colour space: Younger populations appear slightly red and older populations appear more blue when considering a fixed value of metallicity. Whereas when given a fixed population age with varying metallicity, more metal poor stars appear bluer than more metal rich stars. This effect is known as the age-metallicity degeneracy (Carrera et al., 2008) as for a given individual star, it is difficult to determine with certainty if its position on the RGB is caused by its age, metallicity or both. The width of the RGB in our CMDs exceeds the expected characteristic scatter caused by uncertainty in the photometry and therefore is likely caused by a broad range of ages and metallicities across the galaxy. Detailed surveys of the metallicity gradient across the galaxy have been conducted by Patrick et al. (2015).
4.2.3 Red Clump
As old or intermediate-aged stars undergo a helium flash, they leave the RGB and collect in the RC. The RC structure is very dense in our CMDs, sitting just left of the RGB at . In our shortest-wavelength filters we resolve sources three magnitudes below the RC, but decreased depth of photometry cuts off its detection above 4 m, as seen in Figure 4.
The RC is a useful standard candle and has been used to measure SFH in NGC 6822 in the past (Wyder, 2001) by comparing age-sensitive RGB with the age-insensitive RC. The increased sensitivity of our catalogue will allow for more finely sampled calculations of the SFH within the inner regions of the galaxy. Additionally, differential reddening in NGC 6822 introduces a spread in the photometry of the theoretically tight RC. This effect can be used to build an extinction map of the galaxy (Wyder, 2001). Such an exercise is beyond the scope of this study, however it will be addressed in a forthcoming paper.
4.2.4 Red Helium Burning Sequence
Above the RC extends a vertical sequence known as the red helium-burning (RHeB) stars or the vertical red clump (VRC). The RHeB track is formed as young stars collect at the right side of the “blue loop". In older stars the distance covered during the blue loop is much smaller and they appear at the fainter end of this population. The younger stars appear brighter as the extension of the blue loop increases and sit at the upper end of the RHeB track. As the height of this sequence is directly indicative of the age of the population, it can be used to measure the SFH within the galaxy (Dohm-Palmer et al., 1997).
4.2.5 AGB Bump
The AGBb is a population of rarely-observed stars that emerges as evolving early AGB stars stall momentarily as their H-burning shells are extinguished by the expansion of their convective layers. Observing this feature is difficult, as it requires a large number of sources and may be quickly obscured by even small photometric errors. Yet, it is clearly visible in top left plot of Figure 4 embedded in the RGB at . The age and metallicity of the stars influences its positioning on the CMD and as such, along with its younger and more populated counterpart, the RGB bump (RGBb), the AGBb can be used to gain some insight into the SFH of the galaxy (Ferraro, 1992). Unlike the AGBb which always appears above the RC, the RGBb appears below or is overlaid onto the RC (Gallart, 1998); deeper analysis of our data is be required to isolate it. Although the AGBb is visible in optical data in NGC 6822 (Tantalo et al., 2022), this often neglected population is a useful mark to constrain evolutionary tracks.
4.2.6 Supergiants
At , the SG branch forks blueward from the RGB and extends steeply to the saturation limit of our data. The sequence is clearly visible in the upper-right plot of Figure 4, although the source density drops at the brightest end. The existence of a SG population in the galaxy has been shown by Whitelock et al. (2013), Hirschauer et al. (2020), and Dimitrova et al. (2021), and they follow the structure of the central bar. This result was expected as SG stars are young and massive, so have not had sufficient time to wander far from the star forming sites in the centre of the galaxy. Incorporating NIRCam and MIRI photometry, SG stars are separated effectively with vs. as seen in the lower-left panel of Figure 4 where they form a distinct blue “horn” in the CMD.
4.2.7 Asymptotic Giant Branch
Formal separation of the evolved populations is outwith the scope of this overview but will be included in the following papers in this survey. Here we present initial cuts to determine the general positions of the SG, OAGB, and CAGB. To inspect the locations of these evolved populations in colour space, we show in the first panel of Figure 5 a zoom-in of the F115WF200W vs. F200W CMD, where they appear to follow diagonal sequences. Above the TRGB at , a small gap separates the TP-AGB stars from the RGB. The two main groups in this classification are separated by the chemical makeup of their photospheres. Free carbon and oxygen are bound in very stable CO molecules. The overabundance of one of the two components is then left unbound in the photosphere and will form the basic ingredient for dust grain formation once it is lifted into the circumstellar dust shell of the star. AGBs with a ratio are defined to be C-rich and those with are O-rich. The dust species formed are dictated by this chemical difference, with CAGBs forming carbonaceous dust grains and OAGBs forming sulphates, emissions from which can be photometrically separated (Potter et al., 2004).
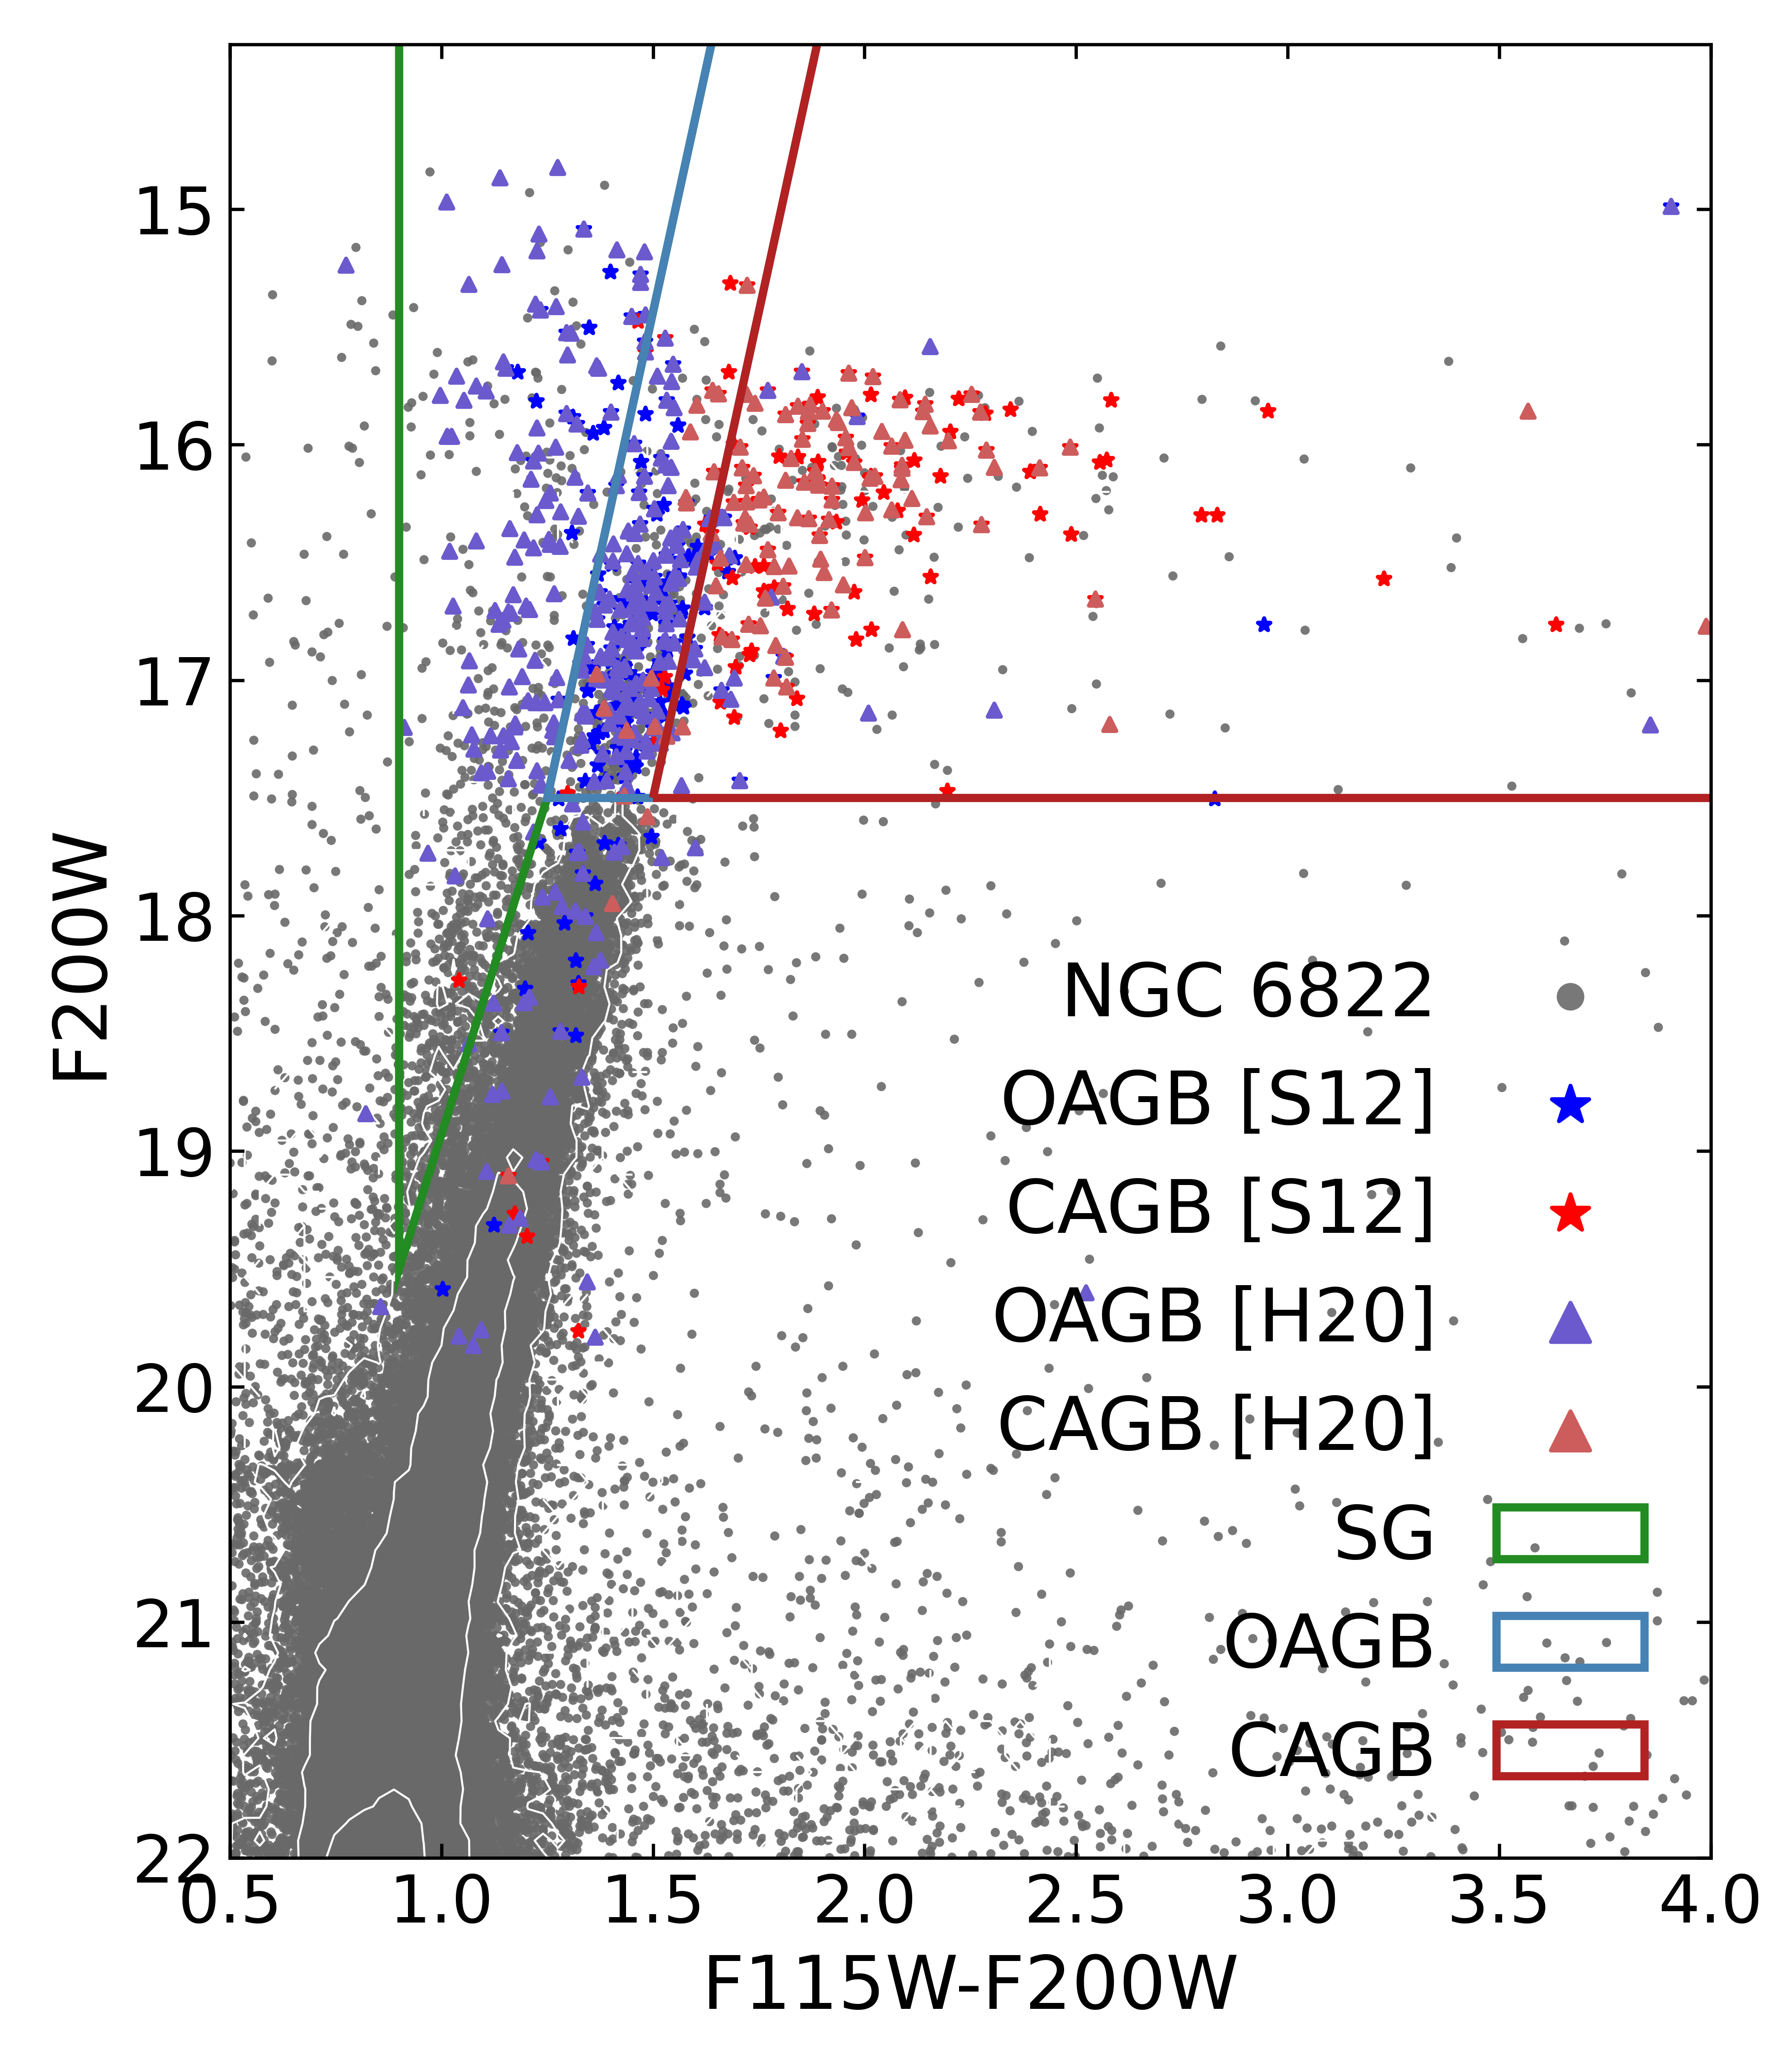
We separate the CAGB and OAGB sequences with a diagonal line above the TRGB at . Historically the AGBs in NGC 6822 have been split with a vertical line in the near-IR (see e.g., Cioni & Habing, 2005; Sibbons et al., 2012). Combining mid-IR Spitzer (where the molecular emissions separate the AGBs more effectively) and near-IR United Kingdom Infrared Telescope (UKIRT) data for broader baseline photometry, Hirschauer et al. (2020) developed a novel statistical approach to separate them with more complex colour cut boundaries. We cross-match our catalogue with Sibbons et al. (2012) and Hirschauer et al. (2020) to identify where these populations lie on our JWST CMDs. We show this comparison in the first panel of Figure 5, where blue data points indicate OAGBs and red data points indicate CAGBs. The stars correspond to AGB identifications from Sibbons et al. (2012) and triangles correspond to those of Hirschauer et al. (2020). We find that the classification of sources as CAGB stars by both of these previous studies are broadly consistent with the colour space that they occupy in our JWST CMDs (red region). A handful of sources (10) from Hirschauer et al. (2020) are classified as CAGB, but appear to fall within the region we define as corresponding to OAGB stars (blue region).
Separating the OAGBs and SGs is more involved due to the low point density in our limited CMD. Here we adopt a diagonal line above the TRGB at and draw it down the edge of the RGB with the increased sensitivity of our photometry; this region (denoted in green) is where we classify objects as SGs. In the LMC, the vs. CMD of Blum et al. (2006) had a similar SG feature. A significant fraction of the previously identified OAGB stars from Sibbons et al. (2012) and Hirschauer et al. (2020) are identified as such with our JWST data. However, a larger number of these (several 10s) appear to fall within the space we define as corresponding to SGs. More in depth follow-up studies will need to be conducted to formalise this separation. Finally, there are a few sources that were previously classified as OAGB or CAGB that fall along the RGB; these are likely TP-AGBs that are mid-pulse.
A caveat of this comparison is that the improved resolution of JWST resolves previous bright Spitzer sources into multiple fainter stars. These would appear on the CMD in the first panel of Figure 5 to the right of the RGB and below the space occupied by CAGBs. These sources (roughly half from the catalogues of Sibbons et al., 2012; Hirschauer et al., 2020) have however been omitted from the figure for clarity.
While the colour cuts we have applied here effectively distinguish the evolved stellar populations, we caution that extinction imposes limitations for the dustiest sources. We expect that the for most dust enshrouded AGBs, extinction can cause the star to dip below horizontal colour cut we have applied above the TRGB to identify the evolved stars. As such, these sources will be excluded from our CAGB classification and spectroscopic follow-up studies will be required to distinguish them from YSOs. Additionally, although it is normally assumed that everything to the right of the diagonal cut we have defined at F115WF200W (red line) is a CAGB (Boyer et al., 2015b), in cases where OAGBs produce large quantities of silicate dust, they will also move rightward and occupy a similar colour space (Aringer et al., 2016). Separating the dustiest OAGB and CAGB stars will also require spectroscopic observations.
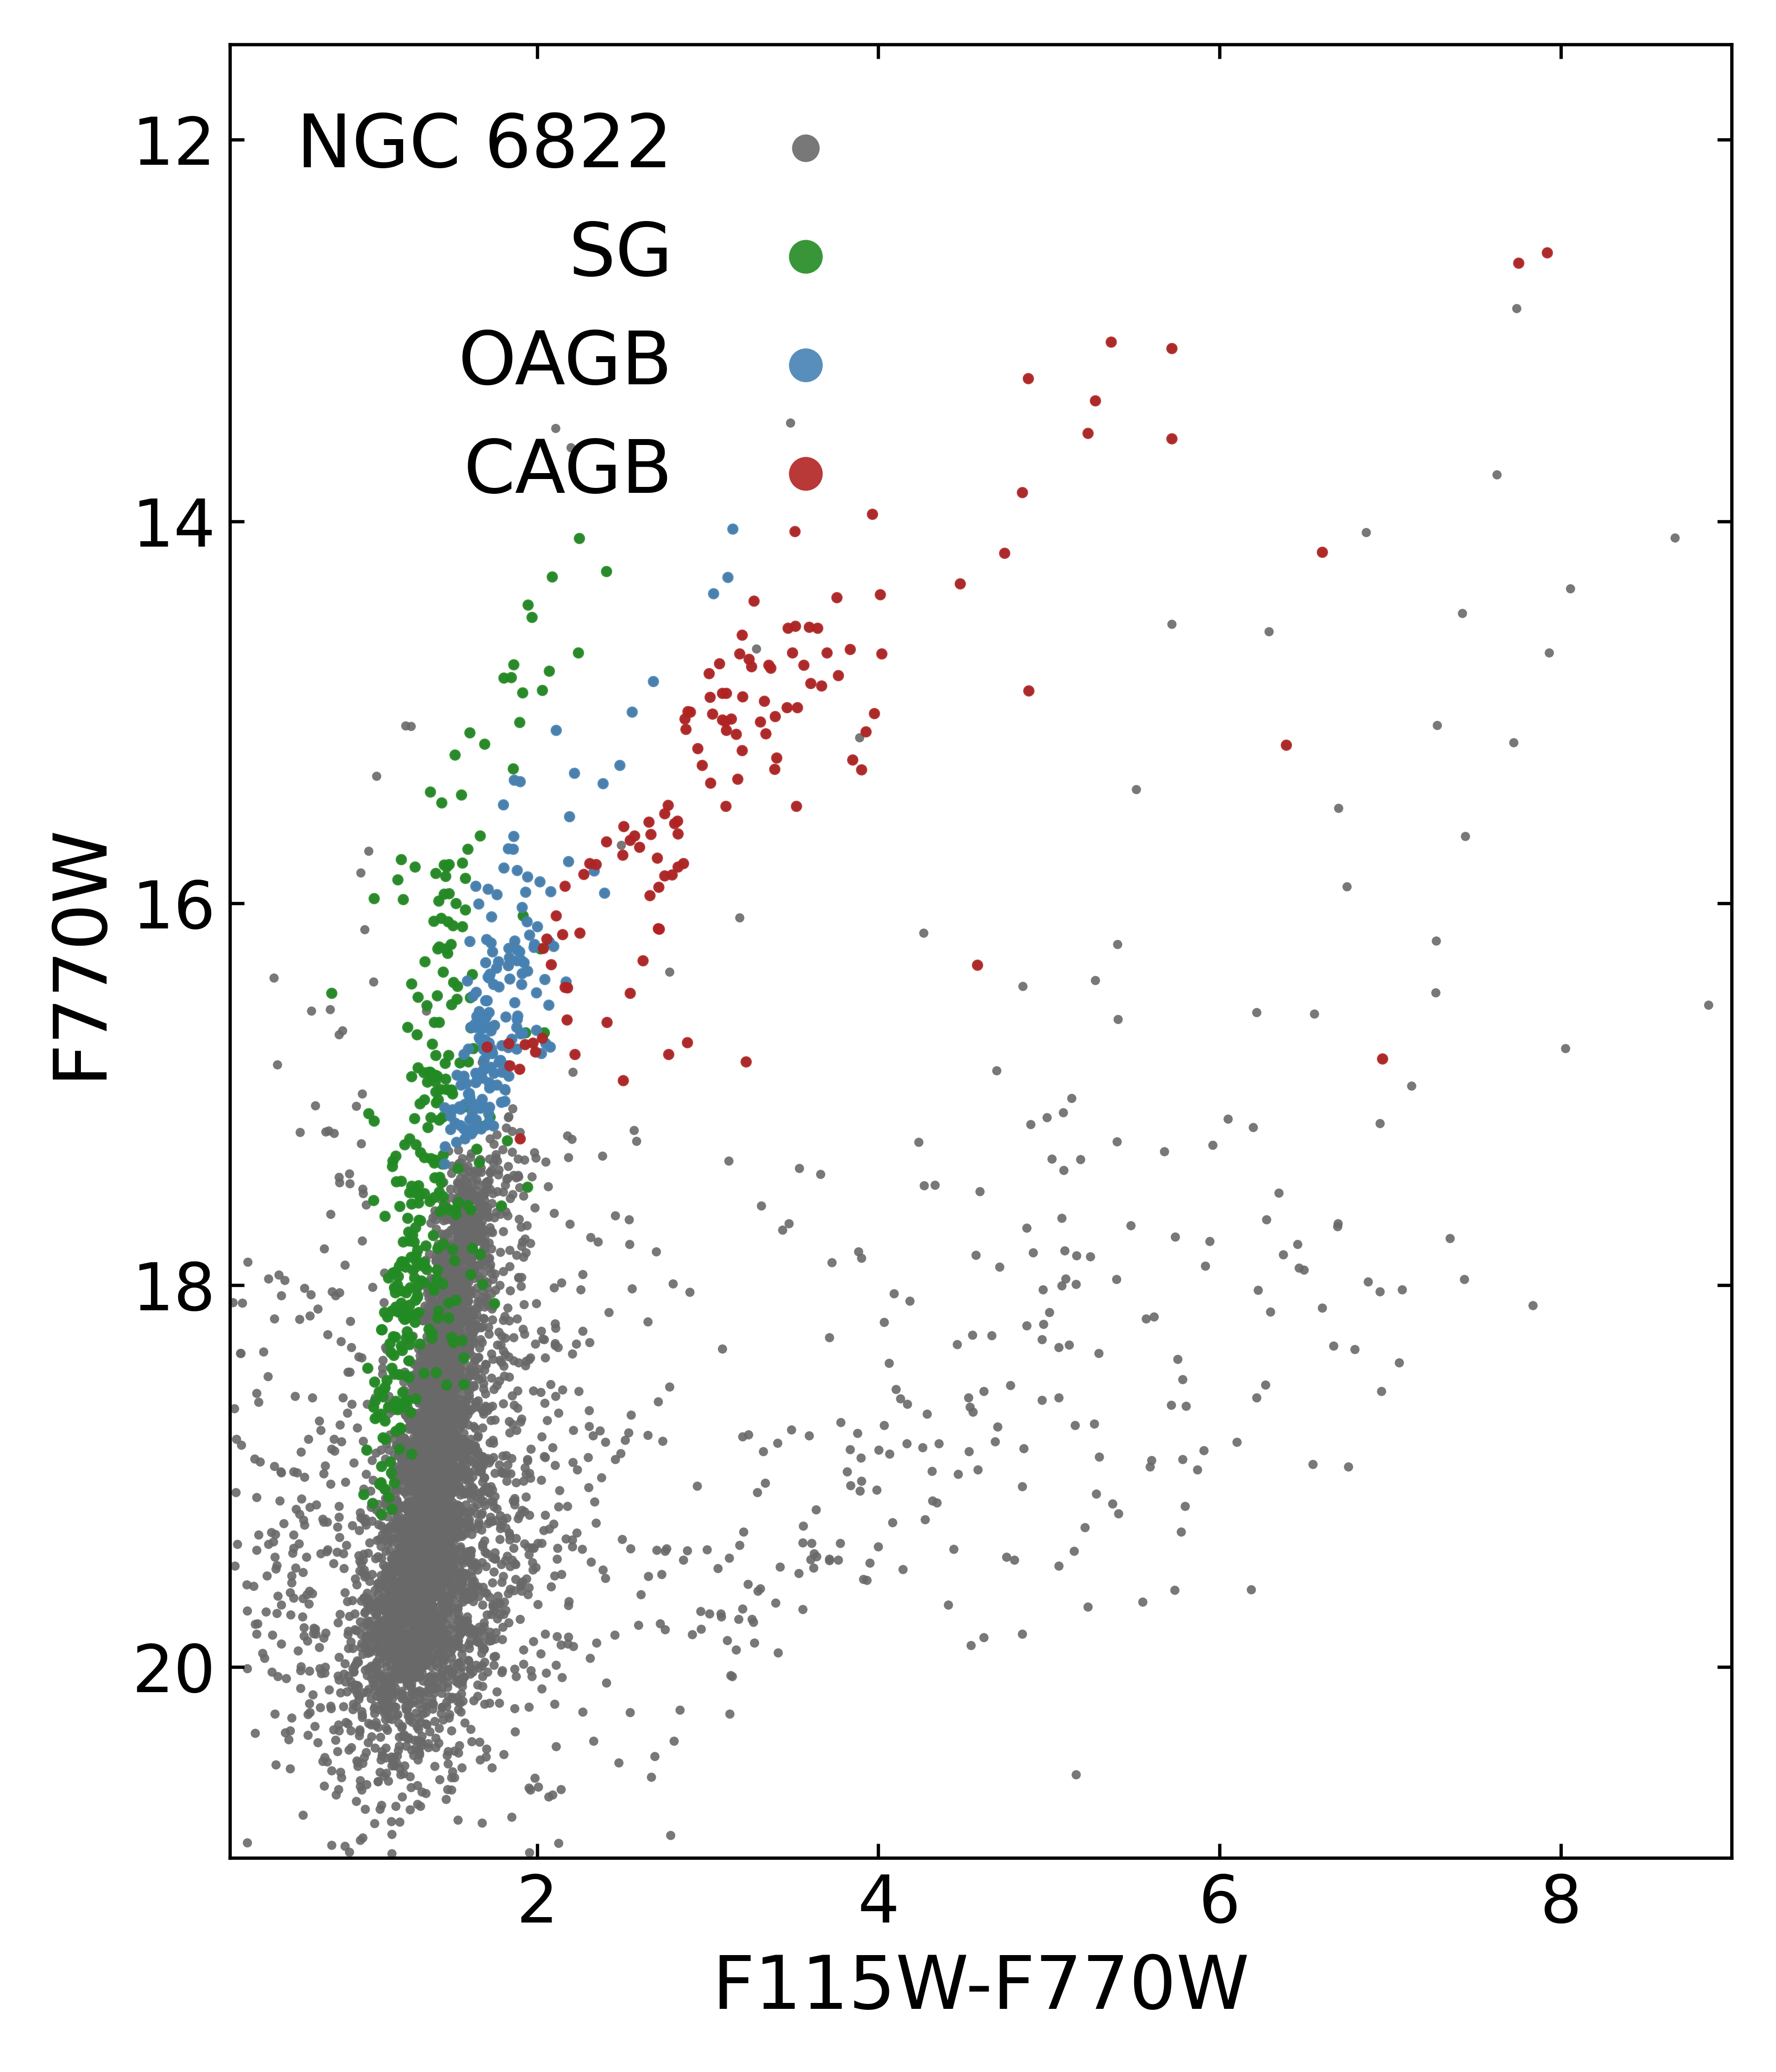
Using the classification schemes defined above, we overlay the sources onto F115WF770W vs. F770W in the second panel of Figure 5. The SGs, OAGBs, and CAGBs are still visible as three distinct populations, although increasing absorption effects caused by dust in the longer wavelengths begin to increase the scatter of the populations. This colour combination separates the CAGBs from the OAGBs, with the bulk of the two populations being separated with nearly one magnitude of colour space between them. This combination holds close comparison with the CMD of the LMC from Blum et al. (2006), where the SGs and CAGBs fork above the bulk of OAGBs; with NIRCam- and MIRI-equivalent filters we see the exact same morphology.
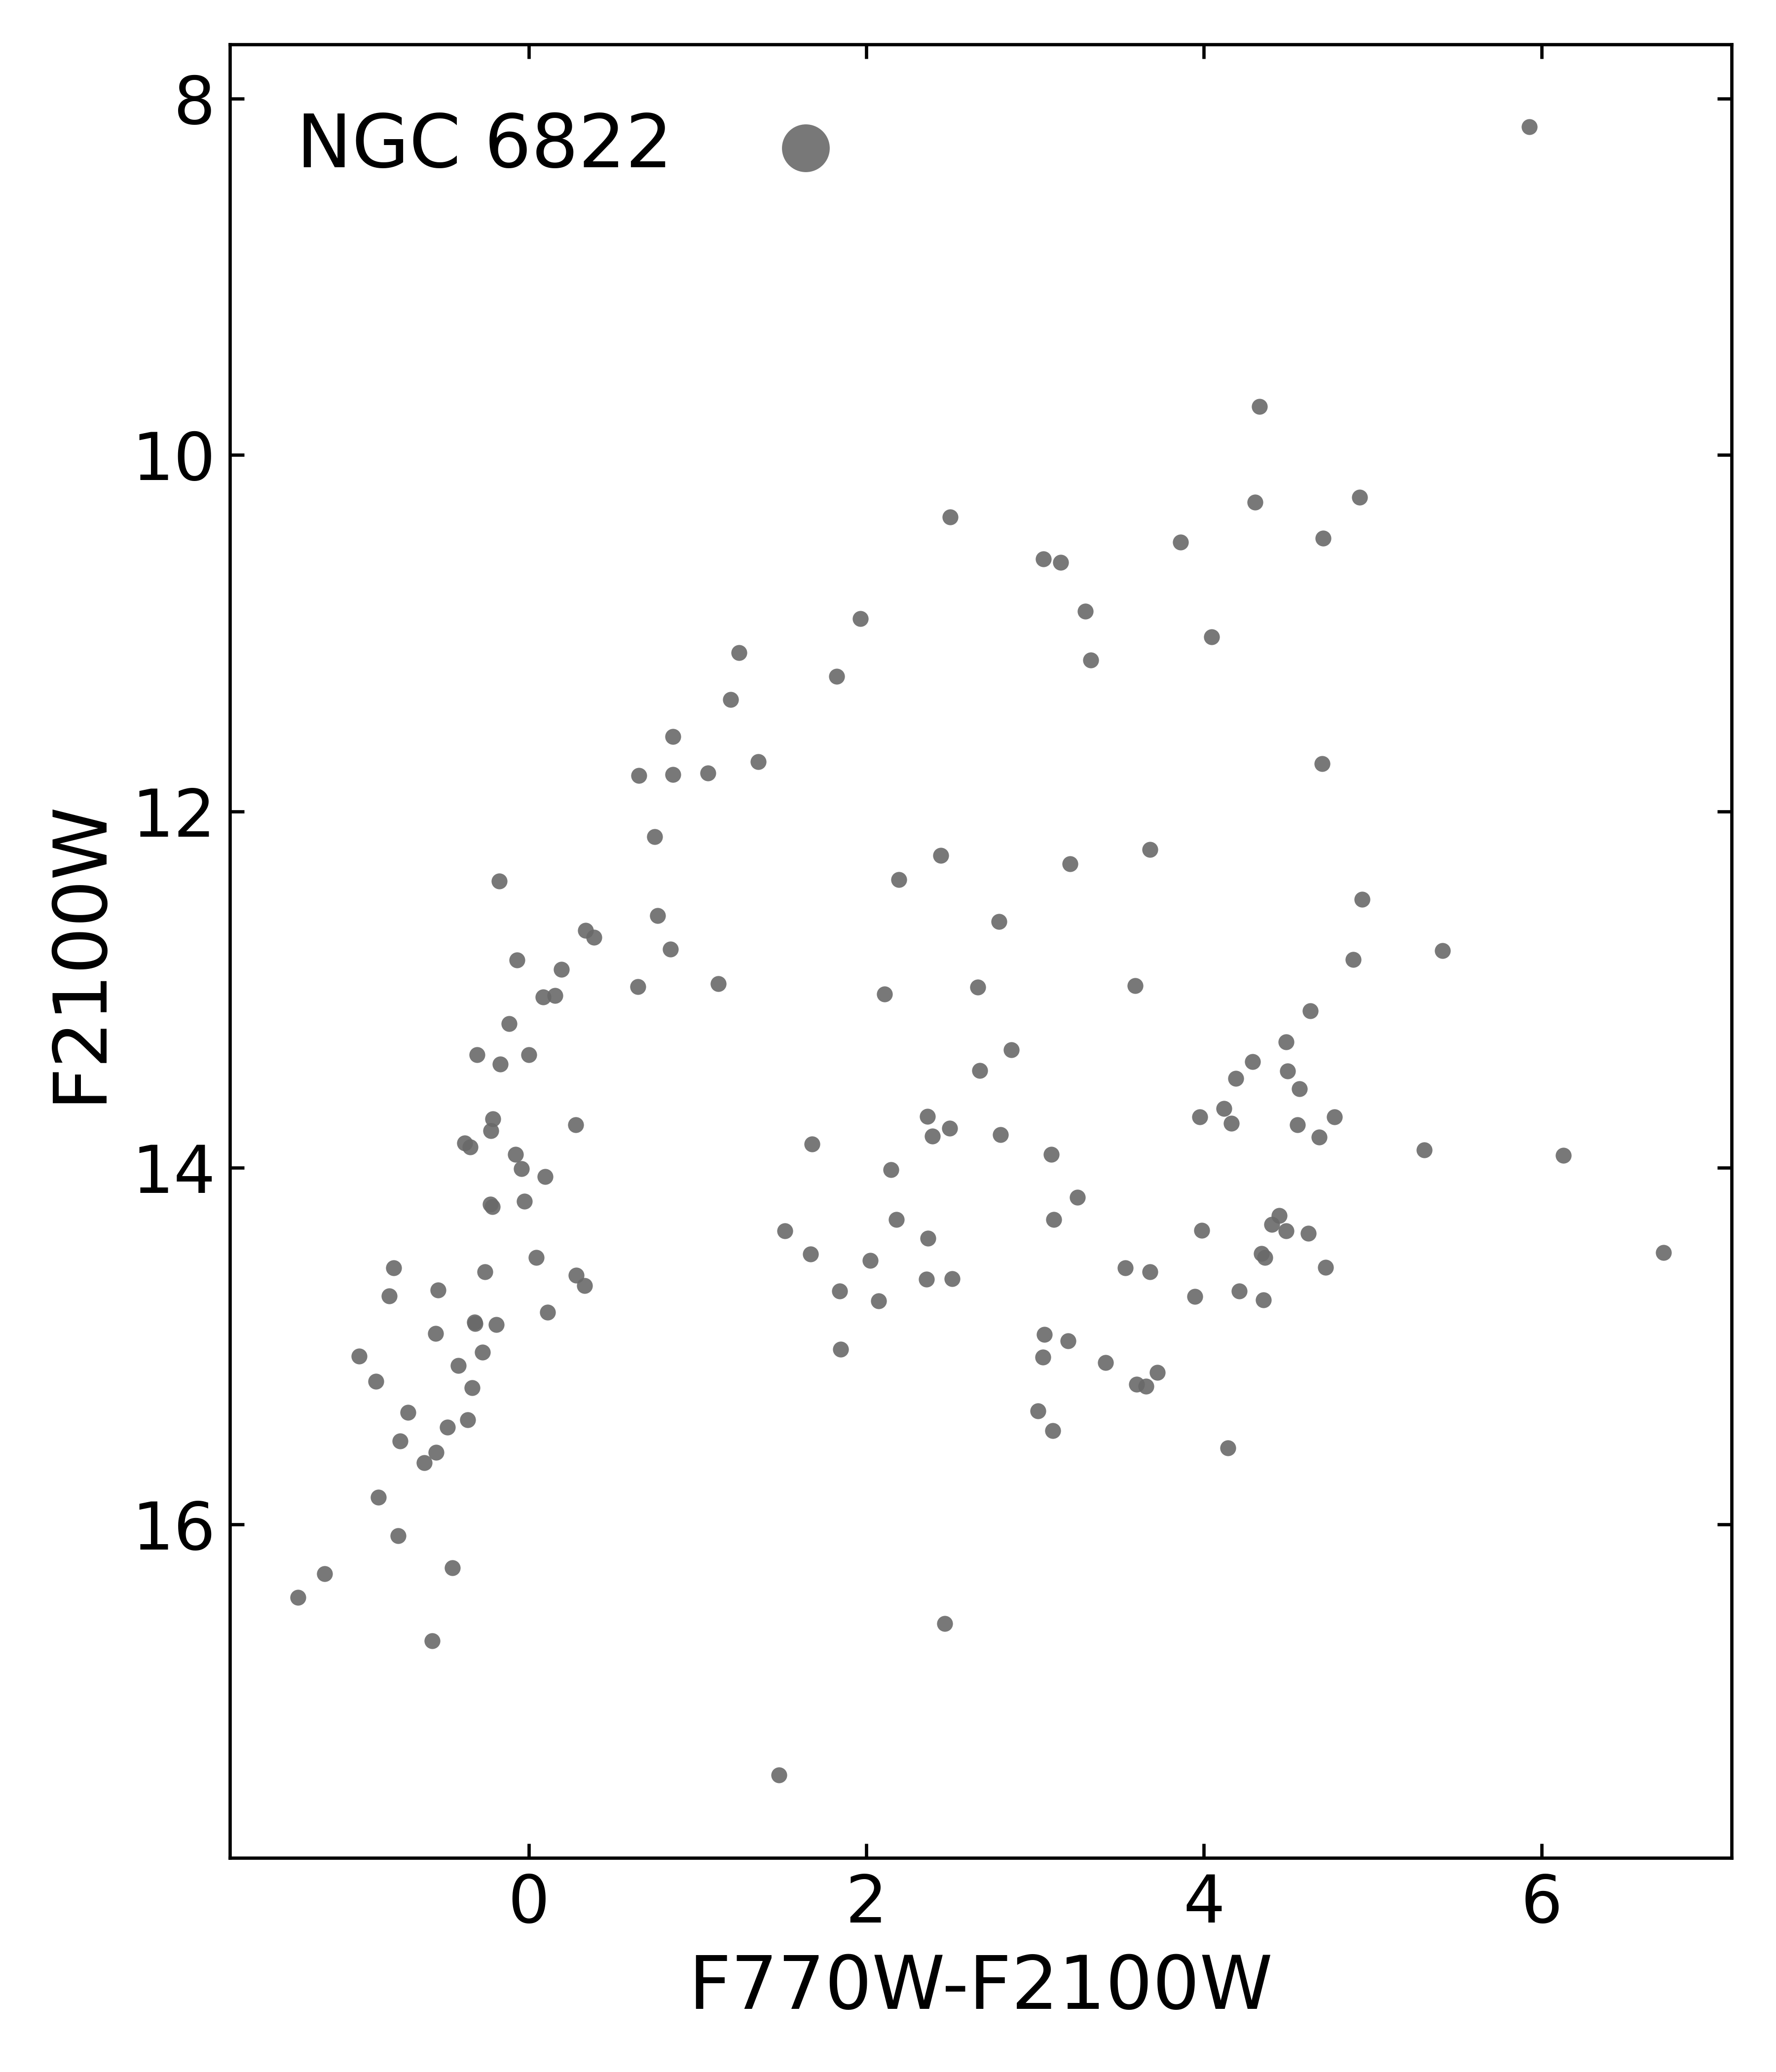
Long-wavelength MIRI photometry is key to chemically separating the most dust-enshrouded sources in our catalogue. The bottom panel of Figure 6 shows the distribution of sources in vs. F2100W, where the source density is very low due to the significant dust presence and rarity of sources which are bright at these wavelengths. The CMD splits into three distinct groups stretching across six magnitudes in colour space. This combination has shown to be analogous to Spitzer vs. in work by Jones et al. (2017), which allows us to draw comparison to SAGE work on the LMC where Srinivasan et al. (2009) demonstrated a triple forking sequence. In their work, CAGB (and extreme-AGBs) lie on the most-luminous and blue finger of the fork, whereas the OAGBs are fainter and more red but bifurcate into two fingers above . Later, Sargent et al. (2011), using the Grid of Red supergiant and Asymptotic giant branch star ModelS (GRAMS) models, showed that the central fork is occupied by the OAGBs exhibiting the highest mass loss as well as some SG stars. Our CMD may be showing the same feature, but, limited by the sensitivity of F2100W, we only see its brightest portions. The small number of sources will require a more detailed investigation than the scope of this work.
4.2.8 Young Stellar Objects
In all filter combinations shown in Figure 4, the YSOs inhabit the red area to the right of the RGB below the CAGB sequence. These dusty objects have characterisable SEDs and Lenkić et al. (2023) identifies 129 YSOs in the Spitzer I region. This area in the CMD is also inhabited by any contaminating background galaxies that remain after the cuts described in Section 3.3 have been applied, but their SED shapes are distinct from that of a YSO and are easily removed from the catalogue.
4.3 Luminosity Functions
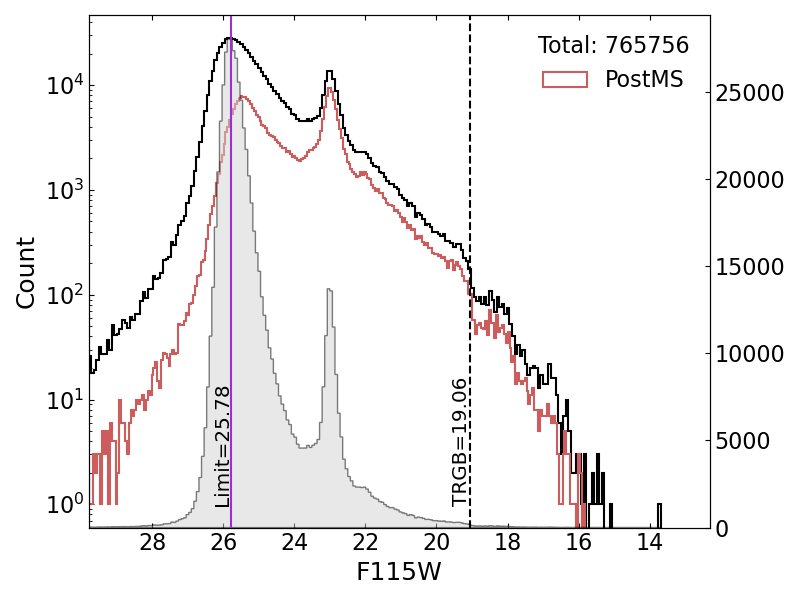
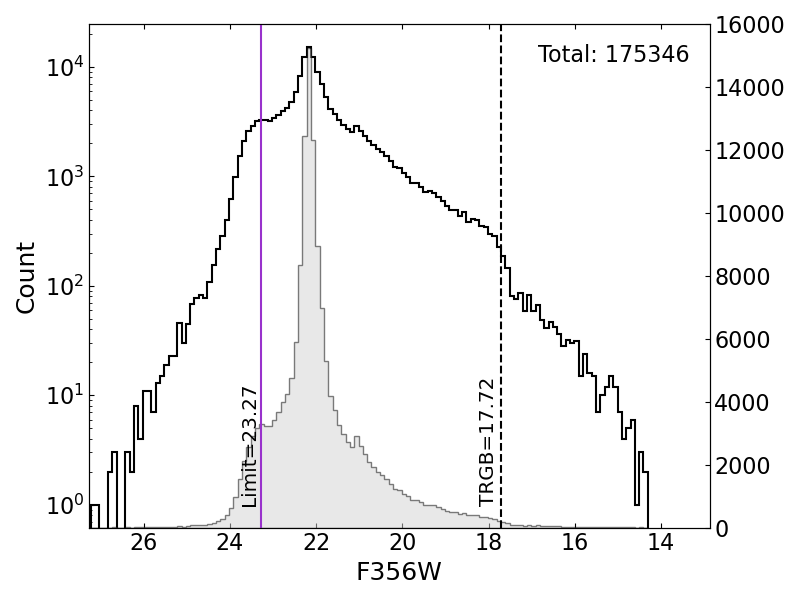
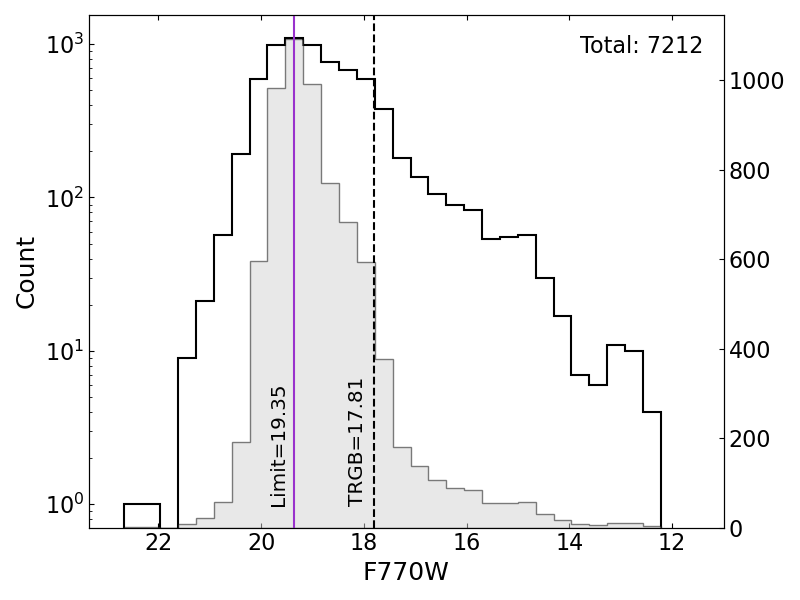
In Figure 7 we present three representative luminosity functions from our full band merged catalogue. The logarithmic scaled distribution is plotted in black and its linearly scaled version is plotted in filled gray. The optimal bin width is calculated for the number of sources present in each case using Knuth’s rule (Knuth, 2006). We crudely estimate the completeness of our sample in each JWST filter by identifying the location of the turnover of the luminosity functions at the faint end of the magnitude distribution for each band.
We measure the TRGB for every filter in our catalogue sensitive enough to detect it. The TRGB is an important feature from an astrophysical perspective as it is a well constrained standard-candle, depending only weakly on age and metallicity (Cioni et al., 2000). It represents the final stage of the RGB for a low mass star before its eventual evolution onto the AGB. This prominent feature is used to separate the RGB stars from the dust producing TP-AGB stars as the majority (90) are situated above the TRGB (Boyer et al., 2015a). Due to molecular emissions in the photosphere of the RGB stars, we expect the TRGB to not be flat but to slope upwards in the IR (e.g., Cerny et al., 2020; Durbin et al., 2020). This results in a less steep drop in a luminosity function than would be expected in the optical, consequently, the TRGB positions measured here are only estimations. To measure the position of the TRGB, we randomly sample a subset of magnitudes from the catalogue and smooth the distribution with a kernel density estimate. The first order derivative of the smoothed distribution is calculated with a Savitizky-Golay filter and the TRGB is located at the point of steepest decline, seen in the differential as a sharp trough. This process is repeated thousands of times with different samples of the catalogue and the results averaged to determine the TRGB. The SED of an RGB star steadily falls with increasing wavelength in the IR and the TRGB is faint in MIRI. We flag F115W TRGB sources, to ensure that the TRGB feature is visible above the noise of the completeness turnover in the mid-IR luminosity functions. We find that the TRGB is measurable up to and including F1000W. Table 4 lists the number of sources detected at each wavelength, the corresponding faint and bright source limits for that filter, and where appropriate, the magnitude of the TRGB.
In F115W we are roughly complete to , around 2.8 magnitudes below the RC population visible at mag. The RC is fairly independent of stellar age and metallicity, and as such they are known to be reasonable standard candles, occupying a tight region in CMD space, deviations from which can be used to derive differential reddening effects within the galaxy. Blue sources on the UMS contaminate the distinctive features in the post-MS luminosity function. Thus we construct a second luminosity function for this filter consisting solely of red objects with . In doing so a new structure is revealed; a shallower slope on the faint side of the RC emerges. The red luminosity function also shows the prominent AGBb (Ferraro et al., 1999) at and the TRGB at . The prominent nature of the position of the TRGB will allow us to constrain the distance to NGC 6822 and improve the understanding of the sloped relation visible in the IR. Above this, we begin to see the AGB form a shoulder to . Saturation affects the completeness of our catalogue at around . This low saturation limit will cause our sample to be less sensitive to the brightest sources detected in JHKs data in previous surveys.
In F356W the bright central peak in the luminosity function at corresponds to the RC. The distribution begins to rise with the increased number of sources at the lower end of the RGB, however sensitivity limits take effect at this point, and as such we place the faint limit at the peak of this shoulder . Above the RC, the small peak of the AGBb is at , from which the smooth decline of the RGB turns over at the TRGB at . The distribution of evolved stars is in steady decline until saturation limits the detections from .
Finally, we present F770W which is limited to , below the TRGB at . The position of the TRGB is uncertain as it is highly affected by the bin sizes due to the low source count; later work will formalise this value. Above the TRGB the AGB population forms a smooth flat shoulder until bright dusty sources peak the distribution just below the saturation limit at .
Overall we see an increase in the lower sensitivity limit as the wavelength of the filter increases and an increase in the upper sensitivity limit, but the range between these limits shrinks. This effect, paired with the low luminosity of the Rayleigh-Jeans tail at these longer wavelengths, causes the source count to drop significantly.
| Filter | Source Count | Faint Limit | Bright Limit | TRGB (error) |
|---|---|---|---|---|
| [VegaMag] | [VegaMag] | [VegaMag] | ||
| F115W | 765756 | 25.78 | 15.3 | 19.06(05) |
| F200W | 539361 | 24.70 | 14.9 | 17.85(13) |
| F356W | 175346 | 23.27 | 14.5 | 17.74(30) |
| F444W | 147328 | 23.06 | 14.0 | 17.65(12) |
| F770W | 7212 | 19.25 | 12.2 | 17.81(04) |
| F1000W | 4782 | 19.98 | 11.5 | 17.48(21) |
| F1500W | 1352 | 16.06 | 10.0 | - |
| F2100W | 269 | 14.43 | 10.0 | - |
4.4 Parallel Field Photometry
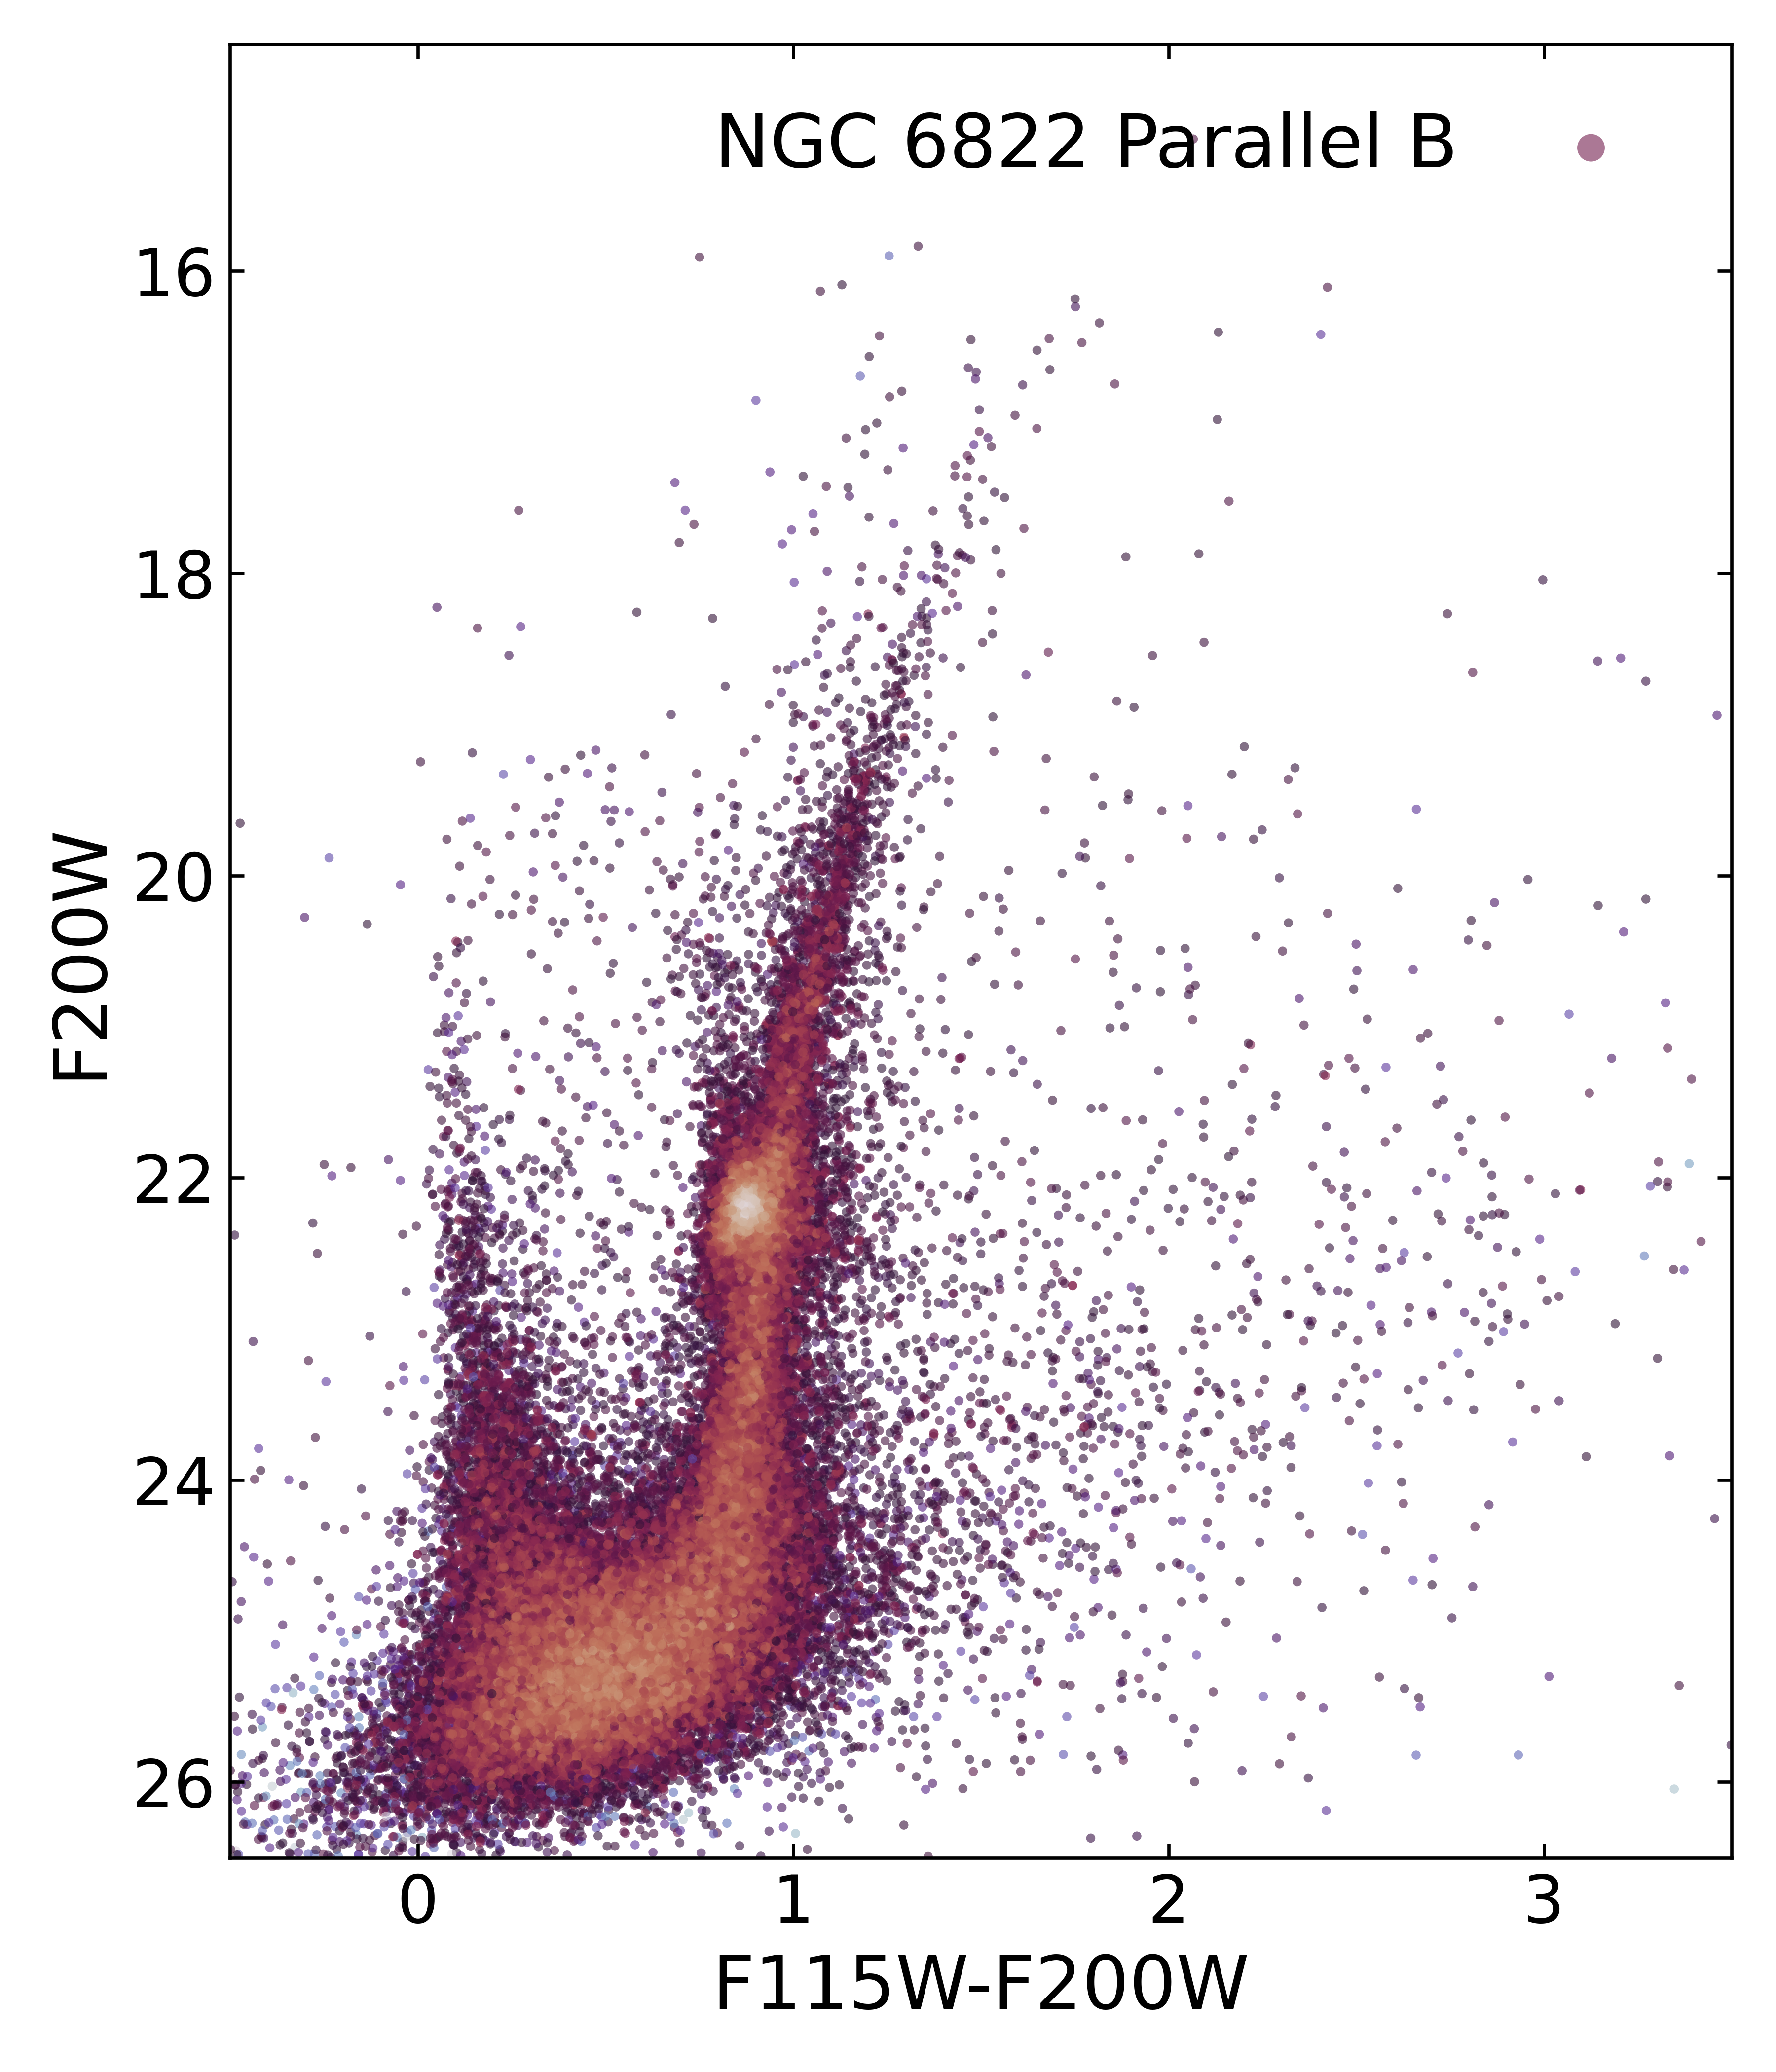
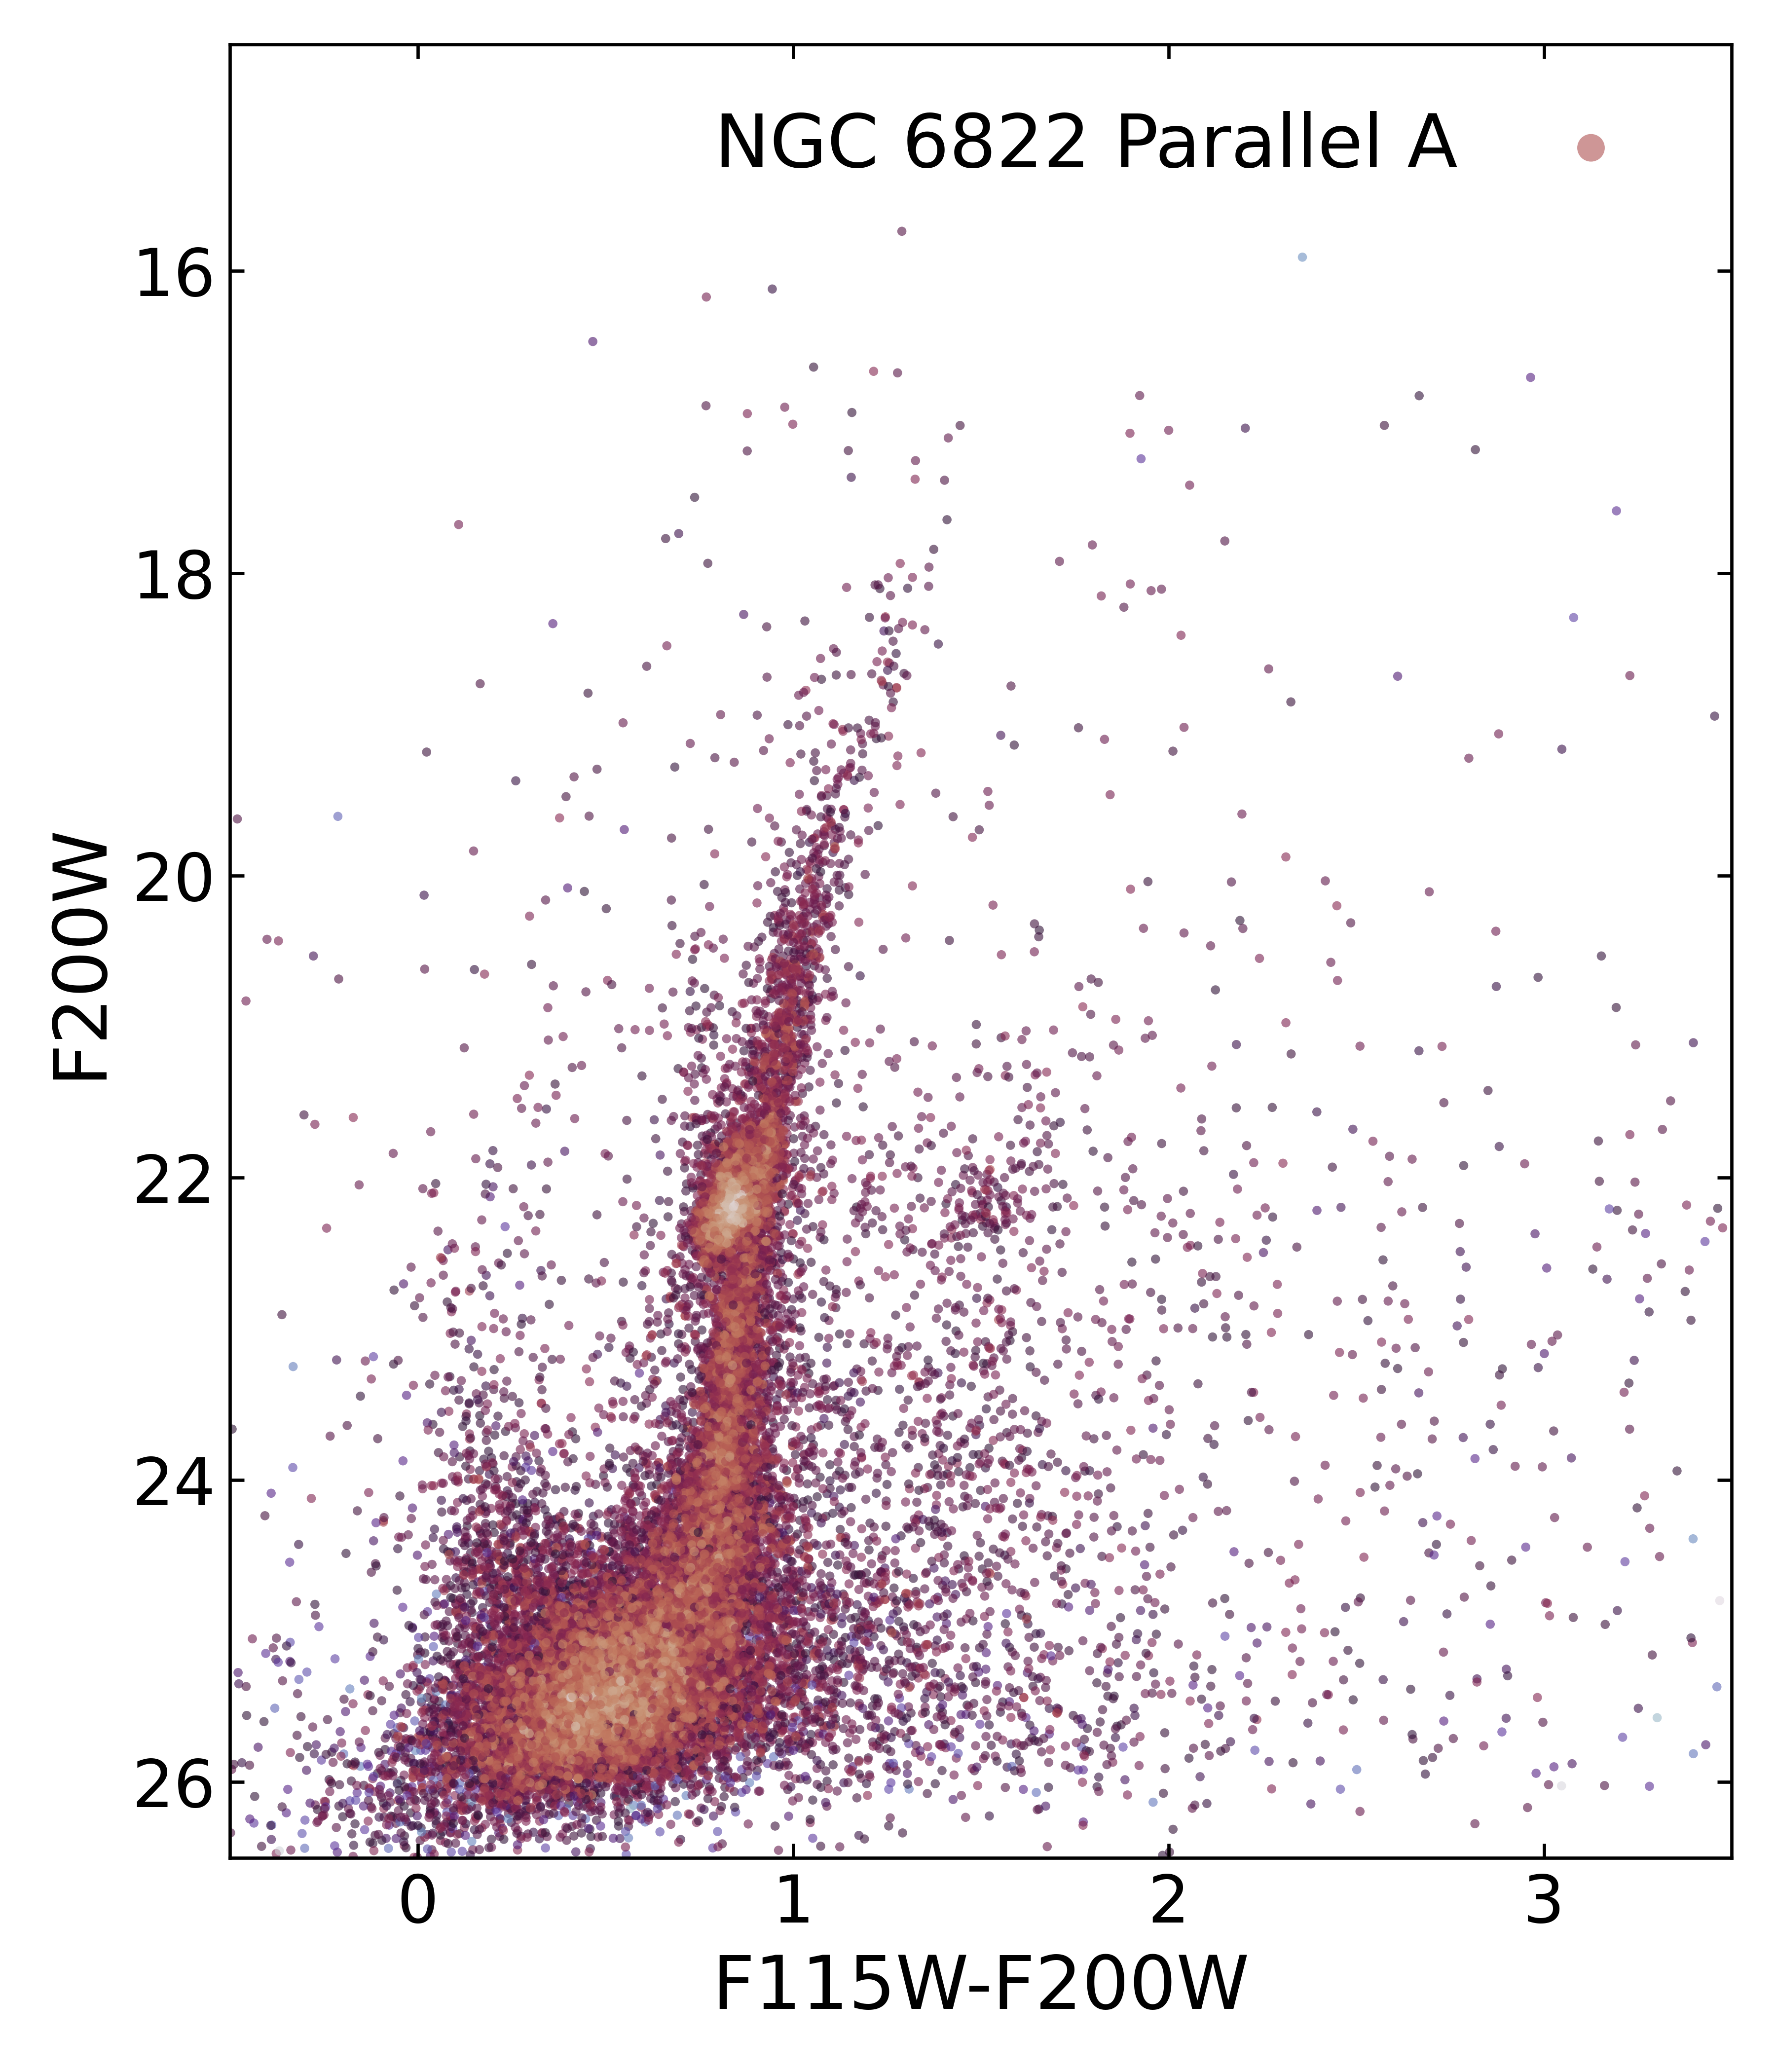
The spatial coverage of the two parallel fields is shown in Figure 1. NIRcam parallel contains the localised star forming region Hubble and NIRCam parallel contains no known areas of active star formation but is contaminated the PSF spikes of a bright off-field foreground star. We conduct photometry for the two NIRCam parallel imaging fields and plot the vs. CMD in Figure 8. starbugii photometric parameters listed in appendix Table 7 are kept the same for consistency across fields.
Both parallels and have source detections approximately 0.5 magnitudes deeper than the main field, likely due to the decreased crowding in the regions. The deeper detection and lower photometric scattering allows us to detect the base of the RGB. This will enable us to constrain the population age range accurately in future work.
NIRCam parallel contains young UMS stars in a tight track on the left of the CMD. The RGB turns off and extends upwards but the TRGB is not well defined. The RC sits prominently out of the RGB to the left and the intermediate-age RHeB track extends vertically from it. A faint track of SG stars splits from the RGB at F200W19 and is well separated from a small collection of AGB stars above the TRGB calculated in Table 4.
NIRCam parallel does not contain many UMS stars beyond a short scattered track above the MSTO. Similarly the RHeB stars are only marginally present and no obvious SG sequence is seen. The relative lack of very young stars is due to there being no active star-forming region in the FoV.
5 Conclusion and Summary
We observed the central stellar bar of NGC 6822, utilizing the spatial resolution and sensitivity afforded by JWST NIRCam and MIRI to characterise the IR stellar populations of this isolated metal-poor dwarf galaxy. Our observations were designed to image the most dust enshrouded stars from evolved TP-AGBs to young YSOs embedded within the super star cluster Spitzer I.
-
We produce initial catalogues with starbugii and estimate the point-source sensitivities for these observations at 25.78 – 14.0 for the NIRCam filters, and 19.25 – 10.0 for the MIRI filters. In both cases, the brightest stars in NGC 6822 are saturated.
-
We estimate positions of the TRGB in NIRCam and MIRI filters up to and including F1000W. The falling SED of RGB stars in IR wavelengths cause the stars to be too faint to detect in our F1500W and F2100W data.
-
We show CMDs of varying colour combinations, using JWST equivalents of UKIRT JHKs and Spitzer filter combinations from previous surveys of NGC 6822 and the Magellanic Clouds to guide the placement of source classifications when pairing NIRCam and MIRI data.
-
We detect a population of carbon- and oxygen rich AGB stars and matching independently classified IR catalogues to determine the boundary between them. They are distinct from one another and separate from a younger SG population also detected.
-
We observe for the first time in the IR, the RC and RHeB populations as well as the illusive and short live AGBb phase and demonstrate the position they inhabit on several CMD colour combinations.
-
Using parallel near-IR imaging of fields outside the central stellar bar of NGC 6822, we show that the young populations are absent or heavily reduced in number, owing to the probable lack of star formation in this area of the galaxy.
Facilities: JWST (NIRCam & MIRI) - James Webb Space Telescope.
Acknowledgements
This work is based on observations made with the NASA/ESA/CSA James Webb Space Telescope. The data were obtained from the Mikulski Archive for Space Telescopes at the Space Telescope Science Institute, which is operated by the Association of Universities for Research in Astronomy, Inc., under NASA contract NAS 5-03127 for JWST. These observations are associated with program #1234. CN acknowledge the support of an STFC studentship. OCJ has received funding from an STFC Webb fellowship. MM and NH acknowledge support through NASA/JWST grant 80NSSC22K0025 and MM and LL acknowledge support from the NSF through grant 2054178. MM and NH acknowledge that a portion of their research was carried out at the Jet Propulsion Laboratory, California Institute of Technology, under a contract with the National Aeronautics and Space Administration (80NM0018D0004). PJK acknowledge support from Science Foundation Ireland/Irish Research Council Pathway programme under Grant Number 21/PATH-S/9360. ASH is supported in part by an STScI Postdoctoral Fellowship.
Data availability
The data used in this study may be obtained from the Mikulski Archive for Space Telescopes (MAST; https://mast.stsci.edu/) and are associated with program #1234.
References
- Algera et al. (2023) Algera H. S. B., et al., 2023, MNRAS, 518, 6142
- Aringer et al. (2016) Aringer B., Girardi L., Nowotny W., Marigo P., Bressan A., 2016, MNRAS, 457, 3611
- Astropy Collaboration et al. (2013) Astropy Collaboration et al., 2013, A&A, 558, A33
- Baldacci et al. (2003) Baldacci L., Clementini G., Held E. V., Rizzi L., 2003, Mem. Soc. Astron. Italiana, 74, 860
- Battinelli et al. (2006) Battinelli P., Demers S., Kunkel W. E., 2006, A&A, 451, 99
- Beelen et al. (2006) Beelen A., Cox P., Benford D. J., Dowell C. D., Kovács A., Bertoldi F., Omont A., Carilli C. L., 2006, ApJ, 642, 694
- Bertoldi et al. (2003) Bertoldi F., Carilli C. L., Cox P., Fan X., Strauss M. A., Beelen A., Omont A., Zylka R., 2003, A&A, 406, L55
- Blum et al. (2006) Blum R. D., et al., 2006, AJ, 132, 2034
- Boyer et al. (2011) Boyer M. L., et al., 2011, AJ, 142, 103
- Boyer et al. (2012) Boyer M. L., et al., 2012, ApJ, 748, 40
- Boyer et al. (2015a) Boyer M. L., et al., 2015a, ApJS, 216, 10
- Boyer et al. (2015b) Boyer M. L., et al., 2015b, ApJ, 800, 51
- Bradley et al. (2022) Bradley L., et al., 2022, astropy/photutils: 1.5.0, doi:10.5281/zenodo.6825092, https://doi.org/10.5281/zenodo.6825092
- Cannon et al. (2006) Cannon J. M., et al., 2006, ApJ, 652, 1170
- Cardelli et al. (1989) Cardelli J. A., Clayton G. C., Mathis J. S., 1989, ApJ, 345, 245
- Carrera et al. (2008) Carrera R., Gallart C., Hardy E., Aparicio A., Zinn R., 2008, AJ, 135, 836
- Cerny et al. (2020) Cerny W., Freedman W. L., Madore B. F., Ashmead F., Hoyt T., Oakes E., Quang Hoang Tran N., Moss B., 2020, arXiv e-prints, p. arXiv:2012.09701
- Cioni & Habing (2005) Cioni M. R. L., Habing H. J., 2005, A&A, 429, 837
- Cioni et al. (2000) Cioni M. R. L., van der Marel R. P., Loup C., Habing H. J., 2000, A&A, 359, 601
- Clementini et al. (2003) Clementini G., Held E. V., Baldacci L., Rizzi L., 2003, ApJ, 588, L85
- Dimitrova et al. (2021) Dimitrova T., Neugent K., Levesque E., Massey P., 2021, in American Astronomical Society Meeting Abstracts. p. 548.08
- Dohm-Palmer et al. (1997) Dohm-Palmer R. C., et al., 1997, AJ, 114, 2527
- Durbin et al. (2020) Durbin M. J., Beaton R. L., Dalcanton J. J., Williams B. F., Boyer M. L., 2020, ApJ, 898, 57
- Fabricius et al. (2021) Fabricius C., et al., 2021, A&A, 649, A5
- Ferraro (1992) Ferraro F. R., 1992, Mem. Soc. Astron. Italiana, 63, 491
- Ferraro et al. (1999) Ferraro F. R., Messineo M., Fusi Pecci F., de Palo M. A., Straniero O., Chieffi A., Limongi M., 1999, AJ, 118, 1738
- Fusco et al. (2012) Fusco F., Buonanno R., Bono G., Cassisi S., Monelli M., Pietrinferni A., 2012, A&A, 548, A129
- Gaia Collaboration et al. (2021) Gaia Collaboration et al., 2021, A&A, 649, A1
- Gallart (1998) Gallart C., 1998, ApJ, 495, L43
- Gallart et al. (1996) Gallart C., Aparicio A., Bertelli G., Chiosi C., 1996, AJ, 112, 2596
- Gáspár et al. (2021) Gáspár A., et al., 2021, PASP, 133, 014504
- Goldman et al. (2019) Goldman S. R., et al., 2019, ApJ, 877, 49
- Gordon et al. (2011) Gordon K. D., et al., 2011, AJ, 142, 102
- Hirschauer et al. (2020) Hirschauer A. S., Gray L., Meixner M., Jones O. C., Srinivasan S., Boyer M. L., Sargent B. A., 2020, ApJ, 892, 91
- Hodge et al. (1989) Hodge P., Lee M. G., Kennicutt Robert C. J., 1989, PASP, 101, 32
- Jones et al. (2015) Jones O. C., McDonald I., Rich R. M., Kemper F., Boyer M. L., Zijlstra A. A., Bendo G. J., 2015, MNRAS, 446, 1584
- Jones et al. (2017) Jones O. C., Meixner M., Justtanont K., Glasse A., 2017, ApJ, 841, 15
- Jones et al. (2018) Jones O. C., Maclay M. T., Boyer M. L., Meixner M., McDonald I., Meskhidze H., 2018, ApJ, 854, 117
- Jones et al. (2019) Jones O. C., Sharp M. J., Reiter M., Hirschauer A. S., Meixner M., Srinivasan S., 2019, MNRAS, 490, 832
- Jones et al. (2023) Jones O. C., et al., 2023, Nature Astronomy, 7, 694
- Kennicutt (1979) Kennicutt R. C. J., 1979, ApJ, 228, 394
- Kinson et al. (2021) Kinson D. A., Oliveira J. M., van Loon J. T., 2021, MNRAS, 507, 5106
- Kinson et al. (2022) Kinson D. A., Oliveira J. M., van Loon J. T., 2022, MNRAS, 517, 140
- Knuth (2006) Knuth K. H., 2006, arXiv e-prints, p. physics/0605197
- Lee et al. (2006) Lee H., Skillman E. D., Venn K. A., 2006, ApJ, 642, 813
- Lenkić et al. (2023) Lenkić L., et al., 2023, arXiv e-prints, p. arXiv:2307.15704
- Madau & Dickinson (2014) Madau P., Dickinson M., 2014, ARA&A, 52, 415
- McDonald et al. (2010) McDonald I., van Loon J. T., Dupree A. K., Boyer M. L., 2010, MNRAS, 405, 1711
- McDonald et al. (2011) McDonald I., et al., 2011, ApJS, 193, 23
- McQuinn et al. (2017) McQuinn K. B. W., et al., 2017, ApJ, 834, 78
- Meixner et al. (2006) Meixner M., et al., 2006, AJ, 132, 2268
- Nally & Jones (2022) Nally C., Jones O., 2022, Starbug2, https://github.com/conornally/starbug2
- O’Dell et al. (1999) O’Dell C. R., Hodge P. W., Kennicutt Robert C. J., 1999, PASP, 111, 1382
- Patrick et al. (2015) Patrick L. R., Evans C. J., Davies B., Kudritzki R. P., Gazak J. Z., Bergemann M., Plez B., Ferguson A. M. N., 2015, ApJ, 803, 14
- Perrin et al. (2014) Perrin M. D., Sivaramakrishnan A., Lajoie C.-P., Elliott E., Pueyo L., Ravindranath S., Albert L., 2014, in Oschmann Jacobus M. J., Clampin M., Fazio G. G., MacEwen H. A., eds, Society of Photo-Optical Instrumentation Engineers (SPIE) Conference Series Vol. 9143, Space Telescopes and Instrumentation 2014: Optical, Infrared, and Millimeter Wave. p. 91433X, doi:10.1117/12.2056689
- Potter et al. (2004) Potter C., Habing H. J., Olofsson H., 2004, Journal of the British Astronomical Association, 114, 168
- Rest (2023) Rest A., 2023, JWST/HST Alignment Tool, https://github.com/arminrest/jhat
- Rieke et al. (2005) Rieke M. J., Kelly D., Horner S., 2005, in Heaney J. B., Burriesci L. G., eds, Society of Photo-Optical Instrumentation Engineers (SPIE) Conference Series Vol. 5904, Cryogenic Optical Systems and Instruments XI. pp 1–8, doi:10.1117/12.615554
- Rieke et al. (2015) Rieke G. H., et al., 2015, PASP, 127, 584
- Rieke et al. (2023) Rieke M. J., et al., 2023, PASP, 135, 028001
- Robson et al. (2004) Robson I., Priddey R. S., Isaak K. G., McMahon R. G., 2004, MNRAS, 351, L29
- Sargent et al. (2011) Sargent B. A., Srinivasan S., Meixner M., 2011, ApJ, 728, 93
- Sibbons et al. (2012) Sibbons L. F., Ryan S. G., Cioni M. R. L., Irwin M., Napiwotzki R., 2012, A&A, 540, A135
- Skillman et al. (1989) Skillman E. D., Terlevich R., Melnick J., 1989, MNRAS, 240, 563
- Sloan et al. (2012) Sloan G. C., et al., 2012, ApJ, 752, 140
- Sloan et al. (2016) Sloan G. C., et al., 2016, ApJ, 826, 44
- Srinivasan et al. (2009) Srinivasan S., et al., 2009, AJ, 137, 4810
- Tantalo et al. (2022) Tantalo M., et al., 2022, The Astrophysical Journal, 933, 197
- Taylor (2005) Taylor M. B., 2005, in Shopbell P., Britton M., Ebert R., eds, Astronomical Society of the Pacific Conference Series Vol. 347, Astronomical Data Analysis Software and Systems XIV. p. 29
- Tolstoy et al. (2001) Tolstoy E., Irwin M. J., Cole A. A., Pasquini L., Gilmozzi R., Gallagher J. S., 2001, MNRAS, 327, 918
- Whitelock et al. (2013) Whitelock P. A., Menzies J. W., Feast M. W., Nsengiyumva F., Matsunaga N., 2013, MNRAS, 428, 2216
- Whitelock et al. (2018) Whitelock P. A., Menzies J. W., Feast M. W., Marigo P., 2018, MNRAS, 473, 173
- Whitney et al. (2008) Whitney B. A., et al., 2008, AJ, 136, 18
- Willott (2022) Willott C., 2022, jwst - Tools for processing and analyzing JWST data, https://github.com/chriswillott/jwst
- Wyder (2001) Wyder T. K., 2001, AJ, 122, 2490
- Zhang et al. (2021) Zhang S., Mackey D., Da Costa G. S., 2021, MNRAS, 508, 2098
- de Blok & Walter (2000) de Blok W. J. G., Walter F., 2000, ApJ, 537, L95
- van Loon et al. (2005) van Loon J. T., Marshall J. R., Zijlstra A. A., 2005, A&A, 442, 597
Appendix A Observational and Photometric Tables
| Filter | Field | Readout Pattern | Groups/Int. | Int./Exp. | Dithers | Total Exp. Time |
| [sec] | ||||||
| F115W | NIRCam Prime | bright2 | 7 | 1 | 12 | 1803.777 |
| F200W | NIRCam Prime | bright2 | 7 | 1 | 12 | 1803.777 |
| F356W | NIRCam Prime | bright2 | 7 | 1 | 12 | 1803.777 |
| F444W | NIRCam Prime | bright2 | 7 | 1 | 12 | 1803.777 |
| F140M | NIRCam Parallel | shallow4 | 8 | 1 | 4 | 1674.936 |
| F335M | NIRCam Parallel | shallow4 | 8 | 1 | 4 | 1674.936 |
| F115W | NIRCam Parallel | shallow2 | 3 | 1 | 4 | 515.365 |
| F150W | NIRCam Parallel | shallow2 | 4 | 1 | 4 | 730.100 |
| F200W | NIRCam Parallel | shallow4 | 4 | 1 | 4 | 815.995 |
| F277W | NIRCam Parallel | shallow2 | 4 | 1 | 4 | 730.100 |
| F356W | NIRCam Parallel | shallow2 | 3 | 1 | 4 | 515.365 |
| F444W | NIRCam Parallel | shallow4 | 4 | 1 | 4 | 815.995 |
| Filter | Field | Readout Pattern | Groups/Int. | Int./Exp. | Dithers | Total Exp. Time |
| [sec] | ||||||
| F770W | MIRI Prime | fastr1 | 52 | 1 | 4 | 577.208 |
| F1000W | MIRI Prime | fastr1 | 36 | 2 | 4 | 810.312 |
| F1500W | MIRI Prime | fastr1 | 15 | 8 | 4 | 1409.72 |
| F2100W | MIRI Prime | fastr1 | 20 | 9 | 4 | 2086.83 |
| F1000W | MIRI Parallel | slowr1 | 5 | 1 | 12 | 1433.395 |
| F1500W | MIRI Parallel | slowr1 | 5 | 1 | 12 | 1433.395 |
| Parameter | F115W | F200W | F356W | F444W | F770W | F1000W | F1500W | F2100W |
|---|---|---|---|---|---|---|---|---|
| SIGSRC | 5.0 | 5.0 | 5.0 | 5.0 | 3.0 | 3.0 | 3.0 | 3.0 |
| SIGSKY | 2.0 | 2.0 | 2.0 | 2.0 | 1.5 | 1.5 | 1.3 | 1.3 |
| RICKER_R | 1.0 | 1.0 | 1.0 | 1.0 | 1.0 | 2.0 | 5.0 | 5.0 |
| SHARP_LO | 0.4 | 0.4 | 0.55 | 0.4 | 0.3 | 0.25 | 0.2 | 0.2 |
| SHARP_HI | 1.1 | 0.9 | 0.9 | 0.85 | 0.9 | 0.8 | 0.8 | 0.7 |
| ROUND_LO/HI | ||||||||
| APPHOT_R | 1.5 | 1.5 | 1.5 | 1.5 | 2.5 | 2.5 | 3.0 | 3.0 |
| SKY_RIN | 3.0 | 3.0 | 3.0 | 3.0 | 4.0 | 4.0 | 4.5 | 4.5 |
| SKY_ROUT | 4.5 | 4.5 | 4.5 | 4.5 | 5.5 | 5.5 | 6.0 | 6.0 |
| BOX_SIZE | 15 | 15 | 5 | 5 | 2 | 5 | 5 | 8 |
| CRIT_SEP | 5 | 6 | 8 | 8 | 8 | 8 | 8 | 8 |
| MATCH_THRESH | 0.1 | 0.1 | 0.1 | 0.1 | 0.15 | 0.2 | 0.2 | 0.2 |
| NEXP_THRESH | 2 | 2 | 2 | 2 | 3 | 3 | 3 | 3 |