New insights in the bubble wall of NGC 3324: intertwined sub-structures and a bipolar morphology uncovered by JWST
Abstract
We report the discovery of intertwined/entangled sub-structures towards the bubble wall of NGC 3324 below a physical scale of 4500 AU, which is the sharp edge/ionization front/elongated structure traced at the interface between the H ii region and the molecular cloud. The sharp edge appears wavy in the Spitzer 3.6–8.0 m images (resolution 2′′). Star formation signatures have mostly been traced on one side of the ionization front, which lies on the molecular cloud’s boundary. The James Webb Space Telescope’s (JWST) near- and mid-infrared images (resolution 0.′′07 – 0.′′7) are employed to resolve the sharp edge, which has a curvature facing the exciting O-type stars. The elongated structures are associated with the 3.3 m polycyclic aromatic hydrocarbon (PAH) emission, the 4.05 m ionized emission, and the 4.693 m H2 emission. However, the PAH-emitting structures are depicted between the other two. The H2 emission reveals numerous intertwined sub-structures which are not prominently traced in the 3.3 m PAH emission. The separation between two sub-structures in the H2 emission is 1.′′1 or 2420 AU. The intertwined sub-structures are traced in the spatial areas associated with the neutral to H2 transition zone, suggesting the origin of these structures by “thin-shell” instability. Furthermore, an arc-like feature traced in the Spitzer 3.6–8.0 m images is investigated as a bipolar H ii region (extent 0.35 pc) at Td 25–28 K using the JWST images. A massive star candidate VPHAS-OB1 #03518 seems to be responsible for the bipolar H ii region.
1 Introduction
The space-based infrared and sub-millimeter (sub-mm) observations obtained with the Spitzer and Herschel facilities have revealed bubbles (e.g., Churchwell et al., 2006, 2007) and filaments (e.g., André et al., 2010, 2014; Motte et al., 2018) as the major structures in star-forming regions. Several previous studies favour the involvement of these structures in the ongoing physical processes of star formation (e.g., Deharveng et al., 2010; Kumar et al., 2020). Such observed structures are extensively examined to study the origin of massive OB-stars (M∗ 8 M⊙) and their feedback processes, which are the open research topics in the study of star formation (e.g., Zinnecker & Yorke, 2007; Tan et al., 2014; Motte et al., 2018; Rosen et al., 2020). Now, the availability of high-resolution and high sensitivity data from James Webb Space Telescope (JWST) provides us a unique opportunity to obtain more insights into physical processes operating in massive star-forming regions (e.g., Pontoppidan et al., 2022). One of the science cases of the JWST111https://webbtelescope.org is to study the anatomy of Photodissociation Regions (PDRs) surrounding the H ii regions. The JWST images, combined with the sub-mm and radio data sets, can be utilized to probe the molecular zone, the dissociation front, the ionization front, the compressed structure, and the fully ionized flow of gas toward the edge of an H ii region (see Berné et al., 2022). In this work, we have revisited the publicly available JWST near-infrared (NIR) and mid-infrared (MIR) images toward the boundary or bubble wall of a nearby young, star-forming region NGC 3324 (or cosmic cliffs NGC 3324; e.g., Pitts et al., 2019; Reiter et al., 2022). These JWST data are part of the public outreach products obtained through the JWST Early Release Observations (EROs).
1.1 Cosmic cliffs NGC 3324
Situated at a distance of 2.2 kpc (Göppl & Preibisch, 2022; Pontoppidan et al., 2022; Reiter et al., 2022), NGC 3324 has a bubble-like appearance (e.g., Smith et al., 2010; Duronea et al., 2015; Reiter et al., 2022). Two O-type stars, HD 92206 and CPD57∘3580 (see Reiter et al., 2022, and references therein) have been reported as the major ionizing sources of NGC 3324 (see Figure 6a in Appendix A). The selected site in this work (i.e., the bubble rim or NGC 3324 field; see boxes in Figure 6a) is a part of NGC 3324, where pillar-like structures have been reported (see Figure 1c in Reiter et al., 2022). The bubble rim in NGC 3324 has the sharpest ionization boundary/front (see Smith et al., 2010; Duronea et al., 2015; Pontoppidan et al., 2022). Using various observational data sets, several studies have been performed toward NGC 3324 (e.g., Smith et al., 2010; Ohlendorf et al., 2013; Preibisch et al., 2014; Duronea et al., 2015; Zeidler et al., 2016; Pitts et al., 2019). Most recently, using the JWST infrared data, Reiter et al. (2022) reported several outflows including molecular hydrogen objects (MHOs) and Herbig-Haro (HH) flows in the NGC 3324 field, and many of these outflows are traced near the ionization front (see their paper for more details). It is thought that star formation activity or the presence of a population of actively accreting young stars/young stellar objects (YSOs) in the NGC 3324 field has been affected by feedback from the O-type stars (e.g., Reiter et al., 2022).
Using the JWST Near-Infrared Camera (NIRCam; Rieke et al., 2005; Beichman et al., 2012) and Mid-Infrared Instrument (MIRI; Rieke et al., 2015; Wright et al., 2015) images (resolution 0.′′07 – 0.′′7), on a small physical scale ( 4500 AU), there has been no attempt made to examine the H2 emission and the polycyclic aromatic hydrocarbon (PAH) emission toward the ionization front in NGC 3324. Additionally, there is no study reported to probe embedded structures (such as bubbles/shells, pillar-like features, and small-scale sub-structures) and their role in the ongoing physical processes in the direction of the NGC 3324 field. In this context, we employed ratio and continuum-subtracted maps created from the JWST images to study various emission components (i.e., molecular, atomic, and ionized emission) down to physical scale of 4500 AU, allowing us to probe ongoing physical processes in the NGC 3324 field.
2 Data sets
This paper uses several publicly available data sets at different wavelengths (see Table 1). A large-scale area studied in this paper has an extent of 8.′5 9.′8 (central coordinates: = 10h36m43.s25; = 5837′12.′′82; see a solid box in Figure 6a).
We used the Hubble Space Telescope (HST222https://archive.stsci.edu/missions-and-data/hst/) F658N image (Proposal ID: 10475; PI: Smith, Nathan) taken with the Wide-Field Channel (WFC) of the Advanced Camera for Surveys (ACS). In the direction of our target site, the level-3 science ready JWST333https://archive.stsci.edu/missions-and-data/jwst ERO NIRCam and MIRI images (program ID #2731; PI: Pontoppidan) were downloaded from the MAST archive. One can also find more details of JWST performance in Rigby et al. (2023). More details about these JWST data sets are given in Reiter et al. (2022).
The Herschel dust temperature map444http://www.astro.cardiff.ac.uk/research/ViaLactea/ (resolution 12′′) is explored in this work, which were produced for the EU-funded ViaLactea project (Molinari et al., 2010a) using the Herschel continuum images at 70–500 m (Molinari et al., 2010b) and the Bayesian PPMAP procedure (Marsh et al., 2015, 2017).
| Survey/facility | Wavelength/ | Resolution | Reference |
|---|---|---|---|
| Frequency/line(s) | () | ||
| Sydney University Molonglo Sky Survey (SUMSS) | 843 MHz | 45 | Bock et al. (1999) |
| The Galactic Census of High and Medium-mass Protostars (CHaMP) | 13CO (J = 1–0) | 37 | Barnes et al. (2011, 2018) |
| Herschel Infrared Galactic Plane Survey (Hi-GAL) | 70, 160, 250, 350, 500 m | 5.8–37.0 | Molinari et al. (2010b) |
| JWST ERO MIRI F770W, F1130W, F1280W, F1800W imaging facility | 7.7, 11.3, 12.8, 18 m | 0.44–0.70 | Rieke et al. (2015); Wright et al. (2015) |
| Spitzer Galactic Legacy Infrared Mid-Plane Survey Extraordinaire (GLIMPSE) | 3.6, 4.5, 5.8, 8.0 m | 2 | Benjamin et al. (2003); GLIMPSE Team (2020) |
| JWST ERO NIRCam Long Wavelength (LW) F335M, F444W, F470N imaging facility | 3.365, 4.421, 4.707 m | 0.17 | Rieke et al. (2005); Beichman et al. (2012) |
| JWST ERO NIRCam Short Wavelength (SW) F090W, F187N, F200W imaging facility | 0.901, 1.874, 1.99 m | 0.07 | Rieke et al. (2005); Beichman et al. (2012) |
| Hubble Space Telescope (HST) ACS/WFC F658N imaging facility | 6563 Å+ 6583 Å | 0.067–0.156 | Smith et al. (2010) |
3 Results
A large-scale view of NGC 3324 is presented in Figure 6a (see Appendix A). In Figures 6a–6d, the distribution of ionized emission, molecular gas, and YSOs is examined in the direction of cosmic cliffs NGC 3324.
3.1 Multi-scale view of cosmic cliffs NGC 3324: intertwined sub-structures
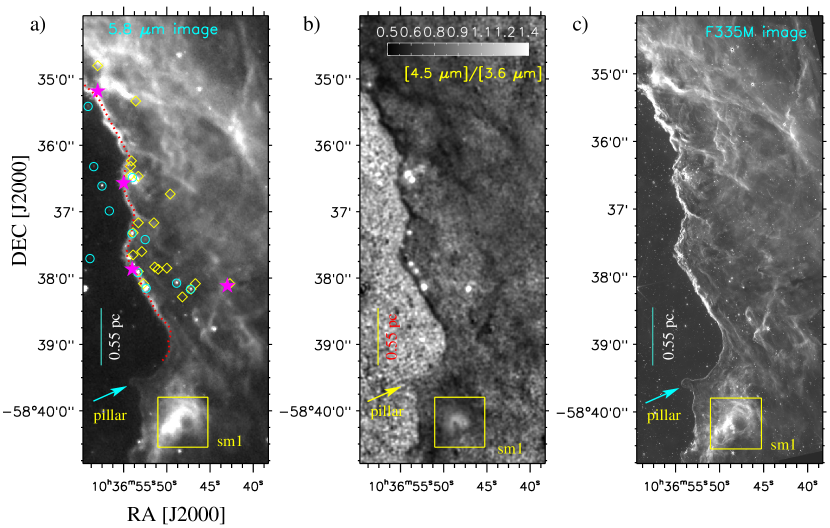
Figure 1a presents the Spitzer 5.8 m image of the bubble rim. The visual inspection of the Spitzer map displays the ionization front (or a sharp edge of the cavity within NGC 3324), and its footprint is also indicated by a dotted curve (in red) in Figure 1a. The positions of the previously identified candidate driving sources for the H2 outflows (from Reiter et al., 2022) and the YSOs (from Kuhn et al., 2021) are also marked in Figure 1a (see also Appendix A). The sharp edge has a filamentary appearance, and appears wavy. Massive 870 m dust continuum clumps ( 200 M⊙; Duronea et al., 2015) are distributed toward this elongated and sharp edge. The positions of these clumps are also shown by filled stars in Figure 1a. From the edge-on view, it appears that we see the sharp or narrow boundary, but from the face-on view, it might just be a sheet.
A small region labeled as “sm1” is indicated by a solid box in Figure 1a, where an interesting arc-like feature with dust temperature (Td) of 25–28 K is evident. The values of Td are obtained from the examination of the publicly available Herschel dust temperature map (see Appendix A for more details).
Using the Spitzer 3.6 m-band (/: 3.55/0.75 m) and 4.5 m-band (/: 4.49/1.0 m) images, Figure 1b presents a ratio map of 4.5 m/3.6 m emission for the same area as presented in Figure 1a. The ratio map allows to separate the features of 4.5 m and 3.6 m emission as bright and dark areas, respectively. One can find more details about this ratio map in Dewangan et al. (2016b, 2017). A prominent molecular hydrogen line emission ( = 0–0 (9); 4.693 m) and a hydrogen recombination line Br (4.05 m) are covered by the Spitzer 4.5 m band. The Spitzer 3.6 m band encompasses a strong PAH emission at 3.3 m, which originates from the PDRs. The sharp edge or the sharp ionization front is found with the excess 3.6 m emission (see dark gray/black areas). Several bright areas having the excess 4.5 m emission are detected close to the ionization front, where noticeable YSOs and dust clumps are distributed (see Figure 1a). In the direction of the arc-like feature (see the small region “sm1” in Figure 1a), the excess 4.5 m emission (see bright areas) is traced.
In Figure 1c, we have examined the sharp edge of the cavity within NGC 3324 using the NIRCam image (at JWST F335M). One can compare different wavelength images of the sharp edge in Figure 1. In particular, the JWST F335M image is used to probe sub-structures of the features seen in the Spitzer image (see the sharp edge and the region “sm1”). One can also find noticeable sub-structures toward wavy structures as appeared in Figures 1a and 1b.
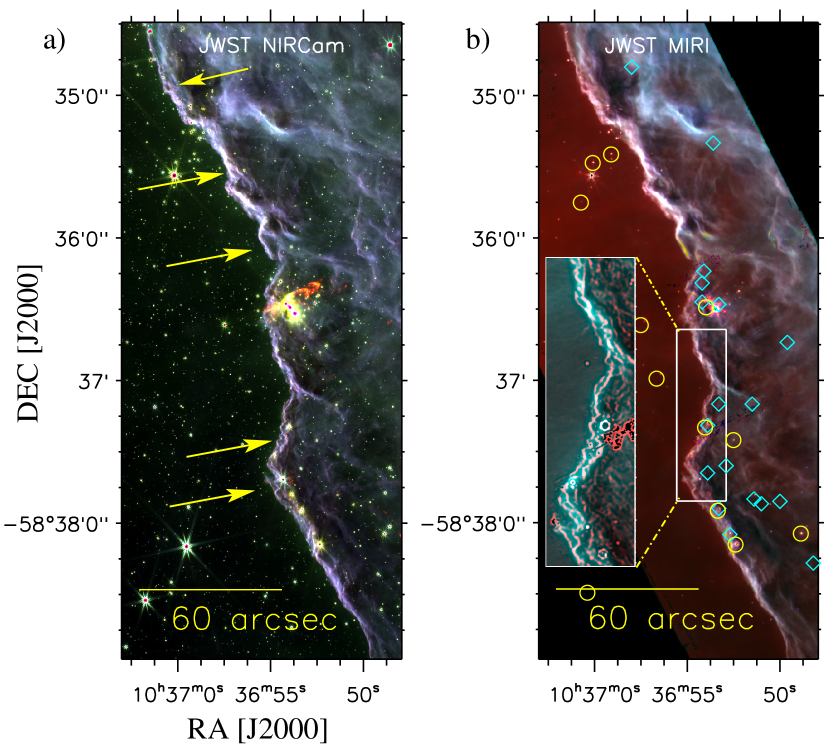
The JWST NIRCam and MIRI images are presented in Figure 2. One can note that the coverage of NIRCam and MIRI instruments was taken into consideration while choosing the area shown in Figure 2, which does not cover the area containing the small region “sm1” as presented in Figure 1. Figure 2a displays a three-color composite map derived using the JWST F470N (in red), F444W (in green), and F335W (in blue) images. The F470N F444W image has been used to trace the 4.693 m continuum subtracted H2 emission (e.g., Reiter et al., 2022). Hence, noticeable outflow signatures depicted in the narrow band F470N (/: 4.707/0.051 m) image are clearly evident as red color features in Figure 2a, which have been thoroughly discussed in Reiter et al. (2022). The JWST NIRCam images (including the F470N F444W image) reveal the presence of two sub-structures toward the sharp edge of the cavity within NGC 3324, which also seem to overlap each other at many places. Hence, such configuration indicates the presence of intertwined sub-structures or double helical-like structures (see arrows in Figure 2a).
In Figure 2b, we display a three-color composite map produced using the F1800W (in red), F1130W (in green), and F770W (in blue) images. The locations of previously reported YSOs and candidate driving sources for the H2 outflows are also presented in Figure 2b. The intertwined configuration is also evident in the JWST MIRI images as seen in the JWST NIRCam images. In order to further examine the intertwined sub-structures, we processed the JWST F1800 image with an edge detection algorithm (i.e., “Edge-DoG” filter), which uses the technique of Difference of Gaussians filters (e.g., Assirati et al., 2014). The inset of Figure 2b is a two-color composite map produced using the “Edge-DoG” processed JWST F1800 image (in red) and the JWST F1800 image (in turquoise), clearly shows the twisting/coupling of sub-structures (or intertwined sub-structures). Although this color composite map is produced for a small area as highlighted by a box in Figure 2b, similar features can be traced for the entire sharp edge of NGC 3324. This is a new finding and its implication is discussed in Section 4.
3.2 Molecular, neutral, and ionized emission toward intertwined sub-structures
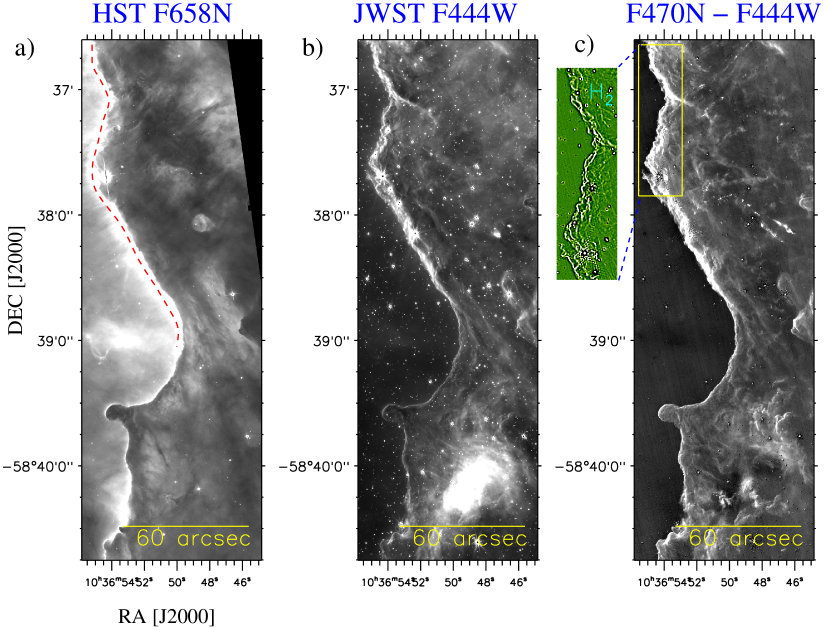
Figure 3a displays the HST F658N image, which is compared with the JWST images (i.e., F444W and (F470N F444W); see Figures 3b and 3c). The HST F658N filter transmits both H ( 6563 Å) and [NII] ( 6583 Å) emission (Smith et al., 2010). The resolution of the HST F658N image is equivalent to that of the JWST NIRCam SW images, and is better than the spatial resolution of the JWST NIRCam LW images (see Table 1).
Interestingly, a noticeable elongated bright emission was seen toward the sharp ionization front in the HST F658N image. We have found that the elongated emission traced in the HST F658N image spatially matches with the location of the elongated radio continuum emission as detected in the SUMSS 843 MHz radio continuum map (see Figure 6c in Appendix A). Note that we do not find any sub-structures in the HST F658N image (see Figure 3a). The twisting of sub-structures associated with the H2 emission is presented in the inset of Figure 3c, which is the JWST (F470N F444W) image exposed to the “Edge-DoG” algorithm. In general, the H2 molecules get excited by the UV/far-UV (FUV) photons or mechanical heating by shocks (i.e., from outflows, expanding H ii regions, and stellar winds), which results in the FUV-fluorescence H2 emission in a given star-forming region (e.g., Jo et al., 2017). We have examined the extent of the previously reported H2 outflows (from Reiter et al., 2022) in the JWST (F470N F444W) image (see Figure 3c), which do not match with our highlighted H2 structures. Hence, the filamentary appearance of the H2 emission is unlikely to be explained by outflow driven shocks. Therefore, the H2 emission associated with the sub-structures seems to be excited by the UV/FUV heating by ionizing sources of NGC 3324.
The NIRCam F187N, NIRCam F444W, MIRI F1280W, and MIRI F1800W filters contain the 1.87 m Pa- hydrogen recombination line, the 4.05 m Br hydrogen recombination line, the 12.81 m [NeII] line, and the 18.7 m [SIII] line, respectively, enabling us to trace the ionized emission. The NIRCam F335M, MIRI F770W, and MIRI F1130W bands cover the 3.3, 7.7, and 11.3 m PAH features, respectively (Tielens, 2008). Using the JWST NIRCam F444W (/: 4.421/1.024 m) and F335M (/: 3.365/0.347 m) images, we have produced the ratio map of F444W/F335M, which may allow us to probe the 3.3 m PAH feature (via dark gray/black areas). It is supported with the fact that the JWST NIRCam F444W filter does not contain the 3.3 m PAH feature. Bright areas in this JWST ratio map show regions with the prominent 4.05 m Br feature and/or the 4.693 m H2 emission (see also the interpretation of the Spitzer ratio map in Section 3.1). We can readily locate the regions with the 4.05 m Br emission in the JWST ratio map by taking into account the areas with the 4.693 m H2 emission detected in the JWST F470N F444W image.
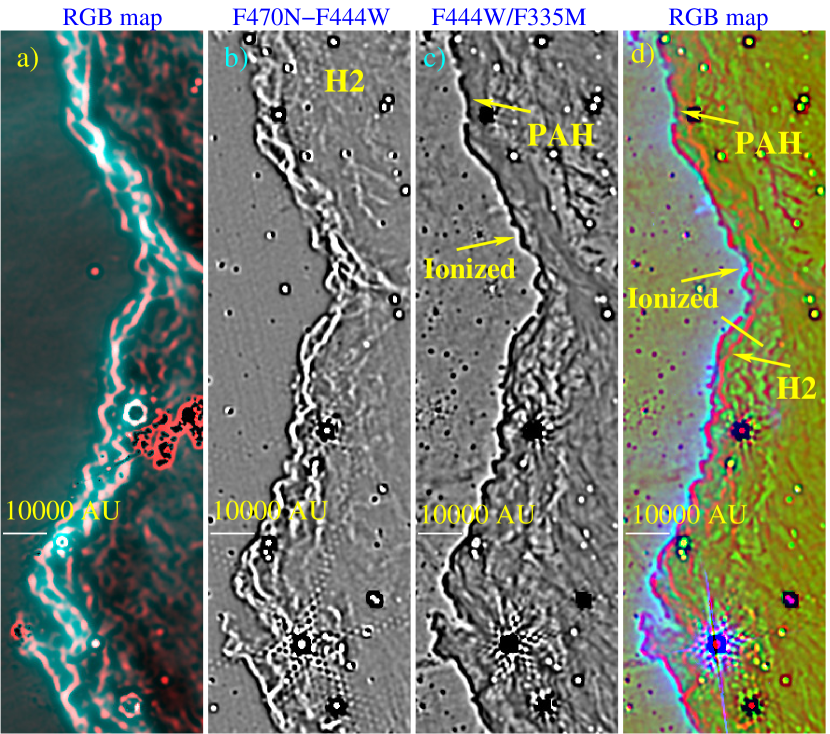
We present Figure 4 to trace different emission components towards the sharp ionization front. Figure 4a shows a two-color composite map, which is the same as presented in the inset of Figure 2b. In Figure 4b, we display the JWST (F470N F444W) image, which is exposed to the “Edge-DoG” algorithm (Figure 3c). Figure 4c presents the “Edge-DoG” processed F444W/F335M image, enabling us to depict the PAH emission (dark areas) and the 4.05 m Br emission (bright areas). Figures 4a and 4b are shown here only for a comparison purpose. The intertwined configuration is not very clearly seen in the “Edge-DoG” processed F444W/F335M image, which also seems to reveal the PAH (or neutral) emission and the Br (or ionized) emission to be in close proximity to each other.
In Figure 4d, we produce a three-color composite map (“Edge-DoG” processed F470NF444W image (in red), “Edge-DoG” processed F444W/F335M image (in green), and HST F658N image (in blue)). In these two “Edge-DoG” processed images, to examine the spatial locations of the PAH and H2 emission, emission/brightness profiles (not shown here) are also produced along a solid line (in yellow) marked in Figure 4d. The HST F658N bright emission spatially coincides with the 4.05 m Br emission. The true boundary of the PDR is traced by H2 emission and PAH emission, where the UV light is absorbed. More details of these outcomes are discussed in Section 4.
3.3 Discovery of a bipolar morphology in the region “sm1”
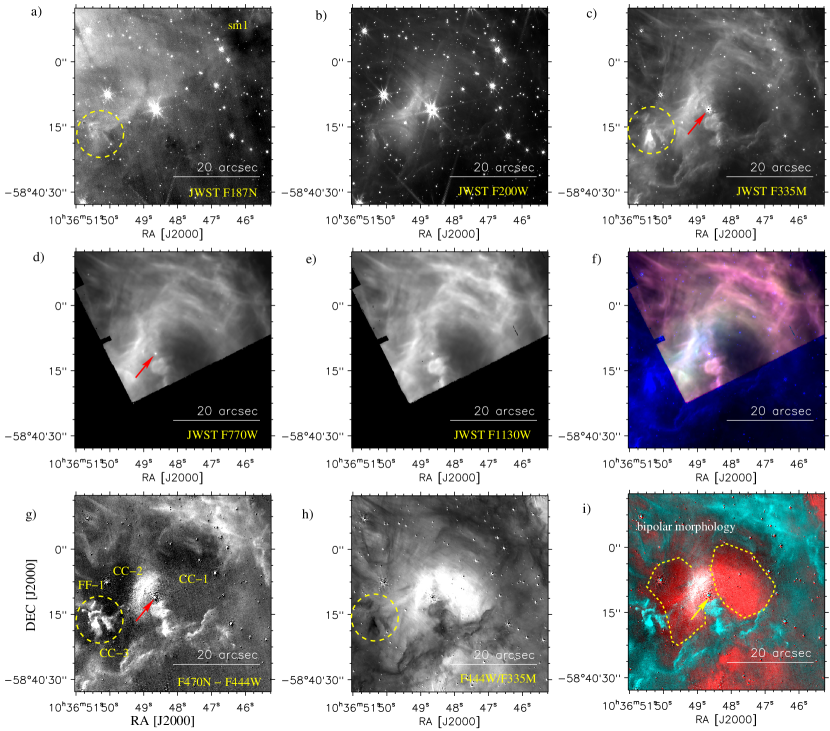
In the direction of the region “sm1”, the JWST images at different wavelengths are presented in Figures 5a–5e, respectively. As highlighted earlier (see Figure 1a), the Spitzer and Herschel images of “sm1” reveal an arc-like feature with the excess 4.5 m emission and the warm dust emission (Td 25–28 K; see Figure 6). Using the JWST NIRCam and MIRI images, Figure 5f displays a three-color composite map (F1130W (in red), F770W (in green), and F335W (in blue) images) to examine the locations of the PAH emission. Note that the entire selected area of “sm1” is not covered by the JWST MIRI images. Figures 5g and 5h show the F470NF444W and F444W/F335M images, respectively. In Figure 5i, a two-color composite map (F444W/F335M (in red) and F470NF444W (in turquoise) images) is presented, where the position of an OB-star candidate (UCAC4 157-048728 or VPHAS-OB1 #03518; from Mohr-Smith et al., 2017) is also indicated by an arrow (see also Figures 5c and 5d).
The presence of H2 emission is depicted in the F470NF444W image (see Figure 5g). On the basis of a visual assessment, at least three H2 depression regions (i.e, CC-1, CC-2, and CC-3) are identified in Figure 5g, and are surrounded by the H2 emission. Additionally, we have also marked one prominent structure in the JWST NIRCam images (see a broken circle in panels of Figure 5), which is found with the intense H2 emission (see also Figure 5g). In particular, the region CC-1 is very prominently seen in the longer wavelength images ( 2 m), appearing like a bubble feature. The distance of the massive star candidate UCAC4 157-048728 or VPHAS-OB1 #03518 toward “sm1” is about 2.3 pc (Bailer-Jones et al., 2018), suggesting its association with our target region. The position of UCAC4 157-048728 is not seen at the centre of any H2 depression regions (see an arrow in Figure 5g). Based on the published results of the Spitzer MIR bubbles hosting H ii regions, the exciting source or massive star is anticipated to be located near the centre of the bubbles (e.g., Churchwell et al., 2006, 2007; Deharveng et al., 2010). Hence, considering the locations of CC-2, CC-3, and the candidate massive star, we avoid proposing CC-1 as a bubble. In the direction of our selected area “sm1”, we do not find any locations of the molecular outflows (see diamonds in Figure 1a). Hence, the observed H2 emission in Figure 5g is unlikely to be produced from shocks originating via outflows.
In Figure 5h, the F444W/F335M image enables us to trace regions displaying the excess 4.44 m emission (see bright areas) and/or 3.35 m emission (see dark gray/black areas). In other words, extended bright areas may show the Br emission at 4.05 m or the ionized emission due to the excess 4.44 m emission, while dark gray/black areas may display the PAH emission at 3.3 m due to the excess 3.35 m emission. The H2 emission is detected toward the areas having the excess 3.35 m emission (see Figures 5g and 5h). The extended ionized emission traced in the F444W/F335M image appears to be surrounded by the H2 emission and the PAH emission (see Figure 5i). All the selected H2 depression regions (i.e, CC-1, CC-2, and CC-3) seem to be filled with the ionized emission.
Figure 5i supports the existence of a bipolar H ii region or a bipolar morphology (extent 0.35 pc), and the OB-star candidate appears to be located at the central part of the waist of this bipolar morphology (see dashed curves in Figure 5i), where we have detected noticeable PAH and H2 emissions. In known bipolar H ii regions (see Deharveng et al., 2010), the location of the exciting source(s) is expected toward the waist of the bipolar structures (e.g., IRAS 175992148 (Dewangan et al., 2012, 2016c) and W42 (Dewangan et al., 2015)). The structure FF-1 associated with the PAH and H2 emissions appears to be located at the edge of the bipolar morphology. Locally, the impact of the massive star (UCAC4 157-048728) or UV-fluorescence emission appears to be the cause of the H2 emission (see the observed morphology in Figures 5g and 5i). More discussions on these observed results are presented in Section 4.2.
4 Discussion
4.1 Origin of intertwined sub-structures in PDRs
In general, the study of the H ii regions powered by massive OB stars can allow us to explore the transitional boundary between the neutral/molecular PDR and the fully ionized H ii region, where temperature and density differences across the boundary can cause evaporative flows and fluid dynamical instabilities (e.g., Hartigan et al., 2012; Goicoechea et al., 2016). Goicoechea et al. (2016) presented a diagram concerning the structure of a strongly UV-irradiated molecular cloud edge, where the ionization front, dissociation front, and the compressed structure are outlined in the PDR near an H ii region. The PDR initiates at the border of an H ii region and extends up to the edge of the cold molecular cloud. This predominantly includes neutral and ionized species, resulting from chemical reactions induced by the FUV radiation emitted by the OB stars (Goicoechea et al., 2016). In PDRs, the H2 emission peaks farther away from the ionizing star and is originated by the UV/FUV radiation or shock heating processes at the shock/dissociation front. Furthermore, the Br (or Br) and H emission may trace photoevaporative flows from the PDRs (e.g., Carlsten & Hartigan, 2018; Wolfire et al., 2022). Therefore, in general, the different flows (or gas layers) with varying temperatures and densities in the PDR can induce instabilities and give rise to the formation of complex structures. The high-resolution JWST images can be employed to directly observe the intricate interfaces of various emissions within the PDR.
The most prominent structure in the bubble wall of NGC 3324 is the sharp edge or the ionization front, which has a curvature that faces the locations of the previously reported O-type stars (i.e., HD 92206 and CPD57∘3580). The observed sharp edge is exposed to the harshest feedback from the powering O-type stars (e.g., Reiter et al., 2022). Using the JWST NIRCam and MIRI images, the presence of two coupled (or intertwined) sub-structures, below a physical scale of 4500 AU, is investigated toward the sharp ionization front (see Figures 3c and 4b). The elongated structure seen in the 3.3 m PAH emission is traced between the ionized emission and the 4.693 m H2 emission. The HST F658N bright emission spatially coincides with the 4.05 m Br emission. In Figure 4d, an offset (0.′′4–1.′′1 or 880 AU–2420 AU) is evident between the ionized emission and the FUV-fluorescence H2 emission (see also Section 3.2). The twisting of sub-structures associated with the H2 emission is depicted, however such configuration is not clearly traced in the PAH emission toward the higher declination (or northern areas). Based on the intensity profile inspection, the separation between two sub-structures in the H2 emission is 1.′′1 (or 2420 AU; see a solid yellow line in Figure 4d and also Section 3.2). We do not find any previously reported molecular outflows and YSOs towards the elongated structure linked with the PAH emission (see Figure 2b). Interestingly, the spatial areas associated with the neutral/PAH and H2 emission in PDRs seem to be resolved in the JWST images (see Figure 4d).
According to Kirsanova et al. (2023), the separation between the ionization and dissociation fronts in the S255 H ii region (d 2.06 kpc) and the S257 H ii region (d 2.5 kpc) is determined to be about 0.3–0.4 pc. In this relation, they used the 2.16 m Br and the 2.12 m H2 line emission. Based on this observational information, they evaluated the applicability of models of a uniform medium and a non-uniform (clumpy) structure of the PDRs. They suggested that the derived value of 0.3–0.4 pc is consistent with a clumpy medium and should be 10–20 times lower (i.e., 3000 AU (or 0.015 pc)–8000 AU (or 0.04 pc)) in a uniform gas density. In our selected target, the H2 dissociation front and the H ionization front (or PAH) are not merged. The transition from PAH to H2 is abrupt with sharp edges and with the offset value of 2420 AU (see Figure 4d). Taking into account these observational findings, numerical simulations of uniform/non-uniform gas density may be carried out to obtain more insights in the bubble wall of NGC 3324. Such exercise, however, is beyond the scope of current work.
It has been proposed that instabilities at the ionization front (or the dissociation front) can be responsible for the irregular shapes of observed H ii regions including the “fingers” and “elephant trunks” (Giuliani, 1979; Garcia-Segura & Franco, 1996; Williams, 1999). Depending on how thick (Williams, 2002) or thin (Giuliani, 1979; Garcia-Segura & Franco, 1996) the shell of shocked neutral gas is around the ionization front, the onset of different kinds of instability can be inferred (e.g., Henney, 2007).
Following the work of Goicoechea et al. (2016), it is possible that the force imbalance between thermal (isotropic) and ram pressure (parallel to the flow) is what causes the instability known as the “thin-shell” (see also Garcia-Segura & Franco, 1996; Williams, 2003). One can also expect entangled structures in astrophysical plasma on collisional (fluid) scales in the “thin-shell” instability (Dieckmann et al., 2015). Therefore, the intertwined/entangled sub-structures seem to be caused by the “thin-shell” instability. We further suggest that the intertwined/entangled sub-structures in the PDRs that have been discovered may be considered as one of the direct indicators of instability on the dissociation front. To further gain insights into the observed intertwined configuration, we will need new sub-mm dust continuum and molecular line data with a resolution comparable to the JWST images.
Signposts of star formation including massive stars (i.e., outflows, protostars, 6.7 GHz methanol masers, 22 GHz water masers etc.) are often found at the edges of the Spitzer bubbles (e.g., Churchwell et al., 2006, 2007) that surround H ii regions stimulated by massive OB-type stars (e.g., Deharveng et al., 2010; Dewangan et al., 2016b). Therefore, the JWST images will be very useful to probe ongoing star formation processes toward the edges of the bubbles.
4.2 Origin of the bipolar morphology seen in the JWST images
As mentioned earlier, a compact and arc-like feature in the small region “sm1” is identified using the Spitzer and Herschel images (see Section 3.3). Diffuse SUMSS 843 MHz radio continuum emission is present towards this selected region (see Figure 6). Due to the availability of high-resolution JWST images, apart from the sharp ionization front, we have also examined this arc-like feature in this paper. In the direction of the arc-like feature, a bipolar morphology (extent 0.35 pc) in “sm1” is investigated using the JWST images, and is filled with the ionized emission (see Section 3.3). The massive star candidate VPHAS-OB1 #03518 is found at the waist of the bipolar morphology. In order to infer the impact of VPHAS-OB1 #03518, we have determined three pressure components (i.e., pressure of an H ii region (), radiation pressure (), and stellar wind ram pressure (Pwind)) driven by the massive OB star following the approach by Dewangan et al. (2016b).
In the literature, we do not find the exact spectral class of this massive star. Therefore, the pressure calculations are performed separately for a B0.5V type star and a star of O9.5V type. In general, in case of massive zero age main sequence stars, the value of exceeds the values of and (e.g., Dewangan et al., 2016b). Note that Wolf-Rayet stars are an exception to this argument, where the Pwind value predominates over and Prad values (e.g., Lamers & Cassinelli, 1999; Dewangan et al., 2016a; Baug et al., 2019; Dewangan et al., 2022). Therefore, only the values of are computed in this paper at = [0.5, 1] pc. The values of are higher than the extent of the bipolar morphology. Pressure components driven by O9.5V and B0.5V stars are determined, and are tabulated in Table 2. Table 2 also lists the number of Lyman continuum photons emitted per second (NUV) values for both O9.5V and B0.5V stars (from Panagia, 1973). The calculation uses the radiative recombination coefficient () = 2.6 10-13 cm3 s-1 at electron temperature () of 104 K. In the literature, pressure values (PMC) for typical cool molecular clouds (particle density 103 – 104 cm-3 and temperature 20 K) have been reported to be 2.8 10-12 – 2.8 10-11 dynes cm-2 (see Table 7.3 in Dyson & Williams, 1997). Considering the values of (for both O9.5V and B0.5V stars) PMC (see Table 2), the impact of a massive OB star at a distance of [0.5, 1] pc seems to be possible.
Overall, in the selected region “sm1” of NGC 3324, the pressure measurements support the impact of the massive star candidate VPHAS-OB1 #03518 to its surroundings, which is locally responsible for the bipolar morphology as seen in the JWST F470NF444W and F444W/F335M images. High-resolution sub-mm observations and molecular line data with a resolution comparable to the JWST images will be helpful to further explore our proposed arguments in “sm1”.
| Spectral type of star | NUV | PHII (dynes cm-2) | PHII (dynes cm-2) |
|---|---|---|---|
| (s-1) | at Ds = 0.5 pc | at Ds = 1.0 pc | |
| O9.5V | 1.2 1048 | 7.5 10-10 | 2.6 10-10 |
| B0.5V | 6.3 1046 | 1.7 10-10 | 6.1 10-11 |
5 Summary and Conclusions
The current work employs a multi-scale and multi-wavelength approach in the direction of the bubble wall of NGC 3324 (d 2.2 kpc) to examine ongoing physical processes. The present paper focuses on the sharp edge/elongated structure or the ionization front in NGC 3324, which is depicted at the interface between the H ii region and the molecular cloud.
For the first time, using the JWST images at 0.9 –18 m, we have discovered intertwined/entangled sub-structures or a double helix towards the sharp ionization front below a physical scale of 4500 AU. The JWST F470NF444W image is utilized to study the H2 emission at 4.693 m, while the JWST F444W/F335M image has been employed to depict the PAH feature and the ionized emission. The elongated structure in the 3.3 m PAH emission seems to be seen between the ionized emission and the H2 emission. The presence of the ionized emission is inferred from the Br (or H) emission. We find an offset (0.′′4–1.′′1 or 880–2420 AU) between the ionized emission and the UV-fluorescence H2 emission.
The intertwined configuration is notably evident in the continuum-subtracted H2 emission, which is less significant in the PAH emission at 3.3 m. The two sub-structures in the H2 emission are separated by at least 1.′′1 (or 2420 AU). The presence of intertwined structures observed in JWST images toward the spatial regions linked to the neutral to H2 transition zone suggest that these structures may have originated from the “thin-shell” instability.
Using the ionized, PAH, and H2 emissions traced in the JWST images, we have also investigated a bipolar morphology or bipolar H ii region (extent 0.35 pc) at Td 25–28 K, which is away from the ionization front and is associated with the elongated molecular/dust cloud. A previously known massive OB-star candidate (UCAC4 157-048728) is found at the waist of the bipolar morphology, and seems to be locally responsible for it.
To further study the intertwined configuration, sub-mm dust continuum and molecular line data with a resolution comparable to the JWST images will be very useful. This study also indicates that intertwined sub-structures along the boundaries of the Spitzer bubbles hosting massive OB-type stars may be commonly detected characteristics that can be investigated with the JWST images.
Acknowledgments
This work is based on observations made with the NASA/ESA/CSA James Webb Space Telescope. The data were obtained from the Mikulski Archive for Space Telescopes at the Space Telescope Science Institute, which is operated by the Association of Universities for Research in Astronomy, Inc., under NASA contract NAS 5-03127 for JWST. These observations are associated with program #2731. The specific observations analyzed can be accessed via http://dx.doi.org/10.17909/stwg-r373 (catalog 10.17909/stwg-r373).
The authors thank the anonymous referee for helpful comments and suggestions that improved the manuscript. The research work at Physical Research Laboratory is funded by the Department of Space, Government of India. Y.D.M. thanks CONACyT (Mexico) for the research grant CB-A1-S-25070(YDM). This work is based [in part] on observations made with the Spitzer Space Telescope, which is operated by the Jet Propulsion Laboratory, California Institute of Technology under a contract with NASA. This research has made use of the VizieR catalogue access tool, CDS, Strasbourg, France (DOI : 10.26093/cds/vizier). The original description of the VizieR service was published in 2000, A&AS 143, 23.
Appendix A Multi-wavelength view of cosmic cliffs NGC 3324
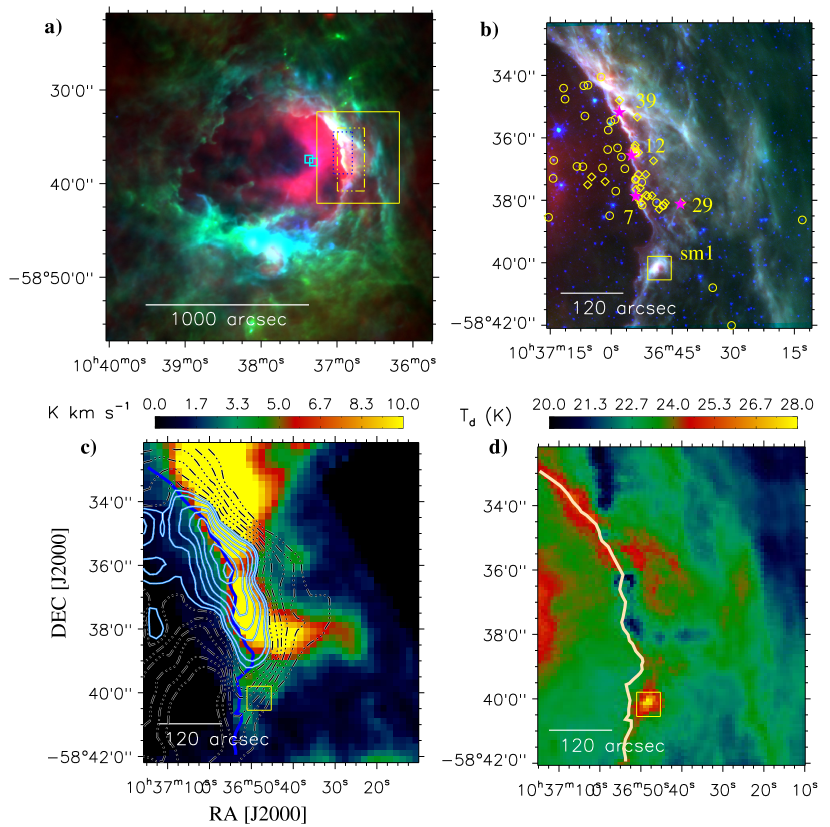
The morphology of NGC 3324 is presented in Figure 6a, which is a three-color composite map (SUMSS 843 MHz (in red), Herschel 160 m (in green), and Herschel 70 m (in blue) images). The locations of massive O-type stars (i.e., HD 92206 and CPD57∘3580) are also marked by squares in Figure 6a. The free-free emission tracing the ionized nebula in the SUMSS 843 MHz radio continuum map is distributed within the extended bubble NGC 3324. An area highlighted by a solid box in Figure 6a is presented in Figure 6b, which shows a three-color composite map produced using the Herschel 70.0 m far-infrared image (in red), Spitzer 8.0 m MIR image (in green), and Spitzer 3.6 m NIR image (in blue). In Figure 6b, the positions of YSOs, 870 m dust continuum clumps (at d 2.5 kpc; IDs: 7 (mass 530 M⊙), 12 (mass 390 M⊙), 29 (mass 390 M⊙), and 39 (mass 220 M⊙); see Duronea et al., 2015, for more details), and molecular outflows are also highlighted by open circles, filled stars, and open diamonds, respectively. This paper is mainly focused on the sharp edge of the cavity within NGC 3324 (or the ionization front) and the arc-like feature toward the small region “sm1”, which are evident in the Spitzer and Herschel images. Massive dust continuum clumps (mass range 220–530 M⊙; Duronea et al., 2015) have been reported toward the sharp edge.
In the direction of cosmic cliffs NGC 3324, Figure 6c displays the integrated intensity (i.e., moment-0) map of CHaMP 13CO(J =10) over a velocity range of [24.3, 19.9] km s-1, revealing an elongated morphology. The moment-0 map is also overlaid with the SUMSS 843 MHz radio continuum contours. The radio continuum map favours the presence of an elongated feature (extent 7.′5) having an aspect ratio (i.e., length/width) of 3, which seems to be located toward the sharp ionization front. Previously, Duronea et al. (2015) explored these two data sets toward NGC 3324. However, they did not discuss any elongated ionized feature. In the literature, we find that the energetic feedback from massive stars has been proposed to explain the existence of the elongated ionized features by swept-up ionized gas or dissipated turbulence (e.g., Emig et al., 2022). Hence, such ionized features are expected to be far from the exciting massive stars in the OB-association/ OB-star complex (e.g., Karr & Martin, 2003; Pon et al., 2014; Emig et al., 2022). Based on the spatial location of the elongated ionized feature with respect to the ionization front and the O-type stars, we suggest that the feedback from the massive O-type stars is likely the reason for the existence of the elongated ionized feature.
In Figure 6d, we present the Herschel dust temperature map. Figures 6c and 6d covers the same area as displayed in Figure 6b. The footprint of the ionization front is also marked by a solid curve in Figures 6c and 6d. On the basis of Figures 6c and 6d, we can study the spatial distribution of the molecular gas, dust temperature, and ionized emission with respect to the ionization front. At the molecular cloud’s edge, the ionization front is seen, where variations of the dust temperature (Td 20–28 K) are evident. Overall, the sharp edge appears to be situated at the molecular gas/H ii region interface.
References
- André et al. (2014) André, P., Di Francesco, J., Ward-Thompson, D., et al. 2014, in Protostars and Planets VI, ed. H. Beuther, R. S. Klessen, C. P. Dullemond, & T. Henning, 27, doi: 10.2458/azu_uapress_9780816531240-ch002
- André et al. (2010) André, P., Men’shchikov, A., Bontemps, S., et al. 2010, A&A, 518, L102, doi: 10.1051/0004-6361/201014666
- Assirati et al. (2014) Assirati, L., Silva, N. R., Berton, L., Lopes, A. A., & Bruno, O. M. 2014, in Journal of Physics Conference Series, Vol. 490, Journal of Physics Conference Series, 012020, doi: 10.1088/1742-6596/490/1/012020
- Bailer-Jones et al. (2018) Bailer-Jones, C. A. L., Rybizki, J., Fouesneau, M., Mantelet, G., & Andrae, R. 2018, AJ, 156, 58, doi: 10.3847/1538-3881/aacb21
- Barnes et al. (2018) Barnes, P. J., Hernandez, A. K., Muller, E., & Pitts, R. L. 2018, ApJ, 866, 19, doi: 10.3847/1538-4357/aad4ab
- Barnes et al. (2011) Barnes, P. J., Yonekura, Y., Fukui, Y., et al. 2011, ApJS, 196, 12, doi: 10.1088/0067-0049/196/1/12
- Baug et al. (2019) Baug, T., de Grijs, R., Dewangan, L. K., et al. 2019, ApJ, 885, 68, doi: 10.3847/1538-4357/ab46be
- Beichman et al. (2012) Beichman, C. A., Rieke, M., Eisenstein, D., et al. 2012, in Society of Photo-Optical Instrumentation Engineers (SPIE) Conference Series, Vol. 8442, Space Telescopes and Instrumentation 2012: Optical, Infrared, and Millimeter Wave, ed. M. C. Clampin, G. G. Fazio, H. A. MacEwen, & J. Oschmann, Jacobus M., 84422N, doi: 10.1117/12.925447
- Benjamin et al. (2003) Benjamin, R. A., Churchwell, E., Babler, B. L., et al. 2003, PASP, 115, 953, doi: 10.1086/376696
- Berné et al. (2022) Berné, O., Habart, É., Peeters, E., et al. 2022, PASP, 134, 054301, doi: 10.1088/1538-3873/ac604c
- Bock et al. (1999) Bock, D. C. J., Large, M. I., & Sadler, E. M. 1999, AJ, 117, 1578, doi: 10.1086/300786
- Carlsten & Hartigan (2018) Carlsten, S. G., & Hartigan, P. M. 2018, ApJ, 869, 77, doi: 10.3847/1538-4357/aaeb8d
- Churchwell et al. (2006) Churchwell, E., Povich, M. S., Allen, D., et al. 2006, ApJ, 649, 759, doi: 10.1086/507015
- Churchwell et al. (2007) Churchwell, E., Watson, D. F., Povich, M. S., et al. 2007, ApJ, 670, 428, doi: 10.1086/521646
- Deharveng et al. (2010) Deharveng, L., Schuller, F., Anderson, L. D., et al. 2010, A&A, 523, A6, doi: 10.1051/0004-6361/201014422
- Dewangan et al. (2016a) Dewangan, L. K., Baug, T., Ojha, D. K., et al. 2016a, ApJ, 826, 27, doi: 10.3847/0004-637X/826/1/27
- Dewangan et al. (2015) Dewangan, L. K., Luna, A., Ojha, D. K., et al. 2015, ApJ, 811, 79, doi: 10.1088/0004-637X/811/2/79
- Dewangan et al. (2012) Dewangan, L. K., Ojha, D. K., Anandarao, B. G., Ghosh, S. K., & Chakraborti, S. 2012, ApJ, 756, 151, doi: 10.1088/0004-637X/756/2/151
- Dewangan et al. (2016b) Dewangan, L. K., Ojha, D. K., Luna, A., et al. 2016b, ApJ, 819, 66, doi: 10.3847/0004-637X/819/1/66
- Dewangan et al. (2016c) Dewangan, L. K., Ojha, D. K., Zinchenko, I., et al. 2016c, ApJ, 833, 246, doi: 10.3847/1538-4357/833/2/246
- Dewangan et al. (2017) Dewangan, L. K., Ojha, D. K., Zinchenko, I., Janardhan, P., & Luna, A. 2017, ApJ, 834, 22, doi: 10.3847/1538-4357/834/1/22
- Dewangan et al. (2022) Dewangan, L. K., Pirogov, L. E., Bhadari, N. K., & Maity, A. K. 2022, MNRAS, 516, 2988, doi: 10.1093/mnras/stac2334
- Dieckmann et al. (2015) Dieckmann, M. E., Ahmed, H., Doria, D., et al. 2015, Phys. Rev. E, 92, 031101, doi: 10.1103/PhysRevE.92.031101
- Duronea et al. (2015) Duronea, N. U., Vasquez, J., Gómez, L., et al. 2015, A&A, 582, A2, doi: 10.1051/0004-6361/201424724
- Dyson & Williams (1997) Dyson, J. E., & Williams, D. A. 1997, The physics of the interstellar medium, doi: 10.1201/9780585368115
- Emig et al. (2022) Emig, K. L., White, G. J., Salas, P., et al. 2022, A&A, 664, A88, doi: 10.1051/0004-6361/202142596
- Garcia-Segura & Franco (1996) Garcia-Segura, G., & Franco, J. 1996, ApJ, 469, 171, doi: 10.1086/177769
- Giuliani (1979) Giuliani, J. L., J. 1979, ApJ, 233, 280, doi: 10.1086/157389
- GLIMPSE Team (2020) GLIMPSE Team. 2020, GLIMPSE I Archive, IPAC, doi: 10.26131/IRSA210
- Goicoechea et al. (2016) Goicoechea, J. R., Pety, J., Cuadrado, S., et al. 2016, Nature, 537, 207, doi: 10.1038/nature18957
- Göppl & Preibisch (2022) Göppl, C., & Preibisch, T. 2022, A&A, 660, A11, doi: 10.1051/0004-6361/202142576
- Hartigan et al. (2012) Hartigan, P., Palmer, J., & Cleeves, L. I. 2012, High Energy Density Physics, 8, 313, doi: 10.1016/j.hedp.2012.08.002
- Henney (2007) Henney, W. J. 2007, in Astrophysics and Space Science Proceedings, Vol. 1, Diffuse Matter from Star Forming Regions to Active Galaxies - A Volume Honouring John Dyson, 103, doi: 10.1007/978-1-4020-5425-9_6
- Jo et al. (2017) Jo, Y.-S., Seon, K.-I., Min, K.-W., Edelstein, J., & Han, W. 2017, ApJS, 231, 21, doi: 10.3847/1538-4365/aa8091
- Karr & Martin (2003) Karr, J. L., & Martin, P. G. 2003, ApJ, 595, 880, doi: 10.1086/376895
- Kirsanova et al. (2023) Kirsanova, M. S., Tatarnikov, A. M., Boley, P. A., et al. 2023, arXiv e-prints, arXiv:2306.12264, doi: 10.48550/arXiv.2306.12264
- Kuhn et al. (2021) Kuhn, M. A., de Souza, R. S., Krone-Martins, A., et al. 2021, ApJS, 254, 33, doi: 10.3847/1538-4365/abe465
- Kumar et al. (2020) Kumar, M. S. N., Palmeirim, P., Arzoumanian, D., & Inutsuka, S. I. 2020, A&A, 642, A87, doi: 10.1051/0004-6361/202038232
- Lamers & Cassinelli (1999) Lamers, H. J. G. L. M., & Cassinelli, J. P. 1999, Introduction to Stellar Winds
- Marsh et al. (2015) Marsh, K. A., Whitworth, A. P., & Lomax, O. 2015, MNRAS, 454, 4282, doi: 10.1093/mnras/stv2248
- Marsh et al. (2017) Marsh, K. A., Whitworth, A. P., Lomax, O., et al. 2017, MNRAS, 471, 2730, doi: 10.1093/mnras/stx1723
- Mohr-Smith et al. (2017) Mohr-Smith, M., Drew, J. E., Napiwotzki, R., et al. 2017, MNRAS, 465, 1807, doi: 10.1093/mnras/stw2751
- Molinari et al. (2010a) Molinari, S., Swinyard, B., Bally, J., et al. 2010a, PASP, 122, 314, doi: 10.1086/651314
- Molinari et al. (2010b) —. 2010b, A&A, 518, L100, doi: 10.1051/0004-6361/201014659
- Motte et al. (2018) Motte, F., Bontemps, S., & Louvet, F. 2018, ARA&A, 56, 41, doi: 10.1146/annurev-astro-091916-055235
- Ohlendorf et al. (2013) Ohlendorf, H., Preibisch, T., Gaczkowski, B., et al. 2013, A&A, 552, A14, doi: 10.1051/0004-6361/201220218
- Panagia (1973) Panagia, N. 1973, AJ, 78, 929, doi: 10.1086/111498
- Pitts et al. (2019) Pitts, R. L., Barnes, P. J., & Varosi, F. 2019, MNRAS, 484, 305, doi: 10.1093/mnras/sty3360
- Pon et al. (2014) Pon, A., Johnstone, D., Bally, J., & Heiles, C. 2014, MNRAS, 441, 1095, doi: 10.1093/mnras/stu620
- Pontoppidan et al. (2022) Pontoppidan, K. M., Barrientes, J., Blome, C., et al. 2022, ApJ, 936, L14, doi: 10.3847/2041-8213/ac8a4e
- Preibisch et al. (2014) Preibisch, T., Zeidler, P., Ratzka, T., Roccatagliata, V., & Petr-Gotzens, M. G. 2014, A&A, 572, A116, doi: 10.1051/0004-6361/201424045
- Reiter et al. (2022) Reiter, M., Morse, J. A., Smith, N., et al. 2022, MNRAS, 517, 5382, doi: 10.1093/mnras/stac2820
- Rieke et al. (2015) Rieke, G. H., Wright, G. S., Böker, T., et al. 2015, PASP, 127, 584, doi: 10.1086/682252
- Rieke et al. (2005) Rieke, M. J., Kelly, D., & Horner, S. 2005, in Society of Photo-Optical Instrumentation Engineers (SPIE) Conference Series, Vol. 5904, Cryogenic Optical Systems and Instruments XI, ed. J. B. Heaney & L. G. Burriesci, 1–8, doi: 10.1117/12.615554
- Rigby et al. (2023) Rigby, J., Perrin, M., McElwain, M., et al. 2023, PASP, 135, 048001, doi: 10.1088/1538-3873/acb293
- Rosen et al. (2020) Rosen, A. L., Offner, S. S. R., Sadavoy, S. I., et al. 2020, Space Sci. Rev., 216, 62, doi: 10.1007/s11214-020-00688-5
- Smith et al. (2010) Smith, N., Bally, J., & Walborn, N. R. 2010, MNRAS, 405, 1153, doi: 10.1111/j.1365-2966.2010.16520.x
- Tan et al. (2014) Tan, J. C., Beltrán, M. T., Caselli, P., et al. 2014, in Protostars and Planets VI, ed. H. Beuther, R. S. Klessen, C. P. Dullemond, & T. Henning, 149, doi: 10.2458/azu_uapress_9780816531240-ch007
- Tielens (2008) Tielens, A. G. G. M. 2008, ARA&A, 46, 289, doi: 10.1146/annurev.astro.46.060407.145211
- Williams (1999) Williams, R. J. R. 1999, MNRAS, 310, 789, doi: 10.1046/j.1365-8711.1999.03014.x
- Williams (2002) —. 2002, MNRAS, 331, 693, doi: 10.1046/j.1365-8711.2002.05245.x
- Williams (2003) Williams, R. J. R. 2003, in Revista Mexicana de Astronomia y Astrofisica Conference Series, Vol. 15, Revista Mexicana de Astronomia y Astrofisica Conference Series, ed. J. Arthur & W. J. Henney, 184–189
- Wolfire et al. (2022) Wolfire, M. G., Vallini, L., & Chevance, M. 2022, ARA&A, 60, 247, doi: 10.1146/annurev-astro-052920-010254
- Wright et al. (2015) Wright, G. S., Wright, D., Goodson, G. B., et al. 2015, PASP, 127, 595, doi: 10.1086/682253
- Zeidler et al. (2016) Zeidler, P., Preibisch, T., Ratzka, T., Roccatagliata, V., & Petr-Gotzens, M. G. 2016, A&A, 585, A49, doi: 10.1051/0004-6361/201424376
- Zinnecker & Yorke (2007) Zinnecker, H., & Yorke, H. W. 2007, ARA&A, 45, 481, doi: 10.1146/annurev.astro.44.051905.092549