A Chandra X-ray study of millisecond pulsars in the globular cluster Omega Centauri: a correlation between spider pulsar companion mass and X-ray luminosity
Abstract
Millisecond pulsars (MSPs) are faint X-ray sources commonly observed in Galactic globular clusters (GCs). In this work, we investigate 18 MSPs newly found in the GC Omega Centauri ( Cen) and search for their X-ray counterparts using Chandra observations with a total exposure time of 290.9 ks. We identify confident X-ray counterparts for 11 of the MSPs, with 9 of them newly identified in this work based on their positions, spectral properties, and X-ray colours. The X-ray spectra of 9 MSPs are well described by a neutron star hydrogen atmosphere model, while 2 MSPs are well fitted by a power-law model. The identified MSPs have X-ray luminosities ranging from erg s-1 to erg s-1. Additionally, for population comparison purposes, we study the X-ray counterpart to MSP E in the GC M71, and find its X-ray spectrum is well described by blackbody-like models with a luminosity of erg s-1. We investigate the empirical correlations between X-ray luminosities and minimum companion masses, as well as mass functions, of spider pulsars. Clear correlations are observed, with best-fit functions of and , respectively, with an intrinsic scatter of of 0.3, where is the 0.5–10 keV X-ray luminosity, is the minimum companion mass, and MF represents the mass function, in solar masses.
keywords:
pulsar: general – star: neutron – globular cluster: individual: NGC 5139 – globular cluster: individual: NGC 6838 – X-ray: stars – X-ray: binaries1 Introduction
Given the high stellar densities in the core regions of globular clusters (GCs), stellar interactions in GCs are highly significant, such as tidal captures (Fabian et al., 1975) and stellar exchanges (Hills, 1976). Consequently, low-mass X-ray binaries (LMXBs) are overabundantly produced in GCs (e.g., Katz, 1975; Verbunt & Hut, 1987; Pooley & Hut, 2006; Heinke et al., 2006b), and GCs with higher stellar encounter rates are expected to host larger populations of such systems (Verbunt & Hut, 1987; Bahramian et al., 2013). LMXBs are the progenitors of millisecond pulsars (MSPs), where the neutron star (NS) accretes mass and angular momentum from its companion star and hence spins up to a period of a few milliseconds (Alpar et al., 1982; Papitto et al., 2013). GCs are therefore the ideal birthplaces for MSPs as well. Indeed, 280 pulsars have been discovered in 38 Galactic GCs to date, 262 of which are MSPs (i.e. spin periods 30 ms), with new identifications occurring frequently (e.g. Lian et al., 2023; Pan et al., 2023; Chen et al., 2023).111See Paulo Freire’s GC pulsar catalogue at https://www3.mpifr-bonn.mpg.de/staff/pfreire/GCpsr.html for up-to-date information.
MSPs are commonly observed to be hosted in binary systems, which is not surprising considering their evolution. MSPs coupled with non-/semi-degenerate low-mass stars are the so-called spider pulsars. The companion masses of spider pulsars have a bi-modal distribution, which divides them into two groups: redbacks (RBs) with companion masses between 0.1 M☉ and 0.5 M☉, and black widows (BWs) with companion masses less than 0.05 M☉ (Roberts, 2013). All of the known RBs show eclipses in their radio pulsations and around half of discovered BWs are radio eclipsing. (Note that non-eclipsing RBs may exist, e.g. those with very low inclination angles, but might be erroneously classified as other binary types, such as MSPs associated with helium-core white dwarfs.) These radio eclipses likely result from dispersion, scattering, and/or absorption in the stripped material of the companion (see e.g., Stappers et al., 1996; Roy et al., 2015; Polzin et al., 2020). The canonical companions of MSPs are white dwarfs (WDs), with helium-core WDs being the most commonly observed (e.g. Lorimer, 2008). It is noteworthy that in GCs, the companions of MSPs might result from exchange interactions, rather than originating solely from the recycling phenomenon. On the other hand, of order a third of MSPs are isolated, which are likely produced by merger of an MSP with its very low-mass companion due to dynamically unstable mass transfer (Ivanova et al., 2008). In globular clusters, MSPs can also become isolated through dynamical interactions (Verbunt & Freire, 2014).
MSPs are generally faint X-ray emitters, with typical X-ray luminosities ranging from erg s-1 to erg s-1, and up to erg s-1 in 0.3–8 keV energy band (see Zhao & Heinke, 2022). Based on the likely origins, X-ray emission from MSPs can be categorised into three groups. Thermal X-ray emission is considered to be originated from the hotspots on NS surface (presumably near the NS magnetic poles), where are heated up by returning flows of relativistic particles accelerated in magnetosphere (Harding & Muslimov, 2002). Thermal emission is commonly observed from isolated MSPs and MSPs coupled with white dwarfs, with blackbody-like spectra (e.g. Zavlin et al., 2002; Bogdanov et al., 2006). X-ray observations have also shown broad pulsations and modulations from thermally emitting MSPs (e.g. Zavlin & Pavlov, 1998; Guillot et al., 2019; Wolff et al., 2021), providing evidence for the hotspot origin. X-rays generated from pulsar magnetosphere are believed to result in the observed narrow X-ray pulsations from only a few very energetic MSPs, such as PSR M28 A (see e.g., Saito et al., 1997; Bogdanov et al., 2011), PSR J0218+4232 (Kuiper et al., 1998), and PSR B1937+21 (Takahashi et al., 2001). This type of X-ray emission is predominantly observed with a hard power-law spectrum, indicating a non-thermal origin. The third type of X-ray emission from MSPs is typically seen from spider pulsars, likely produced by intrabinary shocks, where the relativistic pulsar winds collide with the outflow material from the companion star (see e.g., Arons & Tavani, 1993; Wadiasingh et al., 2017; Kandel et al., 2019). In addition, it is found that RBs are X-ray luminous in the MSP population, and eclipsing BWs generally brighter than non-eclipsing BWs in X-rays (Zhao & Heinke, 2022).
Omega Centauri (NGC 5139; hereafter Cen) is the most massive stellar system in the Galaxy found so far, with a stellar mass of M☉ (Baumgardt & Hilker, 2018). It is located in the constellation of Centaurus at a distance of 5.43 kpc from the Sun (Baumgardt & Vasiliev, 2021).222See also Baumgardt’s catalogue at https://people.smp.uq.edu.au/HolgerBaumgardt/globular/ for other fundamental parameters of Cen. Given its outstanding stellar population, observations in different bands towards Cen are of great interest. For example, Abdo et al. (2010) analysed -ray observations from Fermi Large Area Telescope and found that Cen exhibits MSP spectral properties in -rays, even though no MSP had been discovered therein at that time. Nonetheless, they predicted a population of 199 MSPs to explain the observed -rays. Henleywillis et al. (2018) conducted a deep X-ray survey of Cen using Chandra observations and identified a total of 233 X-ray sources, with 45 likely optical counterparts. In addition, they found more than 30 unidentified X-ray sources that are plausible MSP candidates given the similar X-ray properties to other MSPs in GCs. Although the presence of MSPs in Cen had been predicted and searched for over decades (e.g. Edwards et al., 2001; Possenti et al., 2005), it was only in recent years that MSPs were discovered in this cluster, suggesting a lack of sensitivity of previous radio detections. The first five MSPs, including four isolated MSPs and one eclipsing BW, were detected by Dai et al. (2020) using Parkes radio telescope (also known as “Murriyang”). More recently, Chen et al. (2023) discovered an additional 13 MSPs in Cen using MeerKAT radio telescope, bringing the total number of MSPs discovered in this cluster to 18 (including 10 isolated MSPs, five BWs with three of them showing eclipses, and three binary MSPs with undetermined companion nature), which makes Cen the Galactic GC with the third largest detected MSP population. During the preparation of this work, Dai et al. (2023) published new timing solutions of the first five discovered MSPs (Dai et al., 2020).
Motivated by recent radio detections and timing solutions of MSPs in Cen, in this paper, we conduct a search for their X-ray counterparts and analyse the corresponding X-ray spectra using Chandra observations. Additionally, we empirically investigate the correlations between X-ray luminosities and companion masses, as well as between X-ray luminosities and the mass functions, for spider MSPs. This is best done with globular cluster pulsars, since only for these pulsars do we generally have accurate distances and thus X-ray luminosities. This paper is organised as follows. In Section 2, we describe the Chandra observations used, and the process of data reduction. In Section 3, we compare our X-ray detections with existing catalogues, analyse the X-ray spectra and properties, and identify X-ray counterparts to MSPs. We discuss factors that may influence X-ray luminosities of spider pulsars in Section 4, and draw conclusion in Section 5.
2 Observations and data reduction
We obtained four Chandra X-ray observations of Cen from the Chandra Data Archive333https://cxc.cfa.harvard.edu/cda/, with a total exposure time of 290.9 ks (see Table 1). All observations were taken using the Advanced CCD Imaging Spectrometer (ACIS) with chip numbers from 0 to 3, i.e. ACIS-I chips, and data were recorded and configured in VFAINT mode.
We performed data reduction and analysis using ciao444Chandra Interactive Analysis of Observations, publicly available at https://cxc.harvard.edu/ciao/ (version 4.15.1 with caldb 4.10.2; Fruscione et al., 2006). For each observation, we first reprocessed the dataset using the chandra_repro script to create a new level=2 event file and a new bad pixel file. We then corrected the absolute astrometry by cross-matching the second brightest X-ray source in Cen (source ID 94a, assigned in Haggard et al., 2009) with its optical counterpart (see Henleywillis et al., 2018, and references therein). Specifically, we ran wavdetect, a Mexican-Hat Wavelet source detection algorithm in ciao, to detect and extract the X-ray centroid of 94a in each observation. The X-ray position was used to match the position of its optical counterpart at R.A.=13:16:01.61, Dec.=47:33:05.7 (van Leeuwen et al., 2000) using wcs_match, and then the obtained offset information was applied to correct and update the absolute astrometry for each dataset using wcs_update script. The average offset for the four observations was around 0.43 arcsec.
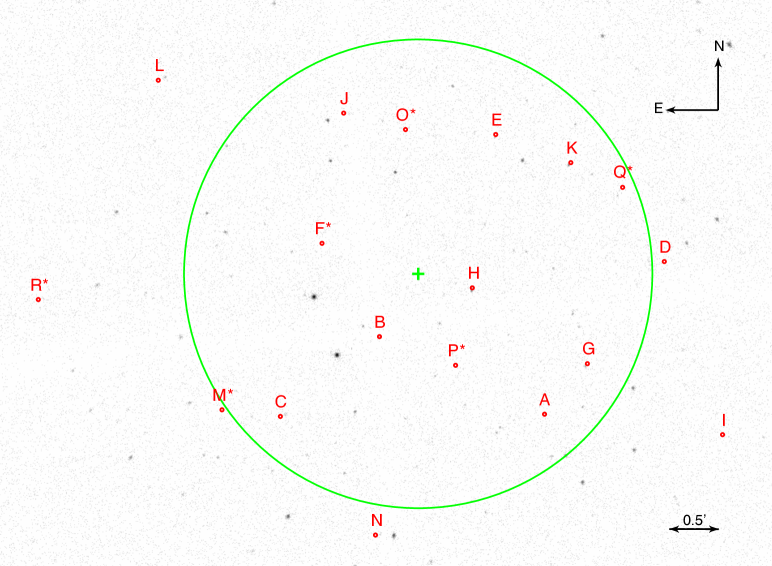
To find the X-ray counterparts to the MSPs in Cen, we first merged the four Chandra observations using merge_obs script, and applied wavdetect again in the merged 0.3–8 keV X-ray image (see the upper panel in Figure 1), with a scale list of [1, 1.4, 2, 4, 8], and a significance threshold of 10-5. The parameter settings used in this case were designed to achieve detection completeness and increase the ability to detect weaker sources (though spurious detections potentially increased too). Using the radio positions of the MSPs presented in Dai et al. (2023, for MSPs A–E) and Chen et al. (2023, for the other 13 MSPs), we searched for X-ray sources detected by wavdetect in the vicinities of the discovered MSPs.
The timing positions of MSPs A–E (Dai et al., 2023) are of such high precision (0.1") that the X-ray position errors (typically 1") dominate. Indeed, the positions of four detected counterparts to MSPs A, B, C, and E, respectively, are all consistent with the timing positions of corresponding MSPs, within their 95% X-ray positional uncertainties (see Table 2). It also validates our astrometric correction, though an average offset of 0.3 arcsec between radio and X-ray positions of these four MSPs is still present. Hence, we suggest these four X-ray sources are genuine counterparts to MSPs A, B, C, and E, respectively. MSP D, however, has no detected X-ray counterpart, likely due to its intrinsically faint nature.
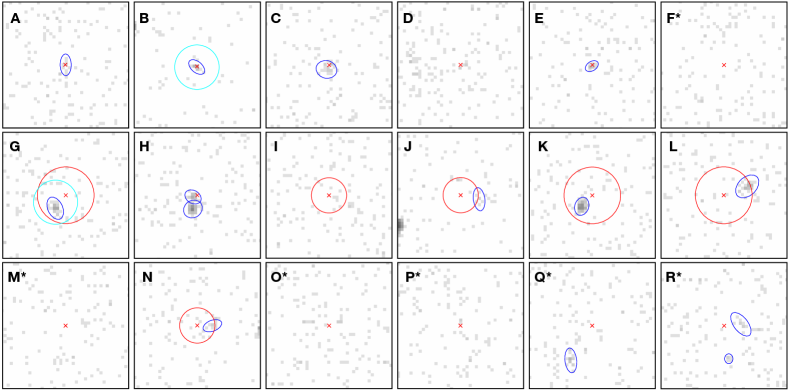
For the other 13 MSPs detected by MeerKAT (Chen et al., 2023), we considered them in two groups: group one contains MSPs having multibeam detections and hence relatively good localisations using SeeKAT, including MSPs G, I, J, K, L, and N; group two denotes those MSPs detected in only one MeerKAT beam, including MSPs F, H, M, O, P, Q, and R. We note that, despite MSP H having multibeam detections, its localisation was poorly constrained with uncertainties similar to other group two MSPs. Therefore, we considered it a member of the group two MSPs. The typical positional uncertainties (2-) of MSPs in group one are 1.5 arcsec in R.A. and 1 arcsec in Dec., respectively, while for group two MSPs, the typical positional uncertainties are 15 arcsec in R.A and 6 arcsec in Dec., respectively (Chen et al., 2023). We also compared the difference between the precise timing positions from Dai et al. (2023) and the positions localised with SeeKAT from Chen et al. (2023, see their Table 2) for MSPs A–E, and found average offsets of 2.2 arcsec in R.A. and 1.2 arcsec in Dec., respectively. The largest separation between a timing position and a SeeKAT position was 3.1 arcsec for MSP C, about 1.4 times the quoted SeeKAT uncertainty, so we conservatively adopted two times the quoted SeeKAT uncertainties to define search radii for MSPs in group one. Considering additionally the X-ray positional uncertainties (see Table 2), we found one counterpart to each of MSPs G, J, K, L and N, whereas no counterpart was detected to MSP I within the region (see the lower panels in Figure 1).
It is more difficult to identify the X-ray counterparts to MSPs in group two, given their large positional uncertainties. Nonetheless, since these MSPs were positioned at the centres of the beams with the brightest detections, while the synthesised beam was shaped as an approximate ellipse with major and minor axis of 20.5 arcsec and 9.3 arcsec, respectively (Chen et al., 2023), we searched for X-ray counterparts for MSPs in group two within 20″20″ regions. We identified one potential X-ray counterparts to MSP Q, and two potential X-ray counterparts for each of MSPs H and R, while we found no potential counterparts for MSPs F, M, O, or P (see the lower panels in Figure 1).
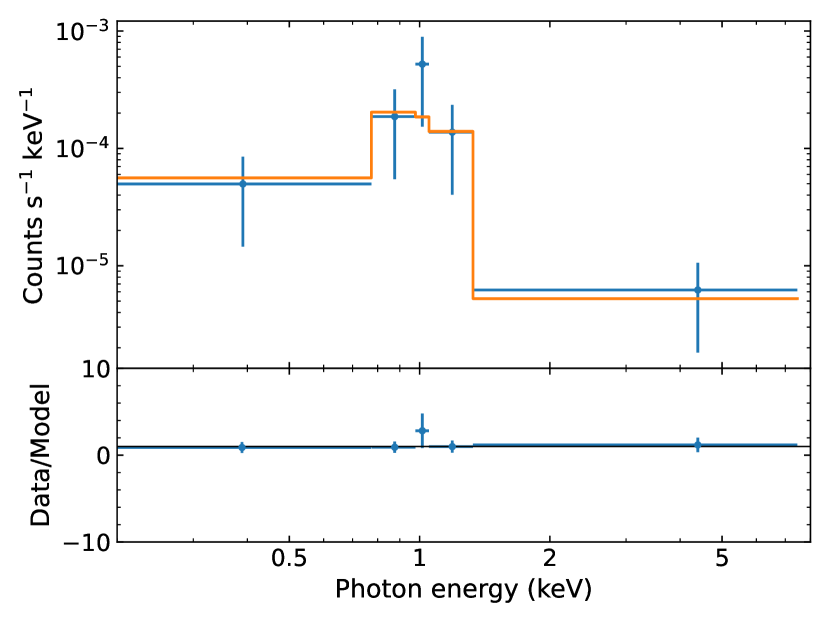
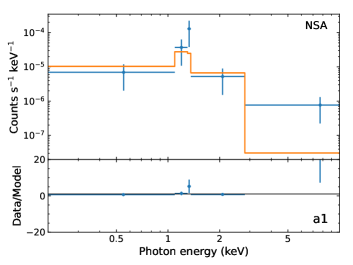
To further analyse the X-ray properties and identify the nature of these potential X-ray counterparts, we extracted their spectra from 1-arcsec radii circles centred at the centroids obtained by wacdetect for each of the four observations individually, using the specextract script. We note that, since Chandra observations of Cen were operated in two different cycles, which were separated by 12 years, the observed spectra in 2 keV band may be significantly different from each of the obtained ones in the two cycles, due to the molecular contamination on the ACIS filters555See https://cxc.harvard.edu/proposer/POG/html/chap6.html for more details. and/or the intrinsic long-term variability in X-rays (e.g. PSR J17482446A in Terzan 5; see Bogdanov et al., 2021). Thus, instead of combining all of the spectra extracted from those four observations for each X-ray source, we combined their X-ray spectra separately according to the observing cycles, i.e. cycles 1 and 13. We then fitted the two combined spectra in two cycles simultaneously for each X-ray source with parameters forced to be the same. We note that, however, the spectral extractions of a1 and e1 were not successful in Observation 653, while the extraction of n1 was unsuccessful in Observation 13727, due to zero counts in the extraction region, which likely reflects the varied exposure times (see Table 1). For these three sources, we manually added the corresponding exposure times in their spectral information files before spectral analysis. In particular, the two X-ray sources detected around MSP R, r1 and r2, only had extracted spectra from the two cycle 13 observations. Their spectral properties therefore only reflect latter observations. Background spectra were also extracted from source-free regions for each MSP. We also note that Zhao & Heinke (2022) have presented spectral analysis of MSPs A and B. Here we reanalysed their X-ray spectra to keep consistency in this work.
| Observation | Date of | Observing | Exposure | |
|---|---|---|---|---|
| ID | Instrument | Observation | Cycle | Time (ks) |
| 653 | ACIS-I | 2000 Jan 24 | 01 | 25.0 |
| 1519 | ACIS-I | 2000 Jan 25 | 01 | 43.6 |
| 13726 | ACIS-I | 2012 Apr 17 | 13 | 173.7 |
| 13727 | ACIS-I | 2012 Apr 16 | 13 | 48.5 |
| MSP | Radio Positiona | X-rayb | X-ray Positionc | PUd | Offsete | Existingf | ||
|---|---|---|---|---|---|---|---|---|
| Name | R.A. (hh:mm:ss) | Dec. (dd:mm:ss) | Name | R.A. (hh:mm:ss) | Dec. (dd:mm:ss) | (arcsec) | (arcsec) | ID |
| A | 13:26:39.6699(2) | 47:30:11.641(3) | a1 | 13:26:39.66 | 47:30:11.7 | 1.02 | 0.06 | |
| B | 13:26:49.5688(3) | 47:29:24.889(4) | b1 | 13:26:49.57 | 47:29:25.0 | 0.47 | 0.10 | 13d |
| C | 13:26:55.2219(6) | 47:30:11.753(9) | c1 | 13:26:55.26 | 47:30:12.4 | 0.78 | 0.81 | 23g |
| D | 13:26:32.7130(2) | 47:28:40.053(3) | – | – | – | – | – | |
| E | 13:26:42.67844(7) | 47:27:23.999(1) | e1 | 13:26:42.69 | 47:27:24.2 | 0.66 | 0.21 | 11f |
| F | 13:26:53(1) | 47:28:28(6) * | – | – | – | – | – | |
| G | 13:26:37.1(2) | 47:29:41(1) | g1 | 13:26:37.27 | 47:29:43.1 | 0.47 | 2.65 | 24f |
| H | 13:26:44(1) | 47:28:55(4) | h1 | 13:26:44.07 | 47:28:55.3 | 0.40 | 0.73 | 14c |
| h2 | 13:26:44.07 | 47:28:57.2 | 0.22 | 2.29 | 14c | |||
| I | 13:26:29.0(1) | 47:30:24(1) | – | – | – | – | – | |
| J | 13:26:51.7(1) | 47:27:09(1) | j1 | 13:26:51.41 | 47:27:09.6 | 1.03 | 2.99 | |
| K | 13:26:38.1(1) | 47:27:39(2) | k1 | 13:26:38.27 | 47:27:40.7 | 0.28 | 2.42 | 21d |
| L | 13:27:02.8(1) | 47:26:49(2) | l1 | 13:27:02.43 | 47:26:47.6 | 0.69 | 3.98 | 32d |
| M | 13:26:59(1) | 47:30:09(6) * | – | – | – | – | – | |
| N | 13:26:49.8(1) | 47:31:25(1) | n1 | 13:26:49.56 | 47:31:25.0 | 1.22 | 2.39 | |
| O | 13:26:48(1) | 47:27:19(6) * | – | – | – | – | – | |
| P | 13:26:45(1) | 47:29:42(6) * | – | – | – | – | – | |
| Q | 13:26:35(1) | 47:27:54(6) * | q1 | 13:26:35.33 | 47:27:59.5 | 0.71 | 6.47 | |
| R | 13:27:10(1) | 47:29:02(6) * | r1 | 13:27:09.74 | 47:29:01.8 | 1.57 | 2.66 | |
| r2 | 13:27:09.93 | 47:29:07.2 | 2.22 | 5.28 | ||||
| Notes: a Radio positions of the MSPs in Cen. The positions of MSPs A–E were obtained from Dai et al. (2023), whereas others’ positions were published by Chen et al. (2023). The numbers in parentheses denote uncertainties. Positions labelled with asterisks denote the positions of the centres of the beams where the corresponding MSPs have the brightest detections (Chen et al., 2023). | ||||||||
| b Naming system for the X-ray counterparts in this work. | ||||||||
| c Positions generated by the X-ray source detection algorithm wavdetect. | ||||||||
| d X-ray positional uncertainties at a 95% confidence level, computed using Equation 12 in Kim et al. (2007). | ||||||||
| e Offsets between the radio positions and X-ray positions in arcseconds. | ||||||||
| f Existing identifications of the X-ray sources in Cen from Haggard et al. (2009) and/or Henleywillis et al. (2018). | ||||||||
3 Data analysis and results
We performed X-ray spectral analysis using sherpa (version 4.15.0; Freeman et al., 2001; Doe et al., 2007; Burke et al., 2022), ciao’s modelling and fitting package.
3.1 Comparison with existing catalogues
Cen has been studied in X-rays by several previous works (e.g., Haggard et al., 2009; Henleywillis et al., 2018). In particular, Henleywillis et al. (2018) performed a deep X-ray survey and catalogued 233 X-ray sources in Cen, including information from previous optical identification campaigns (Cool et al., 2013) and including some additional counterpart identification. Given that MSP optical counterparts tend to be hard to detect (e.g., J1641+3627F in M13; see Cadelano et al., 2020; Zhao et al., 2021), we compared the X-ray sources that we identify as potential MSPs with X-ray counterpart identifications in Henleywillis et al. (2018), to see if some X-ray sources have catalogued optical counterparts, that may indicate the X-ray source is not the counterpart to an MSP. Of the 14 X-ray sources detected in this work, seven were also identified by Haggard et al. (2009) and/or Henleywillis et al. (2018) (as noted in Table 2), but only X-ray sources g1 and k1 have suggested optical counterparts.
The optical counterpart to the X-ray source near MSP G was considered to be an anomalous subgiant or giant based on its location in the colour-magnitude diagrams (Cool et al., 2013). However, the timing solution of MSP G indicates it lies in a non-eclipsing black widow system with a minimum companion mass of 0.018 M☉ (Chen et al., 2023). Thus, either the X-ray source is not associated with the (sub)giant; or the X-ray source is not associated with MSP G.
More interestingly, two potential optical counterparts were found around the position of MSP K; one was found to be an H-bright source without measurable blue excess; the other one, on the contrary, was a blue source with no measurable H excess (Cool et al., 2013). MSP K is an eclipsing black widow with a minimum companion mass of 0.043 M☉ (Chen et al., 2023). Cadelano et al. (2015) found the black widows M5 C (Pallanca et al., 2014) and M71 A share similar light curves and positions in the colour-magnitude diagram (CMD), which are between the main sequence and the white dwarf cooling sequence (see Figure 10 in Cadelano et al., 2015). If these are common properties for BW companions, comparing with the positions of the optical counterparts to MSP K in its CMD (see Figure 3 in Cool et al., 2013), we suggest the blue source without H excess is more plausibly the optical counterpart to MSP K. Alternatively, the other optical counterpart might be the real one to MSP K, while it is also possible that both optical counterparts are chance coincidences. A radio timing position for MSP K could provide sufficient localisation to precisely identify if either optical counterpart is genuine.
We also attempted to search for possible orbital modulations for the potential X-ray counterparts to BWs in Cen (MSPs B, G, H, K, and L). Note that among these five BWs, we can define phases only for MSP B, as it has a published timing solution. We used the known orbital periods from radio observations (Chen et al., 2023; Dai et al., 2023), and the Chandra observation with the longest exposure time (173.7 ks; Obs. ID 13726), which covers 12 to 22 orbits depending on the MSPs’ orbital periods, and then applied pfold script666https://cxc.cfa.harvard.edu/ciao/threads/phase_bin/ to create their orbital light curves. We found no statistically significant orbital variability for any of these counterparts, possibly due to their X-ray faintness, though the counterparts to MSPs K and L show suggestions of X-ray modulations in their light curves. We suggest re-examining their X-ray light curves when timing solutions are available.
We identified more X-ray sources (seven, or a factor of 2) than Henleywillis et al. (2018) did in their work in the vicinities of the MSPs, which is likely a consequence of two factors. First, we used all four Chandra observations of Cen with a total exposure time of 290.9 ks to search for X-ray sources, whereas Henleywillis et al. (2018) only utilised the later two Chandra observations (Obs. IDs 13726 and 13727) with a total exposure time of 222.3 ks. It is therefore expected to identify more X-ray sources, especially faint ones, with deeper observations. Also, the parameters used for wavdetect were more conservative in Henleywillis et al. (2018). For example, we applied a significance threshold of 10-5, an order of magnitude higher than that used in their work, which increased the chance of detecting strong background fluctuations as sources. Since we are only investigating smaller patches of sky, the increased false-alarm rate is acceptable. Specifically, given the very precise timing positions of MSPs A–E, no search area is required to identify their counterparts. The total search area for the remaining MSPs is approximately 3076 arcsec2. And the number of 0.492" pixels we search is about , giving a 13% chance of finding one spurious wavdetect detection among all 18 boxes.
We also estimated the number of chance coincidences of MSPs with unrelated X-ray sources, using
| (1) |
where is the number of chance coincidences of X-ray sources, is the total number of X-ray sources detected in the core region, and are the area of all search regions and of the core region, respectively. is about 3076 arcsec2 (see above), while on the other hand, a total of 81 X-ray sources were detected in the 2.37-arcmin-radius core region. The expected number of chance coincidences therefore yields . Chance coincidences are more likely in the group two sources with larger error circles.
3.2 Spectral analysis
We performed spectral fitting for these potential X-ray counterparts. We first applied the spectral analysis software bxa (Buchner et al., 2014), which connects the nested sampling algorithm UltraNest (Buchner, 2021) with sherpa, to generate Bayesian parameter estimation and model comparison. We considered four absorbed spectral models: powerlaw (PL; xspegpwrlw model), blackbody (BB; xsbbodyrad model), NS hydrogen atmosphere (NSA; xsnsatmos model; Heinke et al., 2006a), and thermal plasma emission (APEC; xsapec model). Specifically for the xsnsatmos model, the parameters of NS mass and radius were fixed to 1.4 M☉ and 10 km, respectively, and the distance to Cen was assumed to be 5.43 kpc (Baumgardt & Vasiliev, 2021). PL, BB, and/or NSA spectra are commonly observed from MSPs in GCs (see e.g., Zhao & Heinke, 2022), while PL models generally describe AGN spectra well, and APEC models generally describe the spectra from coronally active binaries. We also considered two combined models, PL+BB and PL+NSA, as some MSPs (typically spider pulsars) show both non-thermal and thermal components in their spectra, e.g. PSR J04374715 (Zavlin et al., 2002), and 47 Tuc J and W (Bogdanov et al., 2006). The interstellar X-ray absorption was modelled using xstbabs, with the wilm elemental abundance (Wilms et al., 2000) and vern photoelectric absorption cross section (Verner et al., 1996). The hydrogen column number density () towards Cen was assumed to be fixed at cm-2, estimated from the interstellar reddening towards Cen (Harris, 1996, 2010 edition), and the correlation between the optical extinction and (Bahramian et al., 2015), using the ratio (Cardelli et al., 1989). We adopted uniform priors for the PL photon index () between 3 and 10 and of NSA (where is the unredshifted effective temperature of the NS surface in units of Kelvin) between 5 and 6.5, and log-uniform priors for of BB between 0.0001 and 10 and of APEC between 0.008 and 30, where and are unredshifted blackbody temperature and plasma temperature, respectively, both in units of keV. All priors for normalisations were set to log-uniform from 10-8 to 102. X-ray data were grouped to at least one photon per bin for bxa fitting. We used the model_compare script implemented in bxa to compare those models for each source by comparing the Bayesian evidences. Specifically, we applied Jeffreys’ scale (Jeffreys, 1939) and ruled out models if , where represents the highest evidence among all models for a source, and is the evidence of each model.
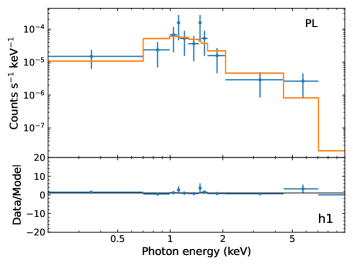
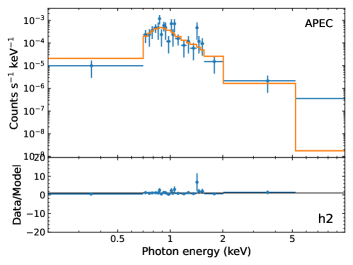
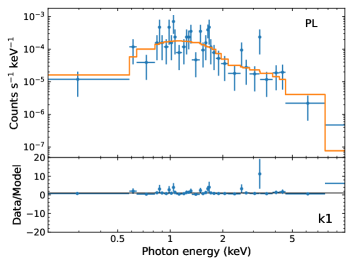
We summarise the spectral fitting and model comparison results obtained using bxa in Table 3. Except for h2, for which the X-ray spectrum only favours the APEC model, the X-ray spectra of all sources can be well fitted by more than one spectral model. Thus, to further examine the predominant component (thermal or non-thermal) in the X-ray emission of each source, we fitted their spectra with PL+BB and PL+NSA models by fixing . We computed the fractions of flux contributed by the BB and NSA components relative to the total fluxes in three bands (0.5–2 keV, 2–8 keV, and 0.5–10 keV, respectively), and listed the results in Table 4. In most PL+NSA fits, either the PL or NSA can dominate, except h1 and k1 where the PL dominates, and r1 where the NSA dominates. PL+BB fits, on the other hand, require PL domination for all but c1, e1, and r1. Based on the results in Table 3 and Table 4, as well as previous studies about typical X-ray emission from different types of MSPs (see e.g., Zhao & Heinke, 2022; Lee et al., 2023), we selected our preferred spectral model for each source (see Table 5; other useful X-ray properties also provided).
We identify three sources (h2, r1, r2) as not matching our spectral assumptions for MSPs–which are that an MSP should have a spectrum dominated by a power-law of photon index 1–2, and/or an NSA component consistent with emission from a fraction of a percent of a NS surface. For instance, the inferred NSATMOS hot spot radii for MSPs in 47 Tuc range from 0.28 to 1.7 km (Bogdanov et al., 2006), thus giving emitting fractions of a NS surface of 0.014% to 0.5% of the surface area of a 12 km NS.
The X-ray spectrum of h2 can only be well fitted by an APEC model, whereas all other five models are ruled out, based on the comparison of Bayesian evidences (the APEC model is more than three orders of magnitude favoured than other models). Hence, the X-ray emission from h2 likely originates from hot plasma (i.e., either coronal activity in an active binary, or a cataclysmic variable) rather than an MSP. A (foreground) active binary would likely have a high optical/X-ray flux ratio (Verbunt et al., 2008), suggesting that the optical counterpart may be bright. Indeed, we found that there is a Gaia DR3 source (Gmag=15.1; Gaia Collaboration et al., 2023) close to the X-ray position of h2, with an angular separation of 0.3 arcsec. Note that the X-ray positional uncertainty of h2 is 0.22 arcsec at 95% confidence level (Table 2). However, due to the lack of proper motions and parallax of that Gaia source, it is hard to determine if it is a member of Cen and/or an optical counterpart to h2. Follow-up optical observations are required to clarify the nature of that potential optical counterpart. Additionally, obtaining a precise timing position for MSP H is crucial to definitively determine its X-ray counterpart.
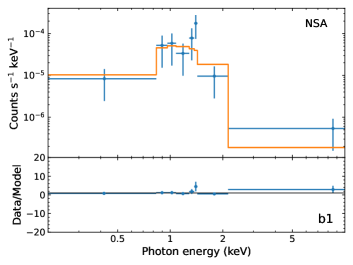
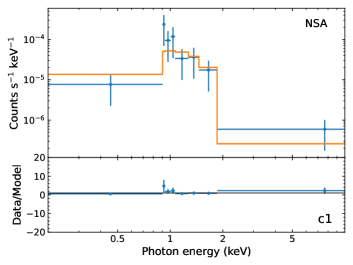
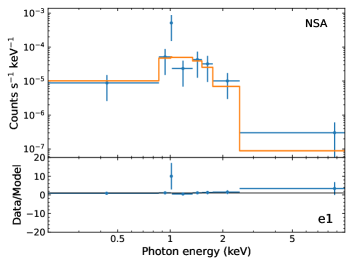
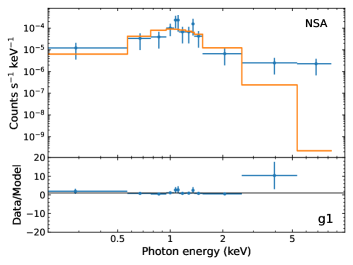
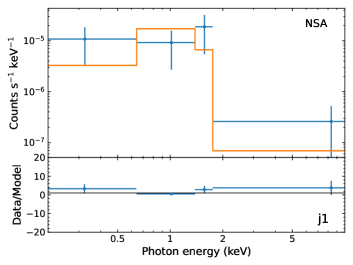
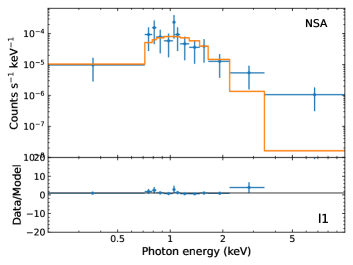
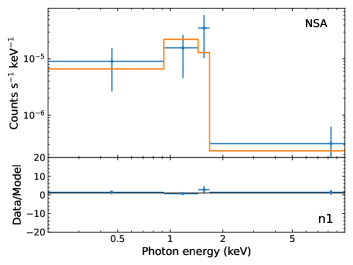
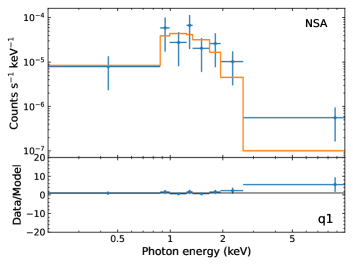
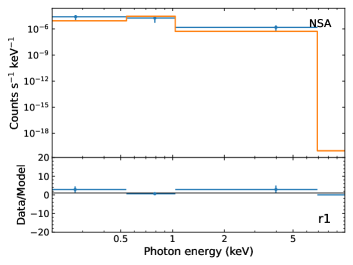
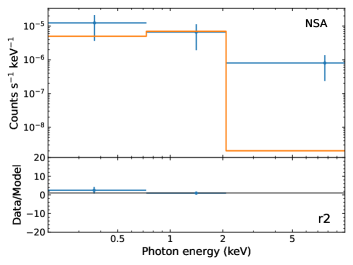
For r1 and r2, the fitted fractions of the NS surface emitting from the NSA model are and , respectively. Thus, the NSA component for r1 needs a much larger emitting area than the full neutron star surface to reproduce its spectrum, ruling out r1. On the other hand, given the large uncertainty of the emission fraction of r2, we cannot completely rule out r2 as a MSP counterpart. However, due to its poorly extracted spectrum and large fitting uncertainties, we do not consider r2 a confident X-ray counterpart. A future precise timing solution of MSP R will eventually determine its true X-ray counterpart. We show the X-ray spectra and the best fits for those counterparts in Figure 2 and Figure 3.
Additionally, despite the non-detection of X-ray counterpart to MSP D, we are able to constrain its X-ray luminosity given its precise timing position. We first calculate the count rate and flux in 0.3–8 keV of a 1-arcsec-radius region centred at MSP D for each observation using srcflux. By assuming a PL model with a fixed photon index , the 1- upper limit of the unabsorbed X-ray luminosity of MSP D was estimated to be 4.01030 erg s-1, at a distance of 5.43 kpc.
| Name | APEC | BB | NSA | PL | PL+BB | PL+NSA | ||||||||||||||
| a1 | 2.23 | 0.26 | 0.30 | 0.41 | 6.29 | 0.00 | 2.65 | 0.69 | 2.72 | 0.20 | 0.45 | 2.75 | 6.22 | 0.16 | ||||||
| b1 | 2.13 | 0.36 | 0.32 | 0.59 | 6.35 | 0.00 | 2.51 | 0.61 | 2.59 | 0.21 | 0.39 | 2.67 | 6.29 | 0.19 | ||||||
| c1 | 1.12 | 0.00 | 0.25 | 0.89 | 6.22 | 0.16 | 3.09 | 0.96 | 3.16 | 0.18 | 0.78 | 3.07 | 6.18 | 0.32 | ||||||
| e1 | 1.47 | 0.24 | 0.30 | 0.63 | 6.30 | 0.00 | 2.87 | 0.55 | 2.99 | 0.11 | 0.45 | 2.87 | 6.25 | 0.53 | ||||||
| g1 | 1.71 | 0.06 | 0.24 | 0.99 | 6.18 | 0.11 | 2.86 | 0.23 | 2.81 | 0.04 | 0.13 | 1.72 | 6.10 | 0.00 | ||||||
| h1 | 2.78 | 0.00 | 0.34 | 1.38 | 6.37 | 0.67 | 2.47 | 0.08 | 2.46 | 0.01 | 0.11 | 2.41 | 5.83 | 0.11 | ||||||
| h2 | 0.76 | 0.00 | 0.18 | 3.74 | 6.02 | 3.43 | 3.63 | 6.39 | 3.01 | 0.18 | 3.93 | 2.49 | 6.02 | 3.61 | ||||||
| j1 | 3.22 | 0.73 | 0.29 | 1.21 | 6.09 | 0.34 | 3.72 | 0.23 | 3.87 | 0.02 | 0.36 | 3.96 | 5.87 | 0.00 | ||||||
| k1 | 3.92 | 0.00 | 0.55 | 3.23 | 6.49 | 4.67 | 1.99 | 0.36 | 1.99 | 0.01 | 0.37 | 1.97 | 5.63 | 0.55 | ||||||
| l1 | 1.20 | 0.42 | 0.25 | 1.13 | 6.22 | 0.07 | 2.97 | 0.00 | 2.98 | 0.01 | 0.10 | 2.91 | 6.02 | 0.38 | ||||||
| n1 | 3.08 | 0.39 | 0.32 | 0.48 | 6.27 | 0.00 | 2.91 | 0.41 | 3.13 | 0.07 | 0.21 | 3.10 | 6.18 | 0.07 | ||||||
| q1 | 2.80 | 0.19 | 0.37 | 0.56 | 6.38 | 0.00 | 2.50 | 0.45 | 2.62 | 0.15 | 0.43 | 2.55 | 6.31 | 0.19 | ||||||
| r1 | 0.06 | 0.72 | 0.08 | 1.69 | 5.52 | 0.89 | 7.81 | 0.00 | 7.76 | 0.01 | 0.11 | 7.76 | 5.58 | 0.02 | ||||||
| r2 | 0.49 | 0.62 | 0.14 | 0.99 | 5.76 | 0.37 | 5.95 | 0.17 | 6.01 | 0.02 | 0.23 | 5.44 | 5.65 | 0.00 | ||||||
| Notes: Spectral fits of six models (APEC, BB, NSA, PL, PL+BB, and PL+NSA) generated by bxa (see Section 3.2). For each model, the primary parameter and the relative evidence (; normalised to the largest evidence in each case) are shown. Values of in bold indicate accepted fits. Uniform model priors are assumed, with a cut of to rule out models. The errors are reported at 1- confidence level. | ||||||||||||||||||||
| Name | PL+BB | PL+NSA | ||||||
| a1 | 0.00 | 0.00 | 0.00 | 0.03 | 0.00 | 0.02 | ||
| b1 | 0.00 | 0.00 | 0.00 | 0.01 | 0.00 | 0.00 | ||
| c1 | 0.00 | 0.00 | 0.00 | 0.98 | 0.73 | 0.96 | ||
| e1 | 0.00 | 0.00 | 0.00 | 0.43 | 0.02 | 0.26 | ||
| g1 | 0.00 | 0.00 | 0.00 | 0.37 | 0.01 | 0.22 | ||
| h1 | 0.00 | 0.00 | 0.00 | 0.00 | 0.00 | 0.00 | ||
| j1 | 0.00 | 0.00 | 0.00 | 0.02 | 0.00 | 0.01 | ||
| k1 | 0.00 | 0.00 | 0.00 | 0.00 | 0.00 | 0.00 | ||
| l1 | 0.00 | 0.00 | 0.00 | 0.57 | 0.02 | 0.39 | ||
| n1 | 0.00 | 0.00 | 0.00 | 0.03 | 0.00 | 0.01 | ||
| q1 | 0.00 | 0.00 | 0.00 | 0.00 | 0.00 | 0.00 | ||
| r1 | 0.98 | 0.00 | 0.97 | 1.00 | 0.07 | 0.99 | ||
| r2 | 0.00 | 0.00 | 0.00 | 0.20 | 0.00 | 0.10 | ||
| Notes: Flux fractions of BB components (columns 2–4) and NSA components (column 5–7) over total unabsorbed fluxes in the bands 0.5–2 keV, 2–8 keV, and 0.5–10 keV, respectively. The photon indices of the PL model were fixed at 2 in all fits. The errors are reported at 1- confidence level. | ||||||||
| Name | Modela | Xcolourc | MSPe | Typef | ||||
| a1 | NSA | 2.62 | 0.25 | 2.96 | 2.45 | 1.04 | A | I |
| b1 | NSA | 9.82 | 1.42 | 11.40 | 2.08 | 4.03 | B | eBW |
| c1 | NSA | 5.12 | 0.34 | 5.57 | 2.91 | 1.97 | C | I |
| e1 | NSA | 4.46 | 0.47 | 5.00 | 2.38 | 1.76 | E | I |
| g1 | NSA | 9.46 | 0.52 | 10.20 | 3.13 | 3.58 | G | BW |
| h1 | PL | 5.67 | 2.94 | 9.16 | 0.71 | 3.23 | H | BW |
| h2 | APEC | 18.60 | 0.82 | 19.50 | 3.38 | 6.88 | – | – |
| j1 | NSA | 3.66 | 0.12 | 3.90 | 3.79 | 1.38 | J | I |
| k1 | PL | 18.60 | 19.00 | 40.90 | 0.02 | 14.40 | K | eBW |
| l1 | NSA | 10.70 | 0.76 | 11.60 | 2.87 | 4.09 | L | eBW |
| n1 | NSA | 3.89 | 0.34 | 4.37 | 2.56 | 1.54 | N | B |
| q1 | NSA | 4.17 | 0.68 | 4.86 | 1.90 | 1.72 | Q | B |
| r1 | NSA | 10.50 | 0.00 | 10.50 | 9.53 | 3.71 | – | – |
| r2 | NSA | 4.81 | 0.01 | 4.97 | 6.63 | 1.75 | – | – |
| Notes: was fixed for all the fits at 1.051021 cm-2. The errors are reported at 1- confidence level. | ||||||||
| a Preferred spectral model for each counterpart. | ||||||||
| b Unabsorbed fluxes in the bands 0.5–2 keV, 2–8 keV, and 0.5–10 keV, respectively, in units of 10-16 erg cm-2 s-1. | ||||||||
| c X-ray colours of the counterparts, defined by . | ||||||||
| d Unabsorbed luminosities in the band 0.5–10 keV, in units of erg s-1, assuming a distance of 5.43 kpc. | ||||||||
| e Confident X-ray counterparts to corresponding MSPs. | ||||||||
| f MSP types. I: isolated; B: binary; BW: non-eclipsing black widow; eBW: eclipsing black widow. | ||||||||
3.3 X-ray colour-magnitude diagram
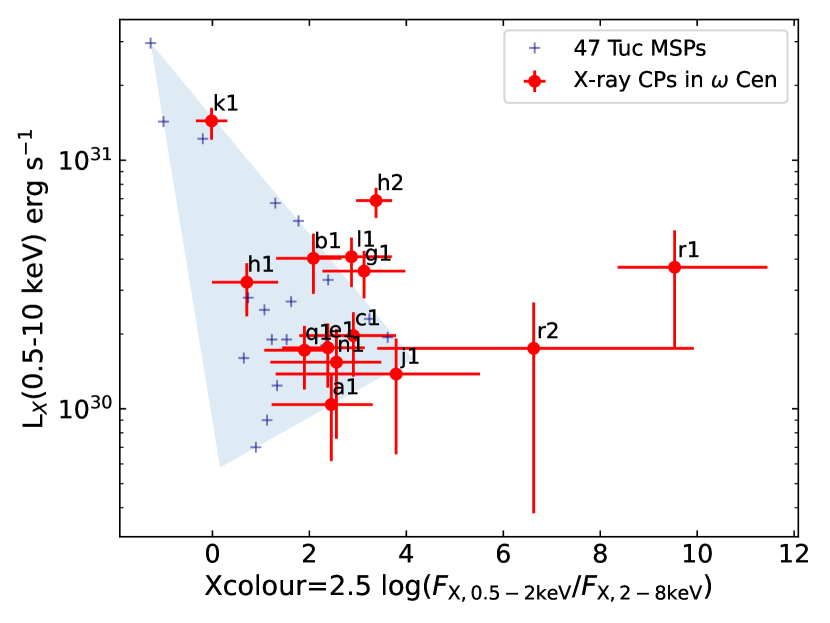
To further verify the X-ray counterparts to MSPs in Cen, we created an X-ray colour-magnitude diagram (CMD) and compared the locations of our suggested X-ray counterparts with the locations of known X-ray MSPs in 47 Tuc in the CMD (see Lugger et al., 2023). The X-ray colour is defined by Xcolour=, where and are the unabsorbed fluxes in the bands 0.5–2 keV and 2–8 keV, respectively (see Table 5). For the MSPs in 47 Tuc, we first extracted their counts from Table 5 in Heinke et al. (2005), and then used the spectral fits in Bogdanov et al. (2006) and Bhattacharya et al. (2017) to convert counts into fluxes via pimms777https://cxc.harvard.edu/toolkit/pimms.jsp. We finally obtained X-ray colours and luminosities for 18 MSPs in 47 Tuc. We show the locations of X-ray counterparts in this work (red dots) and MSPs in 47 Tuc (blue pluses) in the CMD in Figure 4, with a region indicating the likely distribution of MSPs.
Based on the CMD, it is clear that most X-ray counterparts are plausible true matches to their corresponding MSPs, except for sources h2, r1, and r2, whose spectral fits are also not consistent with the observed range of MSPs (see e.g. Bogdanov et al., 2006). Therefore, besides the X-ray counterparts to MSPs A and B, which have been identified by Zhao & Heinke (2022), we suggest X-ray counterparts to nine MSPs in Cen (MSPs C, E, G, H, J, K, L, N, and Q).
4 Discussion
4.1 X-ray luminosities versus companion masses for spider MSPs
It has been found that redbacks (RBs) are relatively X-ray-bright with between erg s-1 and erg s-1, compared to black widows (BWs), with X-ray luminosities of – erg s-1 (Roberts et al., 2014; Zhao & Heinke, 2022). More intriguingly, a plausible bi-modal distribution of X-ray luminosities for eclipsing and non-eclipsing BWs was suggested, showing that eclipsing BWs are almost an order-of-magnitude more luminous than non-eclipsing ones (Zhao & Heinke, 2022). (Note that due to the absence of confirmed non-eclipsing RBs, the bimodality of RB X-ray luminosities is possible, but cannot be verified.) If non-eclipsing BWs are essentially the same as eclipsing BWs, but seen at lower inclination, this implies that BW X-ray luminosity is substantially beamed in the equatorial plane. On the other hand, non-eclipsing BWs could be fundamentally lower in X-ray luminosity than eclipsing BWs. If they are observed at similar inclinations, then the measured mass function differences suggest that non-eclipsing BWs are lower mass than eclipsing BWs. This could explain the lower as due to a smaller wind mass loss from smaller (degenerate?) companions (e.g. Bailes et al., 2011).
In this work, we analysed the MSP population in Cen, which contains five BWs (MSPs B, K, and L are eclipsing BWs, and MSPs G and H are non-eclipsing; see Table 5), providing us a sample to test the bimodal distribution of X-ray luminosities for BWs. The eclipsing BW MSP K ( erg s-1) is noticeably more luminous than the other four BWs, which have – erg s-1. However, we cannot identify a statistically significant difference in X-ray luminosities between the eclipsing and non-eclipsing BWs in Cen (admittedly small numbers). Since the majority of X-ray emission from spider MSPs is considered to be produced by intrabinary shocks, which are generated from the collisions between the pulsar winds and mass outflow from the companion (see e.g., Arons & Tavani, 1993; Roberts et al., 2014; van der Merwe et al., 2020), brighter X-rays from spider MSPs indicate stronger intrabinary shocks produced in the binary systems. Moreover, Roberts et al. (2014) showed that RBs are predicted to have more luminous shocks than BWs, which can be explained as more outflow material from more massive companions to collide with pulsar winds.
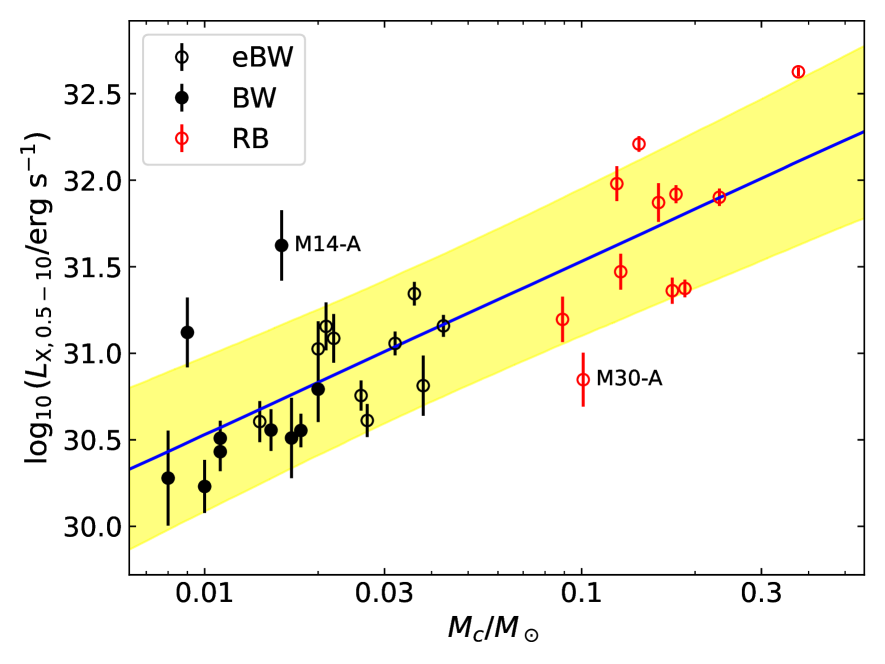
To investigate the influence of companion masses to X-ray luminosities of spider pulsars, we collected all the BWs and RBs in GCs with available companion masses and X-ray fluxes/luminosities published. (We also analysed the X-ray spectrum of M71E, which is a BW with a newly published timing solution (Pan et al., 2023). See Appendix A). We note that it is very difficult to precisely measure the companion masses of spider pulsars in GCs (e.g. through optical observations of their light and radial velocity curves), given their low masses, faint magnitudes, and substantial distances. Among all the known spider pulsars in GCs, only a few have fairly accurate measurements of companion masses, such as M28H (Pallanca et al., 2010), M5C (Pallanca et al., 2014), and NGC6397A (Ferraro et al., 2003). For most spider pulsars, the companion masses are obtained by assuming inclination angles () and neutron star masses () of the binary systems, e.g., ° and M☉ for minimum companion masses (see also below). However, we note that those better constrained companion masses are 30% larger than the corresponding minimum companion masses. Hence, for the interest of this research, the companion masses reported here are all based upon the same assumptions to keep consistency. Along with the results in this work, we compiled 11 RBs and 20 BWs with 10 eclipsing BWs and 10 non-eclipsing BWs (see Table 6). Note that all the observed RBs are eclipsing binaries. We plotted the X-ray luminosities in the band 0.5–10 keV versus the minimum companion masses of spider pulsars in Figure 5. We found that a minimum mass of 0.019 M☉ divides most eclipsing BWs (above) from non-eclipsing BWs (below). The only exception in our catalogue is the eclipsing BW Cen-B, whose companion has a minimum mass of 0.013 M☉ (or a median mass of 0.016 M☉; Dai et al., 2023). In addition, Dai et al. (2020) noted irregular eclipses observed in the orbital duration of Cen-B, which possibly suggests the inclination is low, such that we are seeing the ragged edge of the eclipse region.
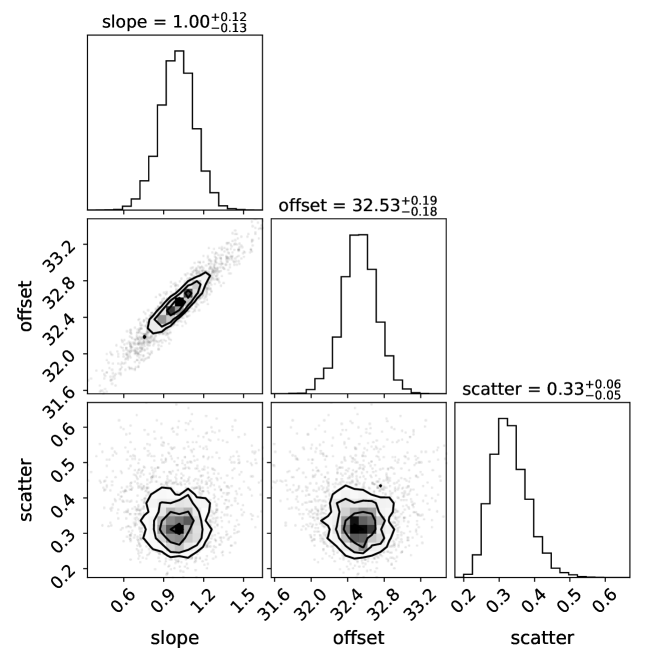
It is clear that there is a correlation between X-ray luminosities and companion masses of spider pulsars (Pearson , ), such that spider pulsars with more massive companions are more luminous in X-rays (see Figure 5). This is consistent with the evidence that RBs generally produce more energetic shocks than BWs (Roberts et al., 2014), and RBs are commonly an order-of-magnitude brighter than BWs (Zhao & Heinke, 2022). Furthermore, we fitted a linear function through the data points (on a logarithmic scale) in Figure 5, using the nested sampling algorithm UltraNest (Buchner, 2021). The best-fit function is given as , where is the X-ray luminosity in 0.5–10 keV, and is the minimum companion mass, plus an intrinsic scatter of of 0.3. We also checked this correlation using X-ray luminosities in 0.3–8 keV, but the best fitted parameters remain consistent within the 1- level.
Almost all spider pulsars in our catalogue are consistent with the best-fit correlation within the scatter region (see Figure 5), with the exceptions of M14A, the brightest BW (non-eclipsing), and M30A, the faintest RB. Zhao & Heinke (2022) showed that M14A’s X-ray spectrum can be well-fitted by a single BB or NSA model, indicating principally thermal emission from M14A. The fitted PL model resulted in a photon index of 3.50.6 (Zhao & Heinke, 2022), which also implies a significant thermal component in its emission. The lack of significant non-thermal emission from M14A might suggest either weak intrabinary shocks in this system, or a beaming effect of the shock emission. It also indicates the observed X-rays originate from the surface of the NS, i.e. the hotspots heated by returning relativistic particles from the magnetosphere. On the other hand, it is intriguing that M14A is such a bright, thermally-emitting MSP in X-rays, compared to other known thermally-emitting MSPs (e.g. Bogdanov et al., 2019). Another possibility is that M14A is a so-called non-eclipsing RB, rather than BW. In this case, its inclination angle is very low (close to face-on configuration), and therefore its true companion mass is much higher than the minimum companion mass, which is inferred by assuming an inclination of 90°. Supposing an inclination range between 10° and 5°, the corresponding companion mass of M14A is in the range of M☉, which would be consistent with a RB. However, it is important to note that the probability of inclination angles less than 10° is only about 1.5%. Thus, M14A might be a member of the missing non-eclipsing RBs, though the required inclination would be highly unlikely. It is noteworthy, however, that there were only five photons available to perform spectral fitting of M14A (see Figure 10 in Zhao & Heinke, 2022), which means the uncertainty in is substantial. Therefore, further X-ray observations of M14 are needed to better constrain and understand the X-ray properties of M14A and other MSPs in M14 (Pan et al., 2021).
Another outlier is M30A, the X-ray faintest RB in our catalogue, with erg s-1 in the band 0.5–10 keV (Zhao et al., 2020). In addition, its companion is the second lightest in our RB sample, with a minimum mass of 0.1 M☉ (Ransom et al., 2004). However, Terzan 5A, the RB with the lightest companion ( M☉; Ransom et al., 2005), has a higher average X-ray luminosity of erg s-1 (Bogdanov et al., 2021), though highly variable (usually erg/s, except for 1-5 ks short flares reaching erg/s). The large difference in X-ray luminosities of RBs with comparable companion masses implies other factor(s) may influence the observed X-ray emission, besides companion masses. We suggest that the shock emission is likely beamed along the shock surface, and hence the inclination to the shock surface also alters the received X-ray emission (see e.g., Romani & Sanchez, 2016; Wadiasingh et al., 2017).
It is also worth noting that the companion masses can be obtained from the binary mass function (in unit of solar mass)
| (2) |
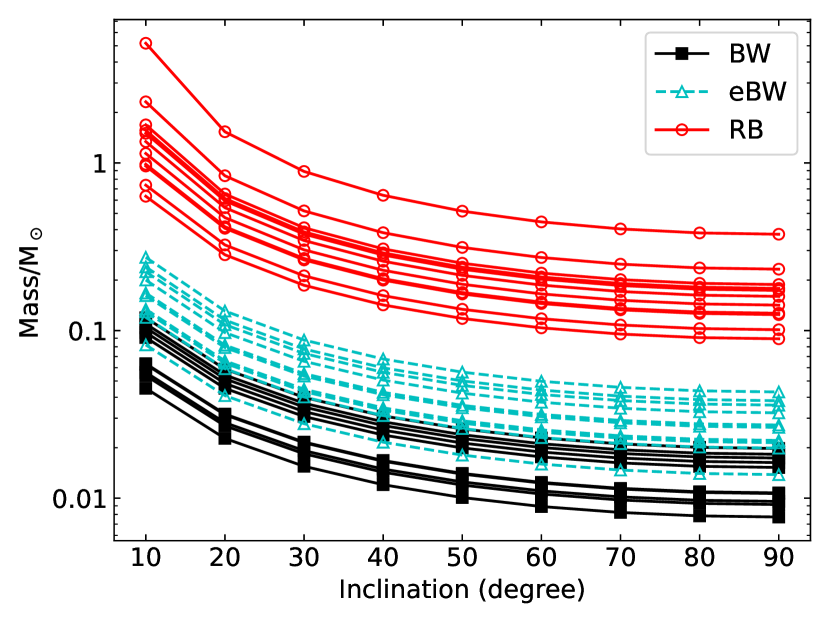
where is the projected semi-major axis and is the inclination angle, is the orbital period, and are the companion mass and pulsar mass, respectively, and is the gravitational constant. The minimum companion masses are computed by assuming an inclination angle of 90° (i.e., edge-on) and a typical pulsar mass of 1.4 M☉. Given that inclination angles might be widely distributed, using minimum companion masses to explore the correlation with X-ray luminosities may introduce some bias. For example, for a given mass function, the derived companion mass at an inclination of 45° is about 40% to 60% larger than its minimum companion mass. (However, this variation in implied mass due to different inclination angles would not be enough to explain the difference in companion masses between eclipsing and non-eclipsing black widows.) In Figure 6, we illustrate the companion masses of our catalogued spider pulsars at different inclination angles based on their corresponding mass functions.
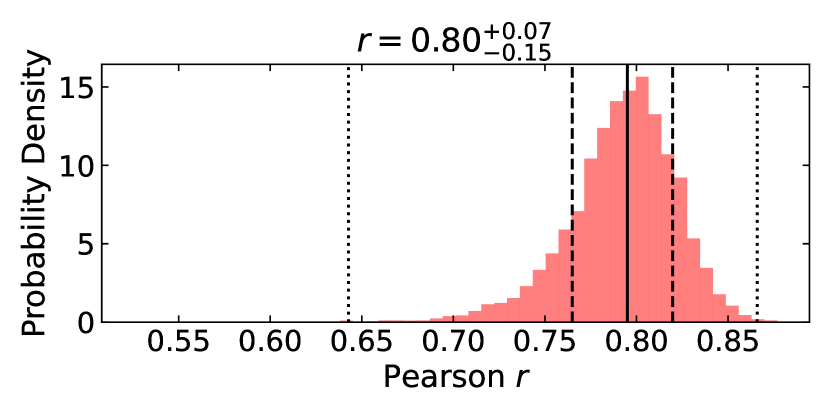
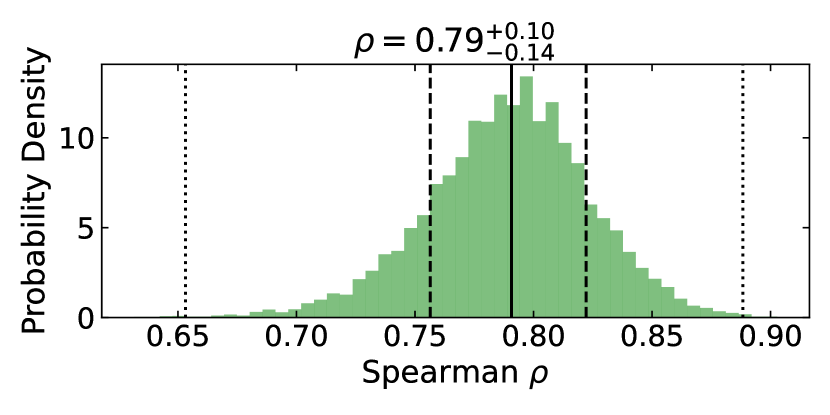
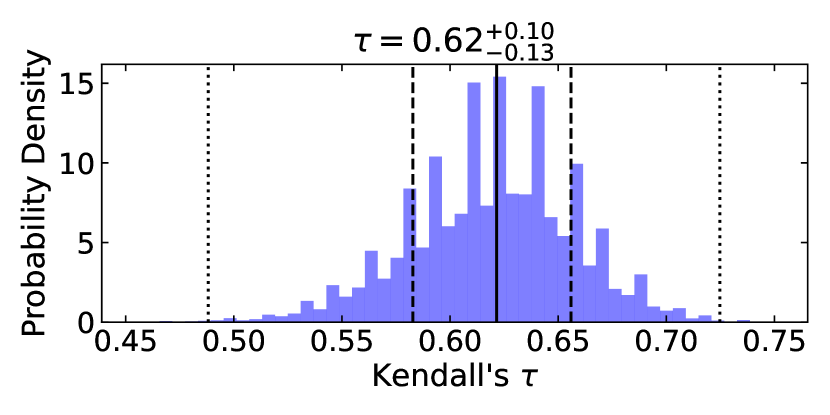
To thoroughly examine the correlation between X-ray luminosities and companion masses in our sample of spider pulsars, we implemented a rigorous approach involving simulations. We generated simulations by randomly selecting inclination angles for each spider pulsar based on a probability distribution derived from a sine function between 0 and /2, as described by Backer (1998). Using the determined mass functions of spider pulsars (listed in Table 6), we calculated the corresponding companion masses using Equation 2, assuming a fixed pulsar mass of 1.4 M☉. Subsequently, utilising the simulated companion masses, we assessed the significance of the correlation between their simulated masses and by investigating the Pearson (), Spearman (), and Kendall’s () correlation coefficients. We performed this calculation for a total of 10,000 iterations, generating distributions of these correlation coefficients (Figure 7). The obtained coefficients with 3- confidence levels are , , and , respectively, indicating a very strong positive correlation of versus (or a very strong linear correlation of versus ) for spider pulsars, even regardless of the inclination angles. Therefore, our findings indicate that as the companion mass increases, the X-ray luminosity of the spider pulsar tends to increase as well. It likely suggests that a more massive companion can produce stronger winds (see e.g. Bailes et al., 2011), and thus generate stronger intra-binary shocks with relativistic pulsar winds, leading to higher X-ray luminosities as observed.
In addition, since the mass function contains information of both companion mass and inclination, which more generally reflects spider pulsar properties, we therefore investigated the correlation between X-ray luminosities and mass functions of spider pulsars. We calculated their mass functions using Equation 2 with the values of and listed in Table 6. (It is noticeable that a recent work by Koljonen & Linares 2023 showed that there is no significant correlation between X-ray luminosities and orbital periods for spider pulsars.) We found a significant correlation of X-ray luminosities with mass functions (both in logarithmic scale), with Pearson , and . Using the same fitting prescription discussed above, we obtained a best-fit function of , where MF represents mass functions in units of solar masses, with an intrinsic scatter of of 0.3. We suggest that both methods of using minimum companion masses and mass functions can provide reasonable predictions of X-ray luminosities for spider pulsars with radio timing solutions. However, the use of mass functions to infer X-ray luminosities may help mitigate some of the bias introduced by relying solely on minimum companion masses.
| MSP | Typea | xc | Reference | ||||||
| (days) | (lt-s) | (M☉) | (M☉) | (M☉) | (erg s-1) | (erg s-1) | |||
| 47Tuc-J | eBW | 0.121 | 0.040 | 0.021 | 0.025 | \al@Freire2017,Heinke2005,Bogdanov2006; \al@Freire2017,Heinke2005,Bogdanov2006; \al@Freire2017,Heinke2005,Bogdanov2006 | |||
| 47Tuc-O | eBW | 0.136 | 0.045 | 0.022 | 0.026 | \al@Freire2017,Heinke2005,Bogdanov2006; \al@Freire2017,Heinke2005,Bogdanov2006; \al@Freire2017,Heinke2005,Bogdanov2006 | |||
| 47Tuc-R | eBW | 0.066 | 0.033 | 0.026 | 0.031 | \al@Freire2017,Heinke2005,Bogdanov2006; \al@Freire2017,Heinke2005,Bogdanov2006; \al@Freire2017,Heinke2005,Bogdanov2006 | |||
| 47Tuc-W | RB | 0.133 | 0.243 | 0.127 | 0.148 | \al@Freire2017,Heinke2005,Bogdanov2006,Edmonds2002; \al@Freire2017,Heinke2005,Bogdanov2006,Edmonds2002; \al@Freire2017,Heinke2005,Bogdanov2006,Edmonds2002; \al@Freire2017,Heinke2005,Bogdanov2006,Edmonds2002 | |||
| M13-E | eBW | 0.113 | 0.036 | 0.020 | 0.023 | \al@Wang2020,Zhao2021; \al@Wang2020,Zhao2021 | |||
| M14-A | BW | 0.228 | 0.047 | 0.016 | 0.019 | \al@Pan2021,Zhao2022; \al@Pan2021,Zhao2022 | |||
| M22-A | BW | 0.203 | 0.046 | 0.017 | 0.020 | \al@Lynch2011,Amato2019; \al@Lynch2011,Amato2019 | |||
| M28-G | BW | 0.105 | 0.016 | 0.010 | 0.011 | 11; 12; 13 | |||
| M28-H | RB | 0.435 | 0.719 | 0.174 | 0.203 | 11; 12; \al@Vurgun2022,Pallanca2010; \al@Vurgun2022,Pallanca2010 | |||
| M28-I* | RB | 0.459 | 0.766 | 0.178 | 0.209 | 11; 12; \al@Vurgun2022,Pallanca2013; \al@Vurgun2022,Pallanca2013 | |||
| M28-J | BW | 0.097 | 0.025 | 0.015 | 0.018 | 11; 12; 13 | |||
| M28-M | BW | 0.243 | 0.032 | 0.011 | 0.012 | \al@Vurgun2022,Douglas2022; \al@Vurgun2022,Douglas2022 | |||
| M30-A | RB | 0.174 | 0.235 | 0.101 | 0.118 | \al@Ransom2004,ZhaoY2020; \al@Ransom2004,ZhaoY2020 | |||
| M5-C | eBW | 0.087 | 0.057 | 0.038 | 0.044 | \al@Zhao2022,Pallanca2014; \al@Zhao2022,Pallanca2014; 20 | |||
| M5-G | BW | 0.114 | 0.036 | 0.020 | 0.023 | 20 | |||
| M62-B | RB | 0.145 | 0.253 | 0.124 | 0.145 | \al@Lynch2012,Oh2020,Cocozza2008; \al@Lynch2012,Oh2020,Cocozza2008; \al@Lynch2012,Oh2020,Cocozza2008 | |||
| M71-A | eBW | 0.177 | 0.078 | 0.032 | 0.037 | \al@Cadelano2015,Elsner2008; \al@Cadelano2015,Elsner2008 | |||
| M71-E | BW | 0.037 | 0.007 | 0.008 | 0.009 | \al@Han2021,Pan2023; \al@Han2021,Pan2023; 24 | |||
| M92-A | RB | 0.201 | 0.399 | 0.160 | 0.187 | \al@Zhao2022,Pan2020; \al@Zhao2022,Pan2020 | |||
| NGC6397-A | RB | 1.354 | 1.653 | 0.188 | 0.220 | \al@D'Amico2001,Bogdanov2010,Ferraro2001,Ferraro2003,Mucciarelli2013; \al@D'Amico2001,Bogdanov2010,Ferraro2001,Ferraro2003,Mucciarelli2013; \al@D'Amico2001,Bogdanov2010,Ferraro2001,Ferraro2003,Mucciarelli2013; \al@D'Amico2001,Bogdanov2010,Ferraro2001,Ferraro2003,Mucciarelli2013; \al@D'Amico2001,Bogdanov2010,Ferraro2001,Ferraro2003,Mucciarelli2013 | |||
| NGC6397-B | RB | 1.977 | 2.580 | 0.232 | 0.273 | \al@Bogdanov2010,Zhang2022,Pallanca2017; \al@Bogdanov2010,Zhang2022,Pallanca2017; \al@Bogdanov2010,Zhang2022,Pallanca2017 | |||
| NGC6544-A | BW | 0.071 | 0.012 | 0.009 | 0.011 | \al@Zhao2022,Lynch2012; \al@Zhao2022,Lynch2012 | |||
| Cen-B | eBW | 0.090 | 0.021 | 0.014 | 0.016 | 8; 24; 37 | |||
| Cen-G | BW | 0.109 | 0.032 | 0.018 | 0.021 | 24; 38 | |||
| Cen-H | BW | 0.136 | 0.022 | 0.011 | 0.012 | 24; 38 | |||
| Cen-K | eBW | 0.094 | 0.068 | 0.043 | 0.050 | 24; 38 | |||
| Cen-L | eBW | 0.159 | 0.062 | 0.027 | 0.032 | 24; 38 | |||
| Ter5-A | RB | 0.076 | 0.120 | 0.089 | 0.104 | \al@Ransom2005,Bogdanov2021; \al@Ransom2005,Bogdanov2021 | |||
| Ter5-O | eBW | 0.259 | 0.112 | 0.036 | 0.042 | \al@Ransom2005,Bogdanov2021; \al@Ransom2005,Bogdanov2021 | |||
| Ter5-P | RB | 0.363 | 1.272 | 0.376 | 0.445 | \al@Ransom2005,Bogdanov2021; \al@Ransom2005,Bogdanov2021 | |||
| Ter5-ad | RB | 1.094 | 1.103 | 0.142 | 0.165 | \al@Bogdanov2021,Hessels2006; \al@Bogdanov2021,Hessels2006 | |||
| Notes: * M28-I switches between rotation-powered and accretion-powered states (Papitto et al., 2013). The X-ray luminosities reported here are based on the rotation-powered (or pulsar) state observed in 2015 (Vurgun et al., 2022). | |||||||||
| The X-ray luminosities of Terzan5-A reported here are time-averaged over low- and high-flux states. See Bogdanov et al. (2021) for more details. | |||||||||
| a BW: non-eclipsing black widow; eBW: eclipsing black widow; RB: redback. Note that all RBs eclipse. | |||||||||
| b Orbital periods in units of days, obtained from Paulo Freire’s GC Pulsar Catalogue (https://www3.mpifr-bonn.mpg.de/staff/pfreire/GCpsr.html). | |||||||||
| c Projected semimajor axis in units of light-seconds, obtained from Paulo Freire’s GC Pulsar Catalogue. | |||||||||
| d Mass functions (MFs; in units of M☉) of spider pulsars in logarithm scale, calculated from and using Equation 2 | |||||||||
| e Minimum and median companion masses, assuming a neutron star mass of 1.4 M☉ and an inclination angle of 90° and 60°, respectively. | |||||||||
| References: (1) Freire et al. (2017); (2) Heinke et al. (2005); (3) Bogdanov et al. (2006); (4) Edmonds et al. (2002); (5) Wang et al. (2020); (6) Zhao et al. (2021); (7) Pan et al. (2021); (8) Zhao & Heinke (2022); (9) Lynch et al. (2011); (10) Amato et al. (2019); (11) Begin (2006); (12) Paulo Freire’s GC Pulsar Catalogue (https://www3.mpifr-bonn.mpg.de/staff/pfreire/GCpsr.html); (13) Vurgun et al. (2022); (14) Pallanca et al. (2010); (15) Pallanca et al. (2013); (16) Douglas et al. (2022); (17) Ransom et al. (2004); (18) Zhao et al. (2020); (19) Pallanca et al. (2014); (20) Zhang et al.(submitted); (21) Lynch et al. (2012); (22) Oh et al. (2020); (23) Cocozza et al. (2008); (24) Cadelano et al. (2015); (25) Elsner et al. (2008); (26) Han et al. (2021); (27) Pan et al. (2023); (28) this work; (29) Pan et al. (2020); (30) D’Amico et al. (2001); (31) Bogdanov et al. (2010); (32) Ferraro et al. (2001); (33) Ferraro et al. (2003); (34) Mucciarelli et al. (2013); (35) Zhang et al. (2022); (36) Pallanca et al. (2017); (37) Dai et al. (2023); (38) Chen et al. (2023); (39) Ransom et al. (2005); (40) Bogdanov et al. (2021); (41) Hessels et al. (2006). | |||||||||
4.2 Applications
An immediate application of the derived correlations between X-ray luminosities and minimum companion masses/mass functions is to predict X-ray luminosities of spider pulsars without determined X-ray counterparts yet, due to unsolved timing positions and/or limited X-ray sensitivity. In Table 7, we collected spider pulsars with reported binary parameters but without reported X-ray detections, and calculated their corresponding mass functions and companion masses. We then applied the correlation of versus mass function to predict their X-ray luminosity ranges (column 8 in Table 7).
Furthermore, based on the limiting X-ray luminosities (i.e. the lower limits of X-ray luminosities for sources to be detected) of corresponding GCs, we are able to predict if any of those spider pulsars might be detected using current X-ray observations. Specifically, the limiting of 47 Tuc is about erg s-1 (Cheng et al. 2019; see also Table 1 in Zhao & Heinke 2022), while the predicted of 47 Tuc I, P, V, ac, and ad are all well above this limit, and therefore their X-ray counterparts are expected to be detected in existing Chandra observations of 47 Tuc. In fact, all of these X-ray counterparts possibly have been tabulated in the existing Chandra surveys of 47 Tuc (see e.g. Heinke et al., 2005; Bhattacharya et al., 2017), especially for 47 Tuc V and ad, whose X-ray luminosities are expected to be larger than erg s-1. 47 Tuc I has a reported timing position, but is extremely close to another MSP, 47 Tuc G (0.12 arcsec apart in projected angular distance; Freire et al. 2017), impossible to spatially resolve with Chandra observations. Bogdanov et al. (2006) identified and analysed one X-ray counterpart to 47 Tuc G and I together, yielding an unaborbed X-ray luminosity (0.3–8 keV) of erg s-1.
M3 A has no timing position published yet, while its X-ray counterpart is unlikely to be detected using currently available Chandra observations, since the upper limit of its predicted X-ray luminosity is slightly lower than the limiting luminosity ( erg s-1) of M3 (Zhao et al., 2019). This is consistent with the results of X-ray source identifications in M3 conducted by Zhao et al. (2019), who found none of the detected X-ray sources therein to be a confident MSP candidate.
M62 E and F are of great interest, given their available timing solutions (Lynch et al., 2012) and sufficient X-ray brightness (the limiting of M62 is erg s-1; Bahramian et al. 2020). We noticed, however, that only M62 B and C have been identified with X-ray counterparts (see Oh et al., 2020), whereas the other eight detected MSPs, four of which have published timing solutions, have no X-ray identifications. We briefly looked into the Chandra observations of M62, and found likely X-ray counterparts to M62 E and F, respectively. Moreover, we searched for these two X-ray counterparts in the Goose Catalogue888https://bersavosh.github.io/research/goose.html (Bahramian et al., 2020), where X-ray sources in M62 were catalogued. Based on the reported X-ray positions, we found two sources, CXOU J170113.24300646.8 and J170112.77300651.9 in their catalogue, likely match M62 E and F, respectively. The matching source to M62 E has an X-ray luminosity (0.5–10 keV) of erg s-1, fitted by a PL model (photon index ), whereas the upper limit of the predicted X-ray luminosity of M62 E is erg s-1, slightly lower than that of its matching source. However, we note that M62 E is very close to a bright candidate CV (source 24 in Oh et al. 2020), and therefore, the X-ray emission from M62 E could be contaminated by its neighbouring CV. Hence, CXOU J170113.24300646.8 is still favoured as the genuine X-ray counterpart to M62 E. On the other hand, CXOU J170112.77300651.9, the matching source to M62 F, has an X-ray luminosity (0.5–10 keV) of erg s-1, which falls into the predicted range of X-ray luminosity of M62 F. Plus, its fitted photon index is of , typical for BWs. We thus suggest CXOU J170112.77300651.9 is highly likely to be the X-ray counterpart to M62 F.
In addition, it is interesting to note that M62 C (Possenti et al., 2003; Lynch et al., 2012) has an orbital period of days, similar to other known RBs, and a mass function of , which is a factor of 2.7–57 lower than that of RBs with similar periods (such as M30 A and 47 Tuc V). No radio eclipses have been detected from M62 C (Possenti et al., 2003), but this might be explained by a low inclination (so our line of sight avoids the eclipsing material), which would also explain the low mass function. M62 C’s X-ray luminosity (0.5–10 keV) of erg s-1 (Oh et al., 2020) is typical for RBs, supporting this identification. If M62 C has the same companion mass as M30 A, and M62 C simply has a lower inclination (assuming M30 A has a 60° inclination to our line of sight), we compute that M62 C would have an inclination of 37°. The probability of obtaining such a low inclination by chance is 20%, which is quite plausible for a population of 17 known globular cluster redbacks. These inclinations and probabilities are probably overestimates, as M30 A has the lowest mass function among redbacks with similar orbital periods. More detailed X-ray studies of MSPs in M62, and searches for radio eclipse signatures from M62 C, would be productive future projects.
M14 D and E are two recently discovered redbacks with no timing positions yet (Pan et al., 2021). Although the limiting of M14 of erg s-1 (Bahramian et al., 2020) is relatively high, the predicted X-ray luminosities of M14 D and E suggest both MSPs may be detected with current Chandra observations. Indeed, Y. Zhao et al. (in preparation) used joint observations of Chandra, HST, and VLA of M14, and found one strong redback candidate and also another plausible redback candidate. Future timing solutions of the MSPs in M14 can verify these candidates.
Both NGC 6440 D (RB; Freire et al. 2008) and H (BW; Vleeschower et al. 2022) have reported timing positions, whereas their corresponding X-ray counterparts remain undetected. Due to occasional outbursts of X-ray transients in this cluster (e.g. in’t Zand et al., 2001; Heinke et al., 2010), only a few Chandra observations are available for faint X-ray source identifications. Due to obscuration and crowding in the core, the limiting is relatively high, at erg s-1 (Pooley et al., 2002). Therefore, NGC 6440 H is unlikely to be detected given its X-ray luminosity is predicted to be much lower than the limiting . Indeed, we checked the X-ray image of NGC 6440 and found no clear counterpart at the timing position of NGC 6440 H. We did not find a clear X-ray counter to NGC 6440 D either, likely implying its X-ray luminosity falls into the lower half of the prediction. It is also interesting to note that NGC 6440 D is the slowest rotating spider MSP in GCs found to date, with a spin period of 13.50 ms (Freire et al., 2008). The other two known ‘slow’ spider MSPs, M30 A ( ms; Ransom et al. 2004) and Terzan 5 A ( ms; Ransom et al. 2005), are the faintest RBs in X-rays in our catalogue. The X-ray-faint nature of these slow rotating spider MSPs might stem from weak pulsar winds produced by the neutron star, which as a result weakens intra-binary shocks. The X-ray luminosity of NGC 6440 D, therefore, might be even lower than our prediction. However, more samples of slow rotating spider MSPs would be needed to confirm this trend.
M28 L and N are located in the crowded core region of M28 (see e.g. Figure 1 in Vurgun et al. 2022), adjacent to bright X-ray sources. Thus, even though these two timing-solved BWs are predicted to be brighter than the limiting of M28 of erg s-1 (Bahramian et al., 2020), their emission is highly likely to be contaminated and/or concealed by their neighbouring bright sources. For example, Bogdanov et al. (2011) analysed the potential X-ray counterpart to M28 L and suggested the X-rays extracted around M28 L were most likely dominated by unrelated source(s) due to source blending. More recently, Vurgun et al. (2022) claimed an identification of the X-ray counterpart to M28 L, and measured its (0.5–10 keV) erg s-1. However, it would be very unusual if this X-ray source is the true X-ray counterpart to M28 L, since non-eclipsing BWs typically have X-ray luminosities lower than erg s-1 (see Figure 5). Therefore, the X-ray counterpart to M28 L identified by Vurgun et al. (2022) is probably not genuine. And we suggest that M28 L and N are hardly detectable with current Chandra observations.
The X-ray counterparts to NGC 6624 F and NGC 6712 A are not detectable, since their emission is completely screened by persistent luminous LMXBs (peak erg s-1) in their corresponding clusters (see Table 7 in Bahramian & Degenaar 2023). Finally, the limiting of NGC 6760 is about erg s-1 (Bahramian et al., 2020), and thus NGC 6760 A is more likely undetectable based on its predicted X-ray luminosity. Since NGC 6760 A has a published timing position (Freire et al., 2005), we simply looked into the Chandra observation of NGC 6760, and found no clear counterpart at its timing position, which is consistent with our prediction.
| MSP | Type | x | * | Reference | ||||
| (days) | (lt-s) | (M☉) | (M☉) | (M☉) | (erg s-1) | |||
| 47Tuc-I | BW | 0.230 | 0.038 | 5.938 | 0.013 | 0.015 | [30.21, 31.08] | 1 |
| 47Tuc-P | BW | 0.147 | 0.038 | 5.566 | 0.018 | 0.020 | [30.35, 31.20] | 2 |
| 47Tuc-V | RB | 0.212 | 0.742 | 2.012 | 0.305 | 0.359 | [31.53, 32.45] | 2 |
| 47Tuc-ac | eBW | 0.179 | 0.020 | 6.607 | 0.008 | 0.009 | [29.96, 30.87] | 3 |
| 47Tuc-ad | RB | 0.318 | 0.682 | 2.475 | 0.205 | 0.240 | [31.38, 32.28] | 3 |
| M3-A | BW | 0.136 | 0.026 | 6.011 | 0.012 | 0.014 | [30.18, 31.06] | 4 |
| M62-E | eBW | 0.158 | 0.070 | 4.831 | 0.031 | 0.036 | [30.61, 31.44] | 5 |
| M62-F | BW | 0.205 | 0.057 | 5.321 | 0.021 | 0.025 | [30.43, 31.28] | 5 |
| M14-D | RB | 0.743 | 0.755 | 3.078 | 0.125 | 0.145 | [31.19, 32.06] | 4 |
| M14-E | RB | 0.846 | 1.102 | 2.698 | 0.170 | 0.199 | [31.31, 32.20] | 4 |
| NGC6440-D | RB | 0.286 | 0.397 | 3.086 | 0.124 | 0.144 | [31.19, 32.05] | 6 |
| NGC6440-H | BW | 0.361 | 0.025 | 6.874 | 0.006 | 0.007 | [29.86, 30.79] | 7 |
| NGC6624-F | RB | 0.221 | 0.285 | 3.291 | 0.105 | 0.122 | [31.12, 31.98] | 3 |
| M28-L | BW | 0.226 | 0.057 | 5.409 | 0.020 | 0.023 | [30.40, 31.25] | 8,9 |
| M28-N | BW | 0.198 | 0.050 | 5.475 | 0.019 | 0.022 | [30.38, 31.23] | 10 |
| NGC6712-A | BW | 0.148 | 0.049 | 5.236 | 0.023 | 0.026 | [30.46, 31.31] | 11 |
| NGC6760-A | BW | 0.141 | 0.038 | 5.541 | 0.018 | 0.021 | [30.36, 31.21] | 12 |
| * Unabsorbed X-ray luminosities predicted using the correlation between and MF (see text for details). The presented ranges of X-ray luminosities take both intrinsic scatter and 1- uncertainty into account. | ||||||||
| Reference: (1) Freire et al. (2017); (2) Ridolfi et al. (2016); (3) Ridolfi et al. (2021); (4) Pan et al. (2021); (5) Lynch et al. (2012); (6) Freire et al. (2008); (7) Vleeschower et al. (2022); (8) Paulo Freire’s GC Pulsar Catalogue (https://www3.mpifr-bonn.mpg.de/staff/pfreire/GCpsr.html); (9) Bogdanov et al. (2011); (10) Douglas et al. (2022); (11) Yan et al. (2021); (12) Freire et al. (2005). | ||||||||
5 Conclusions
In this work, we presented a comprehensive X-ray study of the known MSPs in the globular cluster Cen. Utilising the latest published radio detections and timing solutions of the 18 MSPs in Cen (Chen et al., 2023; Dai et al., 2023), we conducted a targeted search for their X-ray counterparts using four Chandra observations with a total exposure time of 290.9 ks. Our analysis yielded 14 X-ray sources in the vicinities of the radio positions of 12 MSPs, with seven newly detected sources and seven sources previously detected (Haggard et al., 2009; Henleywillis et al., 2018).
By performing X-ray spectral fitting analyses for these sources, we found that most of them can be well described by a neutron star hydrogen atmosphere model (Heinke et al., 2006a), with exceptions such as sources h1, k1, and h2, which are best fitted by a power-law model and a thermal plasma emission model, respectively. Furthermore, taking into account the X-ray colours of the sources and their positions in the colour-magnitude diagram, we identified 11 confident X-ray counterparts to the MSPs in Cen, of which nine (MSPs Cen C, E, G, H, J, K, L, N, and Q) were newly identified in this work. The X-ray luminosities of these identified MSPs range from erg s-1 to erg s-1, in the band 0.5–10 keV. Notably, MSP Cen K has an X-ray luminosity of erg s-1, making it one of the most X-ray-luminous black widow MSPs in Galactic globular clusters.
We also studied (Appendix A) the X-ray counterpart to MSP E (or M71E) in the GC M71, which has the shortest orbital period among all discovered MSP binaries found so far (Han et al., 2021; Pan et al., 2023). Using the 52.5-ks Chandra observation of M71, we extracted and analysed the X-ray spectrum of M71E. The X-ray spectrum of M71E is well described by blackbody-like models (BB or NSA), and we determined its unabsorbed X-ray luminosity to be erg s-1 within the 0.5–10 keV range, at a distance of 4 kpc.
We conducted an empirical investigation of the correlation between X-ray luminosities and companion masses as well as mass functions of spider pulsars in globular clusters. Our analysis yielded a best-fit function of , where is the X-ray luminosity in 0.5–10 keV, and is the minimum companion mass. For the mass functions, we found a relation of , where MF denotes mass functions in the units of solar mass. Both fittings yield an intrinsic scatter of of 0.3. We suggested that the inclination to the intrabinary shocks may also influence the observed X-ray emission from spider MSPs, in addition to the companion masses.
Acknowledgements
We thank the referee for exceptionally useful and constructive comments. We thank Weiwei Chen for useful discussions of the radio localisation of MSP H. CH is supported by NSERC Discovery Grant RGPIN-2016-04602. JZ is supported by China Scholarship Council (CSC), File No. 202108180023. This research has made use of data obtained from the Chandra Data Archive, and software provided by the Chandra X-ray Centre (CXC) in the application packages ciao, sherpa, ds9, and pimms. This work has used TOPCAT, an interactive graphical viewer and editor for tabular data (Taylor, 2005). This research has made use of the VizieR catalogue access tool, CDS, Strasbourg, France (DOI: 10.26093/cds/vizier). The original description of the VizieR service was published by Ochsenbein et al. (2000). This research has made use of NASA’s Astrophysics Data System.
Data Availability
The X-ray data underlying this article are available in the Chandra Data Archive (https://cxc.harvard.edu/cda/) by searching the Observation IDs listed in Table 1 in the Search and Retrieval interface, ChaSeR (https://cda.harvard.edu/chaser/).
References
- Abdo et al. (2010) Abdo A. A., et al., 2010, A&A, 524, A75
- Alpar et al. (1982) Alpar M. A., Cheng A. F., Ruderman M. A., Shaham J., 1982, Nature, 300, 728
- Amato et al. (2019) Amato R., D’Aı A., Del Santo M., de Martino D., Marino A., Di Salvo T., Iaria R., Mineo T., 2019, MNRAS, 486, 3992
- Arons & Tavani (1993) Arons J., Tavani M., 1993, ApJ, 403, 249
- Backer (1998) Backer D. C., 1998, ApJ, 493, 873
- Bahramian & Degenaar (2023) Bahramian A., Degenaar N., 2023, in , Handbook of X-ray and Gamma-ray Astrophysics. Edited by Cosimo Bambi and Andrea Santangelo. p. 120, doi:10.1007/978-981-16-4544-0_94-1
- Bahramian et al. (2013) Bahramian A., Heinke C. O., Sivakoff G. R., Gladstone J. C., 2013, ApJ, 766, 136
- Bahramian et al. (2015) Bahramian A., Heinke C. O., Degenaar N., Chomiuk L., Wijnands R., Strader J., Ho W. C. G., Pooley D., 2015, MNRAS, 452, 3475
- Bahramian et al. (2020) Bahramian A., et al., 2020, ApJ, 901, 57
- Bailes et al. (2011) Bailes M., et al., 2011, Science, 333, 1717
- Baumgardt & Hilker (2018) Baumgardt H., Hilker M., 2018, MNRAS, 478, 1520
- Baumgardt & Vasiliev (2021) Baumgardt H., Vasiliev E., 2021, MNRAS, 505, 5957
- Begin (2006) Begin S., 2006, PhD thesis, University of British Columbia, doi:http://dx.doi.org/10.14288/1.0066153, https://open.library.ubc.ca/collections/ubctheses/24/items/1.0066153
- Bhattacharya et al. (2017) Bhattacharya S., Heinke C. O., Chugunov A. I., Freire P. C. C., Ridolfi A., Bogdanov S., 2017, MNRAS, 472, 3706
- Bogdanov et al. (2006) Bogdanov S., Grindlay J. E., Heinke C. O., Camilo F., Freire P. C. C., Becker W., 2006, ApJ, 646, 1104
- Bogdanov et al. (2010) Bogdanov S., van den Berg M., Heinke C. O., Cohn H. N., Lugger P. M., Grindlay J. E., 2010, ApJ, 709, 241
- Bogdanov et al. (2011) Bogdanov S., et al., 2011, ApJ, 730, 81
- Bogdanov et al. (2019) Bogdanov S., et al., 2019, ApJ, 887, L25
- Bogdanov et al. (2021) Bogdanov S., Bahramian A., Heinke C. O., Freire P. C. C., Hessels J. W. T., Ransom S. M., Stairs I. H., 2021, ApJ, 912, 124
- Buchner (2021) Buchner J., 2021, The Journal of Open Source Software, 6, 3001
- Buchner et al. (2014) Buchner J., et al., 2014, A&A, 564, A125
- Burke et al. (2022) Burke D., et al., 2022, sherpa/sherpa: Sherpa 4.15.0, Zenodo, doi:10.5281/zenodo.7186379
- Cadelano et al. (2015) Cadelano M., et al., 2015, ApJ, 807, 91
- Cadelano et al. (2020) Cadelano M., Chen J., Pallanca C., Istrate A. G., Ferraro F. R., Lanzoni B., Freire P. C. C., Salaris M., 2020, ApJ, 905, 63
- Cardelli et al. (1989) Cardelli J. A., Clayton G. C., Mathis J. S., 1989, ApJ, 345, 245
- Chen et al. (2023) Chen W., et al., 2023, MNRAS, 520, 3847
- Cheng et al. (2019) Cheng Z., Li Z., Li X., Xu X., Fang T., 2019, ApJ, 876, 59
- Cocozza et al. (2008) Cocozza G., Ferraro F. R., Possenti A., Beccari G., Lanzoni B., Ransom S., Rood R. T., D’Amico N., 2008, ApJ, 679, L105
- Cool et al. (2013) Cool A. M., Haggard D., Arias T., Brochmann M., Dorfman J., Gafford A., White V., Anderson J., 2013, ApJ, 763, 126
- D’Amico et al. (2001) D’Amico N., Possenti A., Manchester R. N., Sarkissian J., Lyne A. G., Camilo F., 2001, ApJ, 561, L89
- Dai et al. (2020) Dai S., Johnston S., Kerr M., Camilo F., Cameron A., Toomey L., Kumamoto H., 2020, ApJ, 888, L18
- Dai et al. (2023) Dai S., Johnston S., Kerr M., Berteaud J., Bhattacharyya B., Camilo F., Keane E., 2023, MNRAS, 521, 2616
- Doe et al. (2007) Doe S., et al., 2007, in Shaw R. A., Hill F., Bell D. J., eds, Astronomical Society of the Pacific Conference Series Vol. 376, Astronomical Data Analysis Software and Systems XVI. p. 543
- Douglas et al. (2022) Douglas A., et al., 2022, ApJ, 927, 126
- Edmonds et al. (2002) Edmonds P. D., Gilliland R. L., Camilo F., Heinke C. O., Grindlay J. E., 2002, ApJ, 579, 741
- Edwards et al. (2001) Edwards R. T., van Straten W., Bailes M., 2001, ApJ, 560, 365
- Elsner et al. (2008) Elsner R. F., et al., 2008, ApJ, 687, 1019
- Fabian et al. (1975) Fabian A. C., Pringle J. E., Rees M. J., 1975, MNRAS, 172, 15
- Ferraro et al. (2001) Ferraro F. R., Possenti A., D’Amico N., Sabbi E., 2001, ApJ, 561, L93
- Ferraro et al. (2003) Ferraro F. R., Sabbi E., Gratton R., Possenti A., D’Amico N., Bragaglia A., Camilo F., 2003, ApJ, 584, L13
- Freeman et al. (2001) Freeman P., Doe S., Siemiginowska A., 2001, in Starck J.-L., Murtagh F. D., eds, Society of Photo-Optical Instrumentation Engineers (SPIE) Conference Series Vol. 4477, Astronomical Data Analysis. pp 76–87 (arXiv:astro-ph/0108426), doi:10.1117/12.447161
- Freire et al. (2005) Freire P. C. C., Hessels J. W. T., Nice D. J., Ransom S. M., Lorimer D. R., Stairs I. H., 2005, ApJ, 621, 959
- Freire et al. (2008) Freire P. C. C., Ransom S. M., Bégin S., Stairs I. H., Hessels J. W. T., Frey L. H., Camilo F., 2008, ApJ, 675, 670
- Freire et al. (2017) Freire P. C. C., et al., 2017, MNRAS, 471, 857
- Fruscione et al. (2006) Fruscione A., et al., 2006, in Silva D. R., Doxsey R. E., eds, Society of Photo-Optical Instrumentation Engineers (SPIE) Conference Series Vol. 6270, Society of Photo-Optical Instrumentation Engineers (SPIE) Conference Series. p. 62701V, doi:10.1117/12.671760
- Gaia Collaboration et al. (2023) Gaia Collaboration et al., 2023, A&A, 674, A1
- Guillot et al. (2019) Guillot S., et al., 2019, ApJ, 887, L27
- Haggard et al. (2009) Haggard D., Cool A. M., Davies M. B., 2009, ApJ, 697, 224
- Han et al. (2021) Han J. L., et al., 2021, Research in Astronomy and Astrophysics, 21, 107
- Harding & Muslimov (2002) Harding A. K., Muslimov A. G., 2002, ApJ, 568, 862
- Harris (1996) Harris W. E., 1996, AJ, 112, 1487
- Heinke et al. (2005) Heinke C. O., Grindlay J. E., Edmonds P. D., Cohn H. N., Lugger P. M., Camilo F., Bogdanov S., Freire P. C., 2005, ApJ, 625, 796
- Heinke et al. (2006a) Heinke C. O., Rybicki G. B., Narayan R., Grindlay J. E., 2006a, ApJ, 644, 1090
- Heinke et al. (2006b) Heinke C. O., Wijnands R., Cohn H. N., Lugger P. M., Grindlay J. E., Pooley D., Lewin W. H. G., 2006b, ApJ, 651, 1098
- Heinke et al. (2010) Heinke C. O., et al., 2010, ApJ, 714, 894
- Henleywillis et al. (2018) Henleywillis S., Cool A. M., Haggard D., Heinke C., Callanan P., Zhao Y., 2018, MNRAS, 479, 2834
- Hessels et al. (2006) Hessels J. W. T., Ransom S. M., Stairs I. H., Freire P. C. C., Kaspi V. M., Camilo F., 2006, Science, 311, 1901
- Hills (1976) Hills J. G., 1976, MNRAS, 175, 1P
- Ivanova et al. (2008) Ivanova N., Heinke C. O., Rasio F. A., Belczynski K., Fregeau J. M., 2008, MNRAS, 386, 553
- Jeffreys (1939) Jeffreys H., 1939, Theory of Probability
- Kandel et al. (2019) Kandel D., Romani R. W., An H., 2019, ApJ, 879, 73
- Katz (1975) Katz J. I., 1975, Nature, 253, 698
- Kim et al. (2007) Kim M., et al., 2007, ApJS, 169, 401
- Koljonen & Linares (2023) Koljonen K. I. I., Linares M., 2023, MNRAS, 525, 3963
- Kuiper et al. (1998) Kuiper L., Hermsen W., Verbunt F., Belloni T., 1998, A&A, 336, 545
- Lee et al. (2023) Lee J., Hui C. Y., Takata J., Kong A. K. H., Tam P.-H. T., Li K.-L., Cheng K. S., 2023, ApJ, 944, 225
- Lian et al. (2023) Lian Y., Pan Z., Zhang H., Freire P. C. C., Cao S., Qian L., 2023, ApJ, 951, L37
- Lorimer (2008) Lorimer D. R., 2008, Living Reviews in Relativity, 11, 8
- Lugger et al. (2023) Lugger P. M., Cohn H. N., Heinke C. O., Zhao J., Zhao Y., Anderson J., 2023, MNRAS, 524, 2088
- Lynch et al. (2011) Lynch R. S., Ransom S. M., Freire P. C. C., Stairs I. H., 2011, ApJ, 734, 89
- Lynch et al. (2012) Lynch R. S., Freire P. C. C., Ransom S. M., Jacoby B. A., 2012, ApJ, 745, 109
- Mucciarelli et al. (2013) Mucciarelli A., Salaris M., Lanzoni B., Pallanca C., Dalessandro E., Ferraro F. R., 2013, ApJ, 772, L27
- Ochsenbein et al. (2000) Ochsenbein F., Bauer P., Marcout J., 2000, A&AS, 143, 23
- Oh et al. (2020) Oh K., Hui C. Y., Li K. L., Kong A. K. H., 2020, MNRAS, 498, 292
- Pallanca et al. (2010) Pallanca C., et al., 2010, ApJ, 725, 1165
- Pallanca et al. (2013) Pallanca C., Dalessandro E., Ferraro F. R., Lanzoni B., Beccari G., 2013, ApJ, 773, 122
- Pallanca et al. (2014) Pallanca C., Ransom S. M., Ferraro F. R., Dalessandro E., Lanzoni B., Hessels J. W. T., Stairs I., Freire P. C. C., 2014, ApJ, 795, 29
- Pallanca et al. (2017) Pallanca C., Beccari G., Ferraro F. R., Pasquini L., Lanzoni B., Mucciarelli A., 2017, ApJ, 845, 4
- Pan et al. (2020) Pan Z., et al., 2020, ApJ, 892, L6
- Pan et al. (2021) Pan Z., et al., 2021, ApJ, 915, L28
- Pan et al. (2023) Pan Z., et al., 2023, Nature, 620, 961
- Papitto et al. (2013) Papitto A., et al., 2013, Nature, 501, 517
- Polzin et al. (2020) Polzin E. J., Breton R. P., Bhattacharyya B., Scholte D., Sobey C., Stappers B. W., 2020, MNRAS, 494, 2948
- Pooley & Hut (2006) Pooley D., Hut P., 2006, ApJ, 646, L143
- Pooley et al. (2002) Pooley D., et al., 2002, ApJ, 573, 184
- Possenti et al. (2003) Possenti A., D’Amico N., Manchester R. N., Camilo F., Lyne A. G., Sarkissian J., Corongiu A., 2003, ApJ, 599, 475
- Possenti et al. (2005) Possenti A., D’Amico N., Corongiu A., Manchester D., Sarkissian J., Camilo F., Lyne A., 2005, in Rasio F. A., Stairs I. H., eds, Astronomical Society of the Pacific Conference Series Vol. 328, Binary Radio Pulsars. p. 189
- Ransom et al. (2004) Ransom S. M., Stairs I. H., Backer D. C., Greenhill L. J., Bassa C. G., Hessels J. W. T., Kaspi V. M., 2004, ApJ, 604, 328
- Ransom et al. (2005) Ransom S. M., Hessels J. W. T., Stairs I. H., Freire P. C. C., Camilo F., Kaspi V. M., Kaplan D. L., 2005, Science, 307, 892
- Ridolfi et al. (2016) Ridolfi A., et al., 2016, MNRAS, 462, 2918
- Ridolfi et al. (2021) Ridolfi A., et al., 2021, MNRAS, 504, 1407
- Roberts (2013) Roberts M. S. E., 2013, in van Leeuwen J., ed., IAU Symposium 291 Vol. 291, Neutron Stars and Pulsars: Challenges and Opportunities after 80 years. pp 127–132 (arXiv:1210.6903), doi:10.1017/S174392131202337X
- Roberts et al. (2014) Roberts M. S. E., Mclaughlin M. A., Gentile P., Aliu E., Hessels J. W. T., Ransom S. M., Ray P. S., 2014, Astronomische Nachrichten, 335, 313
- Romani & Sanchez (2016) Romani R. W., Sanchez N., 2016, ApJ, 828, 7
- Roy et al. (2015) Roy J., et al., 2015, ApJ, 800, L12
- Saito et al. (1997) Saito Y., Kawai N., Kamae T., Shibata S., Dotani T., Kulkarni S. R., 1997, ApJ, 477, L37
- Stappers et al. (1996) Stappers B. W., et al., 1996, ApJ, 465, L119
- Takahashi et al. (2001) Takahashi M., et al., 2001, ApJ, 554, 316
- Taylor (2005) Taylor M. B., 2005, in Shopbell P., Britton M., Ebert R., eds, Astronomical Society of the Pacific Conference Series Vol. 347, Astronomical Data Analysis Software and Systems XIV. p. 29
- Verbunt & Freire (2014) Verbunt F., Freire P. C. C., 2014, A&A, 561, A11
- Verbunt & Hut (1987) Verbunt F., Hut P., 1987, in Helfand D. J., Huang J. H., eds, IAU Symposium 125 Vol. 125, The Origin and Evolution of Neutron Stars. p. 187
- Verbunt et al. (2008) Verbunt F., Pooley D., Bassa C., 2008, in Vesperini E., Giersz M., Sills A., eds, Proc. IAU Symposium Vol. 246, Dynamical Evolution of Dense Stellar Systems. pp 301–310 (arXiv:0710.1804), doi:10.1017/S1743921308015822
- Verner et al. (1996) Verner D. A., Ferland G. J., Korista K. T., Yakovlev D. G., 1996, ApJ, 465, 487
- Vleeschower et al. (2022) Vleeschower L., et al., 2022, MNRAS, 513, 1386
- Vurgun et al. (2022) Vurgun E., et al., 2022, ApJ, 941, 76
- Wadiasingh et al. (2017) Wadiasingh Z., Harding A. K., Venter C., Böttcher M., Baring M. G., 2017, ApJ, 839, 80
- Wang et al. (2020) Wang L., et al., 2020, ApJ, 892, 43
- Wilms et al. (2000) Wilms J., Allen A., McCray R., 2000, ApJ, 542, 914
- Wolff et al. (2021) Wolff M. T., et al., 2021, ApJ, 918, L26
- Yan et al. (2021) Yan Z., et al., 2021, ApJ, 921, 120
- Zavlin & Pavlov (1998) Zavlin V. E., Pavlov G. G., 1998, A&A, 329, 583
- Zavlin et al. (2002) Zavlin V. E., Pavlov G. G., Sanwal D., Manchester R. N., Trümper J., Halpern J. P., Becker W., 2002, ApJ, 569, 894
- Zhang et al. (2022) Zhang L., et al., 2022, ApJ, 934, L21
- Zhao & Heinke (2022) Zhao J., Heinke C. O., 2022, MNRAS, 511, 5964
- Zhao et al. (2019) Zhao Y., Heinke C. O., Cohn H. N., Lugger P. M., Cool A. M., 2019, MNRAS, 483, 4560
- Zhao et al. (2020) Zhao Y., et al., 2020, MNRAS, 499, 3338
- Zhao et al. (2021) Zhao J., Zhao Y., Heinke C. O., 2021, MNRAS, 502, 1596
- in’t Zand et al. (2001) in’t Zand J. J. M., van Kerkwijk M. H., Pooley D., Verbunt F., Wijnands R., Lewin W. H. G., 2001, ApJ, 563, L41
- van Leeuwen et al. (2000) van Leeuwen F., Le Poole R. S., Reijns R. A., Freeman K. C., de Zeeuw P. T., 2000, A&A, 360, 472
- van der Merwe et al. (2020) van der Merwe C. J. T., Wadiasingh Z., Venter C., Harding A. K., Baring M. G., 2020, ApJ, 904, 91
Appendix A X-ray spectral analysis of PSR M71E
PSR M71E (or PSR J1953+1846E) is a non-eclipsing BW in the globular cluster M71 (NGC 6838) recently discovered in the FAST Galactic Plane Pulsar Snapshot survey (Han et al., 2021). The latest published timing solution for this system unveils that it has the shortest orbital period among all known MSP binaries to date ( 53 minutes; Pan et al., 2023). The X-ray counterpart to M71E has been catalogued by Elsner et al. (2008) in their Table 1 (Source s34), with only a few X-ray properties presented. On the other hand, Pan et al. (2023) roughly estimated the X-ray luminosity of M71E to be erg s-1. However, its X-ray luminosity was likely underestimated, given that the limiting unabsorbed X-ray luminosity of M71 is about erg s-1 (0.3–8 keV; Zhao & Heinke, 2022). Therefore, to better constrain its X-ray properties and to enhance our sample of spider pulsars, we conducted a comprehensive X-ray analysis of M71E in this appendix.
We obtained the Chandra observation of M71 from the Chandra Data Archive999https://cxc.cfa.harvard.edu/cda/ (Obs. ID 5434 with an exposure time of 52.45 ks), and reprocessed the dataset using the chandra_repro script. We extracted the X-ray spectrum of M71E within a 1-arcsec-radius circle, centred at its timing position (RA=19:53:37.9464, Dec.=+18:44:54.310; Pan et al., 2023), while the background spectrum was extracted from a source-free region around M71E.
We fitted the X-ray spectrum of M71E with an absorbed BB, NSA, and PL, respectively. The towards M71 was estimated and fixed to be 2.181021 cm-2 (see Section 3.2 for the estimation method), and the distance to M71 was assumed to be 4.0 kpc (Harris, 1996, 2010 edition). We summarised the fitting results in Table 8. The X-ray spectrum of M71E can be statistically well fitted by all the three models. However, like the spectra of BWs in Cen, the relatively high photon index () inferred from the PL model implies thermal X-ray emission is a more physically appropriate model for M71E. Hence, blackbody-like spectral models (BB or NSA) are preferred for M71E. By adopting the NSA model fits, the unabsorbed X-ray luminosity of M71E is found to be erg s-1 in 0.5–10 keV (or erg s-1 in 0.3–8 keV).
| Spectral Model | |||
| BB | NSA | PL | |
| // a | |||
| Reduced Stat. | 0.91 | 0.96 | 1.03 |
| Q-value | 0.51 | 0.46 | 0.41 |
| (0.5–10 keV)b | |||
| Notes: was fixed for all fits at cm-2. | |||
| a : blackbody temperature in units of keV; : unredshifted effective temperature of the NS surface in units of log Kelvin; : photon index. | |||
| b Unabsorbed flux in units of erg cm-2 s-1. | |||