Cross-Modal Translation and Alignment for Survival Analysis
Abstract
With the rapid advances in high-throughput sequencing technologies, the focus of survival analysis has shifted from examining clinical indicators to incorporating genomic profiles with pathological images. However, existing methods either directly adopt a straightforward fusion of pathological features and genomic profiles for survival prediction, or take genomic profiles as guidance to integrate the features of pathological images. The former would overlook intrinsic cross-modal correlations. The latter would discard pathological information irrelevant to gene expression. To address these issues, we present a Cross-Modal Translation and Alignment (CMTA) framework to explore the intrinsic cross-modal correlations and transfer potential complementary information. Specifically, we construct two parallel encoder-decoder structures for multi-modal data to integrate intra-modal information and generate cross-modal representation. Taking the generated cross-modal representation to enhance and recalibrate intra-modal representation can significantly improve its discrimination for comprehensive survival analysis. To explore the intrinsic cross-modal correlations, we further design a cross-modal attention module as the information bridge between different modalities to perform cross-modal interactions and transfer complementary information. Our extensive experiments on five public TCGA datasets demonstrate that our proposed framework outperforms the state-of-the-art methods. The source code has been released 222https://github.com/FT-ZHOU-ZZZ/CMTA.
1 Introduction
Survival analysis is a crucial topic in clinical prognosis research, which aims to predict the time elapsed from a known origin to an event of interest, such as death, relapse of disease, and development of an adverse reaction. Accurate survival prediction is essential for doctors to assess the clinical outcomes for disease progression and treatment efficiency. Traditionally, survival analysis relies on short-term clinical indicators [15, 44] and long-term follow-up reports [1, 4], which are time-consuming and impractical in clinical applications. In recent years, medical image analysis has made significant progress, driven by the success of deep learning techniques. Consequently, an increasing number of researchers are working to model the connection between imaging features and survival events.
Radiology involves the use of medical imaging technologies such as X-rays, CT (Computerized Tomography) scans, MRI (Magnetic Resonance Imaging) scans, and ultrasound to visualize internal structures and detect abnormalities. Radiological images can provide valuable macroscopic information such as lesion location, morphological texture, and tumor metastasis, which can help predict the prognosis for the patient [14, 32, 28]. However, due to its lower sensitivity, radiology is not widely considered as the gold standard in cancer diagnosis. To improve diagnosis accuracy, the pathological examination will be conducted to sample lesion tissues and acquire pathological images, also known as whole slide images (WSIs). Pathological images can provide information about microscopic changes in tumor cells and their microenvironment. Generally, multi-instance learning (MIL) is the most commonly used paradigm in pathology-based survival analysis [46, 40, 42, 30, 7], which can identify and highlight important regions within the pathological image that contribute to the survival event, revealing insights into the underlying pathological phenotypes of disease. Recently, with the rapid advances in high-throughput sequencing technologies, more and more accessible large-scale genomics datasets provide an unprecedented opportunity to deeply understand the survival events from the molecular perspective [21, 12, 13].
Although survival analysis using single-modality has achieved promising results, combining multi-modal data from different perspectives can provide complementary information for each other. Intuitively, it can increase the sensitivity of survival analysis by detecting subtle changes that may not be visible within the single-modality. The most straightforward method is to integrate all features learned from multi-modal data together [5, 8, 3]. Obviously, these methods neglect the potential correlations and interactions between multi-modalities, which is crucial for information sharing and feature fusion in medical image analysis. Thereby, the attention mechanism has been introduced to capture the shared context in multi-modalities. For example, some researchers utilized clinical reports [22, 33] or genomic profiles [39, 9] as guidance for models to focus on the relevant parts of pathological images. Under the supervision of advanced knowledge, models can identify useful phenotypes and discover possible biomarkers associated with specific gene expression or clinical outcomes.
The above-mentioned cross-modal interaction methods are plausible when the reference modality is superior to other retention modalities. However, in some cases, the performance of pathology-based survival analysis is better than genomics-based or report-based methods. In such cases, if we still leverage the worse modality as the reference to supervise the feature learning of better retention modalities, the more discriminative information in retention modalities will be contaminated by mediocre information in the reference modality. Moreover, the original purpose of multi-modal medical image analysis is to integrate the complementary information contained in multi-modal data and make more accurate predictions. These attention-based cross-modal interaction methods will discard pathological information irrelevant to gene expression or clinical reports.
In light of these observations, we propose a novel Cross-Modal Translation and Alignment (CMTA) framework to explore the intrinsic cross-modal correlations and transfer potential complementary information. Concretely, we construct two parallel encoder-decoder structures for multi-modal data to extract intra-modal representation within single-modality and generates cross-modal representation from cross-modal information. To explore the potential cross-modal correlations, we leverage a cross-modal attention module as the information bridge between different modalities to perform cross-modal interaction and transfer complementary information. The cross-modal representation is utilized to enhance and recalibrate intra-modal representation. Finally, all intra-modal representations are integrated to yield the final survival prediction. The main contributions of this paper can be summarized as follows:
-
•
We propose a novel Cross-Modal Translation and Alignment (CMTA) framework for survival analysis using pathological images and genomic profiles, where two parallel encoder-decoder structures are constructed for multi-modal data to integrate intra-modal information and generate cross-modal representation.
-
•
We introduce the attention mechanism to design a cross-modal attention module, which is embedded into the encoder-decoder structure to explore the intrinsic cross-modal correlations, perform the potential interactions and transfer cross-modal complementary information between different modalities.
-
•
We conduct extensive experiments on five public TCGA datasets to evaluate the effectiveness of our proposed model. The experimental results show that our model consistently achieves superior performance compared to the state-of-the-art methods.
2 Related Work
2.1 Survival Analysis using Single-modality
Survival prediction can provide valuable information for doctors to assess the clinical outcomes for disease progression and treatment efficiency. Traditional survival analysis relies on single-modal clinical data, such as short-term clinical indicators [15, 18, 20, 44], long-term follow-up reports [1, 4, 35], various radiological images [14, 32, 28, 36] and gigapixel pathological images [46, 40, 42, 7, 30]. Typically, radiology-based methods would utilize feature learning techniques to extract quantitative features from radiological images and correlate them with survival outcomes. The pathology-based methods would leverage the MIL paradigm to can identify and highlight important instances (i.e., patches or regions) within an image that contribute to the survival event. Pathology can significantly improve the performance of survival prediction in comparison with radiology. However, the performance still cannot satisfy the requirements of clinical applications. With the rapid advances in high-throughput sequencing technologies, genomic profiles have shown high relevance as a measure for disease modeling and prognosis [11, 6, 25, 43, 29]. That opens a novel pathway for more accurate survival prediction.
2.2 Survival Analysis using Multi-modality
Multi-modal data can provide various insights into patient’s condition at the macroscopic, microscopic, and molecular levels. Each modality has its strengths and weaknesses. By integrating information from different modalities, we can obtain more comprehensive understanding for the patient’s condition, leading to more accurate diagnosis, treatment planning, and better prognosis prediction. For example, Cheerla et al. [5] developed an unsupervised method to encode multi-modal patient data into a common feature representation, and then used these feature representations to predict single-cancer and pan-cancer prognosis. Chen et al. [8] proposed a Pathomic Fusion framework to integrate histology images and genomic features for building objective image-omic assays for cancer diagnosis and prognosis. Braman et al. [3] presented a Deep Orthogonal Fusion model to encourage each modality to provide independent prognostic information. Chen et al. [9] proposed a Multimodal Co-Attention Transformer framework that identifies informative instances from pathological images using genomic features as queries. Although these methods have achieved impressive results in survival analysis using multi-modality, the straightforward fusion of multi-modal features would overlook potential cross-modal correlations, and using genomic profiles as guidance would discard pathological information irrelevant to gene expression. These methods violate the original purpose of integrating the complementary information contained in multi-modal data.
3 Method
In this section, we present the overall description of our proposed Cross-Modal Translation and Alignment (CMTA) framework for survival analysis, as illustrated in Figure 1. First, we introduce the problem formulation for survival analysis incorporating pathological images with genomic profiles. Then, we detail the data processing and feature extraction for each modality. After that, we elaborate on the key components of our proposed framework one by one.
3.1 Problem Formulation
Let represent the clinical data of patients. Each patient data can be represented by a 4-tuples , where is the set of whole slide images, is the set of genomic profiles, is the right uncensorship status and is overall survival time (in months). In survival analysis, let be a continuous random variable for overall survival time. Our goal is to develop a survival prediction model that integrates pathological images and genomic profiles to estimate the hazard function ,
| (1) |
The hazard function represents the instantaneous rate of occurrence of the event of interest at time . In practical applications, we tend to measure the probability of patient surviving longer than a discrete time point , rather than estimating survival time directly. The survival function can be obtained via the cumulative hazard function,
| (2) |
The hazard function can be estimated using various statistical models. The most common method for estimating hazard function is the Cox Proportional Hazards model [38, 37, 45], in which hazard function can be parameterized as an exponential linear function,
| (3) |
where represents the baseline hazard function, represents the vector of coefficients for the covariates. Generally, is the learnable parameters of the last hidden layer in the neural network.
3.2 Data processing and Feature Extraction
Pathological Images. Following the previous works [9, 26, 31], we adopt CLAM [27] to crop each WSI into a series of non-overlapping patches at magnification level. Then, ResNet-50 (pretrained on ImageNet) is used to extract -dim feature. Then, each patch feature is fed into a fully connected layer to obtain -dimension embedding. For ease of notation, we drop in referring to the -th patient. That means, the pathological images of each patient can be represented as , where is the number of patches.
Genomic Profiles. Genomic profiles are the individual’s most sensitive and identifiable information, including RNA sequencing (RNA-seq), Copy Number Variation (CNV), Simple Nucleotide Variation (SNV), DNA methylation, etc. Due to the higher signal-to-noise ratio, some of them have to be dropped in bioinformatics analysis. The genomic profiles used in this paper cover RNA-seq, CNV, and SNV. Following previous works [24, 9], the genomic profiles can be grouped into the following genomic sequences: 1)Tumor Suppression, 2) Oncogenesis, 3) Protein Kinases, 4) Cellular Differentiation, 5) Transcription, and 6) Cytokines and Growth. Similar to pathomics, these grouped genomic sequences are fed into a fully connected layer to obtain -dimension embeddings. That means, the genomics of each patient can be represented as , where is the number of groups.
3.3 Pathology Encoder and Genomics Encoder
Recently, the self-attention mechanism has been proven to be one of the most powerful tools for integrating information and extracting features from the set-based data structure. Therefore, we introduce the self-attention mechanism to construct an encoder for each modality to integrate intra-modal information and obtain intra-modal representation. Note that the size of sets in this paper is extremely large, especially patch sets . Traditional global self-attention will bring heavy computation burden. To tackle this issue, we utilize the Nystrom attention [41] to approximate the global self-attention.
Pathology Encoder. For the given patch sets , we define a learnable class token to gather information from all patch features. The initial input of the pathology encoder is represented as . We apply two self-attention layers to perform information integration. Additionally, there is another PPEG (Pyramid Position Encoding Generator.) module [31] to explore the correlations among different patches. The computation of the pathology encoder can be formulated as follows,
| (4) |
| (5) |
| (6) |
where MSA denotes Multi-head Self-attention and LN denotes Layer Norm. The output of this encoder is . Let class token be the intra-modal representation of pathology, marking it as .
Genomics Encoder. For the given genomics , we also define a learnable class token to gather information from all the gene sequences. The initial input of the genomics encoder is represented as . The structure of genomics encoder is similar to pathology encoder with exception to PPEG module. The computation of the genomics encoder can be formulated as follows,
| (7) |
| (8) |
Let in output be the intra-modal representation of genomics, marking it as .
3.4 Cross-Modal Attention Module
In this part, we denote the instance tokens of pathology encoder as , and the instance tokens of genomics encoder as . The cross-modal attention module is designed to explore the potential cross-modal correlations and interactions, as illustrated in Figure 2. This module takes and as input to calculate two attention maps and ,
| (9) | ||||
| (10) | ||||
where and are the learnable parameters. Essentially, the attention map presents association status from genomics tokens to pathology tokens while the attention map presents association status from pathology tokens to genomics tokens. With the help of attention maps, we can extract genomics-related information in pathology tokens and pathology-related information in genomics, respectively.
| (11) |
| (12) |
where and are the learnable parameters. In such manner, we can explore the potential cross-modal relationships and transfer complementary information between multi-modal data.
3.5 Genomics Decoder and Pathology Decoder
Due to the data heterogeneity gap between pathological images and genomic profiles, it is unreasonable to directly superpose and onto intra-modal representations and . Therefore, we construct two decoders, i.e., pathology decoder and genomics decoder, to translate related information into specific cross-modal representations. For simplicity, pathology decoder has the same structure as genomics encoder while genomics decoder has the same structure as pathology encoder.
Pathology Decoder. For the genomics-related information in pathology, we define a learnable class token , and then apply two self-attention layers to perform information translation.
| (13) |
| (14) |
Let in output be the cross-modal representation learned from pathology, marking it as .
Genomics Decoder. For the pathology-related information in genomics, we also define a learnable class token , and apply two self-attention layers with PPEG module to perform information translation.
| (15) |
| (16) |
| (17) |
Let in output be the cross-modal representation learned from genomics, marking it as .
| Methods | Modality | Datasets | |||||
|---|---|---|---|---|---|---|---|
| P. | G. | BLCA | BRCA | GBMLGG | LUAD | UCEC | |
| SNN [19] | 0.6339 0.0509 | 0.6327 0.0739 | 0.8370 0.0276 | 0.6171 0.0411 | 0.6900 0.0389 | ||
| SNNTrans [19] | 0.6456 0.0428 | 0.6478 0.0580 | 0.8284 0.0158 | 0.6335 0.0493 | 0.6324 0.0324 | ||
| MaxMIL | 0.5509 0.0315 | 0.5966 0.0547 | 0.7136 0.0574 | 0.5958 0.0600 | 0.5626 0.0547 | ||
| MeanMIL | 0.5847 0.0324 | 0.6110 0.0286 | 0.7896 0.0367 | 0.5763 0.0536 | 0.6653 0.0457 | ||
| AttMIL [16] | 0.5673 0.0498 | 0.5899 0.0472 | 0.7974 0.0336 | 0.5753 0.0744 | 0.6507 0.0330 | ||
| CLAM-SB [27] | 0.5487 0.0286 | 0.6091 0.0329 | 0.7969 0.0346 | 0.5962 0.0558 | 0.6780 0.0342 | ||
| CLAM-MB [27] | 0.5620 0.0313 | 0.6203 0.0520 | 0.7986 0.0320 | 0.5918 0.0591 | 0.6821 0.0646 | ||
| TransMIL [31] | 0.5466 0.0334 | 0.6430 0.0368 | 0.7916 0.0272 | 0.5788 0.0303 | 0.6799 0.0304 | ||
| MCAT [9] | 0.6727 0.0320 | 0.6590 0.0418 | 0.8350 0.0233 | 0.6597 0.0279 | 0.6336 0.0506 | ||
| M3IF [22] | 0.6361 0.0197 | 0.6197 0.0707 | 0.8238 0.0170 | 0.6299 0.0312 | 0.6672 0.0293 | ||
| GPDBN [39] | 0.6354 0.0252 | 0.6549 0.0332 | 0.8510 0.0243 | 0.6400 0.0478 | 0.6839 0.0529 | ||
| Porpoise [10] | 0.6461 0.0338 | 0.6207 0.0544 | 0.8479 0.0128 | 0.6403 0.0412 | 0.6918 0.0488 | ||
| HFBSurv [23] | 0.6398 0.0277 | 0.6473 0.0346 | 0.8383 0.0128 | 0.6501 0.0495 | 0.6421 0.0445 | ||
| DualTrans | 0.6607 0.0319 | 0.6637 0.0621 | 0.8393 0.0174 | 0.6706 0.0343 | 0.6724 0.0192 | ||
| \rowcolordino CMTA (Ours) | 0.6910 0.0426 | 0.6679 0.0434 | 0.8531 0.0116 | 0.6864 0.0359 | 0.6975 0.0409 | ||
3.6 Feature Alignment and Fusion
The cross-modal representations can provide complementary information that may not be visible within single-modality. Therefore, we utilize the cross-modal representations to enhance and recalibrate intra-modal representations. And then, all feature representations are integrated to yield the final survival prediction. Note that, gigapixel pathological images cause that the model cannot be optimized with mini-batch manner. The alternative optimization strategy is to consider discrete time intervals and model each interval using an independent output. The feature fusion and survival prediction can be formulated as,
| (18) |
where denotes the concatenation operation. In practice, professional pathologists and biologists can estimate partial gene expression from pathological images or imagine possible pathological phenotypes from genomic profiles. Our decoders are designed for simulating this process to translate cross-modal information. To ensure the quality of information translation, we must impose alignment constraints on cross-modal representations. In this paper, we utilize norm to measure the distance between cross-modal representations and intra-modal representations,
| (19) |
Note that, intra-modal representations and MUST be detached from the computational graph when we calculate . That means this alignment optimization objective is unidirectional ( and ). Otherwise, this model will converge to learn redundant shared information and fail to predict survival events.
We leverage NLL (negative log-likelihood) survival loss [9] as the loss function of the survival prediction part. Unifying these two losses, we can obtain the total loss function of our CMTA framework,
| (20) |
where is a positive hyper-parameter for reconciling the contribution of alignment loss function.
4 Experiments
In this section, we conduct extensive experiments on five public TCGA datasets to evaluate the effectiveness of our model. We first introduce the datasets and evaluation metrics used in our study. Then, experimental results are compared with some state-of-the-art methods to demonstrate the superiority of our model. Finally, we conduct ablation studies to discuss the impacts of some key components.
4.1 Datasets and Evaluation Metrics
Datasets. The Cancer Genome Atlas (TCGA) 333https://portal.gdc.cancer.gov is a public database that contains genomic and clinical data from thousands of cancer patients, covering 33 types of common cancer. It has been used extensively in survival analysis to identify genetic alterations and molecular pathways associated with cancer survival. In this paper, we use prognosis data of five cancer datasets to evaluate our model, including Bladder Urothelial Carcinoma (BLCA) (), Breast Invasive Carcinoma (BRCA) (), Glioblastoma & Lower Grade Glioma (GBMLGG) (), Lung Adenocarcinoma (LUAD) () and Uterine Corpus Endometrial Carcinoma (UCEC) (). For each dataset, we adopt 5-fold cross-validation splits to evaluate our model and other comparison methods.
Evaluation Metrics. The c-index, also known as the concordance index, is a metric used to evaluate the performance of survival analysis models. It measures the ability of a model to correctly order pairs of individuals in terms of their predicted survival times. The c-index can be formulated as follows,
| (21) |
where is the number of cases, and are the survival times of -th patient and -th patient. is the indicator function, which takes the value 1 if its argument is true, and 0 otherwise. is the right censorship status.
| Modules or Constraints | Datasets | ||||
|---|---|---|---|---|---|
| BLCA | BRCA | GBMLGG | LUAD | UCEC | |
| w/o Cross-Modal Attention | 0.6784 0.0276 | 0.6397 0.0612 | 0.8489 0.0154 | 0.6371 0.0245 | 0.6679 0.0446 |
| w/o Alignment Constraints | 0.6730 0.0209 | 0.6304 0.0367 | 0.8473 0.0200 | 0.6764 0.0211 | 0.6643 0.0500 |
| w/o Tensor Detaching | 0.6002 0.0501 | 0.6416 0.0486 | 0.8256 0.0248 | 0.6399 0.0315 | 0.6504 0.0153 |
| w/o PPEG module | 0.6629 0.0162 | 0.6627 0.0423 | 0.8582 0.0194 | 0.6815 0.0337 | 0.6659 0.0509 |
| \rowcolordino CMTA (All Components) | 0.6910 0.0426 | 0.6679 0.0434 | 0.8531 0.0116 | 0.6864 0.0359 | 0.6975 0.0409 |
4.2 Comparisons with State-of-the-Art
To perform the more comprehensive comparison, we implemented and evaluated some latest survival prediction methods using the same 5-fold cross-validation splits. These methods cover the single-modal learning paradigm and multi-modal learning paradigm. Table 1 shows the experimental results of all methods on all five TCGA datasets. It is worth noting that some of these methods can be regarded as the baseline of our model.
Baseline Models. 1) SNNTrans: This model is the variation of SNN (Self-Normalizing Network) [19], where we apply the same self-attention structure with the genomics encoder to integrate genomic information. This model is the single-modal baseline using genomic profiles. 2) TransMIL [31]: This method is one of the state-of-the-art MIL frameworks, which has achieved superior results on some public WSI classification benchmarks. In our study, we modify its classifier to solve the survival prediction task. This model is the single-modal baseline using pathological images. 3) DualTrans: This model is derived from SNNTrans and TransMIL, which concatenates the intra-modal representations learned by SNNTrans and TransMIL to make survival predictions. This model is the multi-modal baseline using pathomics and genomics.
Compared with Single-modal Models. As we can see from Table 1, our proposed method consistently achieves superior performance on all TCGA datasets. More concretely, our model obtains c-index of 69.10% on BLCA, 66.79% on BRCA, 85.31% on GBMLGG, 68.64% on LUAD, and 69.75% on UCEC, improving over the previous best single-modal methods by 4.54%, 2.01%, 1.61%, 5.29% and 0.75%, respectively. This comparison results also show the advantages of survival prediction using multi-modality.
Compared with Multi-modal Models. The MCAT is the previous state-of-the-art multi-modal method, which leverages genomics as guidance to integrate pathological information. Against MCAT, our model achieves the performance increases of 1.83% on BLCA, 0.89% on BRCA, 1.81% on GBMLGG, 2.67% on LUAD and 6.39% on UCEC. Note that MCAT would discard the discard pathological information irrelevant to gene expression while our method fully exploits all information contained in multi-modal data. That means survival analysis using multi-modality should focus on integrating complementary information between different modalities, rather than exploiting the abundant shared information. Besides, our model also consistently outperforms other SOTA multi-modal learning method by a large margin, including M3IF [22], GPDBN [39], Porpoise [10] and HFBSurv [23].
Compared with Baseline Models. From observations, it is obvious that DualTrans concatenating the intra-modal representations learned by SNNTrans and TransMIL can significantly improve the performance. It also shows the advantage of multi-modal data for accurate survival prediction. In our model, we utilize the cross-modal representations to enhance and recalibrate intra-modal representations. Then, we adopt the same feature fusion strategy with DualTrans to yield final survival prediction. Compared with DualTrans, our model achieves the performance increases of 3.03% on BLCA, 0.42% on BRCA, 1.38% on GBMLGG, 1.58% on LUAD and 2.51% on UCEC. The improvements demonstrate that it is effective to translate related information into specific cross-modal representations.
4.3 Ablation Studies
In this part, we conduct some extra experiments to further discuss the impacts of different similarity metrics, components, and constraints.
Impacts of Similarity Metrics. By default, we leverage norm as the similarity metric to measure the distance between intra-modal representation and cross-modal representation. In this part, we conduct some experiments to evaluate the performances under other common similarity metrics, i.e., MSE (mean squared error) loss, KL (Kullback-Leibler) divergence, and Cosine similarity. The experimental results are shown in Figure 3. As we can see from this figure, loss consistently outperforms other similarity metrics with the exception of GBMLGG dataset. Specifically, there are no obvious performance differences on GBMLGG dataset between different similarity metrics. That is because glioma is a very special cancer, which has been proven that five-year and ten-year survival rates are highly correlated with some specific genes [34, 17, 2]. Incorporating pathological images with genomic profiles may not change these specific gene expressions.
Impacts of Modules and Constraints. We remove some modules and constraints to investigate their impacts. The experimental results are summarized in Table 2. 1) The cross-modal attention module aims to explore potential correlations and interactions between multi-modal data. After removing this module, the performance drops 1.26% on BLCA, 2.82% on BRCA, 0.42% on GBMLGG, 4.93% on LUAD and 2.96% on UCEC, which implies that highlighting related information is necessary when performing information translation. 2) To ensure the quality of information translation, we impose alignment constraints on cross-modal representations. If we remove this penalty term in model optimization, the performance will lose 1.80% on BLCA, 3.75% on BRCA, 0.58% on GBMLGG, 1.00% on LUAD, and 3.32% on UCEC, respectively. That is, the unconstrained information translation process will severely impair the discrimination of intra-modal representations and deteriorate the performance of survival prediction. 3) To ensure the unidirectional alignment optimization objective, we detach intra-modal representations and from the computational graph when calculating loss function . If we remove this detaching step, the performance will also significantly lose 9.08% on BLCA, 2.63% on BRCA, 2.75% on GBMLGG, 4.65% on LUAD and 4.71% on UCEC, respectively. Without the detaching step, our model will converge to learn redundant shared information and fail to predict survival events. The degree of performance deterioration relies on the proportion of shared information in multi-modal data, and less shared information would result in more performance drop. 4) PPEG is one of key modules in TransMIL, used to explore the position correlations among different patches. Removing PPEG module will result in performance drops of 2.81% on BLCA, 0.52% on BRCA, 0.49% on LUAD and 3.16% on UCEC.
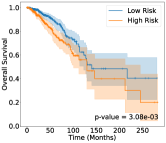
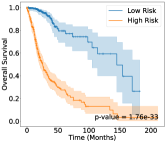
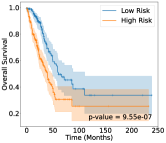
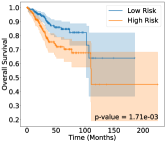
4.4 Survival Analysis
To further validate the effectiveness of CMTA for survival analysis, we stratify all patients into low risk group and high risk group according mid-value of the predicted risk scores from CMTA. After that, we utilize Kaplan-Meier analysis to visualize the survival events of all patients, analysis results are shown in Figure 4. Meanwhile, we also utilize Logrank test (-value) to measure the statistical significance between low risk group (blue) and high risk group (red). A -value of 0.05 or lower is generally considered statistically significant. As we can see from this figure, -value of all datasets are significantly smaller than 0.05.
5 Conclusion
In this paper, we proposed a novel Cross-Modal Translation and Alignment (CMTA) framework for survival analysis using pathological images and genomic profiles, in which two parallel encoder-decoder structures are constructed for pathological features and genomic features to integrate intra-modal information and generate cross-modal representations, respectively. To explore the potential cross-modal correlations and interactions, we designed a cross-modal attention module as the information bridge between different modalities. Using cross-modal representations to enhance and recalibrate intra-modal representations can significantly improve the performance of survival prediction. Extensive experimental results on five public TCGA datasets demonstrated the effectiveness of our proposed model over state-of-the-art methods.
6 Acknowledgement
This work was supported by National Natural Science Foundation of China (No. 62202403), the Research Grants Council of the Hong Kong Special Administrative Region, China (No. R6003-22) and Hong Kong Innovation and Technology Fund (No. PRP/034/22FX).
References
- [1] Caroline E Ahearne, Geraldine B Boylan, and Deirdre M Murray. Short and long term prognosis in perinatal asphyxia: An update. World journal of clinical pediatrics, 5(1):67, 2016.
- [2] Sarah Basindwah, Hisham Alkhalidi, Ahmed Abdelwarith, and Sherif Elwatidy. Ten-year survival in glioblastoma patient with neurofibromatosis type 1: illustrative case. Journal of Neurosurgery: Case Lessons, 3(4), 2022.
- [3] Nathaniel Braman, Jacob WH Gordon, Emery T Goossens, Caleb Willis, Martin C Stumpe, and Jagadish Venkataraman. Deep orthogonal fusion: multimodal prognostic biomarker discovery integrating radiology, pathology, genomic, and clinical data. In Medical Image Computing and Computer Assisted Intervention–MICCAI 2021: 24th International Conference, Strasbourg, France, September 27–October 1, 2021, Proceedings, Part V 24, pages 667–677. Springer, 2021.
- [4] Ruggero Capra, Cinzia Cordioli, Sarah Rasia, Fabio Gallo, Alessio Signori, and Maria Pia Sormani. Assessing long-term prognosis improvement as a consequence of treatment pattern changes in ms. Multiple Sclerosis Journal, 23(13):1757–1761, 2017.
- [5] Anika Cheerla and Olivier Gevaert. Deep learning with multimodal representation for pancancer prognosis prediction. Bioinformatics, 35(14):i446–i454, 2019.
- [6] Nikhil Cheerla and Olivier Gevaert. Microrna based pan-cancer diagnosis and treatment recommendation. BMC bioinformatics, 18(1):1–11, 2017.
- [7] Richard J Chen, Chengkuan Chen, Yicong Li, Tiffany Y Chen, Andrew D Trister, Rahul G Krishnan, and Faisal Mahmood. Scaling vision transformers to gigapixel images via hierarchical self-supervised learning. In Proceedings of the IEEE/CVF Conference on Computer Vision and Pattern Recognition, pages 16144–16155, 2022.
- [8] Richard J Chen, Ming Y Lu, Jingwen Wang, Drew FK Williamson, Scott J Rodig, Neal I Lindeman, and Faisal Mahmood. Pathomic fusion: an integrated framework for fusing histopathology and genomic features for cancer diagnosis and prognosis. IEEE Transactions on Medical Imaging, 41(4):757–770, 2020.
- [9] Richard J Chen, Ming Y Lu, Wei-Hung Weng, Tiffany Y Chen, Drew FK Williamson, Trevor Manz, Maha Shady, and Faisal Mahmood. Multimodal co-attention transformer for survival prediction in gigapixel whole slide images. In Proceedings of the IEEE/CVF International Conference on Computer Vision, pages 4015–4025, 2021.
- [10] Richard J Chen, Ming Y Lu, Drew FK Williamson, Tiffany Y Chen, Jana Lipkova, Zahra Noor, Muhammad Shaban, Maha Shady, Mane Williams, Bumjin Joo, et al. Pan-cancer integrative histology-genomic analysis via multimodal deep learning. Cancer Cell, 40(8):865–878, 2022.
- [11] Yann Christinat and Wilhelm Krek. Integrated genomic analysis identifies subclasses and prognosis signatures of kidney cancer. Oncotarget, 6(12):10521, 2015.
- [12] Eskezeia Y Dessie, Jeffrey JP Tsai, Jan-Gowth Chang, and Ka-Lok Ng. A novel mirna-based classification model of risks and stages for clear cell renal cell carcinoma patients. BMC bioinformatics, 22:1–16, 2021.
- [13] Rounak Dey, Wei Zhou, Tuomo Kiiskinen, Aki Havulinna, Amanda Elliott, Juha Karjalainen, Mitja Kurki, Ashley Qin, FinnGen, Seunggeun Lee, et al. Efficient and accurate frailty model approach for genome-wide survival association analysis in large-scale biobanks. Nature Communications, 13(1):5437, 2022.
- [14] Marco Francone, Franco Iafrate, Giorgio Maria Masci, Simona Coco, Francesco Cilia, Lucia Manganaro, Valeria Panebianco, Chiara Andreoli, Maria Chiara Colaiacomo, Maria Antonella Zingaropoli, et al. Chest ct score in covid-19 patients: correlation with disease severity and short-term prognosis. European radiology, 30:6808–6817, 2020.
- [15] Yolanda Hagar, David Albers, Rimma Pivovarov, Herbert Chase, Vanja Dukic, and Noémie Elhadad. Survival analysis with electronic health record data: Experiments with chronic kidney disease. Statistical Analysis and Data Mining: The ASA Data Science Journal, 7(5):385–403, 2014.
- [16] Maximilian Ilse, Jakub Tomczak, and Max Welling. Attention-based deep multiple instance learning. In International conference on machine learning, pages 2127–2136. PMLR, 2018.
- [17] Ivana Jovčevska. Genetic secrets of long-term glioblastoma survivors. Bosnian journal of basic medical sciences, 19(2):116, 2019.
- [18] EY Kalafi, NAM Nor, NA Taib, MD Ganggayah, C Town, and SK Dhillon. Machine learning and deep learning approaches in breast cancer survival prediction using clinical data. Folia biologica, 65(5/6):212–220, 2019.
- [19] Günter Klambauer, Thomas Unterthiner, Andreas Mayr, and Sepp Hochreiter. Self-normalizing neural networks. Advances in neural information processing systems, 30, 2017.
- [20] Yu-Heng Lai, Wei-Ning Chen, Te-Cheng Hsu, Che Lin, Yu Tsao, and Semon Wu. Overall survival prediction of non-small cell lung cancer by integrating microarray and clinical data with deep learning. Scientific reports, 10(1):4679, 2020.
- [21] Seungyeoun Lee and Heeju Lim. Review of statistical methods for survival analysis using genomic data. Genomics & informatics, 17(4), 2019.
- [22] Hang Li, Fan Yang, Xiaohan Xing, Yu Zhao, Jun Zhang, Yueping Liu, Mengxue Han, Junzhou Huang, Liansheng Wang, and Jianhua Yao. Multi-modal multi-instance learning using weakly correlated histopathological images and tabular clinical information. In Medical Image Computing and Computer Assisted Intervention–MICCAI 2021: 24th International Conference, Strasbourg, France, September 27–October 1, 2021, Proceedings, Part VIII 24, pages 529–539. Springer, 2021.
- [23] Ruiqing Li, Xingqi Wu, Ao Li, and Minghui Wang. Hfbsurv: hierarchical multimodal fusion with factorized bilinear models for cancer survival prediction. Bioinformatics, 38(9):2587–2594, 2022.
- [24] Arthur Liberzon, Chet Birger, Helga Thorvaldsdóttir, Mahmoud Ghandi, Jill P Mesirov, and Pablo Tamayo. The molecular signatures database hallmark gene set collection. Cell systems, 1(6):417–425, 2015.
- [25] Yanli Liu, Yuchao Zhang, Qingfu Li, Junfang Li, Xiaotian Ma, Jinfang Xing, Shouhua Rong, Zhong Wu, Yuan Tian, Jing Li, et al. Mirnas predict the prognosis of patients with triple negative breast cancer: a meta-analysis. PLoS One, 12(1):e0170088, 2017.
- [26] Ming Y Lu, Tiffany Y Chen, Drew FK Williamson, Melissa Zhao, Maha Shady, Jana Lipkova, and Faisal Mahmood. Ai-based pathology predicts origins for cancers of unknown primary. Nature, 594(7861):106–110, 2021.
- [27] Ming Y Lu, Drew FK Williamson, Tiffany Y Chen, Richard J Chen, Matteo Barbieri, and Faisal Mahmood. Data-efficient and weakly supervised computational pathology on whole-slide images. Nature biomedical engineering, 5(6):555–570, 2021.
- [28] Elke Platz, Allison A Merz, Pardeep S Jhund, Ali Vazir, Ross Campbell, and John J McMurray. Dynamic changes and prognostic value of pulmonary congestion by lung ultrasound in acute and chronic heart failure: a systematic review. European journal of heart failure, 19(9):1154–1163, 2017.
- [29] Yeping Lina Qiu, Hong Zheng, Arnout Devos, Heather Selby, and Olivier Gevaert. A meta-learning approach for genomic survival analysis. Nature communications, 11(1):6350, 2020.
- [30] Wei Shao, Tongxin Wang, Zhi Huang, Zhi Han, Jie Zhang, and Kun Huang. Weakly supervised deep ordinal cox model for survival prediction from whole-slide pathological images. IEEE Transactions on Medical Imaging, 40(12):3739–3747, 2021.
- [31] Zhuchen Shao, Hao Bian, Yang Chen, Yifeng Wang, Jian Zhang, Xiangyang Ji, et al. Transmil: Transformer based correlated multiple instance learning for whole slide image classification. Advances in neural information processing systems, 34:2136–2147, 2021.
- [32] Andrew J Swift, Dave Capener, Chris Johns, Neil Hamilton, Alex Rothman, Charlie Elliot, Robin Condliffe, Athanasios Charalampopoulos, Smitha Rajaram, Allan Lawrie, et al. Magnetic resonance imaging in the prognostic evaluation of patients with pulmonary arterial hypertension. American journal of respiratory and critical care medicine, 196(2):228–239, 2017.
- [33] Yusuke Takagi, Noriaki Hashimoto, Hiroki Masuda, Hiroaki Miyoshi, Koichi Ohshima, Hidekata Hontani, and Ichiro Takeuchi. Transformer-based personalized attention mechanism for medical images with clinical records. Journal of Pathology Informatics, page 100185, 2023.
- [34] Tomasz Tykocki and Mohamed Eltayeb. Ten-year survival in glioblastoma. a systematic review. Journal of Clinical Neuroscience, 54:7–13, 2018.
- [35] Luís A Vale-Silva and Karl Rohr. Long-term cancer survival prediction using multimodal deep learning. Scientific Reports, 11(1):13505, 2021.
- [36] Janna E van Timmeren, Ralph TH Leijenaar, Wouter van Elmpt, Bart Reymen, Cary Oberije, René Monshouwer, Johan Bussink, Carsten Brink, Olfred Hansen, and Philippe Lambin. Survival prediction of non-small cell lung cancer patients using radiomics analyses of cone-beam ct images. Radiotherapy and Oncology, 123(3):363–369, 2017.
- [37] Hong Wang and Gang Li. Extreme learning machine cox model for high-dimensional survival analysis. Statistics in medicine, 38(12):2139–2156, 2019.
- [38] Ping Wang, Yan Li, and Chandan K Reddy. Machine learning for survival analysis: A survey. ACM Computing Surveys (CSUR), 51(6):1–36, 2019.
- [39] Zhiqin Wang, Ruiqing Li, Minghui Wang, and Ao Li. Gpdbn: deep bilinear network integrating both genomic data and pathological images for breast cancer prognosis prediction. Bioinformatics, 37(18):2963–2970, 2021.
- [40] Ellery Wulczyn, David F Steiner, Zhaoyang Xu, Apaar Sadhwani, Hongwu Wang, Isabelle Flament-Auvigne, Craig H Mermel, Po-Hsuan Cameron Chen, Yun Liu, and Martin C Stumpe. Deep learning-based survival prediction for multiple cancer types using histopathology images. PloS one, 15(6):e0233678, 2020.
- [41] Yunyang Xiong, Zhanpeng Zeng, Rudrasis Chakraborty, Mingxing Tan, Glenn Fung, Yin Li, and Vikas Singh. Nyströmformer: A nyström-based algorithm for approximating self-attention. In Proceedings of the AAAI Conference on Artificial Intelligence, volume 35, pages 14138–14148, 2021.
- [42] Jiawen Yao, Xinliang Zhu, Jitendra Jonnagaddala, Nicholas Hawkins, and Junzhou Huang. Whole slide images based cancer survival prediction using attention guided deep multiple instance learning networks. Medical Image Analysis, 65:101789, 2020.
- [43] Safoora Yousefi, Fatemeh Amrollahi, Mohamed Amgad, Chengliang Dong, Joshua E Lewis, Congzheng Song, David A Gutman, Sameer H Halani, Jose Enrique Velazquez Vega, Daniel J Brat, et al. Predicting clinical outcomes from large scale cancer genomic profiles with deep survival models. Scientific reports, 7(1):11707, 2017.
- [44] Zhenjun Yu, Yu Zhang, Yingying Cao, Manman Xu, Shaoli You, Yu Chen, Bing Zhu, Ming Kong, Fangjiao Song, Shaojie Xin, et al. A dynamic prediction model for prognosis of acute-on-chronic liver failure based on the trend of clinical indicators. Scientific reports, 11(1):1810, 2021.
- [45] Xinliang Zhu, Jiawen Yao, and Junzhou Huang. Deep convolutional neural network for survival analysis with pathological images. In 2016 IEEE International Conference on Bioinformatics and Biomedicine (BIBM), pages 544–547. IEEE, 2016.
- [46] Xinliang Zhu, Jiawen Yao, Feiyun Zhu, and Junzhou Huang. Wsisa: Making survival prediction from whole slide histopathological images. In Proceedings of the IEEE conference on computer vision and pattern recognition, pages 7234–7242, 2017.