STAR Collaboration
Reaction plane correlated triangular flow in Au+Au collisions at GeV
Abstract
We measure triangular flow relative to the reaction plane at 3 GeV center-of-mass energy in Au+Au collisions at RHIC. A significant signal is observed for protons, whose magnitude increases for higher rapidity, higher transverse momentum, and more peripheral collisions. The triangular flow is essentially rapidity-odd with a rapidity slope at mid-rapidity, , opposite in sign compared to the slope for directed flow. No significant signal is observed for charged pions and kaons. Comparisons with models suggest that a mean field potential is required to describe these results, and that the triangular shape of the participant nucleons is the result of stopping and nuclear geometry.
I Introduction
One of the primary goals of the Beam Energy Scan II (BES II), undertaken by the STAR collaboration [Odyniec:2019kfh], is to identify and study the transition from hadronic matter to the Quark Gluon Plasma (QGP). At high baryon density, this phase transition is thought to be of first-order [Muller:2022qsm]. Hence, the understanding of nuclear matter at high baryon density, and its evolution as the phase transition is approached from high to low baryon density, is crucial.
A primary probe of the QGP is the anisotropic flow of particles as they expand outwards which manifests itself in the particle distribution relative to the true reaction plane as a Fourier expansion [Poskanzer],
| (1) |
where and are the the particle transverse momentum, rapidity, azimuthal angle, and the true reaction plane angle, respectively. The coefficients in the expansion, (directed flow), (elliptic flow), (triangular flow), etc., describe the collective response of the medium to the shape of the initial collision geometry. They are sensitive to medium properties such as the viscosity and mean-fields that determine the equation of state (EOS).
Anisotropic collective flow has been extensively studied in heavy-ion collisions. Early studies were carried at the Bevelac and at GSI (see [Reisdorf:1997fx] for a review) who studied primarily and at a few hundred MeV. Later experiments followed at the AGS ( GeV), and the SPS ( GeV). A notable feature of collisions at energies GeV was the shadowing of outgoing particles by spectators. This lead to phenomena such as squeeze-out leading to in-plane and out-of-plane flow [E895:1999ldn]. As research progressed with experiments at RHIC ( GeV) and the LHC ( TeV), the study of anisotropic flow became increasingly important. The magnitude of , which was best modeled by hydrodynamics, was one of the linchpins in the identification of the Quark-Gluon-Plasma [Heinz:2013th]. In addition, the magnitudes of of mesons and baryons appeared to follow number-of-constituent-quark scaling (NCQ), which provided strong evidence for an expanding partonic medium [Fries:2003kq, Dunlop:2011cf].
The timescale of the collision between the nuclei is a critical element, both in the creation of the medium and in the formation of the initial shape in configuration space. At high energies, above = 27 GeV, where the transit time, (where is the radius of the nucleus, is the Lorentz factor, and is the velocity of the nuclei) is much shorter than the formation time of particles, the spectators are well away from the collision volume and the initial partonic density is free to expand [Lin:2017lcj]. At these energies, reflects a hydrodynamic response to event-by-event fluctuations in the initial geometry which is uncorrelated to the reaction plane (i.e. the correlation is with ). This is rapidity even, whose magnitude decreases towards lower . The rapidity-even has been studied by various experiments, in particular by the STAR collaboration which has reported values of integrated of 2% at = 200 GeV down to 1% at 7.7 GeV [STAR:2016vqt].
This paper reports the observation of that is correlated with the reaction plane111The term “reaction plane” (as opposed to “event plane”) is deliberately used here to describe as measured in the EPD primarily dominated by spectators in this analysis, as not to confuse it with the usual which is randomly oriented with respect to the real reaction plane in high energy collisions.. We denote this observable as ( calculated with the first-order event plane) to distinguish it from the fluctuation-driven discussed above at higher energies. The measurement of has also been made by the HADES collaboration in Au+Au collisions at GeV [HADES:2020lob, Kardan:2017qau]. Our study measures at comparatively higher energy and introduces comparisons to theoretical models, to gain insight into the origin of the phenomenon.
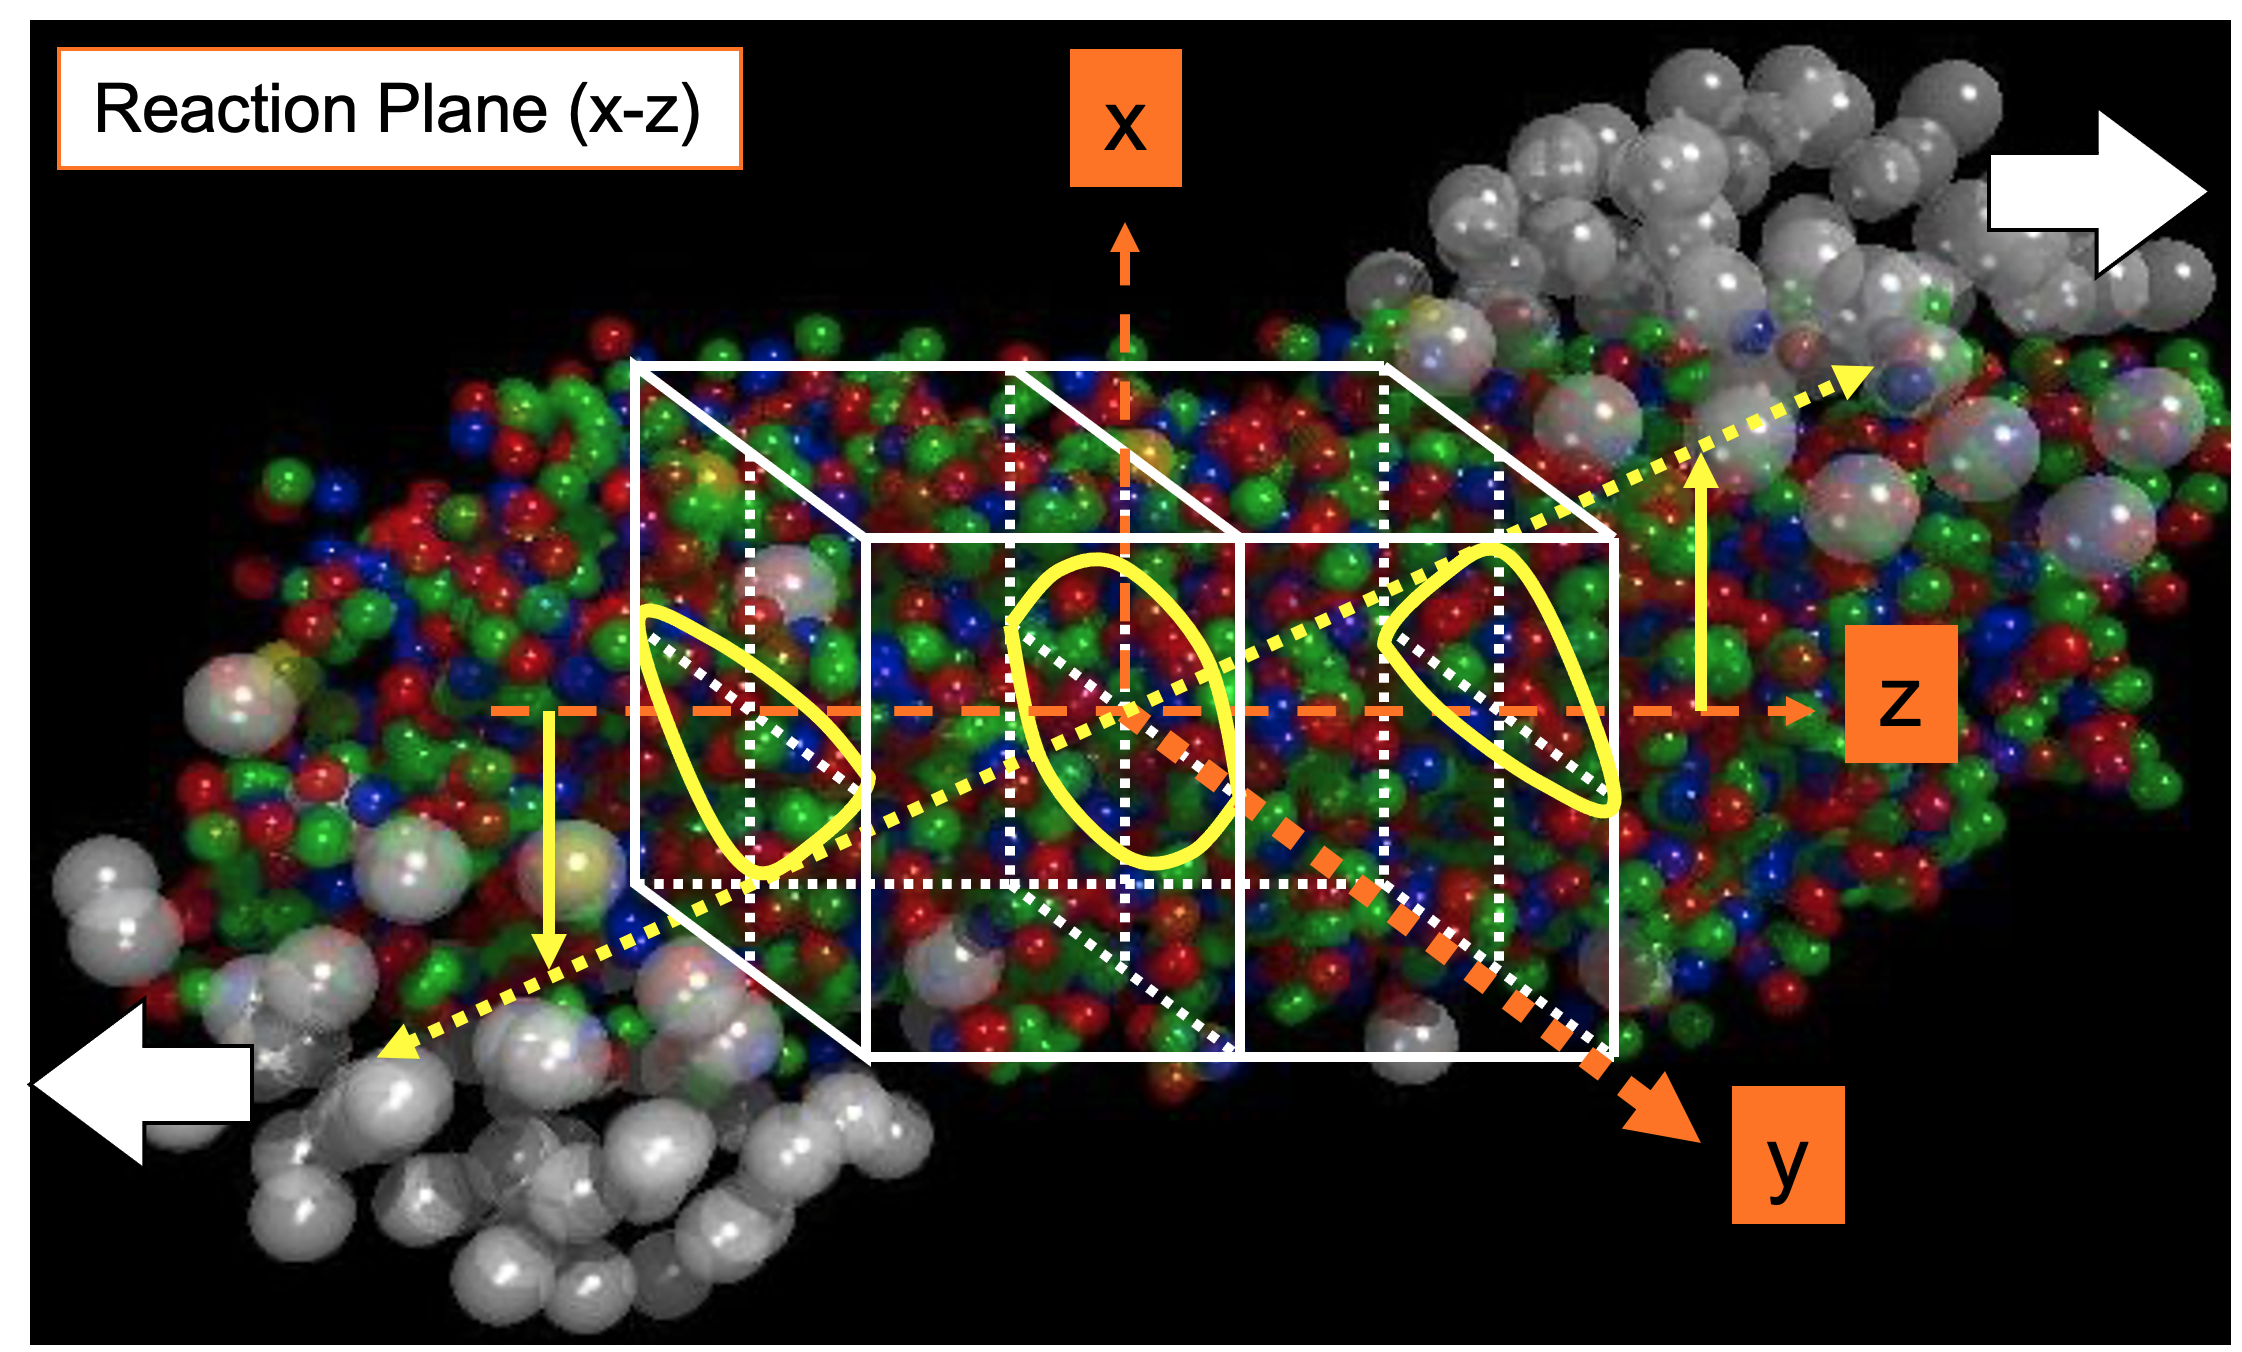
The development of flow typically hinges on two crucial elements. The first pertains to a geometric shape in spatial configuration space that corresponds to a specific flow coefficient - for instance, an almond shape corresponds to and a triangular shape corresponds to . This paper discusses a mechanism that produces an initial triangular shape, correlated with the reaction plane resulting from shadowing and baryon stopping. The orientation of this initial triangular shape relative to the reaction plane provides the first necessary element for generating a reaction plane-correlated . Figure 1 presents the geometric illustration222While this illustrative model originates from the simulation of higher-energy Au+Au collisions, it is beneficial as it delineates the regions of spectators, participants, and the triangular shape formed by the mechanism outlined in this article. of the triangular shape situated in both positive and negative rapidity regions, thereby leading to a flow which is odd in rapidity. We assume positive rapidity is to the right on the plot, hence is positive [STAR:2021yiu]. The triangle, for example, shown on the right side of the x-y plane, is oriented with one edge facing in the negative-x direction, aligning in the direction of the pressure gradient and therefore one direction of flow. The other two major directions would be at 60 degrees to the negative-x direction, hence will be negative at positive rapidity, opposite to that of .
The second element involves the presence of a force which leads to a pressure gradient thereby transforming the spacial configuration to a momentum distribution. At low center-of-mass energies, mean fields provide this force. Flow appears to be sensitive to a variety of parameters that describe these mean fields. Specifically, the incompressibility () of matter at high baryon density proves to be of particular importance [Nara:2019qfd, Bass:1998ca, Weil:2016zrk]. In the majority of models, mean fields primarily impact baryons, whereas their effects on mesons originate from interactions or decays that involve baryons [Agnieszka]. Models that integrate a realistic EOS, which includes a transition from a hadron gas to a QGP, will be indispensable for understanding observations in high energy heavy-ion collisions at high baryon density.
II Experiment
The Solenoidal Tracker at RHIC (STAR) is a multipurpose detector designed to measure hadronic and electromagnetic particles produced in heavy-ion and polarized proton-proton collisions. The STAR comprises several subsystems that provide charged particle tracking and identification over a wide range of pseudorapidity () and full azimuth () [Ackermann]. The primary subsystems used for the present analysis are the Time Projection Chamber (TPC) [Anderson], the barrel Time-of-Flight detector (TOF) [LLOPE], and Event Plane Detector (EPD) [Adams]. The EPD consists of two highly segmented circular detectors positioned at both ends of the TPC and centered around the beam pipe. Each wheel consists of 372 scintillating tiles, enabling a probabilistic determination of the number of Minimum Ionizing Particles (nMIP) passing through each tile per event. The nMIP values are defined within a certainty range of the signal in the scintillator tiles to suppress detector noise and large Landau fluctuations.
In the fixed target (FXT) mode of operation, a single beam strikes a gold foil placed at z = 200.7 cm inside the beam pipe on the west side of STAR, near the edge of the TPC. The target has a thickness of 0.25 mm corresponding to a 1 interaction probability. In this mode, the EPD covers (only the east side can be used), the TPC covers the region , and the TOF covers the range in the laboratory frame; all three subsystems cover the full azimuthal angle.
III Analysis
III.1 Event and Track Selection
The Au+Au data set at GeV was obtained in 2018, with a beam energy of 3.85 GeV per nucleon, in FXT mode. A total of 305M events were available for analysis. Midrapidity () in the laboratory rest frame at this energy is at , and center-of-mass rapidity is defined as . This analysis uses the same sign convention of rapidity as in Ref. [STAR:2021beb], where is the forward region and is the backward region; hence the beam direction is towards negative rapidity.
For each event, the reconstructed primary vertex was required to be within 2 cm of the target position along the beam axis. The transverse x, y position of the vertex was required to be within a radius of 1.5 cm from the center of the target. These requirements ensured that the event originated from the gold foil and eliminated beam interactions with the vacuum pipe. The event centrality was estimated from the charged particle multiplicity measured in the TPC and categorized into bins of 5% up to a maximum of 60%. Events with low multiplicity ( primary tracks) or high multiplicity ( primary tracks) were rejected to avoid pile-up. A total of 256M good events remained for further analysis. The remaining pile-up contamination was previously estimated by another STAR analysis at this same energy that studied cumulants of the proton multiplicity distribution. In that analysis, the cumulants were corrected by an unfolding method that statistically separated the single and double collisions in the reconstructed particle multiplicities. This process determined the pile-up fraction to be ()% of all events and ()% in the 0%–5% centrality class [STAR:128.202303].
Tracks were required to be reconstructed with at least 15 hit points and greater than 52 of the total possible points to ensure good track fitting quality. Additionally, the Distance of Closest Approach (DCA) to the primary vertex was required to be less than 3 cm to ensure that the tracks originated from the event vertex. Lastly, we required that at least 5 measurements for the average energy loss per unit length () were made for the track.
III.2 Particle Identification
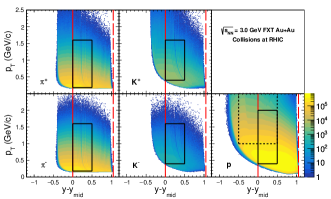
, , and in this analysis were identified using a combination of measurements from the TPC and mass information calculated from the time-of-flight provided by the TOF. Fig. 2 shows the and acceptance of each particle type. Charged pions and kaons are required to have a measurement within of their expected value, and measurements within GeV and GeV, respectively. Protons do not require a measurement from the TOF due to their abundance at this collision energy and the fact that, over the relevant momentum range, their curves are well separated from other particles. They are required to have a measurement from the TPC, but we only accept tracks within of their expected value to reduce the small contamination that may remain at higher momenta. and used for flow measurements were selected within a range of transverse momentum of GeV/, and within GeV/, and within GeV/. Each particle type was selected with a center-of-mass rapidity range of . These acceptance regions, which are marked by black boxes in Fig. 2, were used for calculating anisotropic flow vs. centrality. For flow measurements vs. , the acceptance in is extended for protons to . Due to the wider range of for protons, we also made a rapidity symmetric acceptance with and GeV/ (dashed box).
III.3 Event Plane Analysis
The event plane method for calculating anisotropic flow was employed in this study. This approach utilizes event plane angles () reconstructed by a region of the EPD to determine flow coefficients of identified particles in the TPC using
| (2) |
where is the resolution correction for the observed reaction plane angle . Here is the azimuthal angle of an identified particle species, and the averages are taken over all tracks of that particle species and all events of a specific centrality class [Poskanzer]. For and , the averages are weighted by the inverse of the product of TPC and TOF matching efficiencies. The averages for protons were weighted by only the inverse of the TPC tracking efficiency. To prevent systematic overestimation of flow we applied the resolution correction track-by-track within the average as suggested in Ref. [MASUI2016181].
The event plane resolution is calculated for each centrality interval using the standard three-subevent method [Poskanzer]:
| (3) |
where the reaction plane angles , , and are obtained in three ranges: , , and . Equation 3 provides the resolution for subevent A which was used for reconstructing . Regions and were only employed for calculating , so while the identified particles overlap with region , there is no auto-correlation effect in the flow measurements.
The weights within the vectors [Poskanzer] used for reconstructing event plane angles were in the TPC region and the nMIP values from the EPD with a minimum threshold of 0.3 and maximum of 2.0. In addition, all weights for tracks or hits with have a negative sign while all with are positive to account for the the fact that is odd in rapidity. Each event used in the analysis was required to have a minimum of 5 hits in the inner EPD region, 9 hits in the outer EPD region, and 5 tracks in the TPC region to ensure that each subevent had an adequate number of particles to reconstruct .
Before calculating and flow, we perform recentering followed by Fourier shifting corrections on all event plane distributions to remove biases from non-uniform detector acceptance [Poskanzer]. After these corrections, all event plane distributions are isotropic from to . The values calculated for the event plane resolution in each centrality are shown in Fig. 3 [supplemental]. These specific values were calculated considering systematic effects and are described in the next section.
III.4 Systematic Uncertainties
We varied all track quality and particle identification cuts by 20%, and again by 30%, to estimate the systematic uncertainties contributed by each cut and denoted these as , where would be any of the cuts mentioned in Sections III.1 and III.2. The was calculated as the standard deviation from all 5 measurements of . The final systematic uncertainty for any one value would then be , where a check was done and only the cuts with variations deemed significant for that measurement would be included in the sum [Barlow]. The only variation that did not go through this check was for the event plane resolution, which was included for every measurement.
The maximum values of the resolution, , were obtained by utilizing all three subevents described in Section III.3. To estimate systematic errors, two variations were implemented to modify the size of region in the EPD to introduce an gap between regions and . This was done to eliminate potential momentum conservation effects and assess other systematic factors involved in the calculation of . One variation involved changing region to rings 10-16 in the EPD (), while the other variation replaced it with rings 13-16 (). By employing the two variations for the event plane from region , in addition to the initial configuration, an envelope of values was established. The average value from all three configurations was adopted as the resolution, and the maximum deviation from this average among the three variations was taken as the systematic error for (see Fig. 3). To propagate the uncertainties in to variations in flow, the resolutions are increased/decreased by the total uncertainty (statistical plus systematic in quadrature) and flow is calculated.
Table III.4 shows the contribution of each systematic source as a percentage of , averaged across all measurements, in three wide centrality regions. All contributions related to track quality cuts were combined in quadrature and listed in the first row; and the same was done for event selection cuts shown in the second row. The proton contribution in 0-10% centrality is 54% simply due to the very small magnitude of the proton in this centrality range.