Critical Field Anisotropy and Muon Spin Relaxation Study of
Superconducting Dirac-Semimetal CaSb2
Abstract
CaSb2 has been identified as a bulk superconductor and a topological semimetal, which makes it a great platform for realizing topological superconductivity. In this work, we investigate the superconducting upper and lower critical field anisotropy using magnetic susceptibility, and study the superconducting state using muon spin-relaxation. The temperature dependence of transverse-field relaxation can be fitted with a single-gap model or two-gap model, consistent with previous tunnel-diode oscillator measurements. We highlight that the normal state of CaSb2 shows a large diamagnetic signal, which is likely related to its Dirac semimetal nature. Zero-field relaxation shows little temperature dependence when the muon-spin is parallel to the -axis, while an increase in relaxation appears below 1 K when the muon-spin is parallel to the -plane. This may be related to a second superconducting phase appearing at low temperature below the bulk . However, we find no discernible anomaly in around this temperature as has been seen in other superconductors with secondary superconducting states that appear at lower temperatures.
pacs:
Valid PACS appear hereI Introduction
When a material enters the superconducting state it breaks U(1) gauge symmetry, and breaking of any additional symmetries is typically an indication of unconventional superconductivity Sigrist and Ueda (1991). In some unconventional superconductors, time-reversal symmetry (TRS) is broken as the material enters the superconducting state as proven by detection of spontaneous magnetic fields below the onset of superconductivity. This spontaneous magnetic field has been detected in zero-field muon relaxation measurements in unconventional superconductors such as UPt3 Luke et al. (1993) and Sr2RuO4 Luke et al. (1998); Xia et al. (2006). Spontaneous magnetic fields can emerge in non-centrosymmetric superconductors, where the lack of inversion symmetry results in a spin-split Fermi surface due to antisymmetric spin-orbit coupling (SOC) and a singlet-triplet mixing in the superconducting state Gor’kov and Rashba (2001), such as LaNiC2 Hillier et al. (2009), Re6Zr Singh et al. (2014), and La7Ir3 Barker et al. (2015). This breaking of TRS can even appear in centrosymmetric multi-gap superconductors, for specific compositions, such as the case in FeSe Watashige et al. (2015), Fe(Se,Te) Farhang et al. (2023) and Ba1-xKxFe2As2 Grinenko et al. (2017, 2020) and single -wave gap locally non-centroscymmetric SrPtAs and CaPtAs with strong SOC Biswas et al. (2013); Shang et al. (2020). In PrOs4Sb12 TRS breaking appears below and is discussed in relation to nonmagnetic quadrupolar fluctuations in the normal state Aoki et al. (2003). In the Sr-doped topological insulator Bi2Se3, TRS breaking has been discussed in relation to the anisotropic Dirac cone dispersion in the normal state band structure of doped Bi2Se3 allowing for triplet pairing Neha et al. (2019). In all of the above materials, the onset of TRS breaking coincides with under ambient conditions and none are reported to break TRS in manner such that it can only be detected when muon spins are in a specific direction.
CaSb2 belongs to the family of non-symmorphic antimonides Sb2 (= Alkaline-Earth, Rare-Earth) containing screw rotation symmetry. CaSb2 is a compensated semimetal Funada et al. (2019); Oudah et al. (2022) and the calculated Fermi-surface demonstrating compensation supports CaSb2 being a topological nodal-line semimetal Oudah et al. (2022); Chuang et al. (2022) due to the non-symmoprhic space group 11, Deller and Eisenmann (1976). The compensated semimetal state is related to three bands crossing the Fermi level, two electron-like bands dominated by contributions from the Sb site forming a distorted square-net and a hole-like band dominated by contributions from the other Sb site forming a zig-zag chain along the -direction Oudah et al. (2022). Superconductivity was discovered recently in polycrystalline samples Ikeda et al. (2020), and further confirmed in single crystal samples Oudah et al. (2022). Recently, the anisotropy of the upper critical field of CaSb2 based on resistivity measurements and the lower critical field estimate based on magnetization at 0.55 K have been reported Ikeda et al. (2022). The specific heat transition in single crystal samples suggests deviation from a single -wave gap, with the possibility of multiple gaps in the superconducting state Oudah et al. (2022). A coherence peak was observed near in Sb-nuclear quadrupole resonance (NQR) suggesting -wave superconductivity Takahashi et al. (2021a), at least near . Using a tunnel diode oscillator (TDO), the temperature dependence of the penetration depth in CaSb2 reveals the presence of multiple gaps and exponential behaviour at low temperature that indicates nodeless superconductivity Duan et al. (2022). These reports warrant further investigations of the anisotropy of the superconducting state of CaSb2 and studying the superconductivity using a local probe such as muon spin rotation/relaxation ().
Here we report the critical field anisotropy from magnetic susceptibility, estimate the penetration depth and the temperature dependence of the superconducting gap from transverse-field (TF) muon data, and find evidence for TRS breaking below in zero-field (ZF) only when muons spin lies in the -plane, suggesting a spontaneous field perpendicular to the -plane emerges in CaSb2. The breaking of TRS appears below K, which is well below the of 1.6 K. The observation of TRS breaking despite the lack of magnetism or strong spin-orbit-coupling in CaSb2 is intriguing, and may be related to the topological nature of the superconducting state reflecting the topologically non-trivial normal state band structure.
II Methods
Single crystals of CaSb2 were grown using an Sb self flux method as described in Ref. [17]. This yields shiny, plate-like crystals with dimensions up to mm3 that are stable in air for several weeks. Phase purity and orientation of the crystals were checked by X-ray diffraction (XRD) using a Bruker D8 with Cu K radiation (1.54056 Å). We confirmed bulk superconductivity in our samples using magnetization and specific heat measurements, which exhibited superconducting transitions at K. Measurements of the magnetic susceptibility were done using a Magnetic Property Measurements System 3 (MPMS3) from Quantum Design, equipped with a 3He insert.
Muon spectroscopy measurements were performed at the M15 beamline at TRIUMF’s Centre for Molecular and Material Science, which is equipped with a dilution refrigerator. Multiple crystals were mounted on a silver plate with GE varnish, then the silver plate was attached to a cold finger utilizing copper filled grease for good thermal conductivity in the dilution refrigerator. We further secured the samples with a thin silver foil over the samples before mounting them into the dilution refrigerator. We achieved true-zero field for zero-field (ZF) using the method previously described by Morris and Heffner Morris and Heffner (2003) to accurately detect any spontaneous fields. We used non-spin-rotated mode for the ZF- measurements and spin-rotated mode for the TF- measurements. In spin-rotated mode the muon spins are rotated perpendicular to the beam velocity, spin lying in the -plane, before landing in the sample, and the field is applied to the sample along the beam direction, perpendicular to the -plane. The data were analyzed with musrfit software Suter and Wojek (2012) to obtain physical parameters.
III Results and Discussion
III.1 Critical Field Anisotropy
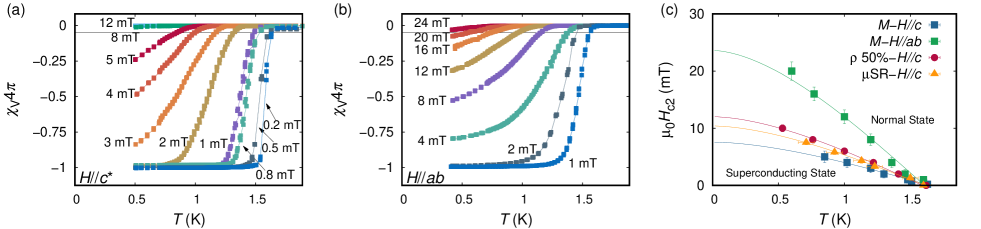
Measurements of the anisotropy of the field-dependent dc magnetic susceptibility around the superconducting transition were performed down to 0.4 K, as shown in Fig. 1(a) and (b). The temperature dependent magnetic susceptibility was measured for fields applied parallel or perpendicular to the plate of the crystal, where the -plane lies in the plane of plate-like crystals. We define as the direction perpendicular to the -plane for this monoclinic crystal structure. In both cases, the transition temperature was defined as the 5% volume drop in the volume susceptibility where the 100% volume was defined as the signal in the lowest field measured (1 mT). The demagnetization correction based on the Brandt formula Brandt (1999) yields a 100% volume fraction for the case of , but the same correction results in a 30% volume fraction in the case of . This is due to our plate-like crystals not being perfect rectangular slabs, as assumed in the calculation of the demagnetization factor. For the direction, we take the 5% volume drop relative the signal measured in the lowest field being the 100% volume fraction, as shown in Fig. 1(a).
The upper critical field was estimated using the Werthamer-Helfand-Hohenberg (WHH) relation Werthamer et al. (1966) for the data as shown with the lines in Fig. 1(c). The temperature dependence of is typical of a type-II superconductor, as the transition moves to lower and lower field values upon increasing the temperature. Similar behavior is observed for measurements with the other field orientation . The estimated upper critical fields are and , thus yielding an anisotropy ratio in CaSb2 of about 3.1. We estimate the coherence length based on the upper critical field, and obtain 202 nm and 66 nm for and , respectively. We note that deviation from WHH relation near , where increases slowly with decreasing temperature, is consistent with nodal-line -wave superconductivity Endo et al. (2023). This warrants further investigation in future studies.
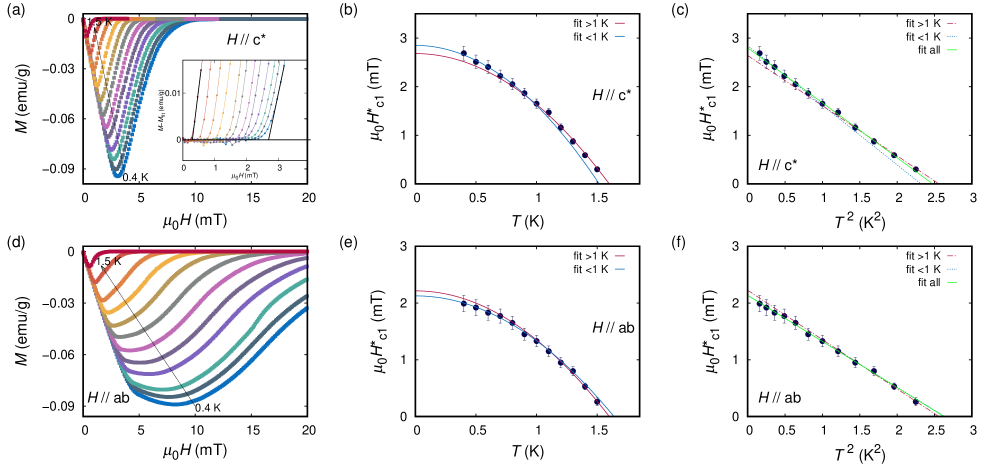
To estimate the lower critical field we measured the field-dependent magnetization () at different temperatures below the critical temperature in both directions, as shown in Fig. 2(a) and (d). We use a linear fit to the low-field data measured at 0.4 K in each direction, and subtract this fit from all the measured curves for measurements in each direction, as demonstrated in the inset of Fig. 2(a). The value of the uncorrected at each temperature was determined based on the intersect of a linear fit to the upturn of this subtracted data, , and the horizontal line where marked in the inset of Fig. 2(a) for 0.4 K and 1.5 K. The plotted against the corresponding temperature for the and direction are shown in Fig. 2(b) and (e), and the same data plotted against temperature squared are shown in Fig. 2(c) and (f). We note that the temperature dependence of is fitted well by the equation Powell and Clark (1978)
| (1) |
where is the lower critical field at 0 K, where fits are shown with green line in Fig. 2(c) and (f). Although the data fit the equation above well, we attempt two independent fits to the temperature regions above and below 1 K in search of any anomaly that can be reconciled with our zero-field . Enhancement of the lower critical field was observed in UPt3 Amann et al. (1998) and PrOs4Sb12 Cichorek et al. (2005), and this was related to the emergence of a second superconducting phase at low temperature. We discuss this further below in Sec. III.3.
The typical equations used for estimating the penetration depth () from do not have a solution for the values measured in our experiment. Instead, we estimate the from and with the following equation Tinkham (2004):
| (2) |
Here we assume the values for and are equivalent to the measured, without applying any demagnetization correction. This is due to the difficulty of calculating the demagnetization correction for the . The value of thermodynamic critical field is expected to be equivalent for both directions, but does not match for the current measurements on our samples. We take the average in both directions and estimate mT, as shown in Table 1, which is consistent with the value previously reported using the integral of curve Ikeda et al. (2022). Despite this consistency of , we suspect that the currently measured lower critical field values are inaccurate and should be the subject of future studies. We estimate the Ginzburg-Landau parameter for each direction with the following equation:
| (3) |
where is the Ginzburg-Landaue parameter.
We summarize our characterization of the superconducting state based on magnetic susceptibility measurements in Table 1. We estimate the upper critical field extracted from the 50% drop in resistivity measurement, previously published by some of the current authors Oudah et al. (2022), to be about mT in Fig. 1. This value is different from that reported recently by another group Ikeda et al. (2022), which may be due to different sample quality or due to different current densities in the resistivity measurements. Nevertheless, the anisotropy of the upper critical field of from the resistivity measurements reported Ikeda et al. (2022) is consistent with our anisotropy estimates based on magnetic susceptibility measurements. Here we note that for , it seems that the superconducting state of CaSb2 is at the border of type-I/type-II regime. This poses challenges for our muon measurement as highlighted below.
| Direction | ab | c* |
| mT | ||
| mT | mT | |
| mT | ||
| 202 nm | 66 nm | |
III.2 Transeverse-Field Muon Study
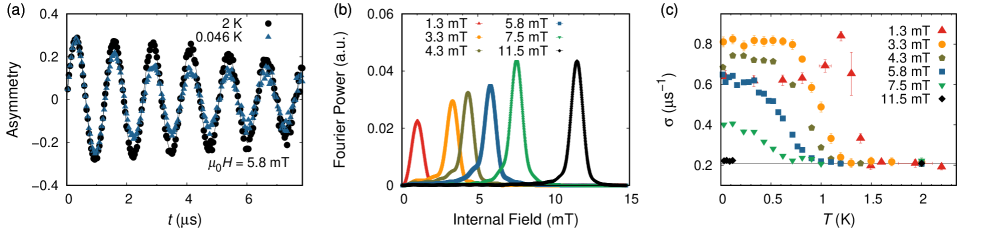
We perform transverse field measurements on CaSb2 with applied magnetic field perpendicular to the -plane, which can be used to determine the temperature dependence of the penetration depth. With the temperature dependence of the penetration depth we can infer properties of the energy gap of the superconducting state of CaSb2. For these measurements we extract the field from the precession of muons inside the background silver, which is the most precise way of measuring the applied field. We performed the measurement with applied fields ranging from mT, and all measurements were performed on samples cooled in the applied field. We employed a beam of muons polarized such that the spin is perpendicular to their momentum, while the applied field is parallel to the momentum. The spin of the muon precesses with a frequency proportional to the local magnetic field, and, upon decay, emits a positron preferentially in the muon spin direction. Typically with a field that is above the lower critical field, we expect a well ordered flux line lattice when using a field cooling procedure. Typical time evolution of the asymmetry for CaSb2 is shown in Fig. 3(a), measured in 5.8 mT at 2.00 K and 0.03 K, above and below respectively.
In the mixed state, we have an inhomogenous field distribution due to the presence of a flux line lattice (FLL), which results in a decay of the precession signal as a function of time. We fit the asymmetry spectra using a two term sinusoidal decaying function
where the first term captures the signal from muons stopping in the sample and the second term captures the signal from muons stopping in the silver sample holder. is the fraction of the signal coming from the sample, while and are the muon precession frequencies in the sample and the background, respectively. The term is the total asymmetry and the is the initial phase of the muons. and are the depolarization rates for the sample and the background signals, respectively. The term contains a contribution from the field distribution caused by the vortex lattice in the superconducting state and the smaller, temperature independent, contribution from randomly oriented nuclear dipole moments . These two signals are added in quadrature, such that the contribution from the FLL can be obtained as . The superconducting relaxation rate indicates the mean square inhomogeniety in the field experiend by muons, , due to the FLL Brandt (1988), where , which results in the relaxation rate for the FLL
where is the muon gyromagnetic ratio. The Fourier power against internal magnetic field, shown in Fig. 3(b), shows a large peak corresponding to of the silver sample holder. The relaxation rate as a function of temperature extracted from TF- in various fields for CaSb2 is plotted in Fig. 3(c).
We extract from the TF- in various fields, where we define as the intersection of the line of best fit with sharpest slope in the transition seen in and the normal state nuclear contribution . We calculate the expected nuclear magnetic moment by first estimating the muon stopping site based on the Hartree potential, where we find the preferred muon stopping site is (0.65,0.75,0.15). Based on the magnetic active nuclei, only Sb in our case, we find an expected nuclear dipolar field of 3.5323 N. This corresponds to a s, in agreement with the value measured experimentally, as shown in Fig. 3(c). The applied magnetic fields, as extracted from the precession of muons in the Ag sample holder , are plotted against in Fig. 1(c), and we fit the WHH relation to obtain the upper critical field from TF- as mT. This value is consistent with estimates based on 50% drop in resistivity and those extracted from magnetization measurement with field applied perpendicular to the -plane.
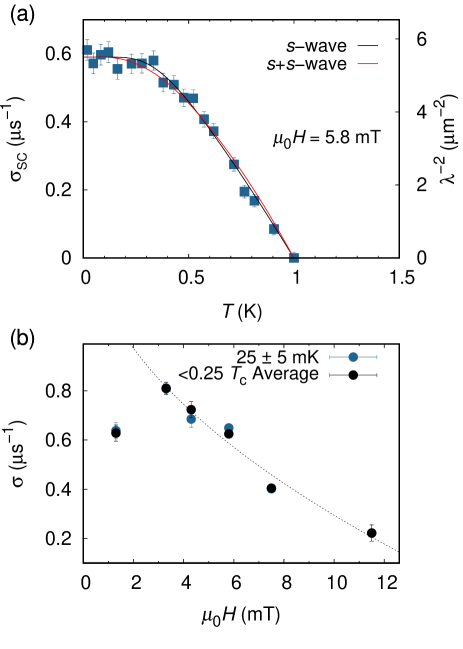
From the field dependence of measured well below at m, shown in Fig. 4(b), we find a peak at low fields. The FLL state is only realized at fields well above this peak region, where ideally in strong type-II superconductors we expect a relatively weak field dependence above this peak and below the upper critical field. Since CaSb2 is barely type-II, we do not have a wide range of weak field dependence, but nevertheless choose 5.8 mT, which is well above the peak position, as a field representing the highest likelihood of realizing a homogeneous FLL state.
For fields approaching the upper critical field, , the penetration depth can be calculated from the relaxation rate using the Brandt formula Brandt (2003) for a triangular Abrikosov vortex lattice:
where is in and is in nm. is the magnetic flux quantum, .
We can relate the temperature dependence of the relaxation rate to the penetration depth with
The temperature dependence of the energy gap within BCS theory Carrington and Manzano (2003) is given by:
where is the gap magnitude at zero temperature, and the term accounts for the orientation dependence of the gap function, which can, for example, be substituted with 1 for an -wave model and for a -wave model, where is the azimuthal angle.
CaSb2 has a coherence length over normal state mean free path of about 1.78 Oudah et al. (2022), which places it at the border between clean and dirty limit. The temperature dependence of the superconducting gap can be obtained from the temperature dependence of the penetration depth in the clean limit with the relation
while in the dirty limit with the relation
where is the Fermi function, and quantities in brackets are the average over the Fermi surface.
Considering previous specific heat measurements showing deviation from single-gap BCS Oudah et al. (2022) and that tunnel diode oscillator measurements on CaSb2 are better fitted with a two-gap model, we utilized a two-gap model fit for our muon data where the total depolarization is expressed as the sum of two components:
where and are the gap values at zero temperature and is the fraction of gap-1 over the sum of two gaps. We fit the gap using an wave model as shown in Fig. 4(a). Assuming the zero-field tunnel diode oscillator measurement performed on CaSb2 is representative of our samples, supported by the similarity of the specific heat data reported in the same paper Duan et al. (2022) with our specific heat measurement on our samples Oudah et al. (2022), we accept the presence of two gaps in zero field in CaSb2. Two gaps with the same value as reported = 1.8 and = 0.81) Duan et al. (2022) and single gap = 1.59) fit are shown in Fig. 4(a) in red and black, respectively. We note that for data measured in 5.8 mT a single -wave gap is sufficient to fit the data, and the two-gap model does not significantly improve the fit. We note that the evolution of two gaps with applied magnetic fields has been demonstrated in measurements on NbSe2 Sonier (2007), and a similar evolution of the two gaps with applied magnetic field may appear in other multi-gap superconductors, such as CaSb2. However, such a conclusion cannot be drawn from the current data due to the large error bars.
The strong magnetic field dependence of in CaSb2, shown in Fig. 4(b), is associated with the low compared with the applied fields, and may be related to the faster suppression of smaller gap to the superfluid density. Such behavior has been discussed in other two-gap superconductors such as NbSe2 Sonier et al. (2000), MgB2 Serventi et al. (2004), and SmFeAsO0.85 Khasanov et al. (2008). We notice a peak in the low-temperature field-dependence around 3.3 mT, where such a peak typically appears around .
The likely presence of multiple gaps along with the possibility of gap anisotropy both can affect the temperature dependence of FLL, and the high field compared with upper critical field used in our TF- experiments make it difficult to makes a definitive statement on the gap symmetry based on our relaxation rate data. The relatively high field used in our TF- experiment makes corrections to extract the penetration depth from the relaxation rate data difficult, due to the likely distortions to the FLL state in our case. Nevertheless, we give an estimate using of the penetration depth nm.
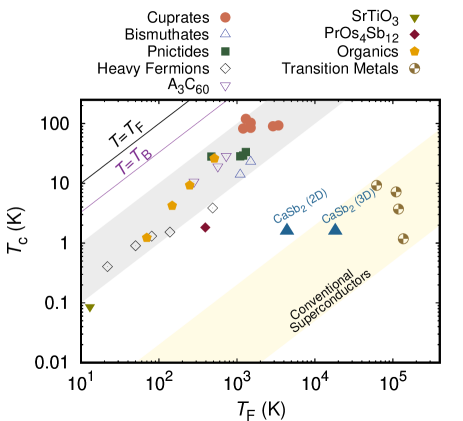
We compare the superconducting state in CaSb2 with other known superconductors using the well-known Uemura plot. We plot the superconducting transition temperature against the Fermi temperature for CaSb2 along with various other superconductors in Fig. 5, where we highlight the region of unconventional superconductors in grey at the top left region and conventional superconductors in the bottom right region. Considering the quasi-2D nature of CaSb2, we estimate the Fermi temperature assuming a 2D system via the relation and for a 3D system via the relation Uemura (2004). We use the previously reported carrier concentration and effective mass Oudah et al. (2022). Based on our estimates, CaSb2 appears in a region in between conventional superconductors and unconventional superconductors, where the estimate assuming a 2D system falls closer to the unconventional region.
III.3 Zero-Field Muon and Time Reversal Symmetry Breaking
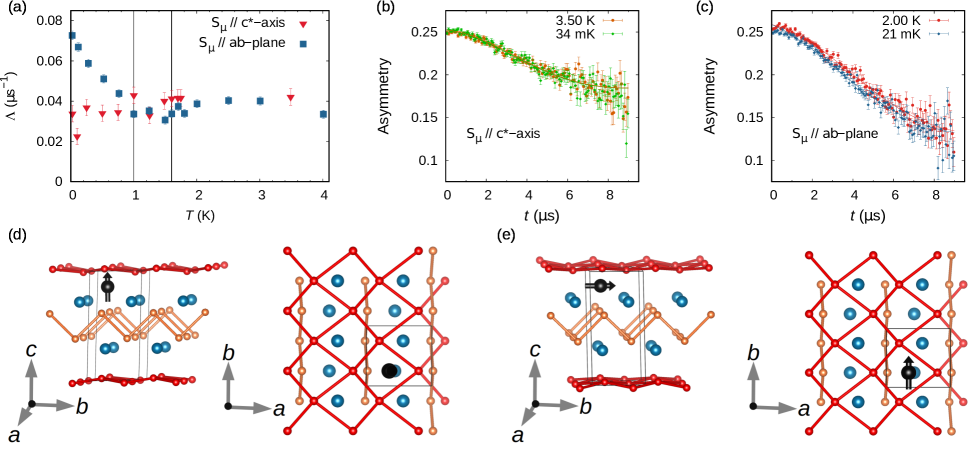
We utilize muon spin relaxation measurements in zero-field (ZF) to search for any sign of spontaneous magnetic fields associated with breaking of TRS in the superconducting state. ZF spectra for CaSb2 collected above and at the lowest temperature mK are shown in Fig. 6(b) and (c) for muon spins perpendicular to the -plane and parallel to the -plane, respectively. In the absence of any static electronic moments, the muon polarization decay is due to the randomly oriented nuclear magnetic moments, which is generally described by the Gaussian Kubo-Toyabe function
where reflects the width of the field experienced by muons due to nuclear dipoles.
We fit the ZF spectra with the following relaxation function
where is the sample asymmetry and is the background asymmetry. The additional represents any additional relaxation in the sample, such as broken TRS. The zero field muon spin relaxation rates of CaSb2 with muon spin perpendicular and parallel to the -plane show a consistent contribution from nuclear dipole moments as expected. However, the contribution to the additional term shows a change in at low temperature only when the muon spin is parallel to the -plane. Interestingly, this increase in shows a linear dependence at low temperature and seems to appear at 1.0 K, which is well below K. In the case of muon spin perpendicular to the -plane we find no significant change at , nor do we find any change at lower temperatures.
We explore possible interpretations for this spontaneous TRS breaking, taking into account its dependence on the muon spin direction and the temperature being well below . One possible explanation is triplet pairing in the superconducting state, but we exclude this based on Knight shift measurements revealing a decrease below Takahashi et al. (2021b). Breaking of TRS was reported below in SrPtAs, a multigap -wave superconductor, and this is discussed in relation to the multicomponent order parameter, belonging to a multidimensional representation, and grain-boundaries in the polycrystaline samples. This is unlikely in CaSb2 due to the single crystal nature of the sample in our experiment. Another distinction is the appearance of the TRS breaking when muon spins are parallel to the -plane only, which implies that the TRS breaking in CaSb2 is such that only muons spins parallel to the plane are sensitive to it. We consider the possibility of another superconducting phase breaking TRS that appears at 1 K, analogous with TRS breaking that appears below in UPt3 in Luke et al. (1993) and Kerr effect Schemm et al. (2014) measurements.
A second superconducting phase emerging below has been discussed for PrOs4Sb12, where an enhancement of associated with the secondary phase is reported Cichorek et al. (2005). We considered the possibility of a secondary phase emerging at K in CaSb2, so we analyzed the estimates in Fig. 2 by fitting the data above and below 1 K. We see a slight increase of estimated based on data below 1 K compared with that above 1 K when , while smaller difference appears for data above and below 1 K of with . The possible anomaly in in CaSb2 is similar to that observed in PrOs4Sb12 Cichorek et al. (2005), although if present it is much weaker in CaSb2 and is only observed with field applied . The appearance of TRS breaking with a spontaneous field in the direction may be related to the change in the dependence in measured in the same direction. However, for both directions a single fit to over all temperatures falls within the error bars, which makes the above analysis mere speculation in an attempt to understand the TRS breaking observed.
We consider the topology of CaSb2 in the normal state to explain the observation of TRS breaking. The topologically non-trivial Dirac nodal lines in CaSb2 have been shown theoretically to support topological superconductivity with pairing symmetry, which has been termed nodal-line superconductivity Ono et al. (2021). Also, the topologically trivial symmetry is also supported in CaSb2 Ono et al. (2021), which is more likely considering the nodeless gap behaviour observed in our TF- measurements and previous works Duan et al. (2022); Takahashi et al. (2021a). This leads us to conclude that even if a second superconducting phase emerges in CaSb2 at low temperatures it must have no extended nodes in its gap.
III.4 Large Diamagnetism in the Normal State
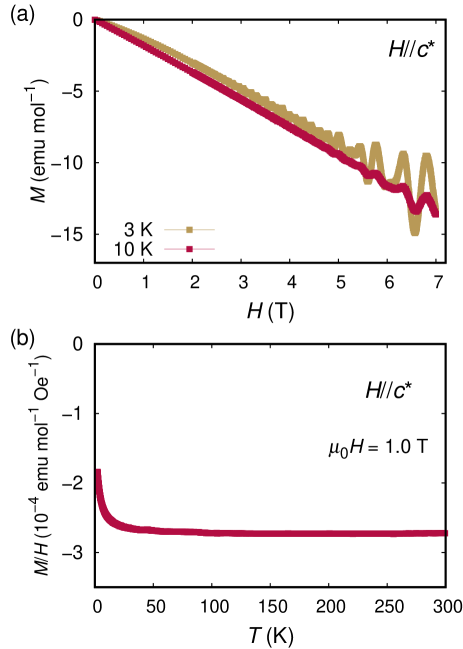
Large diamagnetism in the normal state has been observed in Dirac semimetals Fuseya et al. (2015); Zhang et al. (2019); Suetsugu et al. (2021); Watanabe et al. (2021); Singh et al. (2022), and discussed in relation to a linear dispersion near the Fermi level Fuseya et al. (2015). In non-magnetic compounds like CaSb2, the normal state magnetic response can be dominated by Pauli paramagnetism originating from the spin of free electrons. As well, diamagnetic contributions can arise from Landau diamagnetism, originating from the orbital motion, and a minor contribution from Larmor diamagnetism, originating from core ions. The Larmor diamagnetism in the case of CaSb2 is expected to be around emu mol-1 Oe-1 Bain and Berry (2008), while the experimentally observed value is larger than emu mol-1 Oe-1. The weak temperature dependence of the magnetic susceptibility down to 50 K, shown in Fig. 7(b), is consistent with strong diamagnetic contribution related to the Dirac nodal-lines Tateishi et al. (2021). This strong diamagnetic signal is observed despite the paramagnetic contribution expected in the normal states, and indicates a strong contribution from orbital diamagnetism that is likely related to the Dirac electrons in semimetallic CaSb2. Further investigations of this diamagnetic signal in future studies will help us clarify its origin.
The possible contribution from Dirac electrons in the normal state of CaSb2 to the magnetic properties and evidence for the validity of band structure calculations showing Dirac nodal-line states Oudah et al. (2022); Ikeda et al. (2022); Chuang et al. (2022) deepens the interest in the superconducting state realized in CaSb2. The carrier concentration is reported to be highly influenced by synthesis conditions Chuang et al. (2022), where changes seem to have little effect on the three-dimensional hole pocket and superconducting . This suggests that topology may be tuned in CaSb2 without affecting the superconductivity observed, such that topology and superconductivity can be realized in the same sample.
In summary, we demonstrated upper and lower critical field anisotropy in the superconducting state using magnetic susceptibility, and study the superconducting state using muon spin-relaxation. The temperature dependence of transverse-field relaxation can be fitted equally well with a single-gap model or two-gap model. A two-gap scenario is more likely considering previously reported tunnel-diode oscillator measurements on CaSb2. The normal state of CaSb2 shows a large diamagnetic signal, which is likely related to its Dirac semimetal nature. Zero-field relaxation shows little temperature dependence when the muon-spin is parallel to the -axis, while an increase in relaxation appears below 1 K when the muon-spin is parallel to the -plane. However, we find no discernible anomaly around this temperature in other measurements on CaSb2.
In various materials, such as UPt3, PrOs4Sb12, and Sr2RuO4, the onset of TRS breaking coincides with under ambient conditions and its detection is independent of the direction of muon spins. Considering the anisotropy and two gap nature of the superconducting state and the emergence of direction-dependent TRS breaking at 1 K, , further investigation of CaSb2 to clarify the possible emergence of a secondary phase is needed. Interactions between band structure topology, normal state diamagnetism, and superconductivity should be the subject of future studies. Finally, considering that the band structure of CaSb2 is dominated by Sb atoms sitting at the two distinct sites in the material, investigation of other Sb2 antimonides with similar structures is of great interest to contrast with our current findings.
IV Acknowledgements
We thank TRIUMF staff for their technical support during muon experiment. We thank M. Sigrist, G. Luke, Y. Uemura, J. Sonier, and A. Ramires for discussion on superconductivity. We also thank H. Matsuura and M. Ogata for discussion on diamagnetism in Dirac semimetals. MO acknowledges the support by Stewart Blusson Quantum Matter Institute and the Max Planck-UBC-UTokyo Center for Quantum Materials. JB, DAB, and MCA acknowledge the support by the Natural Sciences and Engineering Research Council of Canada (NSERC).
References
- Sigrist and Ueda (1991) M. Sigrist and K. Ueda, Reviews of Modern physics 63, 239 (1991).
- Luke et al. (1993) G. Luke, A. Keren, L. Le, W. Wu, Y. Uemura, D. Bonn, L. Taillefer, and J. Garrett, Phys. Rev. Lett. 71, 1466 (1993).
- Luke et al. (1998) G. M. Luke, Y. Fudamoto, K. Kojima, M. Larkin, J. Merrin, B. Nachumi, Y. Uemura, Y. Maeno, Z. Mao, Y. Mori, et al., Nature 394, 558 (1998).
- Xia et al. (2006) J. Xia, Y. Maeno, P. T. Beyersdorf, M. Fejer, and A. Kapitulnik, Phys. Rev. Lett. 97, 167002 (2006).
- Gor’kov and Rashba (2001) L. P. Gor’kov and E. I. Rashba, Phys. Rev. Lett. 87, 037004 (2001).
- Hillier et al. (2009) A. D. Hillier, J. Quintanilla, and R. Cywinski, Phys. Rev. Lett. 102, 117007 (2009).
- Singh et al. (2014) R. P. Singh, A. D. Hillier, B. Mazidian, J. Quintanilla, J. Annett, D. M. Paul, G. Balakrishnan, and M. Lees, Phys. Rev. Lett. 112, 107002 (2014).
- Barker et al. (2015) J. Barker, D. Singh, A. Thamizhavel, A. Hillier, M. Lees, G. Balakrishnan, D. M. Paul, and R. Singh, Phys. Rev. Lett. 115, 267001 (2015).
- Watashige et al. (2015) T. Watashige, Y. Tsutsumi, T. Hanaguri, Y. Kohsaka, S. Kasahara, A. Furusaki, M. Sigrist, C. Meingast, T. Wolf, H. v. Löhneysen, et al., Phys. Rev. X 5, 031022 (2015).
- Farhang et al. (2023) C. Farhang, N. Zaki, J. Wang, G. Gu, P. D. Johnson, and J. Xia, Phys. Rev. Lett. 130, 046702 (2023).
- Grinenko et al. (2017) V. Grinenko, P. Materne, R. Sarkar, H. Luetkens, K. Kihou, C. Lee, S. Akhmadaliev, D. Efremov, S.-L. Drechsler, and H.-H. Klauss, Phys. Rev. B 95, 214511 (2017).
- Grinenko et al. (2020) V. Grinenko, R. Sarkar, K. Kihou, C. Lee, I. Morozov, S. Aswartham, B. Büchner, P. Chekhonin, W. Skrotzki, K. Nenkov, et al., Nature Physics 16, 789 (2020).
- Biswas et al. (2013) P. K. Biswas, H. Luetkens, T. Neupert, T. Stürzer, C. Baines, G. Pascua, A. P. Schnyder, M. H. Fischer, J. Goryo, M. R. Lees, et al., Phys. Rev. B 87, 180503 (2013).
- Shang et al. (2020) T. Shang, M. Smidman, A. Wang, L.-J. Chang, C. Baines, M.-K. Lee, Z. Nie, G. Pang, W. Xie, W. Jiang, et al., Phys. Rev. Lett. 124, 207001 (2020).
- Aoki et al. (2003) Y. Aoki, A. Tsuchiya, T. Kanayama, S. Saha, H. Sugawara, H. Sato, W. Higemoto, A. Koda, K. Ohishi, K. Nishiyama, et al., Phys. Rev. Lett. 91, 067003 (2003).
- Neha et al. (2019) P. Neha, P. Biswas, T. Das, and S. Patnaik, Phys. Rev. Mater. 3, 074201 (2019).
- Oudah et al. (2022) M. Oudah, J. Bannies, D. Bonn, and M. Aronson, Phys. Rev. B 105, 184504 (2022).
- Funada et al. (2019) K. Funada, A. Yamakage, N. Yamashina, and H. Kageyama, J. Phys. Soc. Jpn. 88, 044711 (2019).
- Chuang et al. (2022) C.-W. Chuang, S. Souma, A. Moriya, K. Nakayama, A. Ikeda, M. Kawaguchi, K. Obata, S. R. Saha, H. Takahashi, S. Kitagawa, et al., Phys. Rev. Mater. 6, 104203 (2022).
- Deller and Eisenmann (1976) K. Deller and B. Eisenmann, Zeitschrift für anorganische und allgemeine Chemie 425, 104 (1976).
- Ikeda et al. (2020) A. Ikeda, M. Kawaguchi, S. Koibuchi, T. Hashimoto, T. Kawakami, S. Yonezawa, M. Sato, and Y. Maeno, Phys. Rev. Mater. 4, 041801 (2020).
- Ikeda et al. (2022) A. Ikeda, S. R. Saha, D. Graf, P. Saraf, D. S. Sokratov, Y. Hu, H. Takahashi, S. Yamane, A. Jayaraj, J. Sławińska, et al., Phys. Rev. B 106, 075151 (2022).
- Takahashi et al. (2021a) H. Takahashi, S. Kitagawa, K. Ishida, M. Kawaguchi, A. Ikeda, S. Yonezawa, and Y. Maeno, J. Phys. Soc. Jpn. 90, 073702 (2021a).
- Duan et al. (2022) W. Duan, J. Zhang, R. Kumar, H. Su, Y. Zhou, Z. Nie, Y. Chen, M. Smidman, C. Cao, Y. Song, et al., Phys. Rev. B 106, 214521 (2022).
- Morris and Heffner (2003) G. Morris and R. Heffner, Physica B: Condensed Matter 326, 252 (2003).
- Suter and Wojek (2012) A. Suter and B. Wojek, Physics Procedia 30, 69 (2012).
- Brandt (1999) E. H. Brandt, Phys. Rev. B 60, 11939 (1999).
- Werthamer et al. (1966) N. Werthamer, E. Helfand, and P. Hohenberg, Phys. Rev. 147, 295 (1966).
- Endo et al. (2023) J. Endo, H. Matsuura, and M. Ogata, Phys. Rev. B 107, 094521 (2023).
- Powell and Clark (1978) R. Powell and A. Clark, Cryogenics 18, 137 (1978).
- Amann et al. (1998) A. Amann, A. C. Mota, M. B. Maple, and H. v. Löhneysen, Phys. Rev. B 57, 3640 (1998).
- Cichorek et al. (2005) T. Cichorek, A. Mota, F. Steglich, N. Frederick, W. Yuhasz, and M. Maple, Phys. Rev. Lett. 94, 107002 (2005).
- Tinkham (2004) M. Tinkham, Introduction to Superconductivity (Courier Corporation, 2004).
- Brandt (1988) E. Brandt, J. Low Temp. Phys. 73, 355 (1988).
- Brandt (2003) E. H. Brandt, Phys. Rev. B 68, 054506 (2003).
- Carrington and Manzano (2003) A. Carrington and F. Manzano, Phys. C: Supercond. 385, 205 (2003).
- Sonier (2007) J. Sonier, Reports on Progress in Physics 70, 1717 (2007).
- Uemura (2004) Y. Uemura, J. Condens. Matter Phys. 16, S4515 (2004).
- Poole et al. (2007) P. Poole, H. Farach, R. Creswick, and R. Prozorov, Superconductivity academic press london (2007).
- Carbotte (1990) J. Carbotte, Rev. Mod. Phys. 62, 1027 (1990).
- Peabody and Meservey (1972) G. E. Peabody and R. Meservey, Phys. Rev. B 6, 2579 (1972).
- Adroja et al. (2018) D. T. Adroja, F. K. Kirschner, F. Lang, M. Smidman, A. D. Hillier, Z.-C. Wang, G.-H. Cao, G. B. Stenning, and S. J. Blundell, J. Phys. Soc. Jpn. 87, 124705 (2018).
- Albedah et al. (2017) M. A. Albedah, F. Nejadsattari, Z. M. Stadnik, Z.-C. Wang, C. Wang, and G.-H. Cao, J. Alloys Compd. 695, 1128 (2017).
- Bhattacharyya et al. (2018) A. Bhattacharyya, D. Adroja, M. Smidman, and V. Anand, Sci. China: Phys. Mech. Astron. 61, 1 (2018).
- Sonier et al. (2007) J. Sonier, S. Sabok-Sayr, F. Callaghan, C. Kaiser, V. Pacradouni, J. Brewer, S. Stubbs, W. Hardy, D. Bonn, R. Liang, et al., Phys. Rev. B 76, 134518 (2007).
- Uemura (1991) Y. Uemura, Phys. B: Condens. Matter 169, 99 (1991).
- Talantsev and Tallon (2015) E. F. Talantsev and J. L. Tallon, Nat. Commun. 6, 7820 (2015).
- Uemura et al. (1989) Y. Uemura, G. Luke, B. Sternlieb, J. Brewer, J. Carolan, W. Hardy, R. Kadono, J. Kempton, R. Kiefl, S. Kreitzman, et al., Phys. Rev. Lett. 62, 2317 (1989).
- Lin et al. (2013) X. Lin, Z. Zhu, B. Fauqué, and K. Behnia, Phys. Rev. X 3, 021002 (2013).
- Sonier et al. (2000) J. E. Sonier, J. H. Brewer, and R. F. Kiefl, Reviews of Modern Physics 72, 769 (2000).
- Serventi et al. (2004) S. Serventi, G. Allodi, R. De Renzi, G. Guidi, L. Romano, P. Manfrinetti, A. Palenzona, C. Niedermayer, A. Amato, and C. Baines, Phys. Rev. Lett. 93, 217003 (2004).
- Khasanov et al. (2008) R. Khasanov, H. Luetkens, A. Amato, H.-H. Klauss, Z.-A. Ren, J. Yang, W. Lu, and Z.-X. Zhao, Phys. Rev. B 78, 092506 (2008).
- Takahashi et al. (2021b) H. Takahashi, S. Kitagawa, K. Ishida, M. Kawaguchi, A. Ikeda, S. Yonezawa, and Y. Maeno, J. Phys. Soc. Jpn. 90, 073702 (2021b).
- Schemm et al. (2014) E. Schemm, W. Gannon, C. Wishne, W. Halperin, and A. Kapitulnik, Science 345, 190 (2014).
- Ono et al. (2021) S. Ono, H. C. Po, and K. Shiozaki, Phys. Rev. Res. 3, 023086 (2021).
- Fuseya et al. (2015) Y. Fuseya, M. Ogata, and H. Fukuyama, J. Phys. Soc. Jpn. 84, 012001 (2015).
- Zhang et al. (2019) C.-L. Zhang, C. Wang, Z. Yuan, X. Xu, G. Wang, C.-C. Lee, L. Pi, C. Xi, H. Lin, N. Harrison, et al., Nat. Commun. 10, 1028 (2019).
- Suetsugu et al. (2021) S. Suetsugu, K. Kitagawa, T. Kariyado, A. Rost, J. Nuss, C. Mühle, M. Ogata, and H. Takagi, Phys. Rev. B 103, 115117 (2021).
- Watanabe et al. (2021) Y. Watanabe, M. Kumazaki, H. Ezure, T. Sasagawa, R. Cava, M. Itoh, and Y. Shimizu, J. Phys. Soc. Jpn. 90, 053701 (2021).
- Singh et al. (2022) S. Singh, N. Kumar, S. Roychowdhury, C. Shekhar, and C. Felser, J. Condens. Matter Phys. 34, 225802 (2022).
- Bain and Berry (2008) G. A. Bain and J. F. Berry, J. Chem. Educ. 85, 532 (2008).
- Tateishi et al. (2021) I. Tateishi, V. Könye, H. Matsuura, and M. Ogata, Phys. Rev. B 104, 035113 (2021).