Exploring the Correlation Between Ultrasound Speed and the State of Health of LiFePO4 Prismatic Cells
Abstract
Electric vehicles (EVs) have become a popular mode of transportation, with their performance depending on the ageing of the Li-ion batteries used to power them. However, it can be challenging and time-consuming to determine the capacity retention of a battery in service. A rapid and reliable testing method for state of health (SoH) determination is desired. Ultrasonic testing techniques are promising due to their efficient, portable, and non-destructive features. In this study, we demonstrate that ultrasonic speed decreases with the degradation of the capacity of an LFP prismatic cell. We explain this correlation through numerical simulation, which describes wave propagation in porous media. We propose that the reduction of binder stiffness can be a primary cause of the change in ultrasonic speed during battery ageing. This work brings new insights into ultrasonic SoH estimation techniques.
keywords:
State of health , ultrasonic testing , Biot theory , finite element method , Li-ion battery , electric vehicle[inst1]organization=School of Mechanical and Aerospace Engineering, Nanyang Technological University,addressline=50 Nanyang Avenue, country=Singapore 639798
[inst2]organization=Advanced Remanufacturing and Technology Centre, Agency for Science, Technology and Research, addressline=3 Cleantech Loop, country=Singapore 637143
[inst3]organization=Institute of Materials Research and Engineering, Agency for Science, Technology and Research, addressline=2 Fusionopolis Way, country=Singapore 138634
![[Uncaptioned image]](/html/2309.12191/assets/Abstract.jpg)
1 Introduction
Nowadays, there is explosive growth in the electric vehicle (EV) market due to increased public awareness of environmental protection and improvements in EV range and safety. To achieve a range comparable to traditional vehicles, an EV is usually equipped with hundreds/thousands of Li-ion batteries. However, these batteries will experience ageing in terms of capacity reduction and suffer a high risk of failure. To ensure the range and safety of EVs, the batteries are usually replaced when their capacity retention decreases to 70-80%.
The capacity of a battery can be measured by applying a full charge-discharge process [1]. However, this process can be time-consuming [2] and the batteries in service usually do not experience full charges or discharges.
In addition to the tools based on electrochemical [3, 4] and pressure [5] measurements, ultrasonic testing techniques are promising due to their sensitive, portable, and non-destructive features. Pioneering studies on the ultrasonic state of charge (SOC) estimation [6, 7, 8, 9, 10, 11] have been reported. Besides, Huang et al. [12] characterized the layered structure within batteries with ultrasonic resonance; Zhang et al. [13] demonstrated the feasibility of using ultrasonic guided waves to monitor dendrite formation at electrode-electrolyte interface in aqueous zin ion batteries; Appleberry et al. [14] used ultrasound to detect overcharge and thermal runaway of Li-ion batteries.
For SoH estimation, Davies et al. [15] experimentally confirmed a positive correlation between ultrasound speed/amplitude and SoH of LCO pouch cells within 60 cycles, Ladpli et al. [16] observed a negative correlation between velocity/amplitude of ultrasonic guided waves and SoH of NMC pouch cells before the capacity retention decreased to 96%, and Wu et al. [17] found that the ultrasound time-of-flight (ToF)/amplitude increases along with the cycle number of LCO pouch cells before the SoH degraded to 98%. Data-driven methods that modelled the correlations have been adopted as a commercial SoH estimation technique [18, 19, 20]. However, the comprehensive investigation of the underlying physics behind the correlation between SoH and ultrasonic features is still limited. While Deng et al. [21] has established that the correlation is primarily linked to unwetting in pouch cells, the inherent complexity of batteries often gives rise to multiple fading mechanisms and the sensitivity to ultrasound can vary depending on the specific case. For instance, in prismatic cells, there is typically an abundance of electrolytes, making the phenomenon of ’unwetting’ less significant in this particular case.
Without a basic understanding of the underlying physics, it is unclear in which cases the correlation holds, such as the disappearance of the correlation between ultrasound amplitude and cycle number after 60 cycles [17]. Moreover, as the correlation varies with cells and the modes of ultrasonic waves [15, 16, 17], the transferability of a data-driven model would be challenging, while a physics-based method can be easily adapted for various cases. Therefore, it is necessary to figure out which ageing mechanisms that accompany capacity fading should account for the evolution of ultrasonic features.
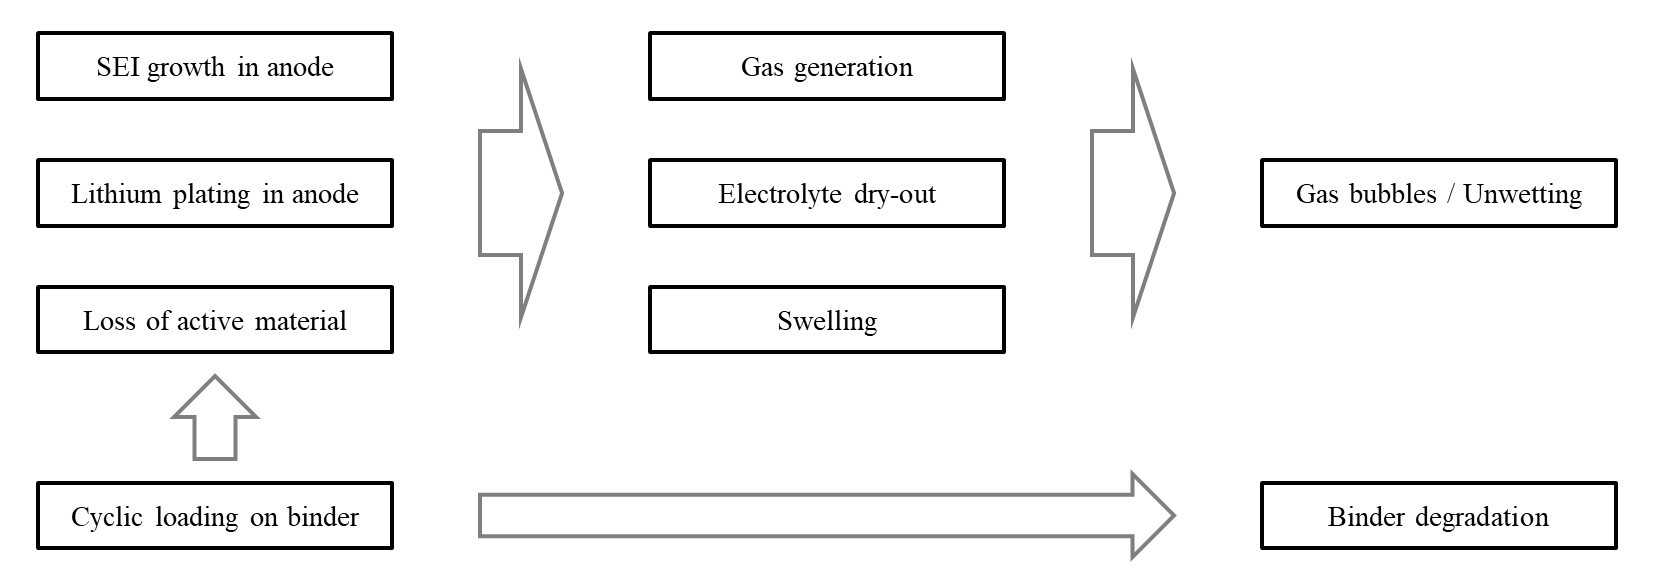
The ageing mechanisms that may introduce geometry and mechanical property changes, and affect ultrasound propagation subsequently, should be considered. As summarized in Figure 1, firstly, capacity fading directly reveals the loss of active lithium. The active lithium can be consumed in three ways: solid-electrolyte interface (SEI) growth and lithium plating in the anode [22, 23, 24, 25, 26, 27, 28, 29], and loss of active material (LAM) caused by the breakage of the conductive binder. As either graphite particles or cathode active material would expand/shrink during lithium intercalation/deintercalation [30, 31, 22, 32] and the relative amount of intercalated lithium affects their elastic properties [30, 33], the loss of active lithium causes variations in particle volumes and elastic properties. Secondly, due to the expansion/shrinkage of active particles during lithium intercalation/deintercalation, the binder that connects the particles suffers cyclic loading [32, 34]. Demirocak et al. [35] conducted nanoindentation on the cathodes of LFP prismatic cells and found that the cathode solid frame’s modulus degradation due to cycling can be up to 76.1% under 90% capacity retention and 2 C-rate. They speculated that the modulus degradation should be attributed to the crystallinity reduction of the binder. This speculation is reasonable because plastics would experience stiffness reduction under cyclic loading due to the breakage of cross-links between molecules on the nano-scale [36, 37, 38, 39, 40]. Moreover, Jiang et al. [41] revealed the detachment between active particles and carbon/binder matrix by experiment, which would not only cause LAM but also the stiffness reduction of the electrodes. Another important consideration is the coupling of SEI growth and lithium plating with gas generation [42, 43] and electrolyte dry-out [21]. These fading mechanisms can lead to the formation of dilute gas bubbles and the emergence of large gas regions, commonly referred to as unwetting pores. Both forms may affect the wave velocities [44, 45, 21]. To quantify their contribution to the evolution of ultrasonic features, a model that describes the ultrasound propagation is required. Such a model can not only explain the correlation but also be useful for SoH prediction.
The main challenge of constructing a physics-based model is to simulate wave propagation in electrodes and separators, which are liquid-saturated porous mediums. While an analytical solution for wave velocity in porous media can be derived using Biot theory [46], its application to electrodes poses significant challenges. Biot theory is primarily designed for analyzing porous media with isotropic and homogeneous solid frames. However, the frame of electrodes exhibits a diverse composition, comprising various materials, including active components and binders. As an alternative approach, we intend to employ 3-D FEM to model the microstructure of the electrodes and simulate the fluid-solid interaction at the microscopic level. This method will enable us to accurately model wave propagation within the electrodes. Similar modelling strategies were adopted in ultrasonic diagnosis for cancellous bone [47, 48] and studying seismic wave propagation [49].
This paper is organized as the following: Experimental confirmation of the correlation between ultrasound speed and SoH of a commercial LFP prismatic cell for EVs is described in Section 2. The physical model construction and the evaluation of the ageing mechanisms to explain the correlation are described in Section 3. Section 4 includes the concluding remarks.
2 Experimental confirmation
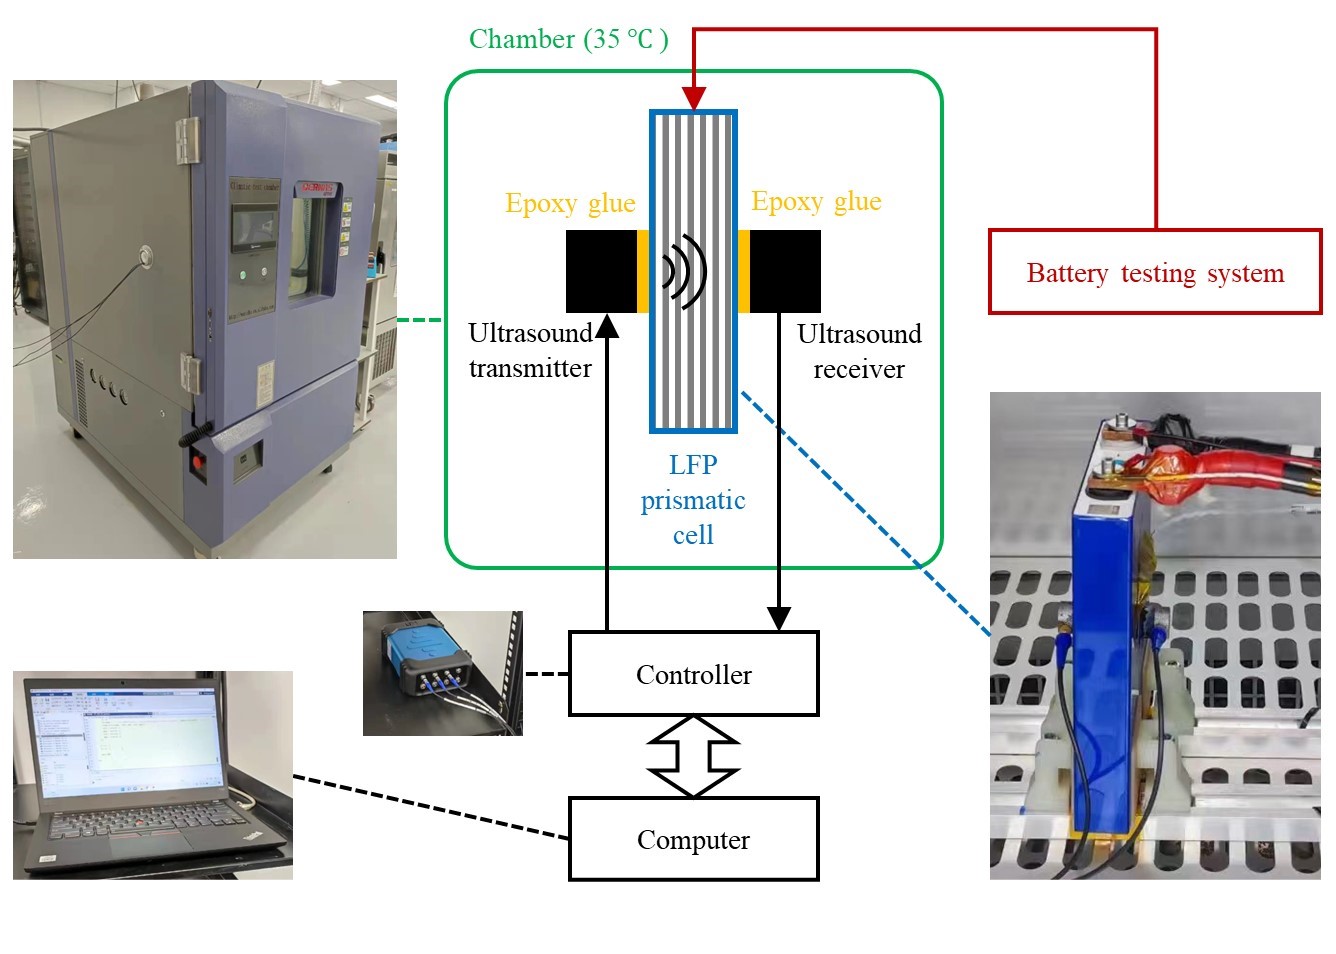
LFP prismatic cells are widely used for EVs. We performed an ageing test on an LFP prismatic cell with a rated capacity of 50 Ah (EVE LF50K) and equipped the cell with an ultrasonic monitoring system concurrently to investigate the correlation between the SoH and ultrasound features. The whole setup is as shown in Figure 2.
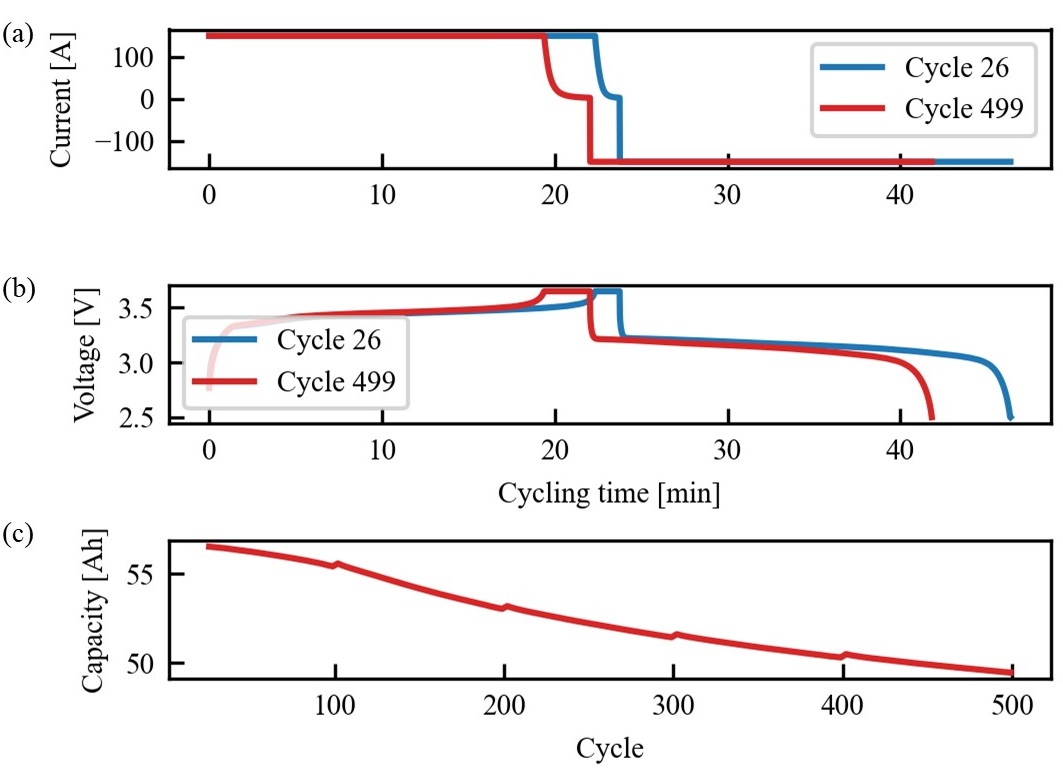
The cell was connected to a battery testing system (BTS) to charge and discharge at a 3 C-rate, i.e., a rate under which 1/3 h is needed for a full charge/discharge. As shown in Figure 3(a) and (b), at each charge-discharge cycle, the cell experienced constant current (CC) charge at 150 A until 3.65 V, constant voltage (CV) charge until 2.5 A, and CC discharge at 150 A until 2.5 V. The capacity fading of the battery due to cycling is shown in Figure 3(c). There was a resting stage every 100 cycles, after which there is a capacity regeneration due to the lithium redistribution in different forms [50, 51]. After 500 cycles, the battery suffers a roughly 10% capacity loss.
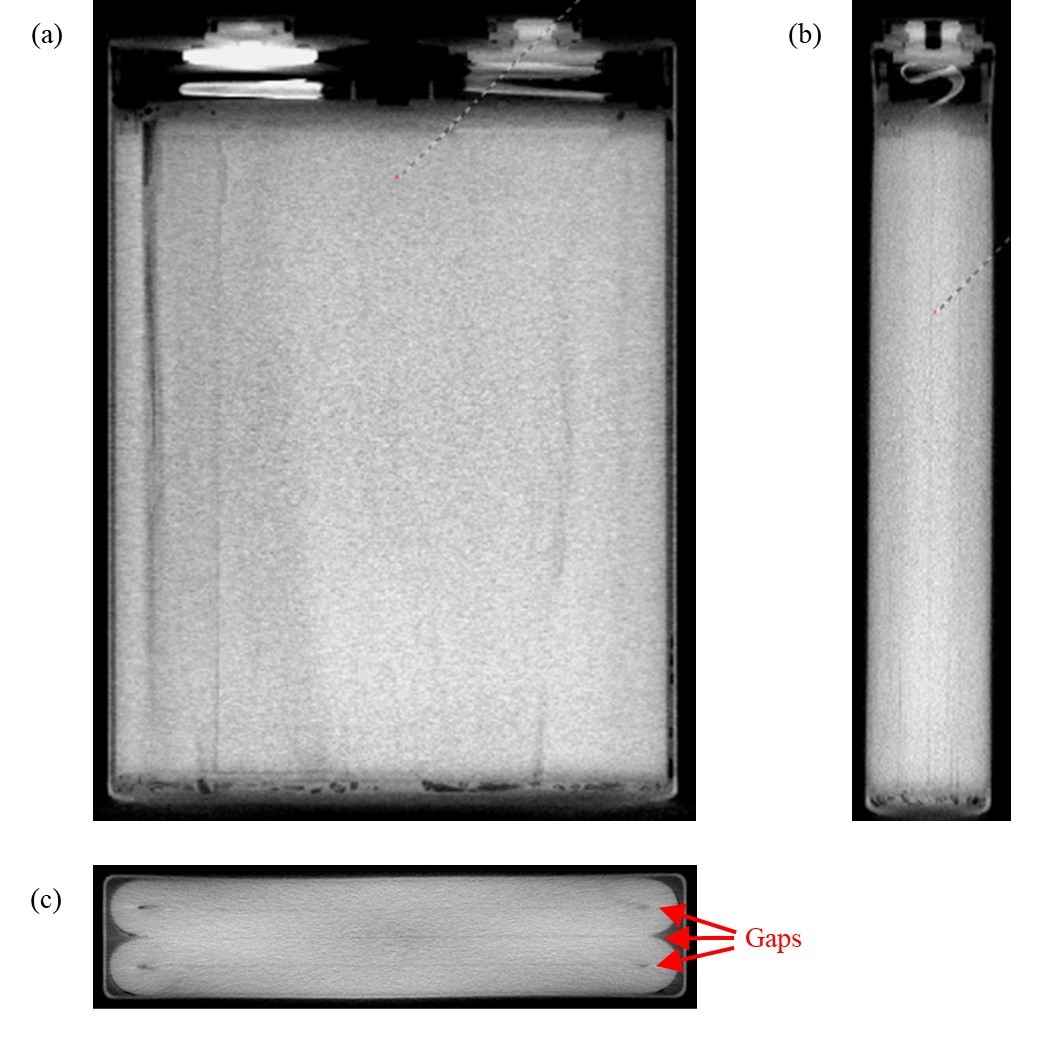
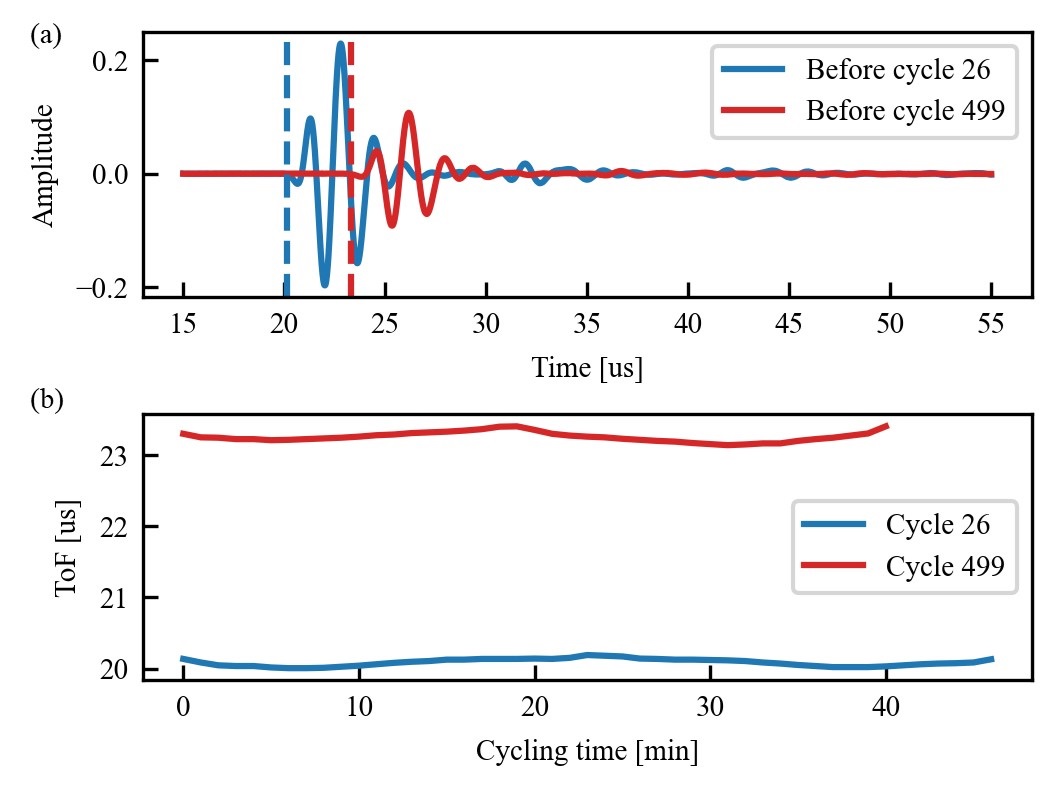
Two ultrasound probes (Olympus V106-RM) were bonded on the front and back sides of the battery to generate ultrasonic waves and receive the transmitted ultrasonic waves, respectively. The excitation was a broadband pulse with a central frequency of 2.25 MHz. As illustrated by the X-ray CT images in Figure 4, the cell contains two rolls of stacked electrode/separator layers, which are immersed in electrolytes. The waves propagated along the stacking direction of the internal layers. The time of flight (ToF) of the transmitted waves was extracted from the time-domain signals, as shown in Figure 5(a). After nearly 500 cycles, the ToF of the transmitted waves increased by around 3 s. It is worth noting that the central frequency of the received waves was around 600 kHz, which is lower than the excitation frequency. It is expected, as waves with higher frequencies had lower transmission through the cell. Moreover, in addition to the main pulse, the subsequent minor pulses corresponded to the multiple reflections caused by the shells and gaps between the rolls, as shown in Figure 4(c).
From Figure 5(b), we observe that the ToF variation is small in each charge-discharge cycle and the pattern of evolution over time is different between cycles. It implies that ToF is insensitive to SOC and susceptible to other factors.
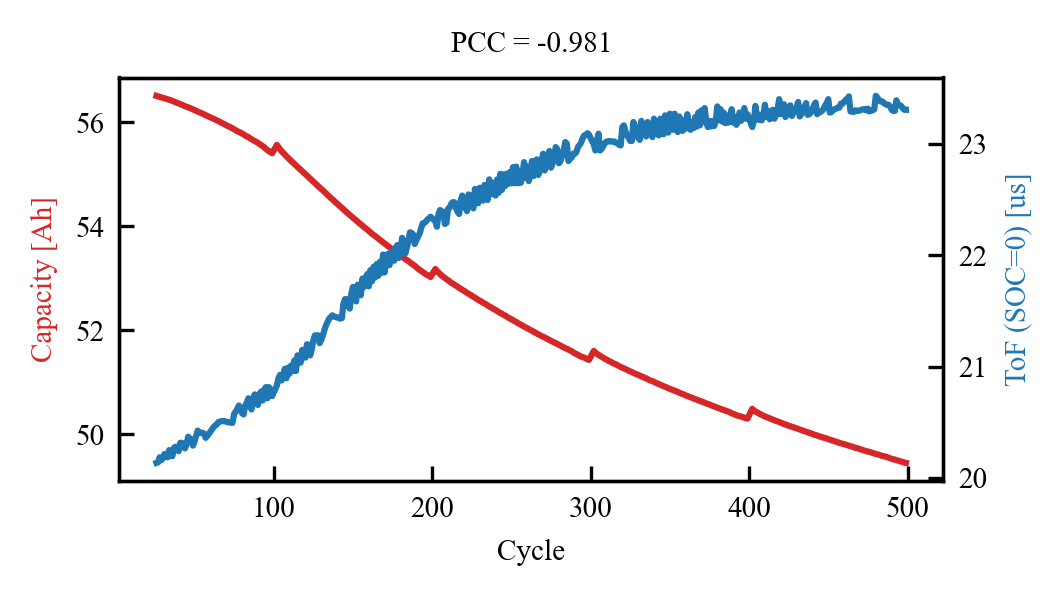
On the other hand, as shown in Figure 6, ToF has a strong correlation with SoH. Although there are small perturbations, the ToF increased monotonically along the cycle number, which is sound for accurate SoH prediction with ToF. Additionally, the ToF was found to be insensitive to capacity regeneration after each resting stage. To quantify the correlation, a metric that measures the linear correlation between two variables, Pearson correlation coefficient (PCC) [52], is adopted. A PCC value close to -1 represents a strong negative linear correlation. The PCC between the capacity retention and the ToF over the 500 cycles is -0.981, which indicates a strong negative linear correlation.
It is also worth noting that, although the chamber kept an ambient temperature of 35 ∘C (see Figure 2), during the continuous 3 C-rate cycling, the surface temperature of the cell elevated and equilibrated in the range of 44 to 46.5 ∘C, according to the measurement by a bonded thermocouple. At the fully discharged states, the surface temperature remained constant, which was 46 ∘C. Therefore, the temperature effect on the ToF was excluded.
In summary, from Figure 6, the capacity suffers a 12.4% decrease from 56.5 Ah at the 26th cycle to 49.5 Ah at the 500th cycle under 3 C-rate, and the ToF increases by 15.9% from 20.1 s to 23.3 s. Similar results were also found in another cell, which is described in A. The strong correlation between ToF and capacity fading indicates the feasibility of using ultrasound for battery health monitoring. We can model the correlation using either data-driven methods or physical models for SoH prediction in practice.
3 Physical explanation
3.1 Wave propagation model of the prismatic cell
To quantitatively explain the correlation between ToF and SoH, it is necessary to build up a mathematical model for the cell to calculate the transmission ToF of ultrasound. The model built here is for a pristine cell in a fully-discharged state.
The internal structure of the prismatic cell is stacked layers. Among them, the current collectors (Cu and Al) are simple linear elastic solids, while the separator is fluid-saturated porous material whose solid phase is polypropylene (PP) and fluid phase is the electrolyte. The anode and cathode are porous materials whose solid phase consists of several materials, as listed in Table 2, and the electrolyte fluid phase.
| Anode solid phase | |||
| Composition | Weight% | Density [g/cm3] | Volume% |
| Graphite | 94.5 | 2.26 | 92.6 |
| CMC | 2.25 | 1.6 | 3.1 |
| SBR | 2.25 | 1.52 | 3.3 |
| Carbon black | 1 | 2.1 | 1.1 |
| Cathode solid phase | |||
| Composition | Weight% | Density [g/cm3] | Volume% |
| LiFePO4 | 93.5 | 3.5 | 89.0 |
| PVDF | 2.5 | 1.78 | 4.7 |
| Carbon black | 4 | 2.1 | 6.3 |
By referring to Tables 2 and 2 and assuming a porosity for each porous material, the total thickness of each layer type was obtained, as is listed in Table 3. Then, given the wave velocity in each material, the ToF of ultrasound transmitted through the cell can be obtained.
| Composition | LiFePO4 | Electrolyte | Graphite | Al | Cu | PP |
| Weight% 333Material Safety Data Sheet (MSDS) of Li-ion battery LF50K, EVE POWER Co., Ltd. https://www.evebattery.com/prismatic-lfp-cell | 31 | 22 | 17 | 18 | 10 | 2 |
| Density [g/cm3] | 3.5 | 1.27 [53] | 2.26 | 2.7 | 8.96 | 0.9 |
| Volume% | 21.1 | 38.2 | 18.6 | 14.7 | 2.5 | 4.9 |
| Layer | Porosity (Assumed) | Total thickness [mm] | [m/s] | ToF [us] |
| Anode (Graphite&Electrolyte) | 0.37 | 9.21 | 1154.8 (FEM) | 7.97 |
| Cathode (LiFePO4&Electrolyte) | 0.4 | 10.91 | 1145.4 (FEM) | 9.53 |
| Separator (PP&Electrolyte) | 0.4 | 2.54 | 1353.7 (FEM) | 1.88 |
| Cu | 0.77 | 4600 | 0.17 | |
| Al | 5.87 | 6320 | 0.93 | |
| Total | 29.3 | 20.47 |
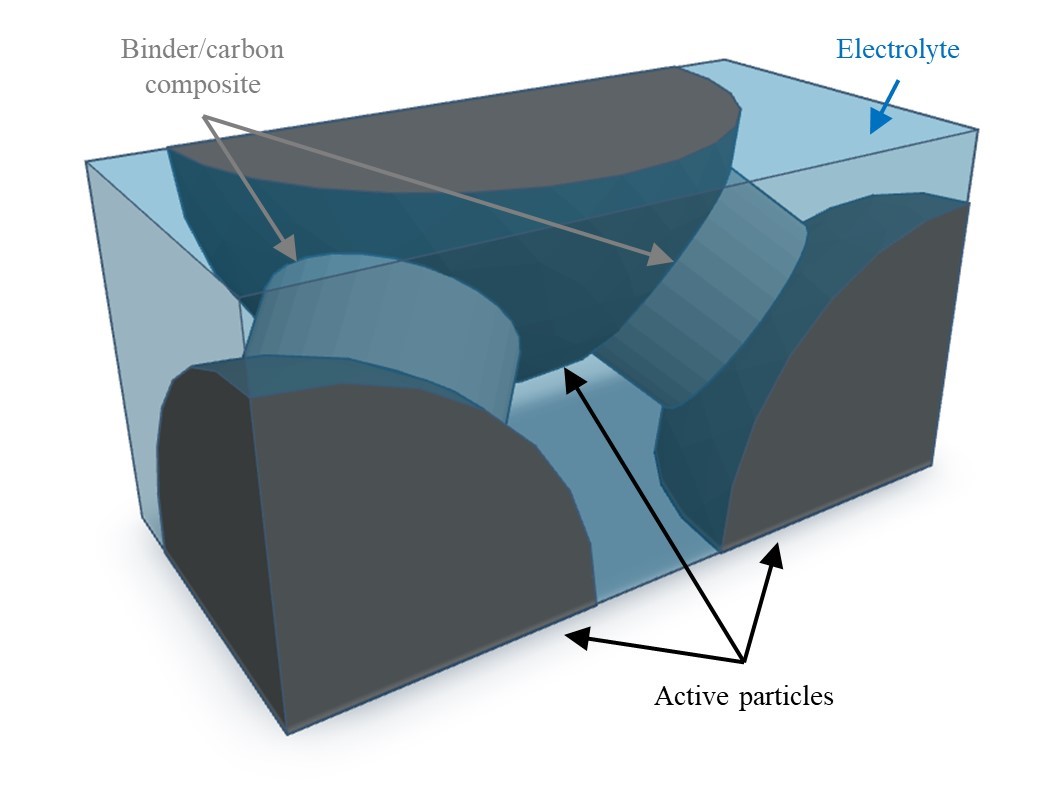
The wave velocities in electrodes were obtained with 3-D FEM. The modelling microstructure of an electrode is shown in Figure 7(a). The active material particles are modelled as arrayed cubes with a representative size of 10 m. The binder and the conductive carbon black are modelled as a single material, in the form of cuboids that connect the particles, considering that the conductive carbon black is in the form of nanoparticles and mixed with binder material in the micro-scale. The remaining regions are electrolytes. A 3-D model is essential since, in practical scenarios, the fluid phase is continuous. The modelling microstructure is a simplified version of reality. However, simulations with different microstructures confirm that the variation in the microstructure has little effect on the wave velocity (see B).
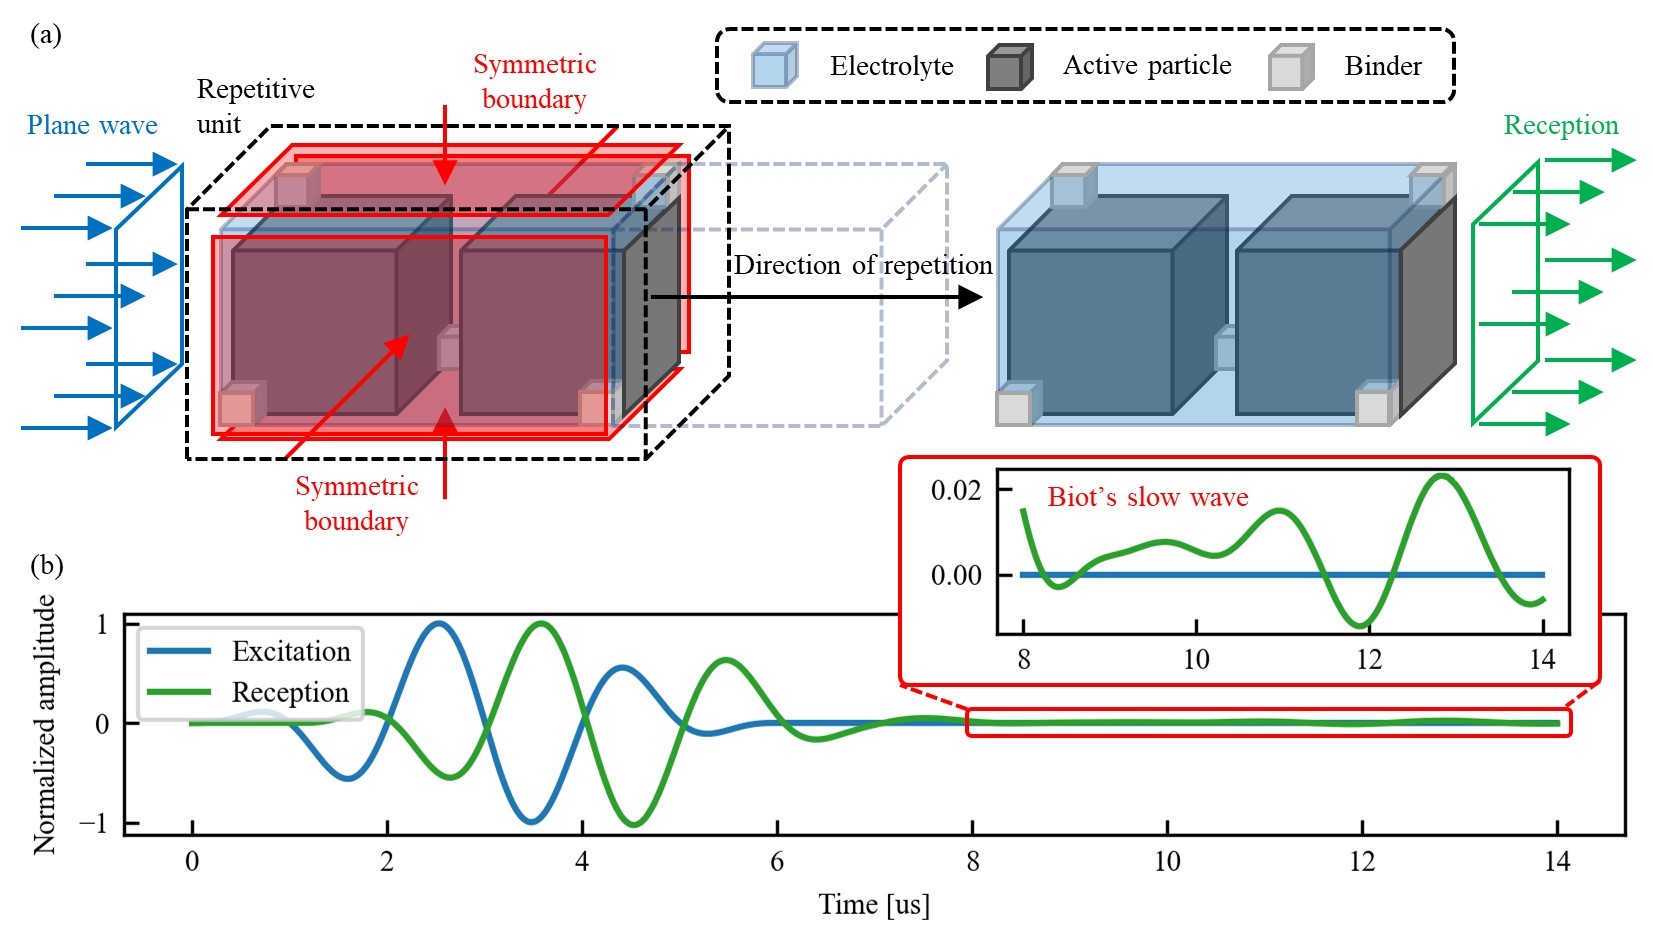
On the left end of the model, a Hanning-windowed 3-cycle sinusoidal transient load was applied, as shown in Figure 7(b). The central frequency of the load is 500 kHz, which is close to the central frequency of measured signals in the experiment (see Figure 5(a)). The waves propagated through the model were recorded on the right end. Considering that the electrodes have large dimensions perpendicular to the wave propagation direction, the plane strain condition should be met in these dimensions. Therefore, we only model a unit volume in these dimensions, and symmetric boundary conditions are applied. On the other hand, the dimension of the direction of propagation should be large enough to ensure the separation between the first arrived longitudinal wave and another slow wave predicted by Biot theory. The slow wave has a high attenuation rate in practice, and we only care about the fast wave in this study. Then, the ToF of the longitudinal wave through the model can be estimated with a received longitudinal wave’s waveform that is not polluted by the slow wave.
In the FEM model, the acoustic behaviour in a solid is described by
| (1) |
where is the density of the solid, is the displacement vector, and is the Cauchy stress tensor.
For the acoustic behaviour in the fluid phase, as we only study the wave velocity, the losses due to viscosity and thermal conduction will be neglected. The governing equation for the fluid phase is
| (2) |
where is the sound pressure; and are the density and sound speed of the fluid.
At the fluid-solid interfaces, the sound pressure and acceleration are continuous. The friction between the fluid and the solids due to fluid viscosity is neglected as it has little influence on the wave velocity [54]. In this study, the coupling is realized by the COMSOL Acoustic-Solid Interaction, Transient Interface, which is described by
| (3) | |||||
| (4) |
where is the surface normal of a fluid-solid interface, and is the load force per unit area experienced by the solids.
The aforementioned equations were solved by 3-D FEM with the material properties as listed in Table 4. The bulk and shear modulus of the binder/carbon composite materials are estimated by referring to the measured elastic modulus in the literature [55, 56] and assuming a Poisson’s ratio of 0.35. This value was chosen because plastics usually have a Poisson’s ratio of 0.4, while the one of carbon black is 0.3.
| Composition | Bulk modulus [GPa] | Shear modulus [GPa] |
| Graphite [30] | 27 | 12.5 |
| Anode binder [56] (CMC&SBR&Carbon black) | 0.56 | 0.19 |
| LiFePO4 [33] | 95 | 45 |
| Cathode binder [55] (PVDF&Carbon black) | 1.78 | 0.59 |
| PP | 1.38 | 0.92 |
| Electrolyte [57] | 1 |
Figure 7(b) shows an example time-domain signal received on the right end, in which the separated longitudinal wave and slow wave can be observed.
The FEM-calculated ToF through electrodes of the prismatic cell is listed in Table 3. The wave velocity in the separator was also calculated by FEM and the solid phase was modelled as a cubic lattice. This FEM-calculated velocity, 1353.7 m/s, was found to be in good agreement with the one based on Biot theory (1345.4 m/s). Further details regarding the application of Biot theory can be found in C. Overall, the total ToF through the cell, calculated as 20.5 s, was found to agree well with the experiment value of 20.1 s.
3.2 The effect of binder degradation
The ToF corresponding to a bulk and shear modulus reduction from 0% to 75% of the binder/carbon composite material was calculated by the FEM model. As shown in Figure 8, when the stiffness reductions for both anode and cathode were up to 75%, the ToF increase reached 16.5%. This increase is comparable to the one observed in experiments.
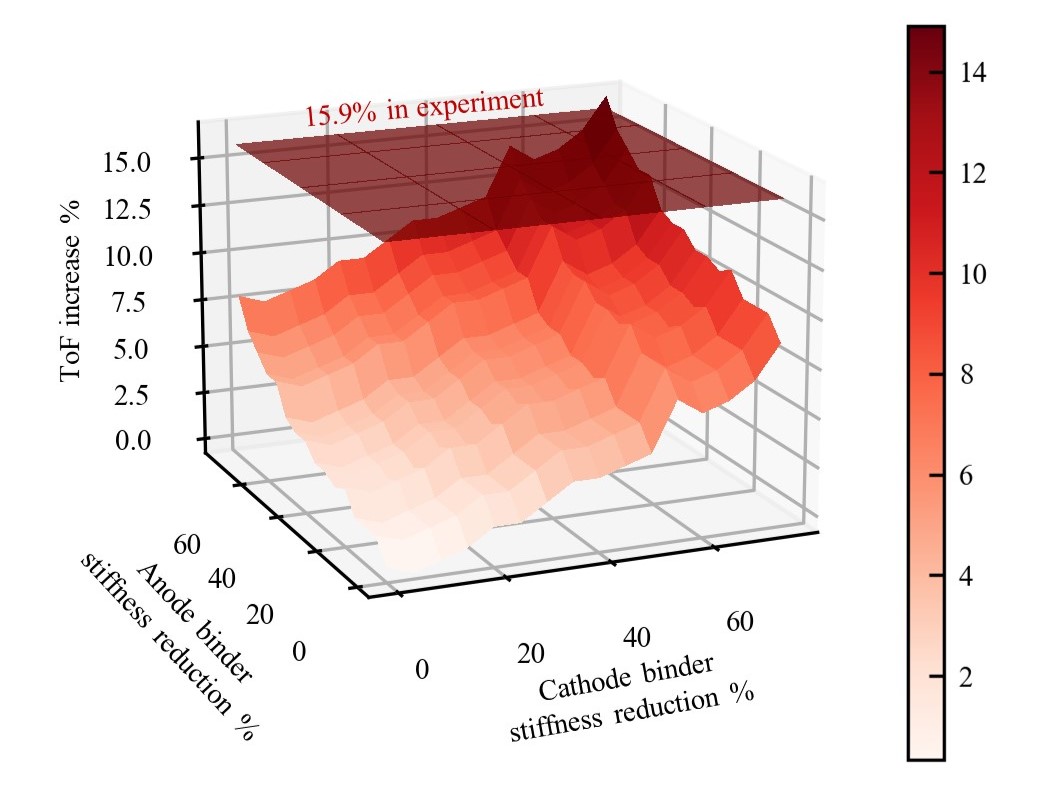
Based on the experiments listed in Table 5, the stiffness reduction of the LFP cathode can reach up to 76.1% under 2 C-rate and 90% capacity retention. Higher C-rate and number of cycles lead to greater stiffness reduction. In our experiments, we observed a 15.9% increase in ToF under the conditions of 3 C-rate and 87.6% capacity retention. Therefore, the electrode stiffness reduction should be comparable to or even larger than 76.1%. In the FEM model, a 75% binder stiffness reduction leads to a 74.4% reduction in anode elastic modulus and a 74.3% reduction in cathode elastic modulus. Therefore, it is reasonable to conclude that the observed 15.9% increase in ToF can be attributed to these stiffness reductions.
| Sample | Samples from [35] | Our sample | |||
| Electrode | Cathode | Cathode | Cathode | Cathode | Anode |
| Ambient temperature [∘C] | 55 | 55 | 55 | 35 | 35 |
| C-rate | 1 | 1 | 1 (charge) 2 (discharge) | 3 | 3 |
| Capacity retention% | 90 | 80 | 90 | 87 | 87 |
| #Cycles | 459 | 517 | 171 | 500 | 500 |
| Elastic modulus reduction% | 23.4 (Measured) | 41.3 (Measured) | 76.1 (Measured) | 74.3 (Assumed) | 74.4 (Assumed) |
3.3 The effect of loss of active lithium
The loss of active lithium in batteries can occur through three different mechanisms: SEI growth, lithium plating, and LAM. To quantify the effects of these fading mechanisms individually, we assume a 10% lithium loss, which is attributed solely to one of these mechanisms. Moreover, the ageing effects are quantified at a fully-discharged state.
To investigate the effect of SEI growth or lithium plating, we assume that the SEI or lithium is uniformly deposited on the surface of graphite particles, forming a thin layer with no change in the thickness of the anode layer. By referring to the composition volumes listed in Table 2 and the molar volumes of graphite, SEI [58, 59], and lithium, we obtained a graphite particle size increased by 4.2% and 0.6% due to SEI growth and lithium plating, respectively. This calculation agrees with the experiments that reveal the SEI thickness is usually in the nano-scale [31, 60]. On the other hand, the loss of active lithium reduces lithium intercalation in cathode active particles, leading to a 2% reduction in bulk modulus and a 0.5% reduction in volume. As the anode layer thickness remains constant, we assume that the cathode layer experiences a free thickness shrinkage due to the reduction in the volume of active particles. Then, the thickness change of the cathode layer was obtained based on the porosity listed in Table 3. The space created by the cathode shrinkage can be filled with electrolytes. Overall, either SEI growth or lithium plating causes only negligible mechanical property changes.
For LAM, we consider the detachment of active materials from the binder/carbon matrix. In this case, the lithium in the detached active material particles would be blocked as the particles become non-conductive. Here, we made a quantification by assuming the lost 10% lithium is blocked in the detached graphite particles. At the fully-discharged state, the stiffness of graphite particles remains constant, but the particle size increases by 1.5% compared to the case without lithium. Regarding the layer thicknesses, as the graphite expansion is larger than the cathode particles’ shrinkage, the anode would not experience a free expansion. Instead, it would be pressed by the separator and the cathode layer, and the binders in these layers would suffer compression. Given the binder volumes and the bulk modulus of the binders and the separator, the equilibrium layer thickness variations are -0.192% and +0.233% for the cathode and anode, respectively. In summary, the LAM also leads to negligible mechanical property changes.
Overall, the factors related to the re-distribution of lithium should have limited contribution to the change of ultrasound ToF, as summarized in Table 6. This finding agrees with our experimental results, showing little ToF variation over SOC and with capacity regeneration.
3.4 The effect of gas generation or unwetting
The SEI growth and electrolyte consumption would introduce dilute gas bubbles in the electrolyte or gas regions in the pores [21]. For dilute gas bubbles, extended Biot theories have been developed by modifying the liquid parameters for the gas-liquid mixture [44, 45]. In the ultrasonic frequency range (larger than 100 kHz), gas bubbles affect the sound speed only if their size is smaller than 2.5 m (see D). However, the microbubbles lose gas and disappear quickly [61, 62]. For the gas region in pores, the cell in our experiment has extra electrolytes and the whole electrodes are fully soaked in electrolytes, and the gas region should be replenished by the extra electrolytes. Therefore, even if the gas generation affects the ultrasound speed, the effect should be short-term and recoverable. This means that long-term measurements can be used to reveal the effect of gas generation.
We performed ultrasonic testing on the aged cell after long-term storage and compared the ultrasonic signal with the one recorded right after the cycling under room temperature. The ToF of transmitted ultrasound for the two cases is 20.9 s and 20.5 , respectively, which has a decrease of 2%. It demonstrates gas generation or unwetting should not be a major factor responsible for the ToF variation.
3.5 Discussion
In summary, binder degradation can induce a comparable ToF increase with the experiment while the loss of active lithium only has negligible contributions, and the gas in the electrodes can not have a significant and unrecoverable influence on the ToF.
The binder degradation that causes the ToF increase does not have a direct correlation with the capacity fading. Instead, it should reveal the cycling history, such as the C-rate and number of cycles. It implies that the ToF may not have a stable correlation with capacity retention.
We performed extra cycling on the cell and found that, although the capacity kept fading at the same rate, ToF remained constant at later cycles, which results in the increase of PCC from -0.981 to -0.917. This is because binder degradation mainly occurs in the early cycles, whereas the loss of active lithium remains at a constant rate throughout all cycles.
Therefore, if we use ToF as the feature to predict capacity retention, it may fail at late cycles. Instead, the ToF feature should be useful for predicting cycling history because the C-rate and number of cycles have a direct correlation with binder degradation.
As for the generality of the correlation between ToF and SoH, despite the various cell types and operating conditions such as temperature, C-rate, and depth of charge/discharge, the binder that connects active materials should always experience stiffness reduction due to the expansion/shrinkage of active materials during lithium intercalation/deintercalation. For example, both Davies et al. [15] and Wu et al. [17] observed the increase of ultrasound ToF along with the number of cycles of LCO pouch cells. However, the rate of stiffness reduction should be dependent on the cell types and operating conditions. The accuracy of SoH prediction with ToF would be affected subsequently.
4 Conclusion
In this work, there are mainly two original contributions. Firstly, we confirmed the correlation between ultrasound speed and SoH of an LFP prismatic cell with an ultrasonic battery health monitoring experiment. During the 3 C-rate cycling of the cell, both the capacity retention and ultrasound speed kept decreasing, At the end of 500 cycles, the capacity decreased by 12.4% while the ultrasonic transmission ToF increased by 15.9%. Secondly, we explained the correlation by constructing a mathematical model for calculating the transmission ToF through the cell, in which the wave velocity in electrodes was obtained by simulating the fluid-solid interaction on a micro-scale and wave propagation in the fluid-solid system with 3-D FEM. The model also agrees with Biot theory in terms of the velocity in the separator. With the wave propagation model, we found that the ToF is largely affected by the binder stiffness reduction due to cycling, compared with the SEI growth, lithium plating, LAM, and gas bubbles/regions. It implies that the ultrasound ToF feature is suitable for cycling history prediction rather than predicting capacity retention. An additional model that correlates cycling history with capacity retention is needed to predict capacity retention with ToF.
Further experimental confirmations are required in the future to make the conclusion more credible. Firstly, mechanical testing on the pristine and degraded electrodes is needed to verify the assumption made in this paper, that is, the binder stiffness suffers a 75% reduction. Also, we may perform ultrasonic monitoring on a cell during its SEI formation cycles to verify the effect of SEI and gas generations because a large amount of SEI and gas will be generated. This experiment will be conducted on lab-made cells because the commercialized cells have already experienced formation cycles.
Acknowledgement
This research is supported by MOE AcRF Tier 1, RG69/22 and A*STAR (project no. C210812038).
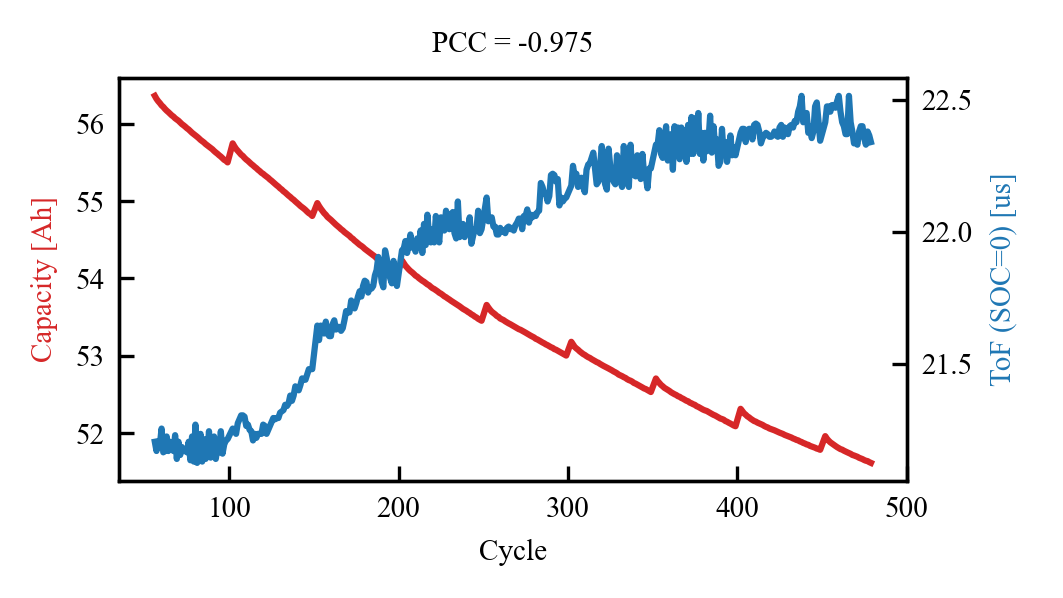
Appendix A Experimental results on another cell
Another cell with the same type was also cycled at a 3 C-rate. It also experienced resting stages every 50 cycles. The capacity retention and ToF at SOC=0 over cycles are shown in Figure 9. The capacity experienced an 8.5% decrease from 56.4 Ah to 51.6 Ah while the ToF experienced a 5.7% increase from 21.2 s to 22.4 s. This result is similar to the one shown in Figure 5.
Appendix B The effect of microstructure in the FEM model
The microstructure we adopted is with a 10 m particle size and each particle connects with six adjacent particles, i.e., a simple cubic structure. Here, we varied either the particle size or structure to investigate the effect of microstructure on the ultrasound speed.
At first, a body-centred structure was evaluated for both electrodes. As shown in Figure 10, the particles are with a sphere geometry and each particle connects with eight adjacent particles. The number of connections is larger than the one with a simple cubic structure, which leads to a larger stiffness of the electrodes. The larger stiffness can be reflected in the ToF calculation results listed in Table 7, which show that the ultrasound speeds in both electrodes are slightly larger than the ones with a simple cubic structure.
Moreover, as LFP particles typically have a representative size of 3 m, we modelled the cathode with this particle size and found that ToF had little change. Overall, the microstructure should have little effect on the ultrasound ToF.
| Microstructure | Fresh anode | Aged anode | Fresh cathode | Aged cathode |
| 10 um particle size & Simple cubic structure | 1154.8 | 960.3 | 1145.5 | 966.0 |
| 10 um particle size & Body-centered cubic structure | 1172.9 (+1.5%) | 991.2 (+3.2%) | 1185.5 (+3.5%) | 951.3 (-1.5%) |
| 3 um particle size & Simple cubic structure | 1148.7 (+0.3%) | 985.5 (+2%) |
Appendix C Biot theory
The elementary volume for study in Biot theory is a macroscopic cubic and the displacements are the average of microscopic values. The material of the frame is regarded as an isotropic linear elastic solid on the macro-scale. The stress-train relations are
| (5) | |||||
| (6) |
where
| (7) | |||||
| (8) | |||||
| (9) |
is the porosity, is the Kronecker delta, is the stress applied on the solid matrix; , , , and are the distortion, dilation, bulk modulus, and shear modulus of the solid matrix, respectively; is the bulk modulus of the solid material; , , and are the fluid pressure, dilation, and bulk modulus, respectively.
For the separator, and are approximated by [12]
| (10) |
and
| (11) |
where is the shear modulus of the solid material.
Then, the equation of motion for longitudinal waves in the lossless case is
| (12) |
where
| (13) | |||||
| (14) | |||||
| (15) |
and is tortuosity to account for the microscopic inertial interactions between solid and fluid.
Assume plane wave solution and and are the wave amplitudes, Equation (12) becomes
| (16) | |||||
| (17) |
where is the phase velocity. The above equation has non-trivial solutions of if
| (18) |
The solution of this second-order equation in has two roots, corresponding to two longitudinal waves; the faster one is a wave for which the solid and the fluid move in phase, and another in which they are in counter-phase, a.k.a. Biot’s slow wave.
Appendix D The effect of gas bubbles on wave velocity
The phase velocity of acoustic waves in a bubbly liquid can be described by [63]
| (19) |
where is the velocity in the liquid, is the velocity in the bubbly liquid, is the number of bubbles per unit volume, is the radius of the bubbles, is the resonant angular frequency of the bubbles, is the angular frequency of the waves, and is the damping constant of the bubbles.
The and are given by the following equations:
| (20) |
and
| (21) |
where is the ambient pressure, is the density of the liquid, is the surface tension of the liquid, is the viscosity, and is described by
| (22) |
where , is the gas thermal diffusivity, and is the ratio of specific heats.
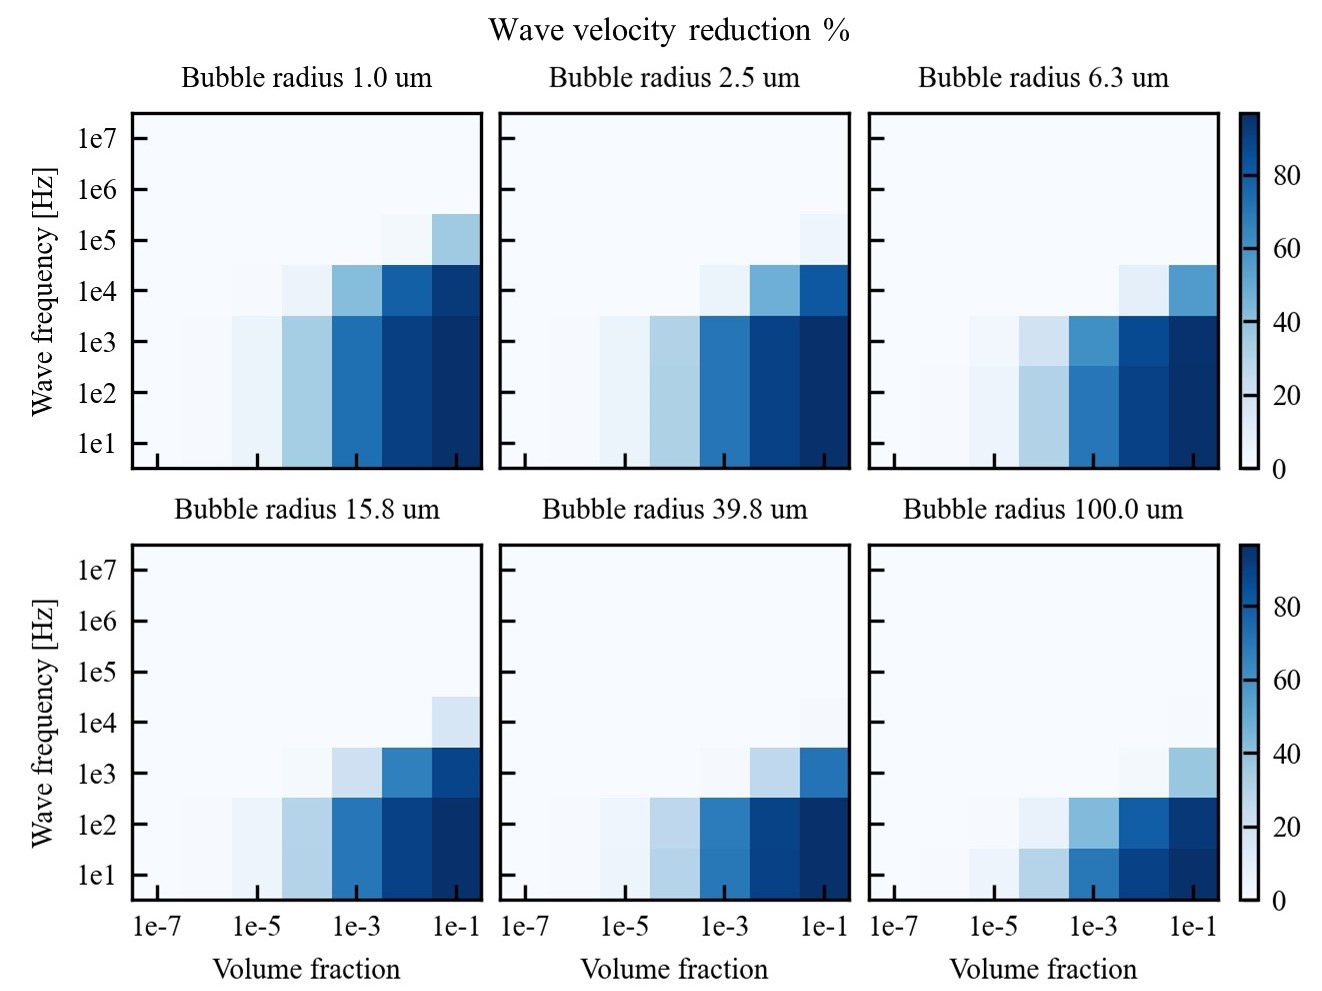
The phase velocity calculated by these equations is shown in Figure 11. The effect of bubbles on the phase velocity is a reducing effect.
From the results, we can conclude that smaller bubbles, larger volume fraction, and lower frequency lead to a larger decrease in the phase velocities. In the ultrasonic frequency range (larger than 100 kHz), there is no velocity-decrease effect unless the bubble radius is smaller than 2.5 um.
References
- [1] M. H. Lipu, M. Hannan, A. Hussain, M. Hoque, P. J. Ker, M. M. Saad, A. Ayob, A review of state of health and remaining useful life estimation methods for lithium-ion battery in electric vehicles: Challenges and recommendations, Journal of cleaner production 205 (2018) 115–133.
- [2] M. Berecibar, I. Gandiaga, I. Villarreal, N. Omar, J. Van Mierlo, P. Van den Bossche, Critical review of state of health estimation methods of li-ion batteries for real applications, Renewable and Sustainable Energy Reviews 56 (2016) 572–587.
- [3] M. Berecibar, M. Garmendia, I. Gandiaga, J. Crego, I. Villarreal, State of health estimation algorithm of lifepo4 battery packs based on differential voltage curves for battery management system application, Energy 103 (2016) 784–796.
- [4] J. Zhu, Y. Wang, Y. Huang, R. Bhushan Gopaluni, Y. Cao, M. Heere, M. J. Mühlbauer, L. Mereacre, H. Dai, X. Liu, et al., Data-driven capacity estimation of commercial lithium-ion batteries from voltage relaxation, Nature communications 13 (1) (2022) 1–10.
- [5] W. Huang, Y. Ye, H. Chen, R. A. Vilá, A. Xiang, H. Wang, F. Liu, Z. Yu, J. Xu, Z. Zhang, et al., Onboard early detection and mitigation of lithium plating in fast-charging batteries, Nature Communications 13 (1) (2022) 7091.
- [6] A. Hsieh, S. Bhadra, B. Hertzberg, P. Gjeltema, A. Goy, J. W. Fleischer, D. A. Steingart, Electrochemical-acoustic time of flight: in operando correlation of physical dynamics with battery charge and health, Energy & environmental science 8 (5) (2015) 1569–1577.
- [7] T. Hodson, S. Patil, D. A. Steingart, An initial exploration of coupled transient mechanical and electrochemical behaviors in lithium ion batteries, Journal of The Electrochemical Society 168 (7) (2021) 070515.
- [8] H. Sun, N. Muralidharan, R. Amin, V. Rathod, P. Ramuhalli, I. Belharouak, Ultrasonic nondestructive diagnosis of lithium-ion batteries with multiple frequencies, Journal of Power Sources 549 (2022) 232091.
- [9] K. Meng, X. Chen, W. Zhang, W. Chang, J. Xu, A robust ultrasonic characterization methodology for lithium-ion batteries on frequency-domain damping analysis, Journal of Power Sources 547 (2022) 232003.
- [10] Q. Ke, S. Jiang, W. Li, W. Lin, X. Li, H. Huang, Potential of ultrasonic time-of-flight and amplitude as the measurement for state of charge and physical changings of lithium-ion batteries, Journal of Power Sources 549 (2022) 232031.
- [11] Z. Huang, Y. Zhou, Z. Deng, K. Huang, M. Xu, Y. Shen, Y. Huang, Precise state-of-charge mapping via deep learning on ultrasonic transmission signals for lithium-ion batteries, ACS Applied Materials & Interfaces (2023).
- [12] M. Huang, N. Kirkaldy, Y. Zhao, Y. Patel, F. Cegla, B. Lan, Quantitative characterisation of the layered structure within lithium-ion batteries using ultrasonic resonance, Journal of Energy Storage 50 (2022) 104585.
- [13] Y. Zhang, H. Dong, T. Wang, G. He, I. P. Parkin, F. Cegla, Ultrasonic guided wave monitoring of dendrite formation at electrode–electrolyte interface in aqueous zinc ion batteries, Journal of Power Sources 542 (2022) 231730.
- [14] M. C. Appleberry, J. A. Kowalski, S. A. Africk, J. Mitchell, T. C. Ferree, V. Chang, V. Parekh, Z. Xu, Z. Ye, J. F. Whitacre, et al., Avoiding thermal runaway in lithium-ion batteries using ultrasound detection of early failure mechanisms, Journal of Power Sources 535 (2022) 231423.
- [15] G. Davies, K. W. Knehr, B. Van Tassell, T. Hodson, S. Biswas, A. G. Hsieh, D. A. Steingart, State of charge and state of health estimation using electrochemical acoustic time of flight analysis, Journal of The Electrochemical Society 164 (12) (2017) A2746.
- [16] P. Ladpli, F. Kopsaftopoulos, F.-K. Chang, Estimating state of charge and health of lithium-ion batteries with guided waves using built-in piezoelectric sensors/actuators, Journal of Power Sources 384 (2018) 342–354.
- [17] Y. Wu, Y. Wang, W. K. Yung, M. Pecht, Ultrasonic health monitoring of lithium-ion batteries, Electronics 8 (7) (2019) 751.
- [18] S. Bhanu, M. G. Pecht, M. D. Osterman, Systems, methods, and devices for health monitoring of an energy storage device, uS Patent 10,014,561 (Jul. 3 2018).
- [19] D. A. Steingart, G. Davies, S. Biswas, A. G. Hsieh, B. Van Tassell, T. Hodson, D. Shan, Determination of characteristics of electrochemical systems using acoustic signals, uS Patent 11,193,979 (Dec. 7 2021).
- [20] P. Ladpli, F.-K. Chang, Battery state monitoring using ultrasonic guided waves, uS Patent 11,527,783 (Dec. 13 2022).
- [21] Z. Deng, Z. Huang, Y. Shen, Y. Huang, H. Ding, A. Luscombe, M. Johnson, J. E. Harlow, R. Gauthier, J. R. Dahn, Ultrasonic scanning to observe wetting and “unwetting” in li-ion pouch cells, Joule 4 (9) (2020) 2017–2029.
- [22] J. Purewal, J. Wang, J. Graetz, S. Soukiazian, H. Tataria, M. W. Verbrugge, Degradation of lithium ion batteries employing graphite negatives and nickel–cobalt–manganese oxide+ spinel manganese oxide positives: Part 2, chemical–mechanical degradation model, Journal of power sources 272 (2014) 1154–1161.
- [23] J. Li, E. Murphy, J. Winnick, P. Kohl, Studies on the cycle life of commercial lithium ion batteries during rapid charge–discharge cycling, Journal of Power Sources 102 (1-2) (2001) 294–301.
- [24] Y. Zhang, C.-Y. Wang, X. Tang, Cycling degradation of an automotive lifepo4 lithium-ion battery, Journal of power sources 196 (3) (2011) 1513–1520.
- [25] M. B. Pinson, M. Z. Bazant, Theory of sei formation in rechargeable batteries: capacity fade, accelerated aging and lifetime prediction, Journal of the Electrochemical Society 160 (2) (2012) A243.
- [26] J.-H. Kim, S. C. Woo, M.-S. Park, K. J. Kim, T. Yim, J.-S. Kim, Y.-J. Kim, Capacity fading mechanism of lifepo4-based lithium secondary batteries for stationary energy storage, Journal of Power Sources 229 (2013) 190–197.
- [27] H. Zheng, L. Tan, L. Zhang, Q. Qu, Z. Wan, Y. Wang, M. Shen, H. Zheng, Correlation between lithium deposition on graphite electrode and the capacity loss for lifepo4/graphite cells, Electrochimica Acta 173 (2015) 323–330.
- [28] M. Rao, L. Zhang, L. Li, L. Rong, C. Ye, G. Zhou, H. Xu, Y. Qiu, Investigation of lithium content changes to understand the capacity fading mechanism in lifepo4/graphite battery, Journal of Electroanalytical Chemistry 853 (2019) 113544.
- [29] J. Liang, Y. Gan, M. Yao, Y. Li, Numerical analysis of capacity fading for a lifepo4 battery under different current rates and ambient temperatures, International Journal of Heat and Mass Transfer 165 (2021) 120615.
- [30] Y. Qi, H. Guo, L. G. Hector, A. Timmons, Threefold increase in the young’s modulus of graphite negative electrode during lithium intercalation, Journal of The Electrochemical Society 157 (5) (2010) A558.
- [31] J.-K. Park, Principles and applications of lithium secondary batteries, John Wiley & Sons, 2012.
- [32] D. Clerici, F. Mocera, A. Somà, Experimental characterization of lithium-ion cell strain using laser sensors, Energies 14 (19) (2021) 6281.
- [33] T. Maxisch, G. Ceder, Elastic properties of olivine li x fepo 4 from first principles, Physical Review B 73 (17) (2006) 174112.
- [34] H. Dai, C. Yu, X. Wei, Z. Sun, State of charge estimation for lithium-ion pouch batteries based on stress measurement, Energy 129 (2017) 16–27.
- [35] D. E. Demirocak, B. Bhushan, Probing the aging effects on nanomechanical properties of a lifepo4 cathode in a large format prismatic cell, Journal of Power Sources 280 (2015) 256–262.
- [36] W. Hwang, K. S. Han, Fatigue of composites—fatigue modulus concept and life prediction, Journal of Composite Materials 20 (2) (1986) 154–165.
- [37] E. K. Gamstedt, L. A. Berglund, T. Peijs, Fatigue mechanisms in unidirectional glass-fibre-reinforced polypropylene, Composites Science and Technology 59 (5) (1999) 759–768.
- [38] M. M. Thwe, K. Liao, Durability of bamboo-glass fiber reinforced polymer matrix hybrid composites, Composites science and technology 63 (3-4) (2003) 375–387.
- [39] G. M. Thornton, T. D. Schwab, T. R. Oxland, Fatigue is more damaging than creep in ligament revealed by modulus reduction and residual strength, Annals of Biomedical Engineering 35 (10) (2007) 1713–1721.
- [40] F. M. Lambers, A. R. Bouman, C. M. Rimnac, C. J. Hernandez, Microdamage caused by fatigue loading in human cancellous bone: relationship to reductions in bone biomechanical performance, PLoS One 8 (12) (2013) e83662.
- [41] Z. Jiang, J. Li, Y. Yang, L. Mu, C. Wei, X. Yu, P. Pianetta, K. Zhao, P. Cloetens, F. Lin, et al., Machine-learning-revealed statistics of the particle-carbon/binder detachment in lithium-ion battery cathodes, Nature communications 11 (1) (2020) 1–9.
- [42] B. Michalak, H. Sommer, D. Mannes, A. Kaestner, T. Brezesinski, J. Janek, Gas evolution in operating lithium-ion batteries studied in situ by neutron imaging, Scientific reports 5 (1) (2015) 1–9.
- [43] Z. Li, N. Yao, L. Yu, Y.-X. Yao, C.-B. Jin, Y. Yang, Y. Xiao, X.-Y. Yue, W.-L. Cai, L. Xu, et al., Inhibiting gas generation to achieve ultralong-lifespan lithium-ion batteries at low temperatures, Matter (2023).
- [44] M. Y. Corapcioglu, Wave propagation in porous media—a review, Transport processes in porous media (1991) 373–469.
- [45] D. Smeulders, M. Van Dongen, Wave propagation in porous media containing a dilute gas–liquid mixture: theory and experiments, Journal of Fluid mechanics 343 (1997) 351–373.
- [46] J. M. J. M. Carcione, Wave fields in real media: Wave propagation in anisotropic, anelastic, porous and electromagnetic media, Elsevier, 2007.
- [47] E. Bossy, Q. Grimal, Numerical methods for ultrasonic bone characterization, Bone quantitative ultrasound (2011) 181–228.
- [48] B. Vafaeian, M. El-Rich, T. El-Bialy, S. Adeeb, The finite element method for micro-scale modeling of ultrasound propagation in cancellous bone, Ultrasonics 54 (6) (2014) 1663–1676.
- [49] R. van Vossen, J. O. Robertsson, C. H. Chapman, Finite-difference modeling of wave propagation in a fluid-solid configurationfd modeling of a fluid-solid interface, Geophysics 67 (2) (2002) 618–624.
- [50] B. E. Olivares, M. A. C. Munoz, M. E. Orchard, J. F. Silva, Particle-filtering-based prognosis framework for energy storage devices with a statistical characterization of state-of-health regeneration phenomena, IEEE Transactions on Instrumentation and Measurement 62 (2) (2012) 364–376.
- [51] T. Qin, S. Zeng, J. Guo, Z. Skaf, A rest time-based prognostic framework for state of health estimation of lithium-ion batteries with regeneration phenomena, Energies 9 (11) (2016) 896.
- [52] I. Cohen, Y. Huang, J. Chen, J. Benesty, J. Benesty, J. Chen, Y. Huang, I. Cohen, Pearson correlation coefficient, Noise reduction in speech processing (2009) 1–4.
- [53] L. Gold, T. Bach, W. Virsik, A. Schmitt, J. Müller, T. E. Staab, G. Sextl, Probing lithium-ion batteries’ state-of-charge using ultrasonic transmission–concept and laboratory testing, Journal of Power Sources 343 (2017) 536–544.
- [54] J. E. Santos, P. M. Gauzellino, J. E. Santos, P. M. Gauzellino, Waves in poroelastic solid saturated by a single-phase fluid, Numerical Simulation in Applied Geophysics (2016) 1–31.
- [55] A. M. Grillet, T. Humplik, E. K. Stirrup, S. A. Roberts, D. A. Barringer, C. M. Snyder, M. R. Janvrin, C. A. Apblett, Conductivity degradation of polyvinylidene fluoride composite binder during cycling: Measurements and simulations for lithium-ion batteries, Journal of The Electrochemical Society 163 (9) (2016) A1859.
- [56] H. Hu, B. Tao, Y. He, S. Zhou, Effect of conductive carbon black on mechanical properties of aqueous polymer binders for secondary battery electrode, Polymers 11 (9) (2019) 1500.
- [57] G. Y. Gor, J. Cannarella, J. H. Prévost, C. B. Arnold, A model for the behavior of battery separators in compression at different strain/charge rates, Journal of the Electrochemical Society 161 (11) (2014) F3065.
- [58] O. Borodin, G. D. Smith, P. Fan, Molecular dynamics simulations of lithium alkyl carbonates, The Journal of Physical Chemistry B 110 (45) (2006) 22773–22779.
- [59] S. K. Heiskanen, J. Kim, B. L. Lucht, Generation and evolution of the solid electrolyte interphase of lithium-ion batteries, Joule 3 (10) (2019) 2322–2333.
- [60] H. You, B. Jiang, J. Zhu, X. Wang, G. Shi, G. Han, X. Wei, H. Dai, In-situ quantitative detection of irreversible lithium plating within full-lifespan of lithium-ion batteries, Journal of Power Sources 564 (2023) 232892.
- [61] A. L. Klibanov, Microbubble contrast agents: targeted ultrasound imaging and ultrasound-assisted drug-delivery applications, Investigative radiology 41 (3) (2006) 354–362.
- [62] K. H. Martin, P. A. Dayton, Current status and prospects for microbubbles in ultrasound theranostics, Wiley Interdisciplinary Reviews: Nanomedicine and Nanobiotechnology 5 (4) (2013) 329–345.
- [63] K. W. Commander, A. Prosperetti, Linear pressure waves in bubbly liquids: Comparison between theory and experiments, The Journal of the Acoustical Society of America 85 (2) (1989) 732–746.