drobniak@ijclab.in2p3.fr, cassou@ijclab.in2p3.fr
Two-chamber gas target for laser-plasma accelerator electron source
Abstract
Exploring new target schemes for laser wakefield accelerators is essential to meet the challenge of increasing repetition rates while ensuring stability and quality of the produced electron beams. The prototyping of a two-chamber gas cell integrated into the beam line and operating in continuous gas flow is introduced and discussed in the frame of ionisation injection. We report the numerical fluid modeling used to assist the density profile shaping. We describe the test bench used for cell prototype assessment, in particular the plasma electron density and longitudinal distribution of species relevant for ionisation injection. The lifetime of the target key part is measured for different materials. Perspectives to high power operation are outlined.
keywords:
Suggested keywords1 Introduction
Laser wakefield acceleration (LWFA) is a promising high-gradient accelerator technology, and the interest of the accelerator community is growing due to its compactness 1, 2, 3. Significant progress has been made in the optimisation of laser-plasma electron source (so-called ’target’) achieving GeV-level4, but also controlled high charge beams, and optimisation of spectral brightness 5, 6. Long operation runs at various repetition rates is also a key issue 7, 8. All these improvements are possible only with advanced control of both laser and plasma target. In the under-dense plasmas used in plasma wakefield accelerators, the gas typically takes the form of supersonic jets, gas cells, capillary discharge waveguides 9 or plasma ovens 10. Depending on repetition rate and integration constraints, targets are operated in pulsed or continuous gas flow mode. A deep understanding and control of the target density profile, species distribution and gas flow is essential to ensure high-quality and reproducible electron beam production.
A high compactness approach using a two-chamber target directly integrated into the beamline is developed. Section 2 presents a review of existing laser-driven accelerator targets. Section 3 introduces the prototype mechanical design with fluid simulations, together with predicted density profiles. Section 4 describes the test bench used for target prototype experimental characterisation. Eventually section 5 concludes with the qualification of the fluid simulation model, and prototype lifetime consideration.
2 Targets for laser-driven plasma accelerator
As reviewed by I. Prencipe et al.11 and J. Garland et al.12, several plasma target designs have been investigated in the last two decades: mainly gas jets, gas cells and capillary discharges. In all designs tried, the challenge is to tune the plasma composition and longitudinal density profile. For the particular case of laser-driven electron injectors, the target is composed by a first stage where injection occurs, a second stage for acceleration and a third with controlled density ramp to limit emittance growth13. The various approaches are summarised in Tab.1.
Gas jets are the most commonly used and often based on a single jet technique using either the principle of self-injection 14, optical injection (with colliding pulses 15), ionisation injection 16, 17, or down-ramp injection 18, 19, 20, 21 triggered by a shock using a blade 18, 20 or a wire 21 or by shaping the plasma with a transverse beam 19. Other schemes have been proposed using two jets, the first jet being the injector, the second one the accelerating stage. For the injection, the techniques tried were down-ramp 22 or ionisation 23 injection. The main advantage of gas jets is the easy alignment with the laser and the wide solid angle for diagnostics. Pulsed operation is advised to avoid too much gas leaks, leading to pumping system overload and pollution. At high operation rate (typically kHz), gas jet high density tends to induce high thermal and mechanical loads, resulting in wearing of mechanical parts, vibrations and shot-to-shot instability 12, 24, 25. Typical electron densities offered by gas jets lie in the range of cm-3.
| target type | density range [cm-3] | distribution species | lifetime [shots] | repetition rate [Hz] |
|---|---|---|---|---|
| jet | mixed | |||
| cells | mixed, localised | |||
| channels | mixed, localised | |||
| capillary discharge | mixed, localised |
Gas cells are divided into two categories. The first one is a tank 26, 27 or several tanks 28, 29, filled with gas in steady state flow or pulsed mode. Apertures allow the laser to pass through, and keeping them as small as possible is critical to prevent leaks. The second category is gas channels 30, 5, 6, 31, where gas is injected by various transverse inlets into a main longitudinal channel with reduced cross section. In most cases, the first transverse inlet is for electron injection, the other ones for electron acceleration. Gas exhaust occurs at the main channel entrance/exit and may additionally go through a specific transverse aspiration outlet.
Whether using a tank or channel geometry, gas cells are particularly interesting for an ionisation injection regime, where a fraction of high-Z gas (called dopant) is added into a background gas. Various techniques have been developed to avoid continuous ionisation injection using a downward focusing in gas jet or gas cell or a sharp confinement of the dopant28 allowing to reduce the accelerated beam energy spread and control beam-loading 6.
Whereas gas jets require quite high backing pressures (in the range of several bars), gas cells are less demanding in terms of gas consumption and pressure gradient in the gas circuit. Depending on the vacuum integration (differential pumping), they can be operated in pulsed or continuous gas-injection mode, which yields a better shot-to-shot stability 12. On balance, the main drawback of gas cells are: (1) lifetime, since laser may enlarge cell apertures, (2) reduced solid angle for diagnostics, since their material may diffuse light, or potentially be coated by plasma pollution.
The design investigated here is a gas cell divided in two separate chambers, delimited by transparent optical quality plane surfaces, specifically suited for transverse optical diagnostics. It is inspired by the pioneer work done by Kononenko 29, in a more compact approach and focusing on the dopant mitigation in the first zone, with pure background gas in the second zone.
3 Target multi-cell design
The motivation of this work is: (1) a compact integration directly into the accelerator beam line, (2) a large range online tunability of dopant concentration and gas density profiles, (3) together with their online transverse optical diagnostics, (4) an easy replacement of critical elements which are strongly irradiated by the laser, especially at high repetition rate.
3.1 Design and features
The prototype design is presented in Fig. 1 and Fig. 2. It consists in a main body and two nozzles defining two separate chambers (called chamber 1 and 2 along laser propagation direction), each supplied with gas through an injection hose: helium doped with nitrogen (/) for the chamber 1 and pure helium () chamber 2. They are separated by a wall, with a small central aperture ranging from to mm in diameter. The laser enters chamber 1 through the inlet nozzle, passes through the central aperture and exits chamber 2 by the outlet nozzle.
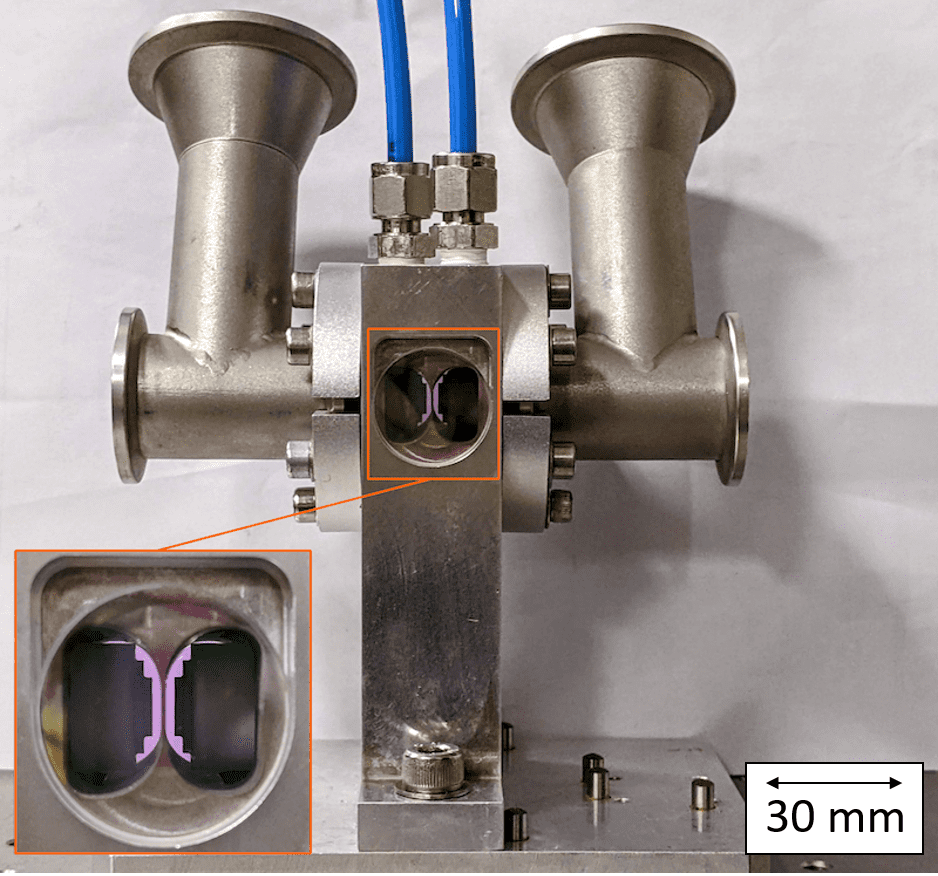
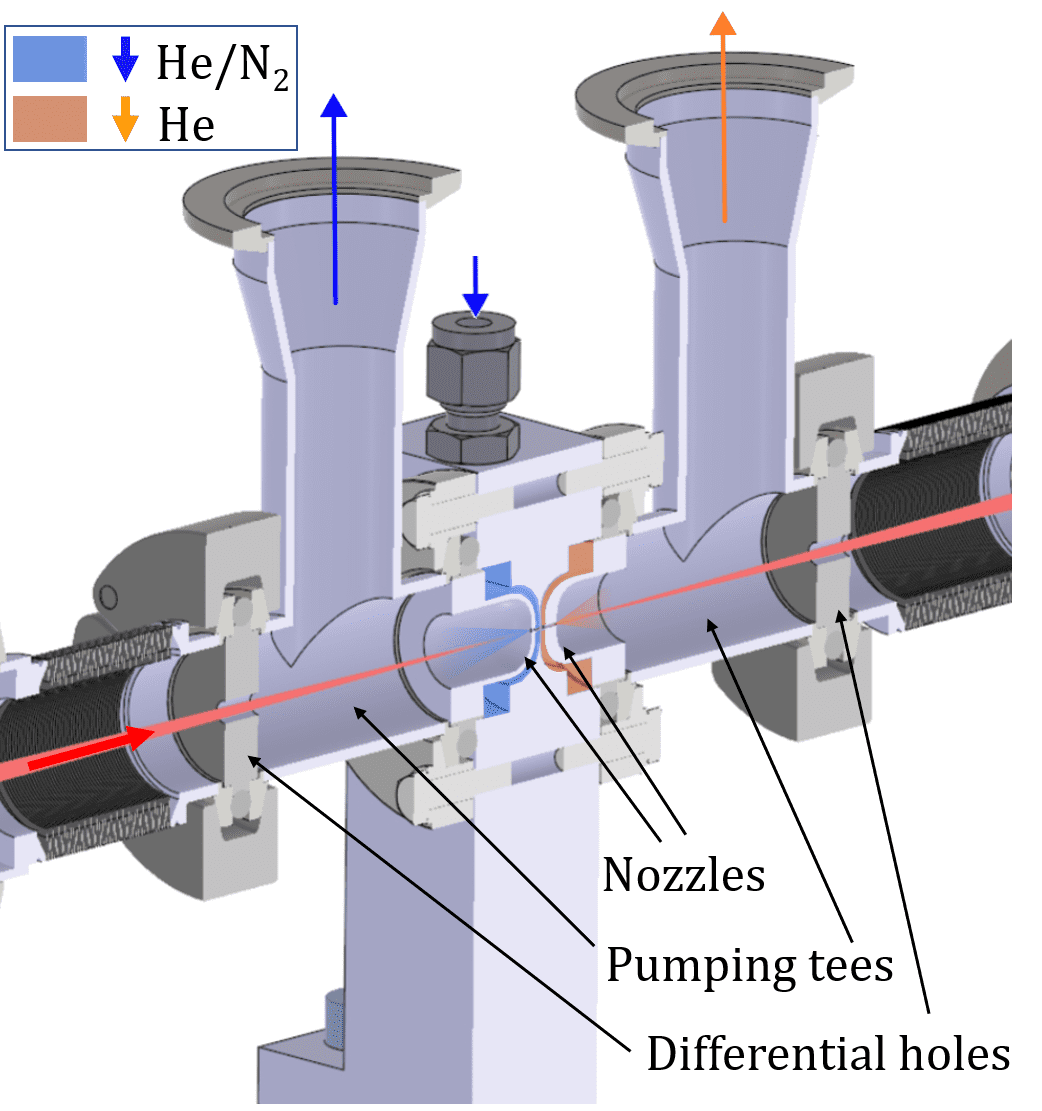
Nozzles are necessary to reduce the leak in the vacuum chamber. Their inner dimensions (radius, thickness) allow an additional tuning of the gas density in- and out-ramp shape. The central separation serves as frontier between the target chambers. Some gas flow between chambers may appear and is governed by the pressure difference and conductance of the central aperture.
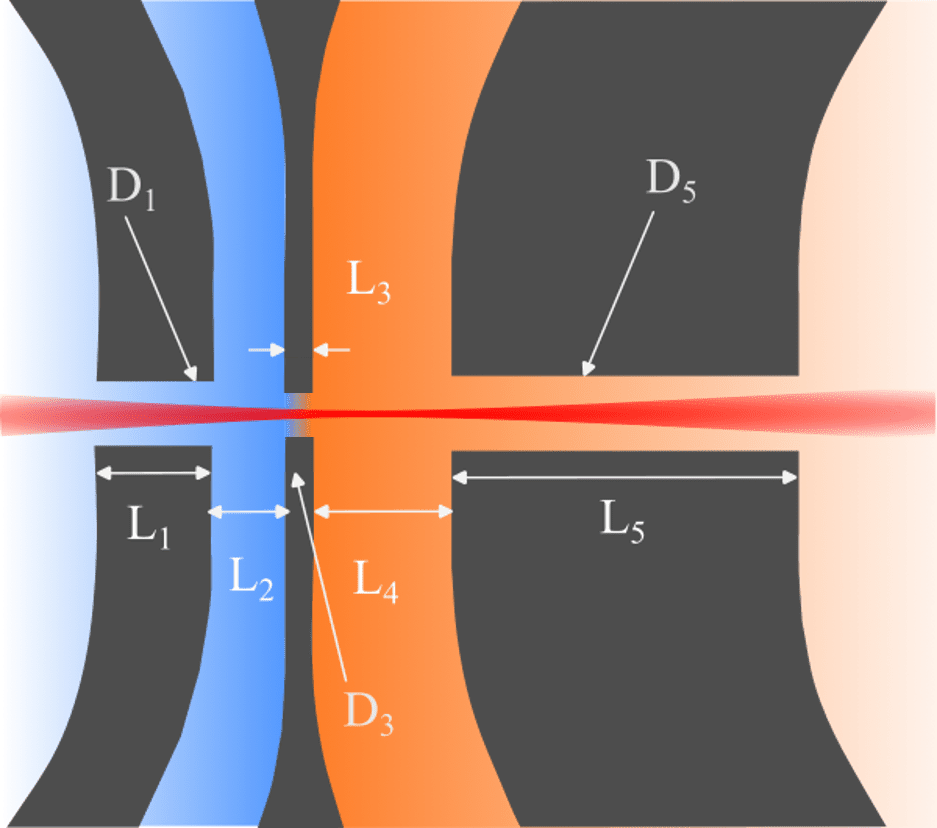
Dimensions of the cell close to the axis are described in Fig. 3 and given in Tab. 2. Many combinations have been considered, and a typical configuration is given in Tab. 2. Varying the nozzle total length gives an adjustment of chamber 1 and 2 longitudinal dimensions called and (see Fig. 3). The tank volume of each chamber is cm3.
Primary vacuum (sub-mbar) is ensured close to the nozzle exit by a pumping system connected with T-pipes (Fig. 2). Secondary vacuum is obtained further from the cell after a differential hole, both downstream and upstream, which produces a two-decade pressure drop.
The main body has been manufactured using wire electro-discharge machining in aluminium block, while nozzles are either made of aluminium or MACOR ceramics. The centering mechanical tolerance (m center to center) was achieved for the nozzles using numerical milling machining.
In addition to its mechanical features, the design allows to perform transverse optical diagnostics across chamber 1 and 2. The diagnostics can be placed in air thanks to optical windows, that are the direct frontier between chambers and experimental room. Such a feature is particularly interesting for convenient experimental measurements of gas and plasma characteristics. Compared to channel type gas cells the optical transverse diagnostics are eased even if the central separation wall introduces shadowing in the imaging of the two chambers for 2D spectroscopic light collection. The transverse distance from the center (interaction region) and the optical windows is cm avoiding a rapid darkening due to pollution by the laser.
3.2 Fluid simulation set-up
The gas density distribution is modelled using the open-source fluid simulation code OpenFOAM 32. Typical simulation cases from this article are online and open to the scientific community 33. Depending on the desired problematic, the solver used is either:
-
•
rhoPimpleFoam 34: for transient compressible single species simulation,
-
•
interMixingFoam 35: for transient incompressible miscible fluids,
No solver modeling miscibility for compressible flows were found in the OpenFOAM library, therefore two simulation steps were necessary.
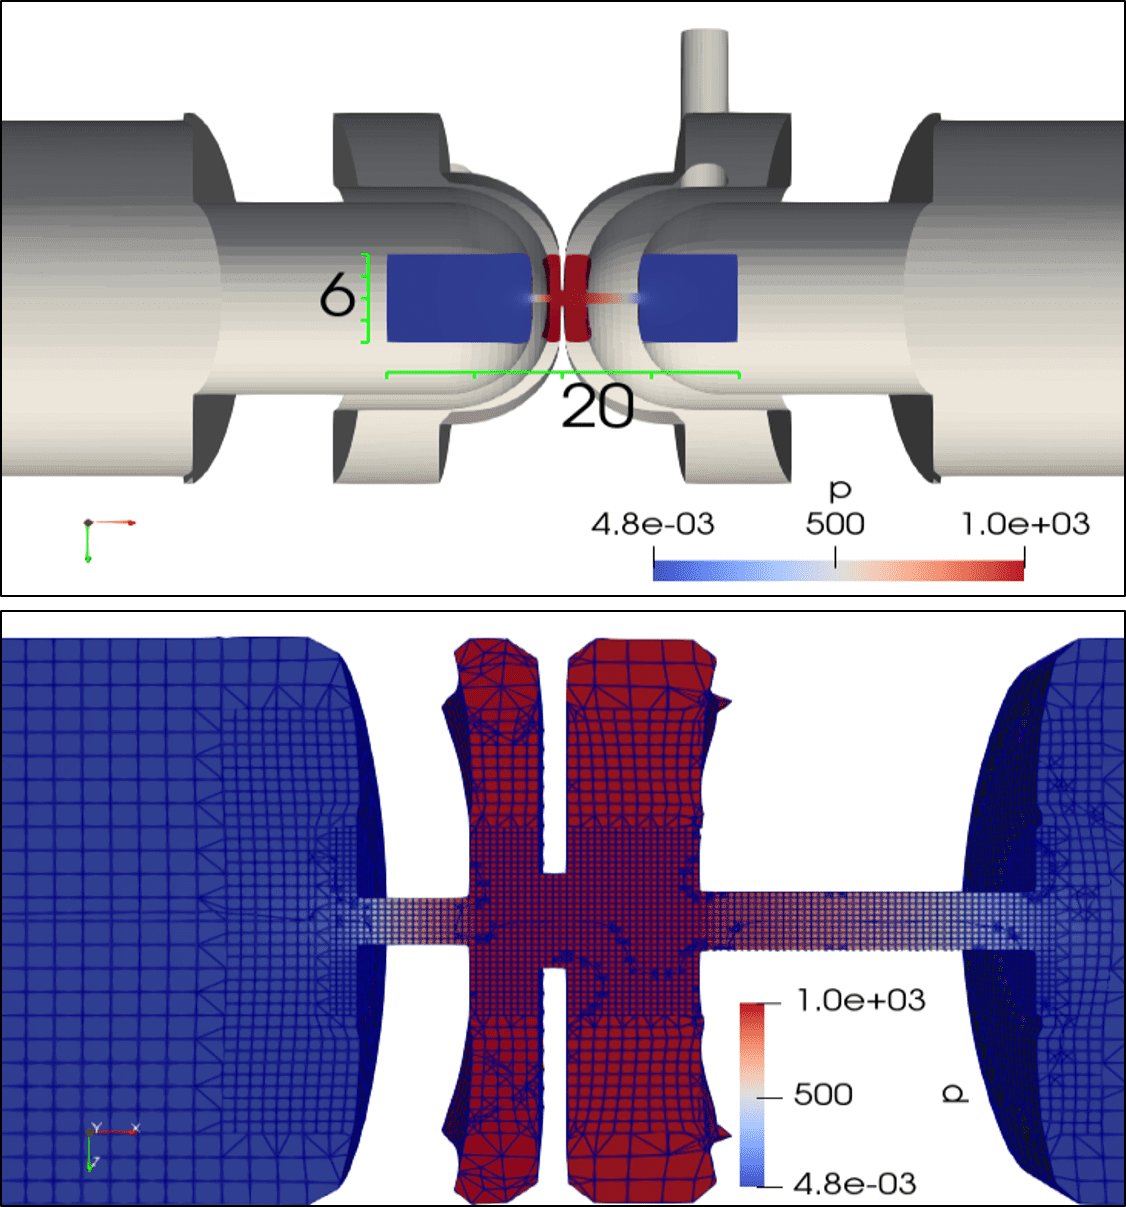
The geometry is designed with a CAD software and automatic meshing is performed using the routine snappyHexMesh 36. A 3D geometry applied to a reduced volume is used for simulations, as presented in Fig. 4, in order to limit the total number of cells to an average of and thus limit the computation time.
Boundary conditions are: fixed pressure at the inlets, constant volumetric flow at the outlets (estimated from the pump characteristics).
Simulations are run on a computer single-cpu and the average simulation time is roughly h for the reduced volume case.
3.3 Simulation of the density profiles for single species
First simulations are run for pure with rhoPimpleFoam. The resulting steady-state is obtained from an initial empty cell a few hundreds of s after valve opening. The longitudinal density profiles obtained for cell dimensions = at several operating pressures are presented in Fig. 5.
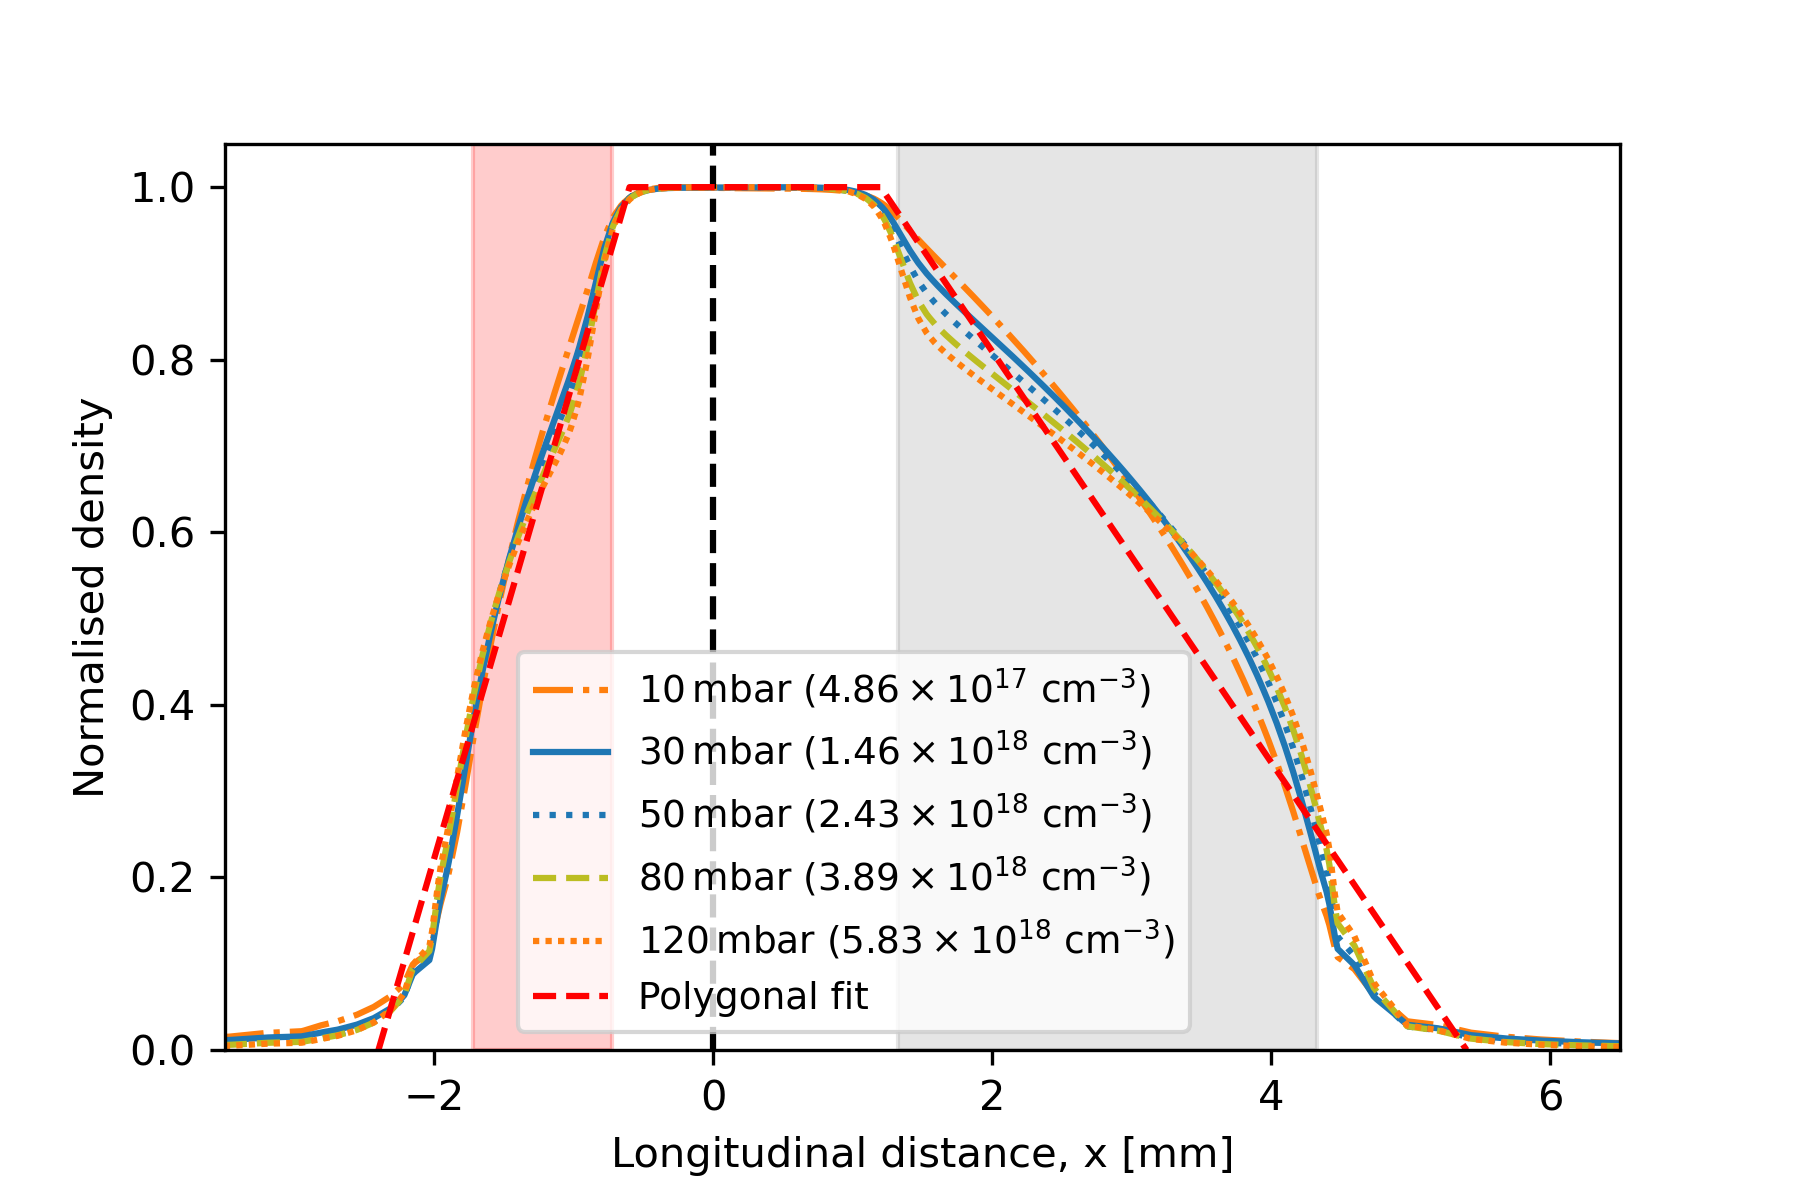
Injection pressures for chamber 1 () and chamber 2 () satisfy , in order to have a flat plateau between both chambers. This feature prevents convection and is further discussed below in the gas mixture simulation. Note that is voluntarily taken as mm to model a mm realistic damaged central aperture, but simulation results are similar.
Within the mbar pressure range, the longitudinal profile shape is conserved, with slight compression effects, mostly at the outlet nozzle entrance. With cylindrical nozzles, the up- and down-ramp shape is pretty linear. The overall pressure profile can thus easily be approximated with scalable linear functions, that can be tabulated over a wide range of pressure to serve as input for optimisation with laser-plasma PIC simulation (see polygonal fit in Fig. 5). Also note that the pressure upstream the inlet nozzle quickly decreases below the mbar range for all configurations, limiting undesired laser-plasma interaction before the cell.
The transverse density profile is depicted in Fig. 6, where three planes along the laser propagation axis are selected: inlet nozzle entrance (), chamber 2 center (), outlet nozzle center (). Both chamber pressure is set to mbar and the geometry is the same as for Fig. 5.

Fig. 6 shows a constant transverse density, whether for a m (PALLAS project37) or a m (test bench) laser waist at the interface between the two chambers.
The influence of inlet nozzle geometry is presented in Fig. 7, where the reference profile is kept and compared with other diameter or length.
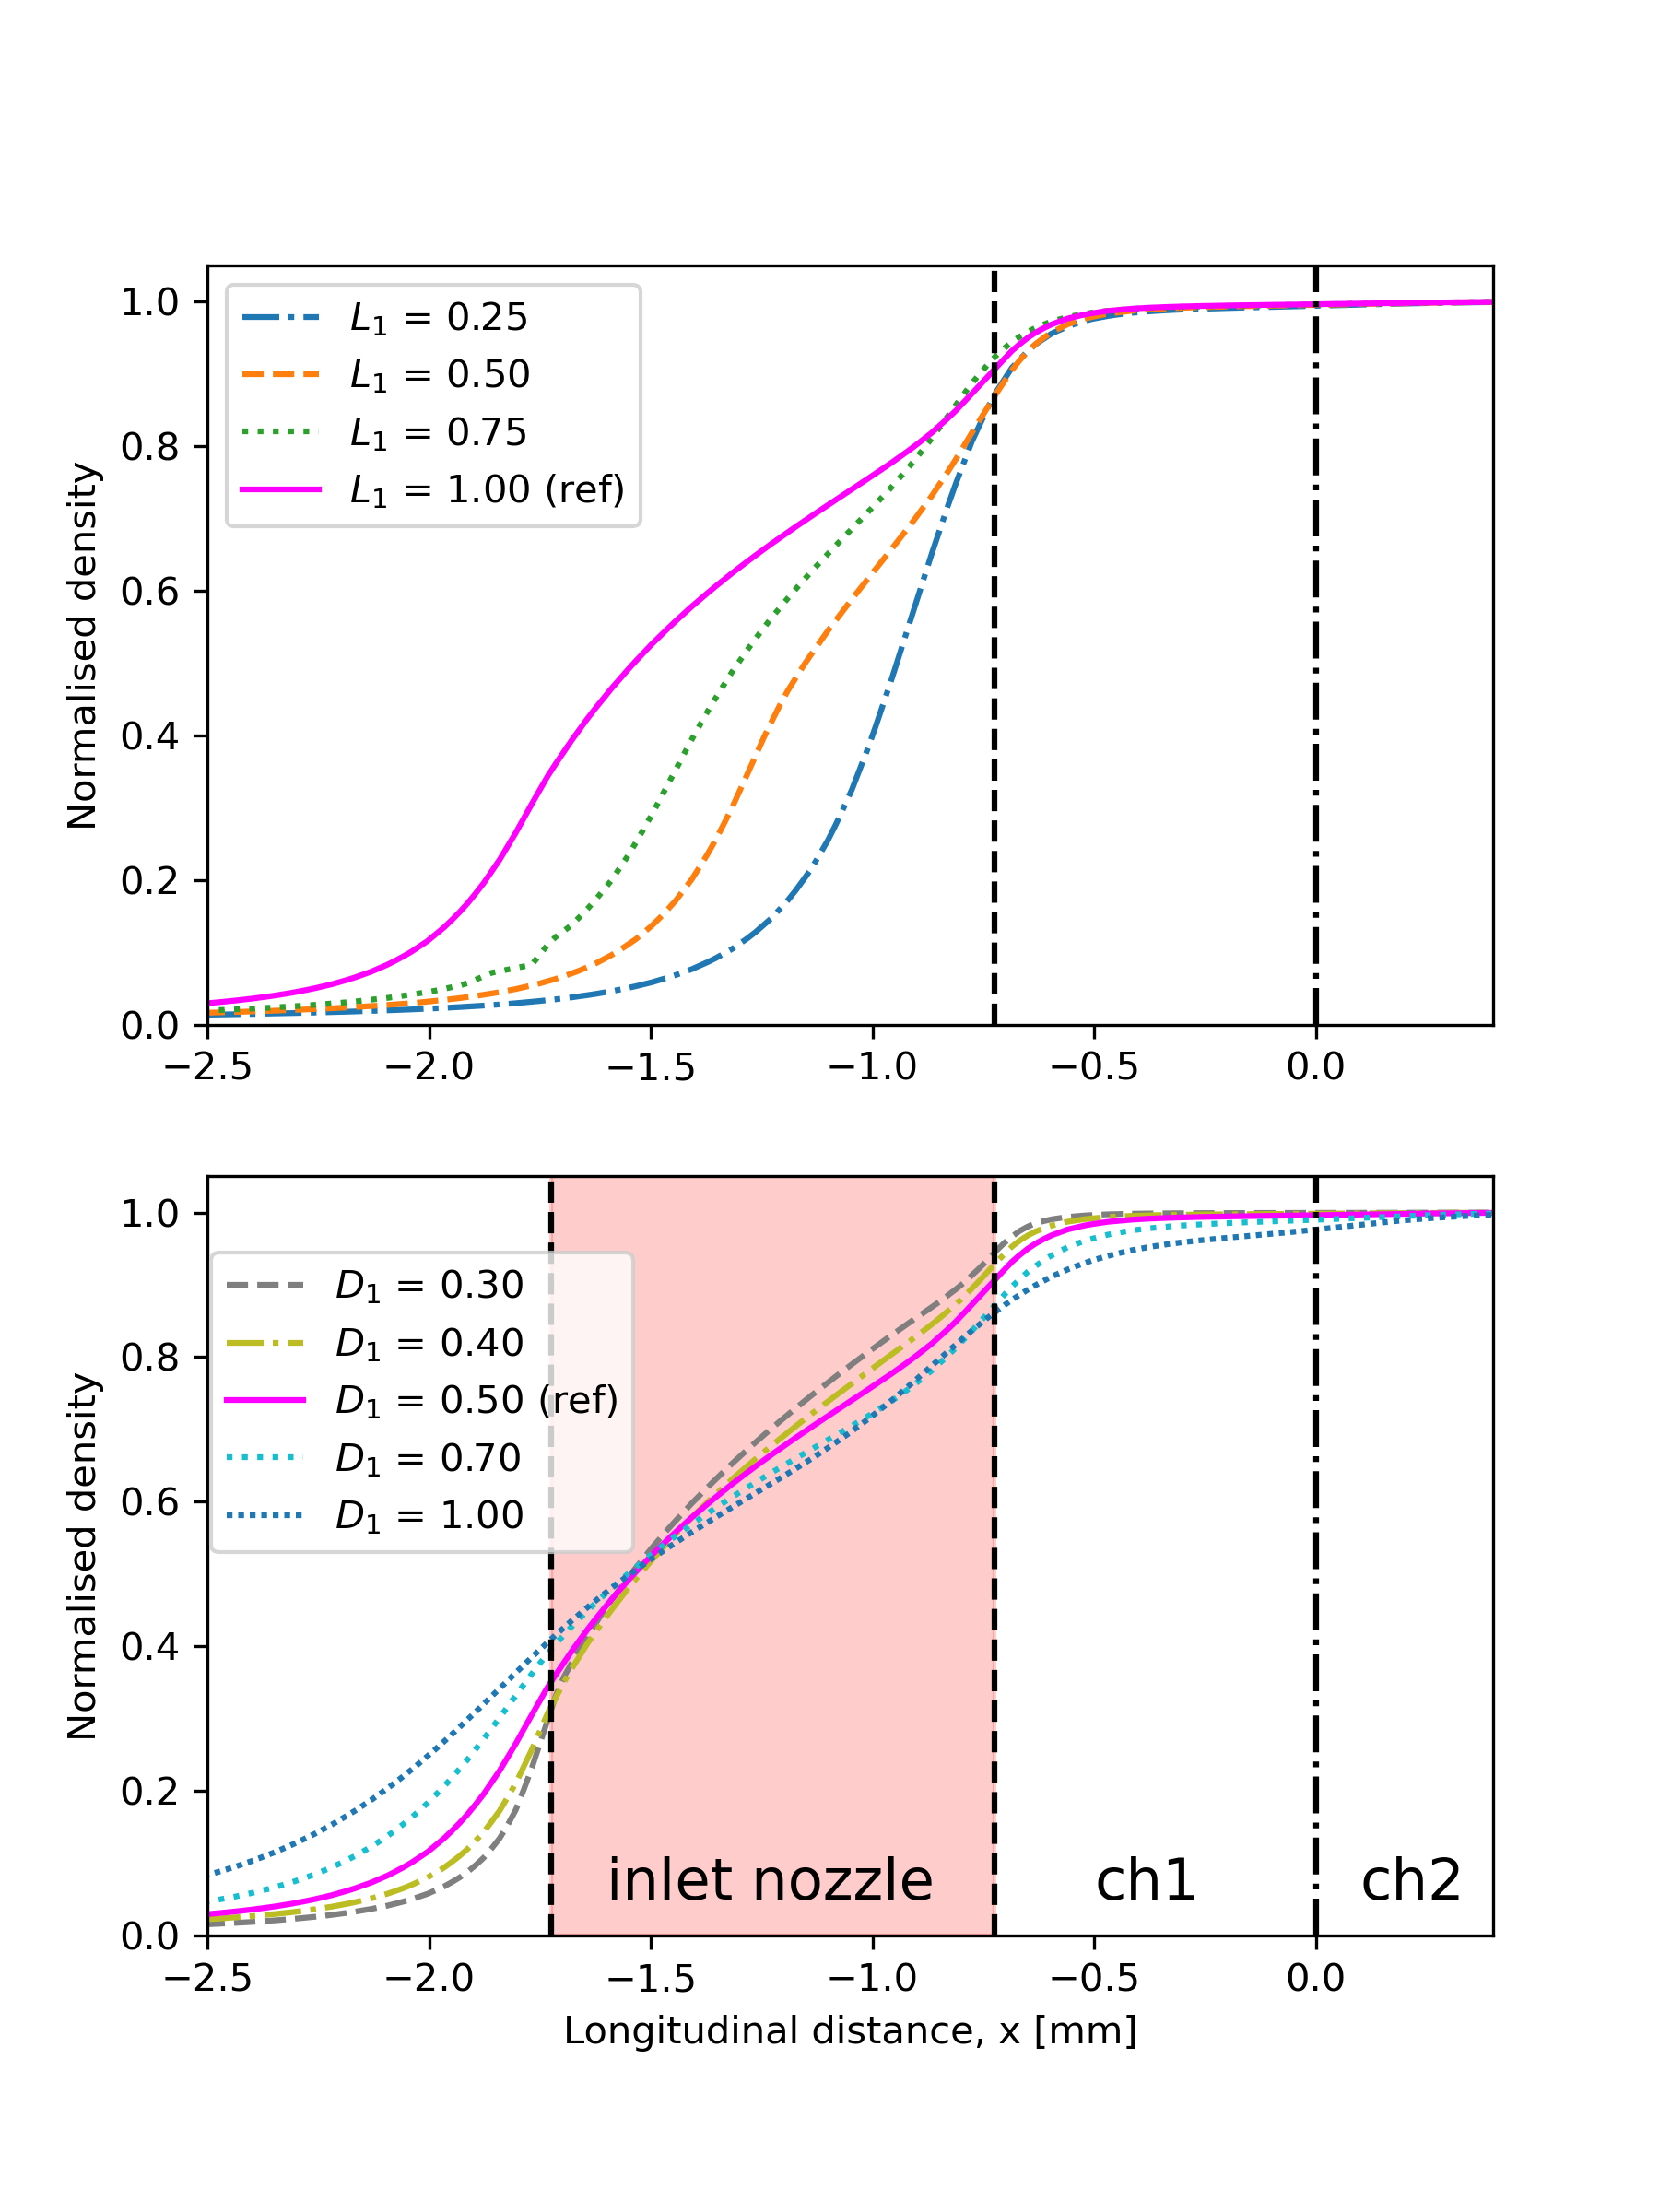
The longitudinal extent of the up-ramp scales linearly with but does not depend on . Increasing the diameter leads to higher upstream tee pressure that reaches the mbar range for mm, but also degrades the flatness of the plateau in chamber 1. Ideally, the shortest and thinnest nozzle as possible is desired. We choose mm and mm for machining and robustness reasons. must obviously also be larger than a few laser waists.
The influence of outlet nozzle dimensions at mbar is presented in Fig. 8, where the length is varied between mm at fixed mm and the diameter between mm at fixed length mm. The same reference case as for the inlet nozzle study is included for comparison.
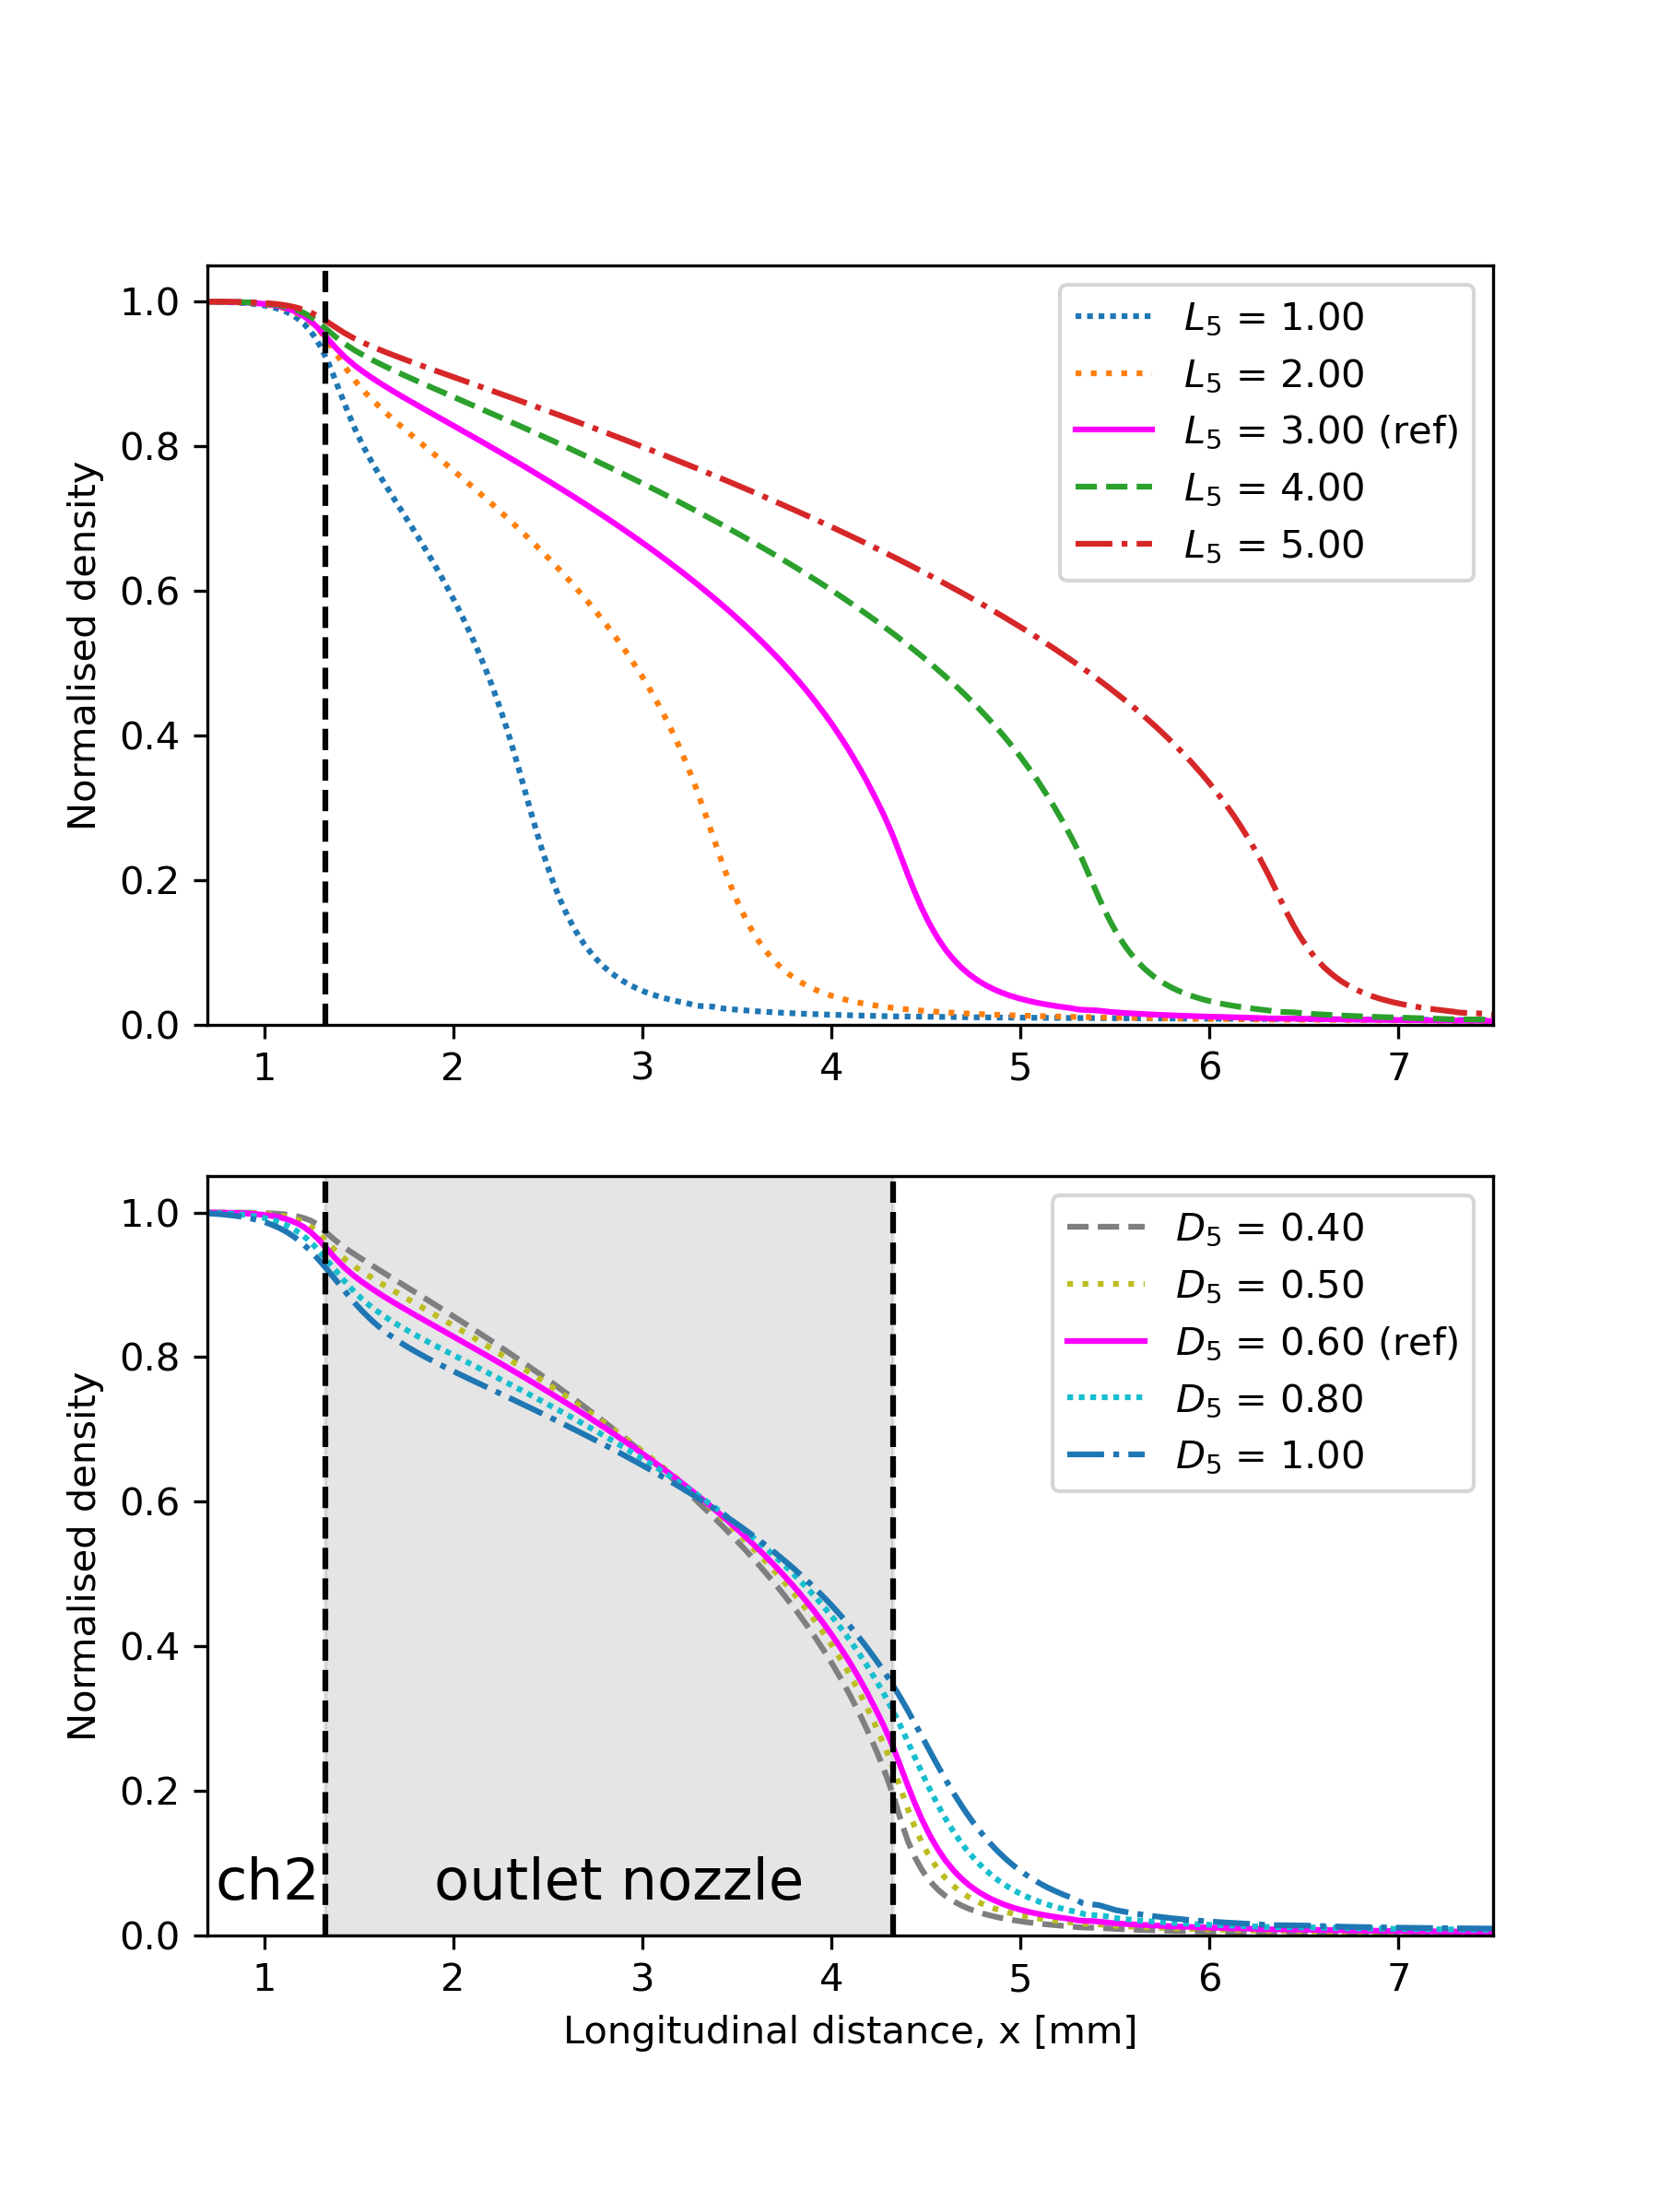
Similarly to the inlet nozzle, the ramp length linearly scales with nozzle length , with a preserved shape. Indeed, for each length tried (top graph in Fig. 8), the down-ramp follows the same pattern: a linear decrease along roughly followed by an exponential decrease of mm (gas expansion). The outlet diameter has the same influence as previously observed with .
Contrary to the inlet, the outlet profile has to be as smooth and long as possible for emittance preservation 38, which corresponds to large . Together with a small , this might be a problem due to laser divergence and possibly ablation. A compromise is made with mm and mm.
3.4 Simulation of dopant confinement
As introduced earlier, dopant confinement is a key process to ensure high quality beams with a small energy spread. Specific incompressible two-gas simulations are run with interMixingFoam to account for diffusion issues. They are performed in a reduced geometry with boundaries up to each nozzle center, where the flow can still be approximated as incompressible (). The new outlet boundary conditions are simply the pressure values extracted from previous compressible simulations at the new physical boarders.
Such an approximation is verified by simulating comparable cases, both in compressible (rhoPimpleFoam) and incompressible (interMixingFoam) mode with only 111Results are still valid when adding a few % in chamber 1, since the gas characteristics remain comparable, especially in low kinematic areas, such as the chambers interface.. Results for cell pressures within mbar are presented in Fig. 9, where the difference for the pressure between compressible and incompressible models [%] is added.
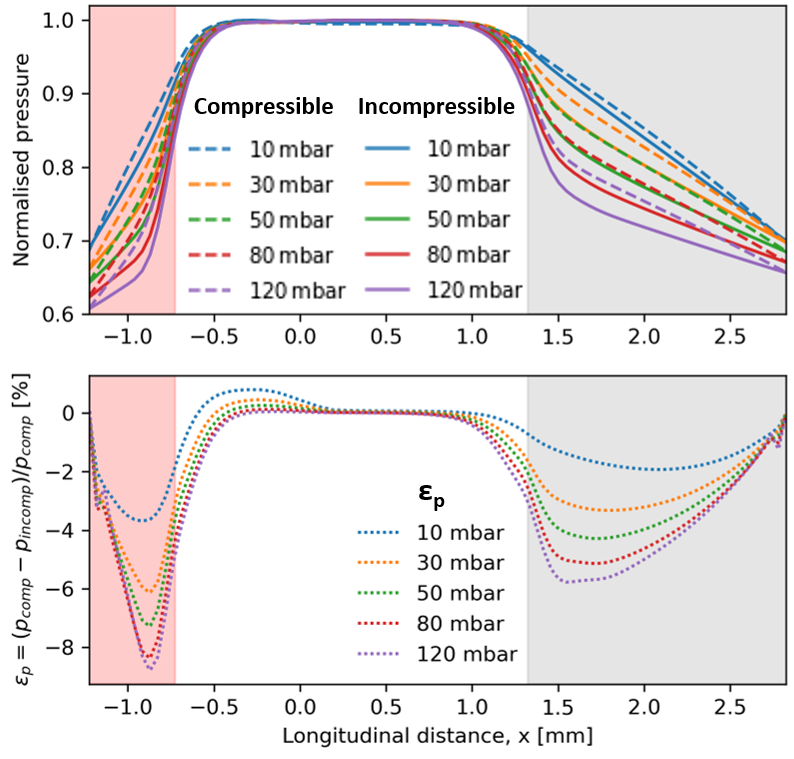
From Fig. 9, a good agreement appears between compressible and incompressible simulations, with a maximum % deviation close to the nozzles, and almost no difference in the chambers, which is the zone where dopant mitigation should occur. The same kind of study was done for temperature and velocity profiles with the same conclusion at the diffusion interface, and a significant divergence close to the nozzles. Incompressible simulations thus correctly match compressible ones 222The reader might note that all plateaus actually have gradients. This particular shape is explained by the difficult and time-consuming search for a perfect match on axis () using approximate boundary conditions..
The dopant confinement study is then performed with two gases in interMixingFoam to evaluate the effect of pressure difference between chamber 1 and 2 (convection) or statistical mixing of the two gases at equal pressure (diffusion). The result is shown in Fig. 10 for a test at mbar, with injected in chamber 1 at dopant concentration and pure in chamber 2.

For a negative/positive gradient mbar, the dopant is pushed to the right/left through convection (visible on the flow velocity in Fig. 10). mbar causes leaks towards chamber 2 and never reaches in chamber 2 (no dopant confinement). mbar triggers the opposite effect, with leaking into chamber 1. This case however offers in chamber 2 (dopant confinement). In both cases, the transition from % to roughly occurs on mm.
For equal pressures, the interface is centered on the central aperture () and the transition is due to pure diffusion (no longitudinal flow velocity ). It takes mm for to decrease from % (chamber 1) to strictly (dopant confinement).
Dopant confinement is thus ensured for equal pressures or a slight positive gradient . Setting mbar provides a clear separation of gases in both chambers, with original mix and pure remaining respectively in chamber 1 and 2, while positive gradients induce leaks into chamber 1. The shortest transition from % to occurs for equal pressures. Working with % dopant is a dimensioning case and results are valid for lower concentrations.
We observe in simulations that increasing the working pressure from mbar to mbar makes the tuning of the transition position more sensitive to the pressure difference as the central aperture conductance depends on the sum of the pressure in the two chambers. The transition length remains stable.
Simulations have also been performed for a larger aperture up to mm. As conductance is higher when increasing the central aperture diameter, it shows a higher sensitivity with . This sensitivity is confirmed by the experimental results in Section 5.
4 Target test bench
4.1 Experimental setup
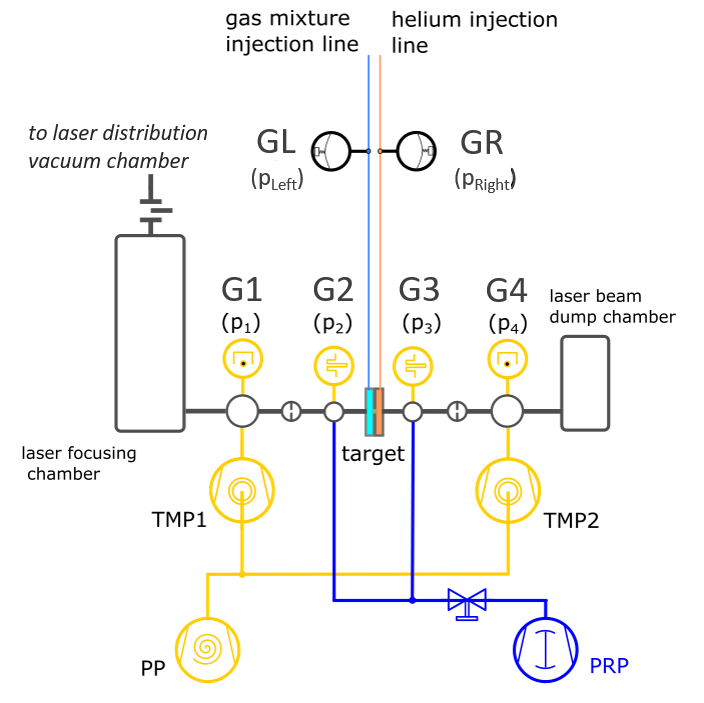
The vacuum and mechanical setup used at IJCLab target test facility is presented in Fig. 11 with its characteristics summed-up in Tab. 3.
| element | parameter | value | unit |
|---|---|---|---|
| TMP1,2 | pumping speed | l/s | |
| TMP1,2 | gas through output | mbar.l/s | |
| PP | pumping speed | l/s | |
| PRP | pumping speed | l/s | |
| G1,G4 | gauge type | cold cathode | - |
| G2,G3 | gauge type | pirani | - |
| GL,GR | gauge type | capacitance | - |
Gases are injected using a specific gas injection system (Fig. 12), with one injection line for each chamber. For chamber 1, the user specifies the mixture injection mass flow and dopant concentration in (partial pressure ratio) within . For chamber 2, a pure injection mass flow is set.
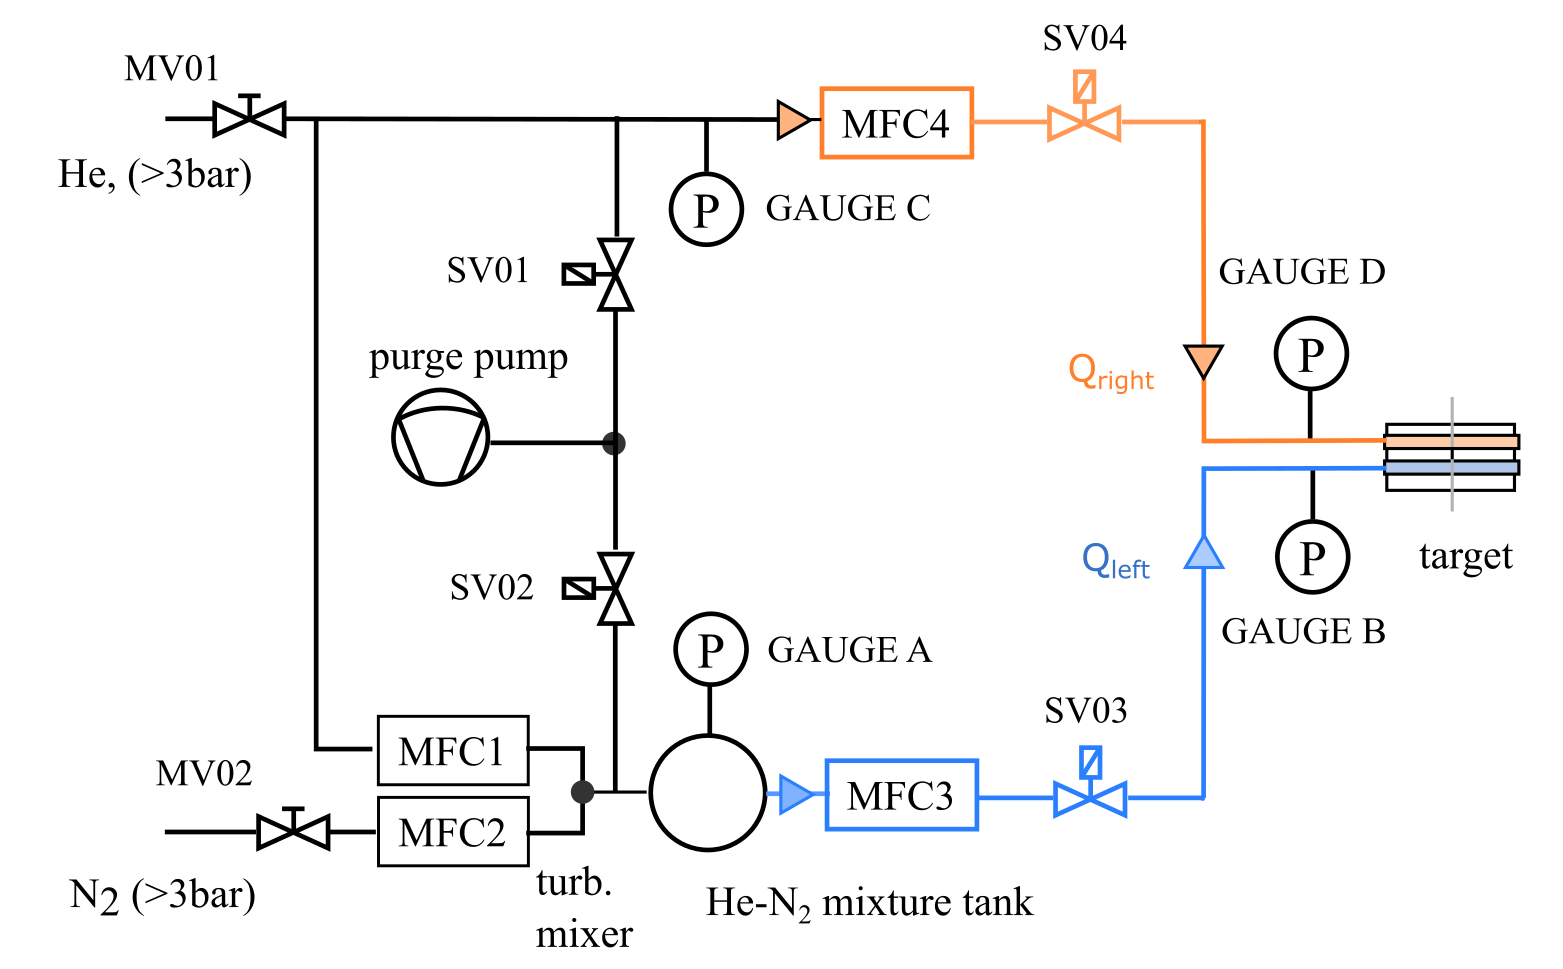
Several gauges monitor the pressure. Their names follow the laser propagation direction: G1, G2, G3, G4 respectively measuring (secondary vacuum), (primary vacuum), (primary vacuum) and (secondary vacuum). Pressure at the injection is monitored with capacitance gauges GL and GR, whose measurements are independent of gas type.
Monitoring the pressure is of particular importance to constantly check the state of the cell and alert on associated pollution propagating upstream the laser line. Additionally, gauges can serve as verification tool for fluid simulations. They allow to cross-check aperture-induced pressure drop far from axis (static pressure difference between chamber 2 and downstream pumping tee for instance). This serves as flow modeling validation regarding gas thermophysical properties and flow regime (laminar VS turbulent).
4.2 Laser line
The pump/probe optical setup is described in Fig. 13, where the laser beam comes from LaseriX platform 39.
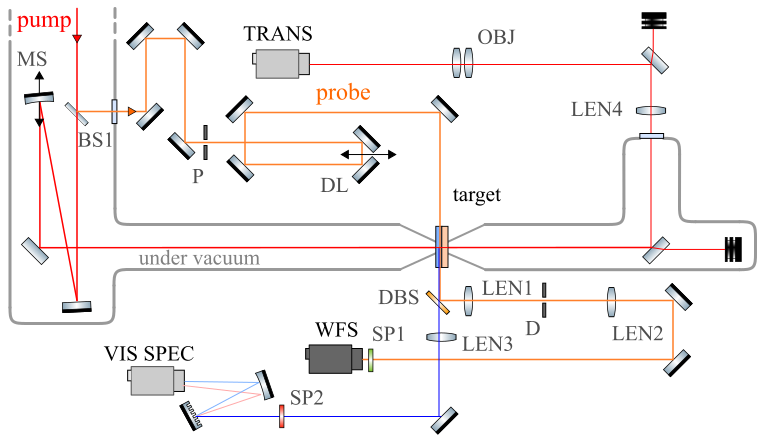
The pump beam (characteristics in Tab. 4) is focused in the target and serves for ionisation. % of the total energy is dedicated to the probe beam.
| Parameters | value | typical errors | unit |
|---|---|---|---|
| central wavelength; | nm | ||
| minimum pulse duration (FWHM); | 50 | fs | |
| repetition rate | - | Hz | |
| Flattened Gaussian beam order; | - | - | |
| energy on target; | mJ | ||
| focal length; | - | mm | |
| waist in the focal plane; | m | ||
| Strehl ratio | - | ||
| focal spot longitudinal position range; | - | mm | |
| probe delay; | ps |
5 Experimental qualification
5.1 Neutral gas pressure measurement
Simulation are cross-calibrated with experimental results: experimental pressure measurements validate the flow hypothesis (laminar versus turbulent) for the solver and its ability to reproduce pressure drops induced by the apertures. Simulations were performed with rhoPimpleFoam in laminar mode.
Whether for or , the pressure in chamber 1 is predicted with an error below %, which diminishes for higher injection pressures. The primary vacuum pressure prediction slightly deviates from the experiment, with a maximum error corresponding to mbar. Sources of deviations are: a central aperture shape not perfectly modeled, a pumping system overestimated in simulation at low pressures and the inability of the solver to model quasi-discontinuous flows for very low pressures. Simulations manage to correctly reproduce the flow down to mbar. The relevance of gas property choice, such as viscosity is confirmed, together with the use of laminar mode: turbulence does not have to be activated, which greatly reduces the simulation time.
5.2 Electron plasma density profiles
Additionally to gauge pressure measurements far from axis, the density profile on axis is assessed using a wavefront sensor. The latter is used to record the phase difference introduced by the plasma channel in chamber 1, close to the axis. A typical phase map is presented in Fig. 14.

The plasma channel has a constant diameter of m compatible with the laser width m. 1D plots envelopes are standard deviations computed from 20 shot series taken at Hz 333Although the pump and probe lasers are at Hz, acquisitions are performed at Hz (software constraints).. The important noise level can be explained by: ambient air density variations integrated over the whole probe beam path (a few meters), test bench vibrations or laser ablated particles projecting impurities in the chambers. Since the phase remains quite stable above mm from axis (no plasma), cropping is performed on each phase map, to increase the signal-to-noise ratio. In the worst case (low pressure), the signal-to-noise ratio was always .
Typical phase maps acquired for at , , and mbar in chamber 1 are presented in Fig. 15.

They display similar features than for Fig. 14. However, for a high pressure ( mbar) a longitudinal gradient appears, probably due to ionisation defocusing of the laser.
Abel inversion is used on phase maps to retrieve the corresponding electron plasma density distribution. The resulting density maps are presented in Fig. 16 were inversion has been performed on phase maps from Fig. 15.
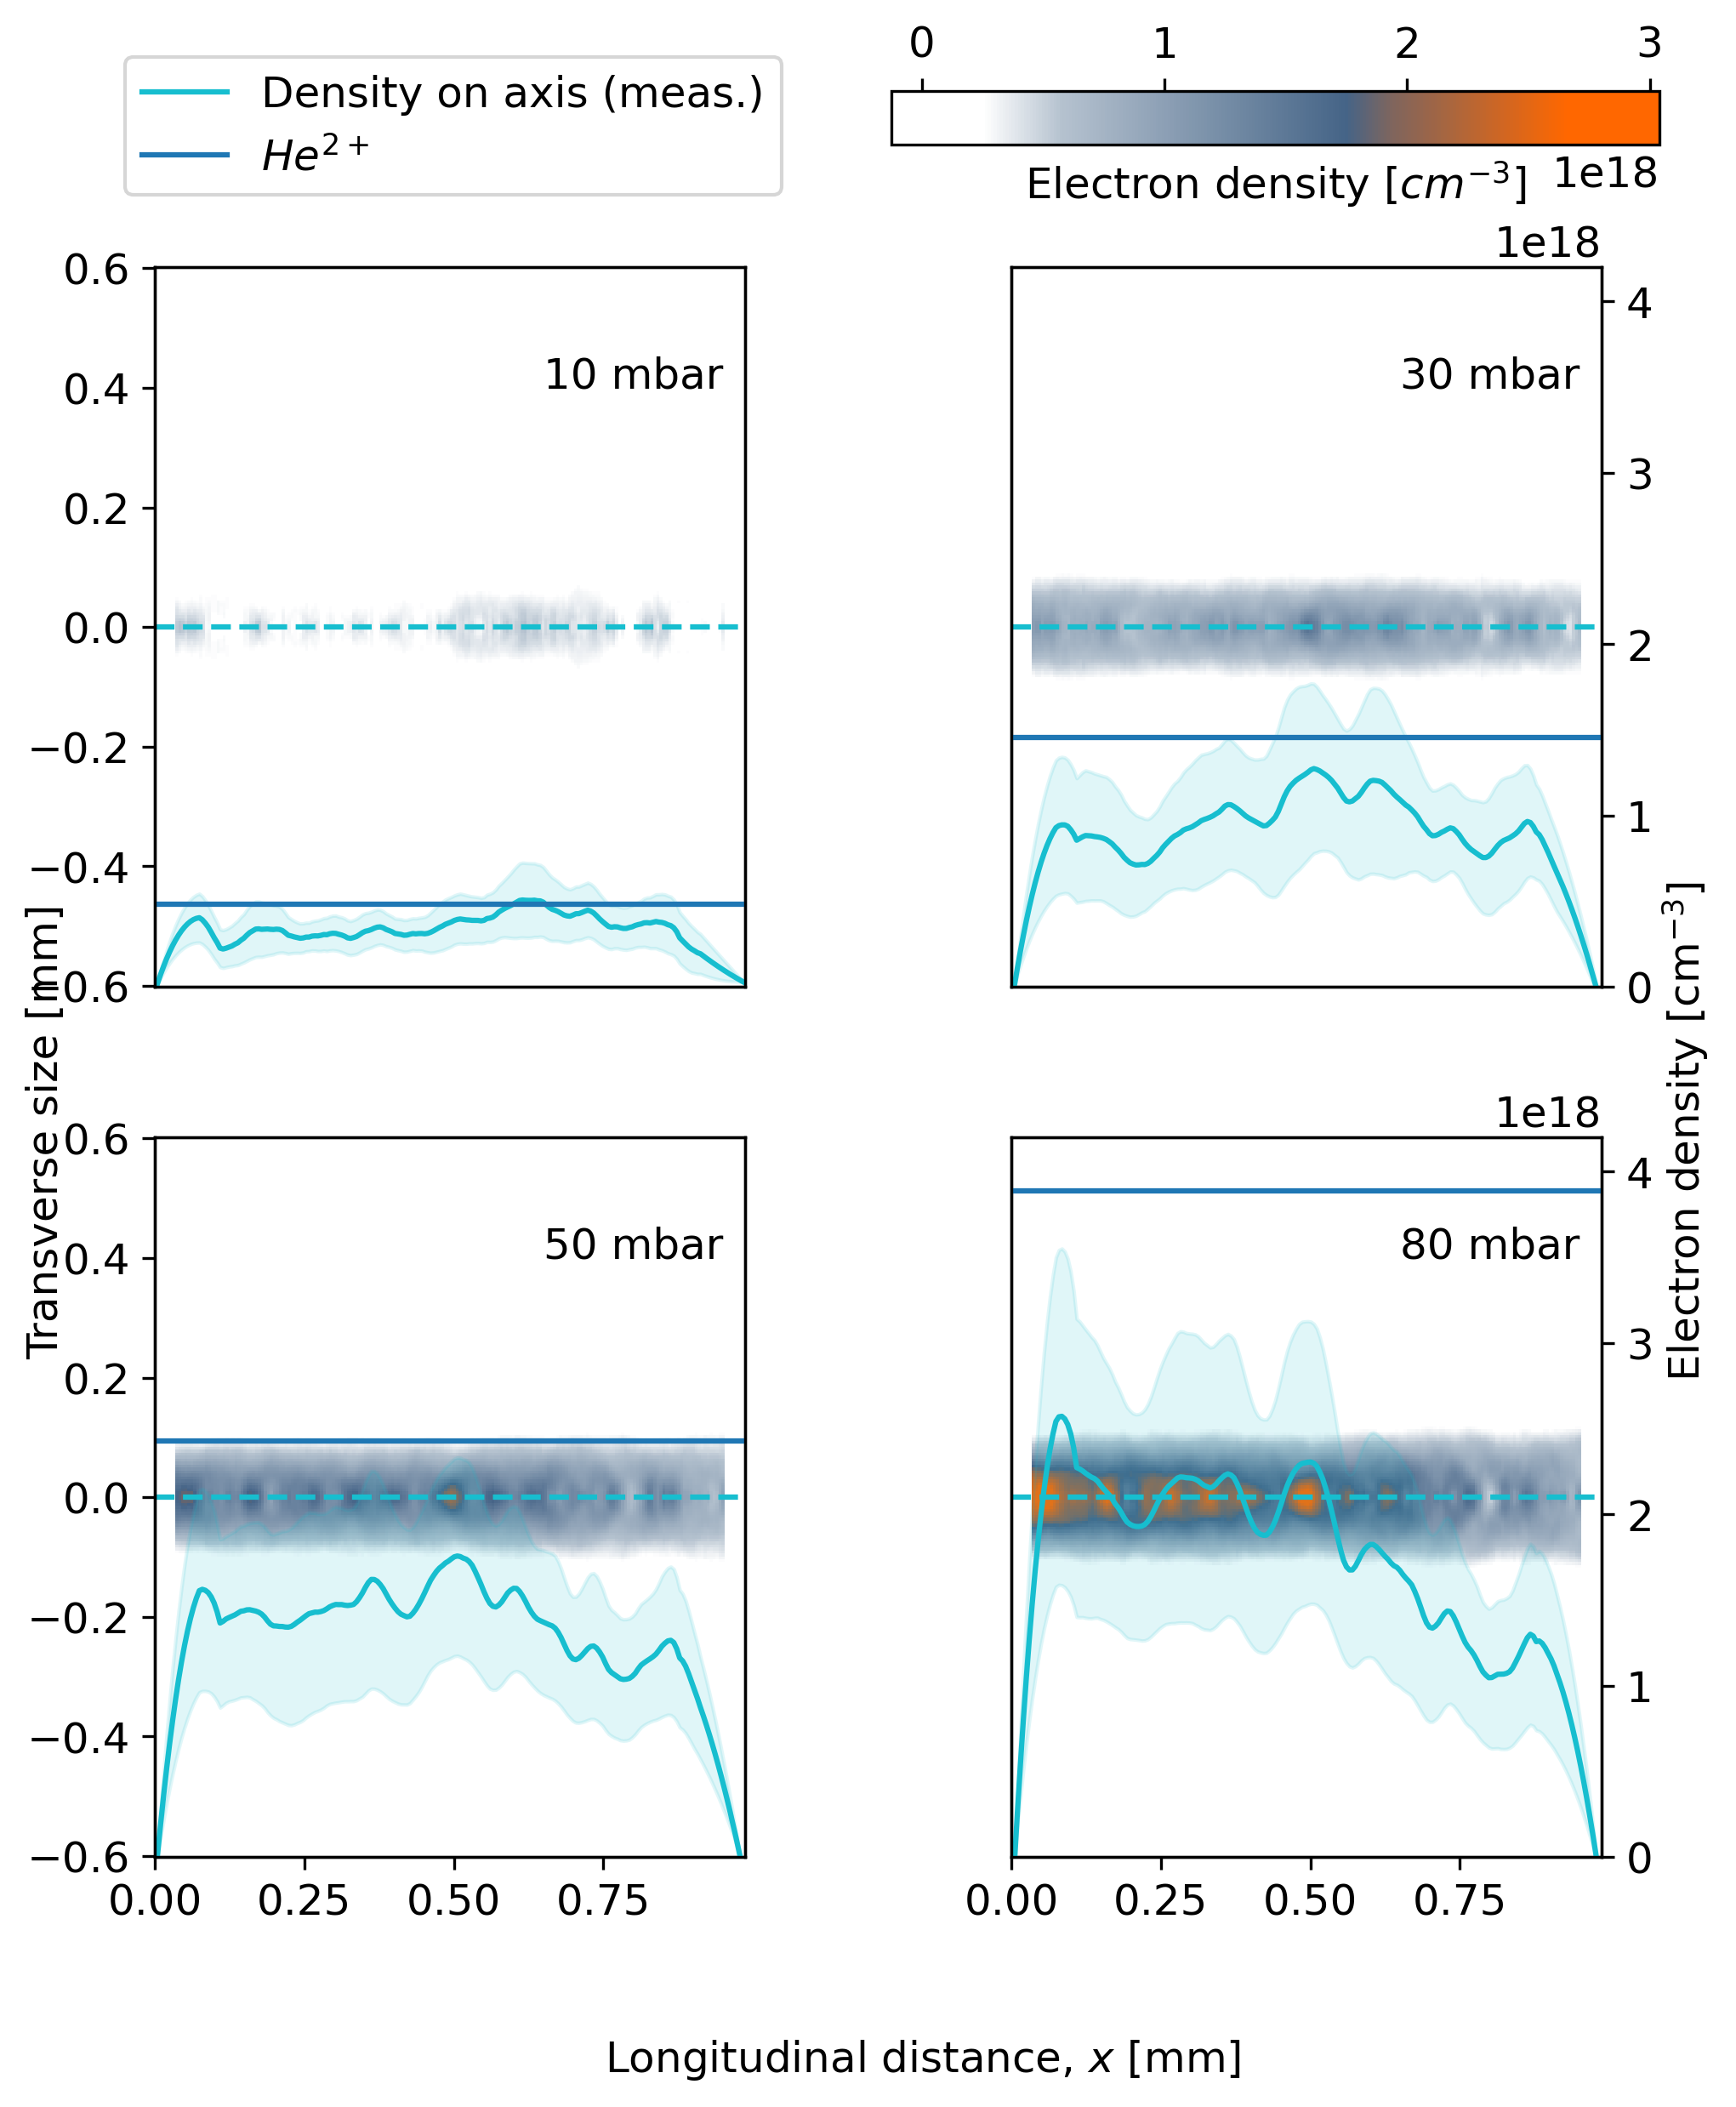
Theoretical maximum densities expected for fully ionised at , , and mbar are respectively , , and cm-3. They are indicated with horizontal lines on Fig.16. For low pressure, electron density on axis is quite constant, slightly below the theoretical value with some peaks along propagation. For and mbar, ionisation likely remains at the level, with a progressive drop for mbar above mm. This confirms that at high pressure, the pump beam is not intense enough to ionise the two levels of , due to stronger ionisation defocusing.
We conclude that theoretical measured pressures match simulations, with a longitudinal density having a constant plateau-like shape in the first chamber. A similar behaviour is expected for chamber 2, since its geometry is quite similar to chamber 1.
5.3 Dopant longitudinal profile
The prototype ability to confine the dopant is experimentally assessed with an imaging spectrometer. It relies on excited species emission, with a resolution of nm over the considered wavelength range (nm).
To get a good resolution on the diffusion of along the two chambers, pure is injected in chamber 1, while pure is injected in chamber 2. This case is not representative of a typical working point for the target, but will provide conservative information on dopant confinement. The spectrometer gives the possibility to select various emission lines to track simultaneously the corresponding species. Experimental results for different pressure gradients are presented in Fig. 17, with the largest achievable central aperture diameter ( mm).
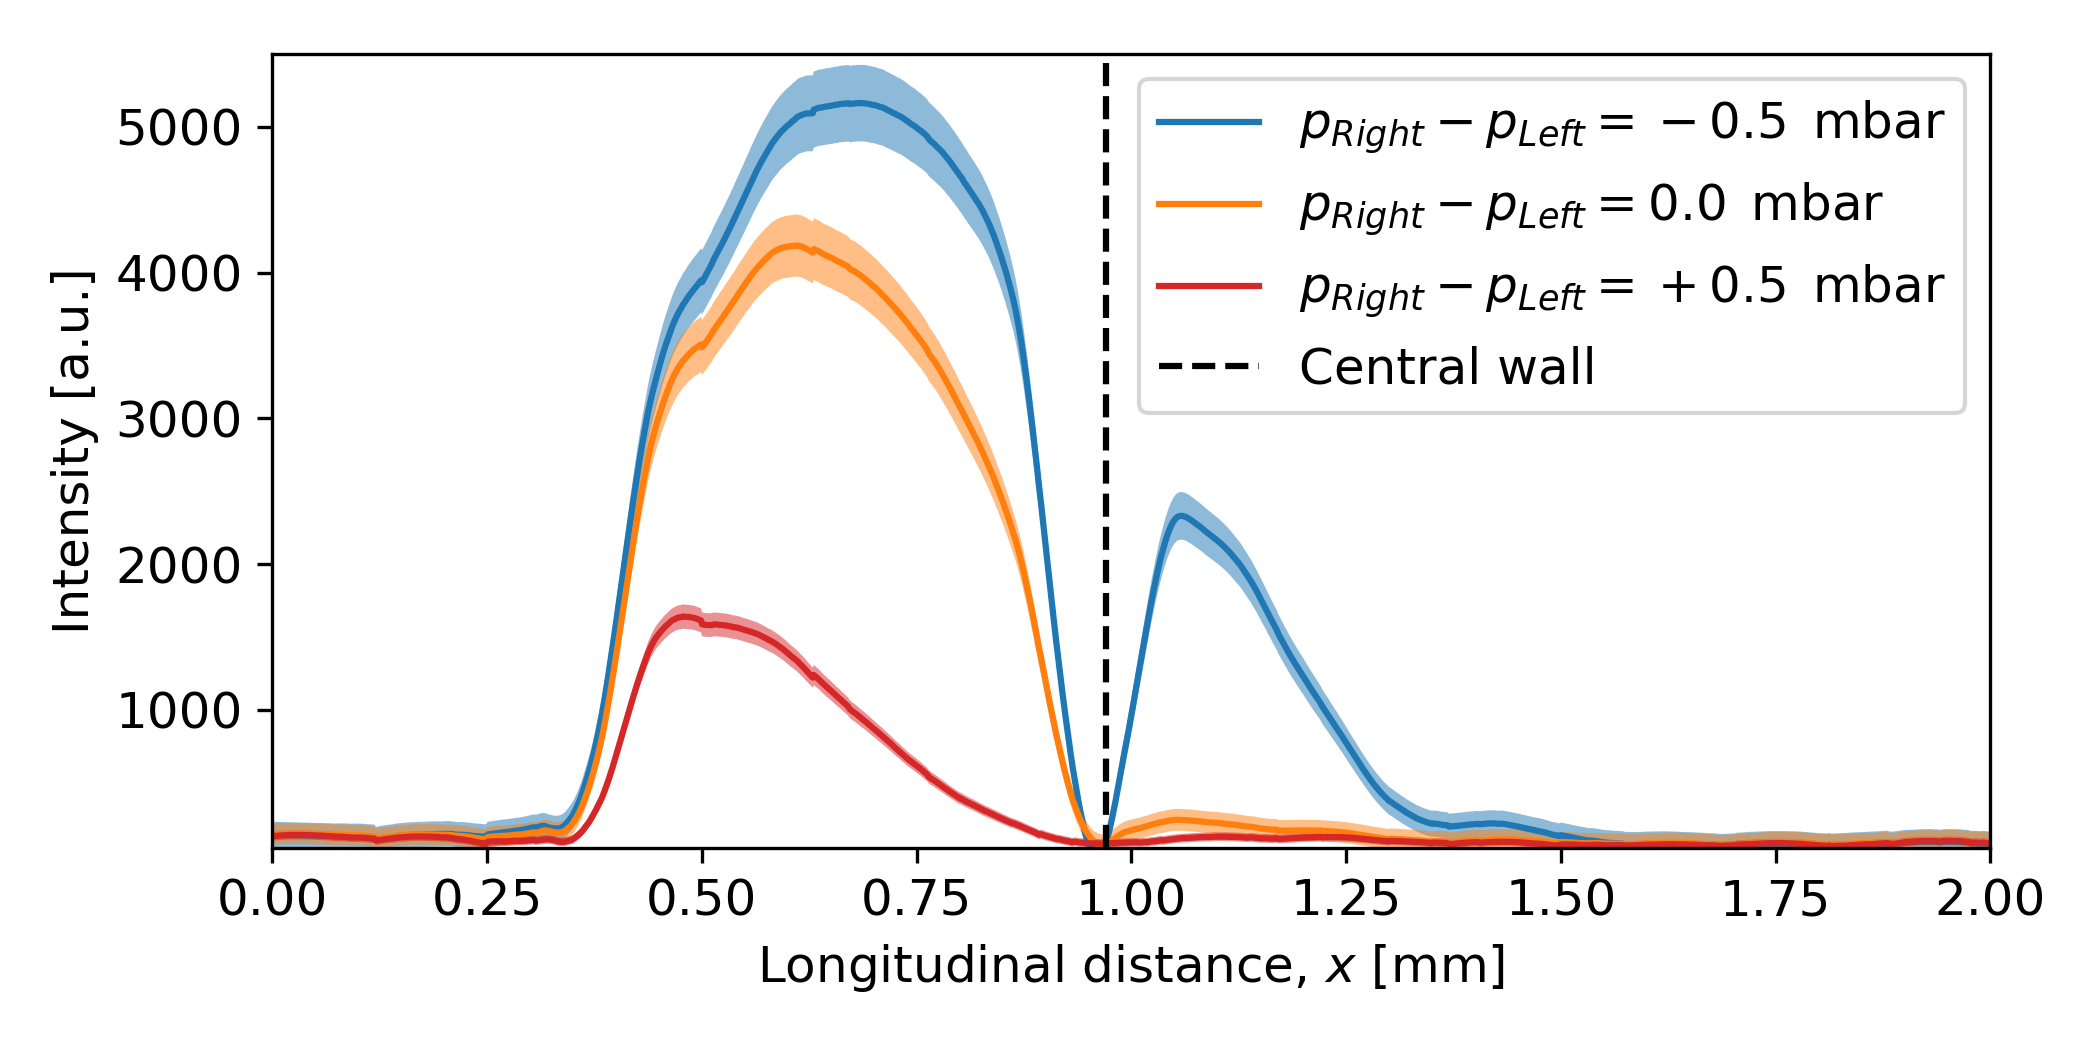
For , the dopant is confined in chamber 1 (orange curve in Fig. 17). For a slight positive gradient, the dopant is strongly pushed to the left (red curve in Fig. 17), reducing the size of the injection zone (truncated ionisation injection). On the contrary, even for a rather small negative , the dopant leaks into chamber 2 (blue curve in Fig. 17). Nevertheless, a clear stable confinement of the gas mixture is demonstrated in agreement with the simulations.
5.4 Target lifetime
Previous characterisation and simulations of course remain valid as long as the target retains its geometry under high intensity laser irradiation.
The target main body is composed of aluminium, while nozzles are either in aluminium or in ceramics (MACOR). The most critical part of the design is the inlet nozzle. As shown in numerical simulations and experimental measurements the gas mixture confinement can be obtained with a central wall aperture diameter up to mm.
Typical aperture dimensions and shape variations before and after shots at mJ for aluminium nozzles are presented in Fig. 18.
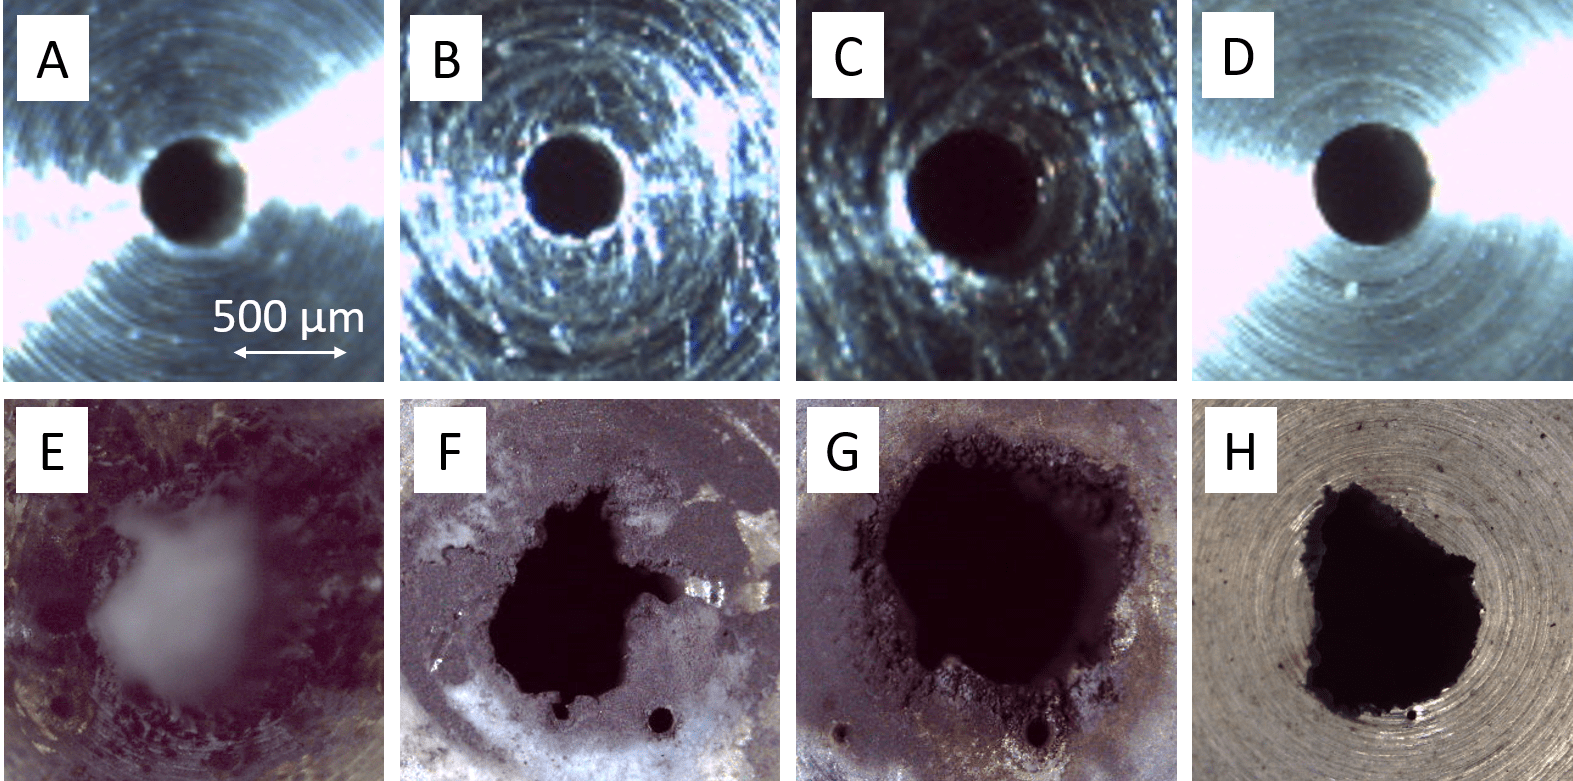
Our experimental observation is that even at mJ (well below the J required for laser-plasma acceleration), the aluminium nozzles are strongly damaged.
A solution is to use MACOR nozzles as shown in Fig. 19.

Qualitatively, higher MACOR resistance is visible on the post-mortem pictures.
An online estimation of the nozzle state can be done through pressure control. We experimentally observed an inlet pumping tee pressure rise up to the mbar range for aluminium nozzles after min of operation, while remaining in a mbar range for MACOR nozzles. Ceramics greatly improve the cell lifetime. This conclusion from the characterisation test bench has to be confirmed on real scale laser plasma experiments.
In the case of acceptable nozzle deterioration, we are able to take into account the evolution of nozzle apertures with time, with continuous adjustment of the gas injection flows to maintain a constant pressure in the chambers. In the optimisation of electron beam parameters, the laser focusing position may also be tuned during operation to counterbalance the elongation of the in-ramp length. After a few thousand shots, a saturation of the ablation is observed, leading to more stability.
Regarding optical diagnostic, the design is quite robust and for more than shots at mJ, no optical window had to be replaced or even cleaned, allowing continuous cell characterisation and monitoring through transverse diagnostics. This is favoured by the distance between plasma and window of roughly mm, preventing direct deposition of ablated material.
6 Discussion and conclusion
The density profile of a two-chamber gas cell prototype for ionisation injection has been assessed using the open-source fluid simulation library OpenFOAM. It has been cross-checked with experimental results comming from the diagnostics installed on the LaseriX test bench. Simulation results are open to the scientific community.
Our multi-cell target design offers density distribution control and precise dopant confinement, which have been experimentally demonstrated with online diagnostics that also allow to monitor the target state evolution during the experiment.
For emittance conservation issues, the output nozzle can be shaped to optimise passive plasma lensing with an adapted density out-ramp. The target integration in the beamline also offers a compact laser-plasma injector design. This allows for a compact beam transport line for further injection into a second accelerating stage. For example, the first magnet for PALLAS project can theoretically be put as close as cm from the source.
The results of this target design characterisation have been used as input for Particle-in-Cell simulations, with the aim to find optimal working points for electron injection. Four parameters have been varied: chamber pressure (with ), dopant concentration , laser energy and laser focal position 45. The numerical results show that electron beams with a charge over pC, energy ranging between MeV, energy spread below and transverse normalised emittance below m can be obtained.
Appendix A Appendixes
References
- 1 RW Assmann, MK Weikum, T Akhter, D Alesini, AS Alexandrova, MP Anania, NE Andreev, I Andriyash, M Artioli, A Aschikhin, et al. Eupraxia conceptual design report. The European Physical Journal Special Topics, 229(24):3675–4284, 2020.
- 2 E. Panofski and et al. Developing a 50 mev lpa-based injector at athena for a compact storage ring. ArXiv, 2021.
- 3 S. A. Antipov, A. Ferran Pousa, I. Agapov, R. Brinkmann, A. R. Maier, S. Jalas, L. Jeppe, M. Kirchen, W. P. Leemans, A. Martinez de la Ossa, J. Osterhoff, M. Thévenet, and P. Winkler. Design of a prototype laser-plasma injector for an electron synchrotron. Phys. Rev. Accel. Beams, 24:111301, Nov 2021.
- 4 A. J. Gonsalves, K. Nakamura, C. Benedetti, C. V. Pieronek, S. Steinke, J. H. Bin, S. S. Bulanov, J. van Tilborg, C. G. R. Geddes, C. B. Schroeder, J. Daniels, Cs. Tóth, L. Obst-Huebl, R. G. W. van den Berg, G. Bagdasarov, N. Bobrova, V. Gasilov, G. Korn, P. Sasorov, W. P. Leemans, and E. Esarey. Laser-heated capillary discharge plasma waveguides for electron acceleration to 8 GeV. Physics of Plasmas, 27(5):053102, 05 2020.
- 5 Sören Jalas, Manuel Kirchen, Philipp Messner, Paul Winkler, Lars Hübner, Julian Dirkwinkel, Matthias Schnepp, Remi Lehe, and Andreas R Maier. Bayesian optimization of a laser-plasma accelerator. Physical review letters, 126(10):104801, 2021.
- 6 Manuel Kirchen, Sören Jalas, Philipp Messner, Paul Winkler, Timo Eichner, Lars Hübner, Thomas Hülsenbusch, Laurids Jeppe, Trupen Parikh, Matthias Schnepp, et al. Optimal beam loading in a laser-plasma accelerator. Physical review letters, 126(17):174801, 2021.
- 7 Andreas R. Maier, Niels M. Delbos, Timo Eichner, Lars Hübner, Sören Jalas, Laurids Jeppe, Spencer W. Jolly, Manuel Kirchen, Vincent Leroux, Philipp Messner, Matthias Schnepp, Maximilian Trunk, Paul A. Walker, Christian Werle, and Paul Winkler. Decoding sources of energy variability in a laser-plasma accelerator. Phys. Rev. X, 10:031039, Aug 2020.
- 8 L. Rovige, J. Huijts, I. A. Andriyash, A. Vernier, M. Ouillé, Z. Cheng, T. Asai, Y. Fukuda, V. Tomkus, V. Girdauskas, G. Raciukaitis, J. Dudutis, V. Stankevic, P. Gecys, R. Lopez-Martens, and J. Faure. Optimization and stabilization of a kilohertz laser-plasma accelerator. Physics of Plasmas, 28(3):033105, 03 2021.
- 9 W. P. Leemans and et al. Gev electron beams from a centimetre-scale accelerator. Nature Physics, 2:696, 2006.
- 10 E. Adli and et al. Acceleration of electrons in the plasma wakefield of a proton bunch. Nature, 561:363–367, 2018.
- 11 I. Prencipe, J. Fuchs, S. Pascarelli, D. W. Schumacher, R. B. Stephens, N. B. Alexander, R. Briggs, M. Büscher, M. O. Cernaianu, A. Choukourov, and et al. Targets for high repetition rate laser facilities: needs, challenges and perspectives. High Power Laser Science and Engineering, 5:e17, 2017.
- 12 MJ Garland, JC Wood, G Boyle, and J Osterhoff. Plasma sources and diagnostics. arXiv preprint arXiv:2007.08184, 2020.
- 13 Rémi Lehe. Improvement of laser-wakefield accelerators: towards a compact free electron laser. Theses, Ecole Polytechnique, July 2014.
- 14 Jérôme Faure, Yannick Glinec, A Pukhov, S Kiselev, S Gordienko, E Lefebvre, J-P Rousseau, F Burgy, and Victor Malka. A laser–plasma accelerator producing monoenergetic electron beams. Nature, 431(7008):541–544, 2004.
- 15 Jérôme Faure, Clément Rechatin, A Norlin, Agustin Lifschitz, Y Glinec, and Victor Malka. Controlled injection and acceleration of electrons in plasma wakefields by colliding laser pulses. Nature, 444(7120):737–739, 2006.
- 16 Arthur Pak, KA Marsh, SF Martins, W Lu, WB Mori, and C Joshi. Injection and trapping of tunnel-ionized electrons into laser-produced wakes. Physical review letters, 104(2):025003, 2010.
- 17 C McGuffey, AGR Thomas, W Schumaker, T Matsuoka, V Chvykov, FJ Dollar, G Kalintchenko, V Yanovsky, A Maksimchuk, K Krushelnick, et al. Ionization induced trapping in a laser wakefield accelerator. Physical review letters, 104(2):025004, 2010.
- 18 T-Y Chien, C-L Chang, C-H Lee, J-Y Lin, J Wang, and S-Y Chen. Spatially localized self-injection of electrons in a self-modulated laser-wakefield accelerator by using a laser-induced transient density ramp. Physical review letters, 94(11):115003, 2005.
- 19 P Brijesh, Cédric Thaury, Kim Ta Phuoc, Sébastien Corde, Guillaume Lambert, Victor Malka, SPD Mangles, M Bloom, and S Kneip. Tuning the electron energy by controlling the density perturbation position in laser plasma accelerators. Physics of Plasmas, 19(6), 2012.
- 20 Alexander Buck, Johannes Wenz, Jiancai Xu, Konstantin Khrennikov, Karl Schmid, Matthias Heigoldt, Julia M Mikhailova, M Geissler, B Shen, Ferenc Krausz, et al. Shock-front injector for high-quality laser-plasma acceleration. Physical review letters, 110(18):185006, 2013.
- 21 Matthias Burza, Arkady Gonoskov, Kristoffer Svensson, Franck Wojda, Anders Persson, Martin Hansson, Guillaume Genoud, Mattias Marklund, C-G Wahlström, and Olle Lundh. Laser wakefield acceleration using wire produced double density ramps. Physical Review Special Topics-Accelerators and Beams, 16(1):011301, 2013.
- 22 Martin Hansson, Bastian Aurand, X Davoine, Henrik Ekerfelt, Kristoffer Svensson, Anders Persson, C-G Wahlström, and O Lundh. Down-ramp injection and independently controlled acceleration of electrons in a tailored laser wakefield accelerator. Physical Review Special Topics-Accelerators and Beams, 18(7):071303, 2015.
- 23 G Golovin, Shouyuan Chen, N Powers, Cheng Liu, Sudeep Banerjee, J Zhang, M Zeng, Z Sheng, and D Umstadter. Tunable monoenergetic electron beams from independently controllable laser-wakefield acceleration and injection. Physical Review Special Topics-Accelerators and Beams, 18(1):011301, 2015.
- 24 Dominykas Gustas, Diego Guénot, Aline Vernier, Shankar Dutt, Frederik Böhle, Rodrigo Lopez-Martens, Agustin Lifschitz, and Jérôme Faure. High-charge relativistic electron bunches from a khz laser-plasma accelerator. Physical Review Accelerators and Beams, 21(1):013401, 2018.
- 25 D Guénot, D Gustas, A Vernier, B Beaurepaire, F Böhle, M Bocoum, M Lozano, Aurélie Jullien, R Lopez-Martens, Agustin Lifschitz, et al. Relativistic electron beams driven by khz single-cycle light pulses. Nature Photonics, 11(5):293–296, 2017.
- 26 TL Audet, P Lee, G Maynard, S Dobosz Dufrénoy, A Maitrallain, M Bougeard, P Monot, and B Cros. Gas cell density characterization for laser wakefield acceleration. Nuclear Instruments and Methods in Physics Research Section A: Accelerators, Spectrometers, Detectors and Associated Equipment, 909:383–386, 2018.
- 27 LT Dickson, CID Underwood, F Filippi, RJ Shalloo, J Björklund Svensson, D Guénot, K Svendsen, I Moulanier, S Dobosz Dufrénoy, CD Murphy, et al. Mechanisms to control laser-plasma coupling in laser wakefield electron acceleration. Physical Review Accelerators and Beams, 25(10):101301, 2022.
- 28 BB Pollock, CE Clayton, JE Ralph, F Albert, A Davidson, L Divol, C Filip, SH Glenzer, K Herpoldt, W Lu, et al. Demonstration of a narrow energy spread, 0.5 gev electron beam from a two-stage laser wakefield accelerator. Physical review letters, 107(4):045001, 2011.
- 29 Olena Kononenko, NC Lopes, JM Cole, C Kamperidis, SPD Mangles, Z Najmudin, J Osterhoff, K Poder, D Rusby, DR Symes, et al. 2d hydrodynamic simulations of a variable length gas target for density down-ramp injection of electrons into a laser wakefield accelerator. Nuclear Instruments and Methods in Physics Research Section A: Accelerators, Spectrometers, Detectors and Associated Equipment, 829:125–129, 2016.
- 30 FG Desforges, BS Paradkar, Magnus Hansson, J Ju, Lovisa Senje, TL Audet, A Persson, S Dobosz-Dufrénoy, Olle Lundh, G Maynard, et al. Dynamics of ionization-induced electron injection in the high density regime of laser wakefield acceleration. Physics of Plasmas, 21(12), 2014.
- 31 J Kim, VLJ Phung, K Roh, M Kim, K Kang, and H Suk. Development of a density-tapered capillary gas cell for laser wakefield acceleration. Review of Scientific Instruments, 92(2), 2021.
- 32 https://www.openfoam.com/.
- 33 https://gitlab.in2p3.fr/cfd-simulations-lpa-target/openfoam.
- 34 https://www.openfoam.com/documentation/guides/latest/doc/guide-applications-solvers-compressible-rhoPimpleFoam.html.
- 35 https://www.openfoam.com/documentation/guides/latest/man/interMixingFoam.html.
- 36 https://www.openfoam.com/documentation/guides/latest/doc/guide-meshing-snappyhexmesh.html.
- 37 PALLAS. Prototyping accelerator based on laser-plasma technology - project. http://pallas.ijclab.in2p3.fr, 2023.
- 38 Xiangkun Li, Antoine Chancé, and Phu Anh Phi Nghiem. Preserving emittance by matching out and matching in plasma wakefield acceleration stage. Physical Review Accelerators and Beams, 22(2):021304, 2019.
- 39 Laserix laser facility. http://laserix.ijclab.in2p3.fr, 2023.
- 40 PHASICS. Sid4-hr-ge. https://www.phasics.com/en/product/sid4-hr-wavefront-sensor/, 2022.
- 41 GR Plateau, NH Matlis, CGR Geddes, AJ Gonsalves, Satomi Shiraishi, Chen Lin, RA Van Mourik, and WP Leemans. Wavefront-sensor-based electron density measurements for laser-plasma accelerators. Review of Scientific Instruments, 81(3), 2010.
- 42 Fernando Brandi and Leonida Antonio Gizzi. Optical diagnostics for density measurement in high-quality laser-plasma electron accelerators. High Power Laser Science and Engineering, 7:e26, 2019.
- 43 FEMTOEASY. Miss 2d spectrometer. https://www.femtoeasy.eu/mini-imaging-spectrometer/, 2022.
- 44 basler. aca2040-25gm with nm bandwidth bandpass filter (fbh560-10), 2022.
- 45 P Drobniak, E Baynard, C Bruni, K Cassou, C Guyot, G Kane, S Kazamias, V Kubytsky, N Lericheux, B Lucas, M Pittman, F Massimo, A Beck, A Specka, P Nghiem, and D Minenna. Fast particle-in-cell simulations-based method for the optimisation of a laser-plasma electron injector, 2023.