WALLABY Pre-Pilot Survey: Ultra-Diffuse Galaxies in the Eridanus Supergroup
Abstract
We present a pilot study of the atomic neutral hydrogen gas (H i) content of ultra-diffuse galaxy (UDG) candidates. In this paper, we use the pre-pilot Eridanus field data from the Widefield ASKAP -band Legacy All-sky Blind Survey (WALLABY) to search for H i in UDG candidates found in the Systematically Measuring Ultra-diffuse Galaxies survey (SMUDGes). We narrow down to 78 SMUDGes UDG candidates within the maximum radial extents of the Eridanus subgroups for this study. Most SMUDGes UDGs candidates in this study have effective radii smaller than 1.5 kpc and thus fail to meet the defining size threshold. We only find one H i detection, which we classify as a low-surface-brightness dwarf. Six putative UDGs are H i-free. We show the overall distribution of SMUDGes UDG candidates on the size-luminosity relation and compare them with low-mass dwarfs on the atomic gas fraction versus stellar mass scaling relation. There is no correlation between gas-richness and colour indicating that colour is not the sole parameter determining their H i content. The evolutionary paths that drive galaxy morphological changes and UDG formation channels are likely the additional factors to affect the H i content of putative UDGs. The actual numbers of UDGs for the Eridanus and NGC 1332 subgroups are consistent with the predicted abundance of UDGs and the halo virial mass relation, except for the NGC 1407 subgroup, which has a smaller number of UDGs than the predicted number. Different group environments suggest that these putative UDGs are likely formed via the satellite accretion scenario.
keywords:
galaxies: formation – galaxies: ISM – galaxies: groups: general1 Introduction
Low-surface-brightness (LSB) galaxies have been studied for decades (e.g., Impey et al., 1988; Bothun et al., 1991; Dalcanton et al., 1997). With the advancement of optical imaging instruments and search techniques, a large population of extreme LSB galaxies has been uncovered (e.g., Abraham & van Dokkum, 2014; Zaritsky et al., 2019). Among them, the discovery of tens to hundreds of spatially extended extreme LSB galaxies in the Coma cluster has reinvigorated the interest in studying these objects among observers and theorists (van Dokkum et al., 2015; Koda et al., 2015). These so-called ultra-diffuse galaxies (UDGs) are typically defined to have an effective radius () 1.5 kpc and a central -band surface brightness () 24 mag arcsec-2 (van Dokkum et al., 2015). Given that this definition is mostly motivated by observational constraints, some studies suggest that UDGs may be a sub-class of the LSB dwarf population (Conselice, 2018; Habas et al., 2020; Marleau et al., 2021; Lee et al., 2020a). As they represent an extreme end of the LSB dwarf population, they are important in testing galaxy formation models (Boylan-Kolchin et al., 2012; Sawala et al., 2016).
UDGs are prevalent across all environments. They have been found in clusters (Coma cluster, e.g. van Dokkum et al., 2015; Koda et al., 2015; Yagi et al., 2016; Virgo cluster, e.g. Mihos et al., 2015; Junais et al., 2022; Hydra cluster, e.g. Iodice et al., 2020; and other clusters, see Lee et al., 2020b and references therein); in galaxy groups (Hickson Compact groups, e.g. Román & Trujillo, 2017b; Shi et al., 2017; NGC 5485 group, Merritt et al., 2016) and in the field (e.g. Prole et al., 2019, 2021). Their physical properties also vary across environments. For example, they are generally red (quiescent), smooth and gas-poor in dense environments but blue (star-forming), irregular and gas-rich in low-density environments (Román & Trujillo, 2017b; Kadowaki et al., 2021). Their dark matter (DM) content has also sparked an intense debate about their nature and formation mechanisms. Observational evidences suggest that some of them are embedded in dwarf-sized DM halos (Beasley & Trujillo, 2016; Chilingarian et al., 2019) and in more massive DM halos (van Dokkum et al., 2015; Zaritsky, 2017; Forbes et al., 2020). Some UDGs also exhibit peculiar properties, such as high DM fractions (Beasley et al., 2016) and an offset from the established baryonic Tully-Fisher relation (Mancera Piña et al., 2020; Karunakaran et al., 2020). These pecularities challenge galaxy formation models. It is unclear if the offset from the baryonic Tully-Fisher relation is real or the result of difficulties in measuring reliable inclinations, hence rotational velocities. It is also unclear how gas-rich blue UDGs form in low-density environments and how they relate to the cluster UDGs, which tend to be gas-poor.
Several hypotheses have been proposed to form UDGs. There are two main categories which are driven by internal and external processes.
Internal processes:
-
•
UDGs that are formed in dwarf sized halos might have higher than average spin parameters. The higher specific angular momentum of the halo prevents gas from effectively collapsing into a dense structure, which explains their extended size. In this scenario, field UDGs are predicted to be gas-rich (Rong et al., 2017; Amorisco & Loeb, 2016).
-
•
In the NIHAO (Numerical Investigation of a Hundred Astrophysical Objects; Wang et al., 2015) simulation field, UDGs can be formed via repeated star formation episodes during their early evolution, which drives the gas out to larger radii. A non-negligible H i gas mass of 107-9 M⊙ is predicted for isolated field UDGs (Di Cintio et al., 2017). It is worth noting that UDGs may have lower star formation efficiencies than normal dwarfs despite being gas-rich (Kado-Fong et al., 2022).
External processes:
- •
-
•
Present-day UDGs are formed from excess energy and angular momentum in merging low-mass galaxies early on () (Wright et al., 2021).
- •
- •
While these formation mechanisms are still under debate, a wide variety of properties may suggest that they are formed via a combination of the above proposed mechanisms in different environments.
While deep optical imaging allows us to identify UDG candidates, one limitation is their distance determination. This is in part the reason that UDG searches largely associate candidates to clusters and groups at known distances. While some distances to UDGs have been obtained, sample sizes remain small due to a large amount of time that is required for spectroscopic follow-up observations (see e.g., Kadowaki et al., 2017; Ruiz-Lara et al., 2018; Kadowaki et al., 2021; Martín-Navarro et al., 2019; Emsellem et al., 2019). Observations of H i-bearing UDGs allow an easier measurement of redshifts (inferring kinematic distances), which allows clear separation of foreground dwarfs from UDGs. Such measurements also provide H i masses and linewidth/rotation velocities for disentangling the formation mechanisms. Targeted H i follow-up studies on nearby blue and star-forming UDGs have therefore been conducted and have shown to yield H i masses consistent with the theoretical prediction (Bellazzini et al., 2017; Papastergis et al., 2017; Spekkens & Karunakaran, 2018; Scott et al., 2021). The untargeted Arecibo Legacy Fast ALFA (Arecibo -band Feed Array) extragalactic H i survey (ALFALFA; Giovanelli et al., 2005) data have also proven to be useful in studying H i-bearing UDGs in large numbers (Leisman et al., 2017; Janowiecki et al., 2019). Recently, an H i pilot survey of optical selected UDG candidates using the Robert C. Byrd Green Bank Telescope (GBT) has also been conducted (Karunakaran et al., 2020). The ongoing and previous H i studies are mostly utilising single-dish telescopes, which have better sensitivity than interferometers, albeit at the cost of lower angular resolution.
The Widefield ASKAP -Band Legacy All-sky Blind SurveY (WALLABY, Koribalski et al., 2020) makes use of the large field of view of the Australian Square Kilometre Array Pathfinder (ASKAP; Johnston et al., 2007; Hotan et al., 2021) to image H i galaxies out to a redshift and to cover most of the southern hemisphere. With the survey’s high angular resolution of 30″ and root-mean-square (RMS) sensitivity of 1.6 mJy per beam per 18.5 kHz channel, WALLABY early science studies have been able to recover many gas-rich low-mass dwarf galaxies (see e.g. For et al., 2019; Kleiner et al., 2019; For et al., 2021). These galaxies were not resolved as individual sources in previous single-dish surveys, such as the H i Parkes All-Sky Survey (HIPASS; Barnes et al., 2001). WALLABY will be the first southern H i survey to provide a large number of H i redshifts and physical parameters for those H i-bearing UDGs that are identified as candidates in the DESI Legacy Imaging Surveys (Dey et al., 2019). This will allow us to investigate the proposed formation mechanisms from the H i perspective across environments.
1.1 Eridanus Supergroup
The concentration of galaxies in the region of Eridanus constellation was first noted by Baker (1933). A later study by de Vaucouleurs (1975) found that Group 31 and galaxies around the NGC 1332 and NGC 1209 formed the “Eridanus Cloud”. This cloud lies on the Eridanus-Fornax-Dorado filamentary structure and is extended to the south and in front of the “Great Wall” (4000 km s-1) (da Costa et al., 1988; Willmer et al., 1989). Its structural complexity has drawn some debate regarding its nature. Willmer et al. (1989) described it as a cluster made up of three or four subclumps. On the other hand, Omar & Dwarakanath (2005) considered that the galaxies in the region as loose groups and form an intermediate evolutionary stage between the Ursa-Major group and the Fornax cluster. Brough et al. (2006) re-analysed this region using the 6dF Galaxy Survey (6dFGS; Jones et al., 2004) and concluded that this region is occupied by 3 distinct groups, namely the NGC 1407 ( km s-1), NGC 1332 ( km s-1) and Eridanus ( km s-1) groups. These groups also form part of the supergroup, which is defined as a group of groups that may eventually merge to form a cluster.
The Eridanus supergroup is an interesting system as it is on the evolutionary path to cluster assembly similarly to the Ursa-Major supergroup (Wolfinger et al., 2016). There are only a few known supergroups in the Universe that allow us to better understand galaxy evolutionary pathways (Tran et al., 2009). Galaxies in the Eridanus supergroup are more H i-deficient as compared to galaxies in the Ursa-Major Supergroup and in the field (For et al., 2021; Murugeshan et al., 2021). There are two enormous H i clouds in the Eridanus supergroup without optical counterparts (Wong et al., 2021), and the importance of tidal interactions in the Eridanus supergroup has been recently demonstrated (Wang et al., 2022).
In this paper, we present a pilot study of H i content of optically identified UDG candidates in the WALLABY pre-pilot Eridanus field and discuss implications for their formation mechanisms. This paper is structured as follows. Section 2 describes the selection criteria of UDG candidates, the methodology used to search for H i and the derivation of their physical parameters. In Section 3, we perform the analysis of their distribution with respect to the low-mass dwarf population on the atomic gas fraction vs stellar mass scaling relation, the predicted number of UDGs based on the virial masses of the host system, tidal or ram-pressure stripping as a possible formation channel, gas-richness as compared to other UDGs in group and cluster environments. We summarise our findings and discuss future work in Section 4.
Throughout the paper, we adopt a cold dark matter cosmology model (CDM) with , , and km s-1 Mpc-1. These are the default parameters for distances and cosmologically-corrected quantities in the NASA/IPAC Extragalactic (NED) database (Spergel et al., 2007).
2 UDG Candidates
We select the UDG candidates from the third Systematically Measuring Ultra-diffuse Galaxies survey (SMUDGes) catalogue (Zaritsky et al., 2022). This catalogue focuses on identifying UDG candidates from the southern portion of the ninth data release (DR9) of the DESI Legacy Imaging Surveys (Dey et al., 2019). The classification is performed using a modified version of a deep learning model with visual confirmation. Objects with low surface brightness ( 24 mag arcsec-2) and large angular extent (effective radii; 5.3″, which corresponds to 2.5 kpc at the distance of the Coma cluster), are set as the main selection criteria for the imaging data search in SMUDGes. We refer the reader to a detailed description of the image processing and the automated method for identifying the UDG candidates in Zaritsky et al. (2019, 2021).
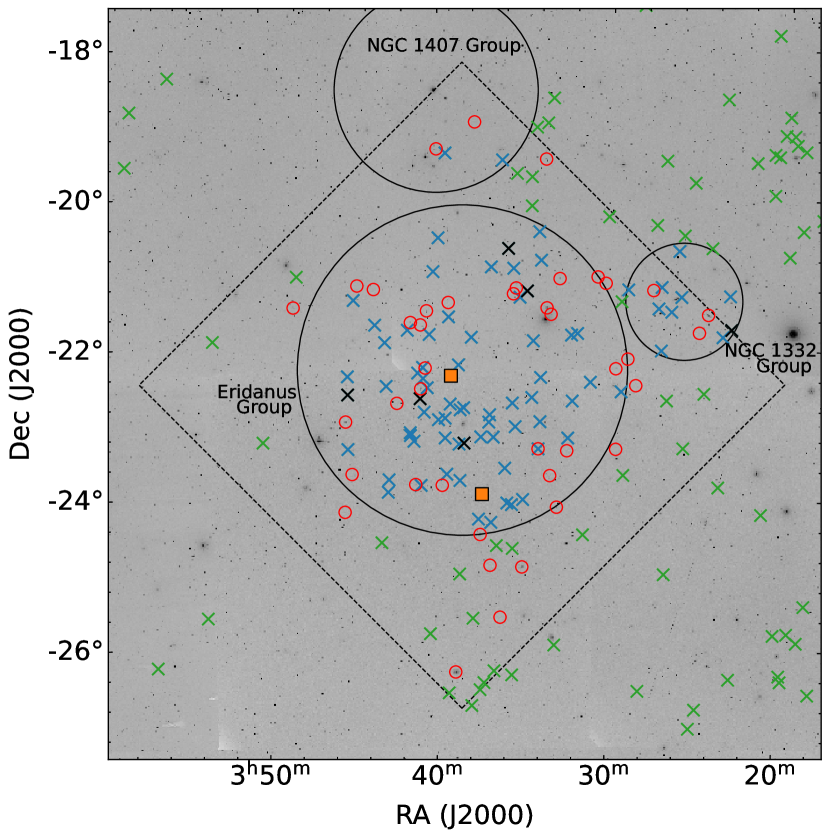
In Figure 1, we show the distribution of SMUDGes UDG candidates within a area of the Eridanus supergroup (crosses). The maximum radial extent of the Eridanus, NGC 1407 and NGC 1332 groups (Brough et al., 2006) are represented as black circles. The ASKAP observed area is marked with the dashed diamond, which fully covers the Eridanus group. The red circles represent the H i detections in For et al. (2021), hereafter F21. The H i sources in F21 generally have a higher optical surface brightness than the SMUDGes UDG candidates. There are 97 and 78 SMUDGes UDG candidates within the WALLABY pre-pilot footprint and within the maximum radial extents of the groups that comprise the Eridanus supergroup, respectively.
The completeness of the SMUDGes catalogue is estimated to be a better representation of the population of large ( kpc) UDGs beyond km s-1. Given that the distance to the Eridanus supergroup is about 1/5 (one fifth) of the distance to Coma (100 Mpc), the vast majority of SMUDGes UDG candidates in this region are likely not true UDGs. A spatial variation of SMUDGes UDG candidates is seen in the Eridanus field. Examining the observed footprints of DECaLS of this field, we find only minor differences in depth. Excluding faint candidates does not change the spatial variation that we see in the field.
2.1 Searching for H i
To search for H i in the SMUDGes UDG candidates, we extract a subcube at the position of each SMUDGes UDG candidate from the WALLABY mosaicked cube of the Eridanus field. We extract the subcubes using three velocity ranges (680–2500 km s-1, 2000–7000 km s-1 and 7000–13000 km s-1), which resulted in 973 subcubes. Each subcube covers in area. The first velocity range covers the Eridanus supergroup.
We run the Source Finding Application (sofia111Available at https://github.com/SoFiA-Admin/SoFiA-2/; Serra et al., 2015; Westmeier et al., 2021) to search for H i using 3.0, 3.5, 4.0, 4.5 and 5.0 detection thresholds. We note that sources presented in the F21 catalogue are detected with a 5.0 threshold, where the local RMS is calculated from a larger area and a wider velocity range than each extracted subcube. It is possible that changes of local RMS and lower thresholds might yield H i detections that fall below the 5 detection threshold. Subsequently, we check the reliability plots from sofia, and all detections by eye using Hanning-smoothed cubes and DR9 DESI Legacy Imaging Survey images. We only find one reliable H i detection, which is also known as WALLABY J033408232125 =1262 km s-1) in the F21 catalogue. This H i detection is also a member of the Eridanus group (see F21). As a result of not finding any H i detection outside the maximum radial extents of these groups that make up the Eridanus supergroup (but still within WALLABY observed footprints), we will focus on analysing the 78 SMUDGes UDG candidates that are within the maximum radial extents of these groups for the rest of the paper. We note that there are two SMUDGes UDG candidates in the NGC 1332 group that fall outside of the ASKAP field of view. The search algorithm of SMUDGes also does not detect any UDG candidates within 2′ of the enormous H i clouds in the Eridanus group (Wong et al., 2021).
2.2 Properties and Physical Parameters of SMUDGes UDG Candidates
Assuming that these 78 SMUDGes UDG candidates are group members of the Eridanus subgroups, we adopt a luminosity distance of = 21 Mpc (see Section 5 of F21) to calculate their . To obtain the stellar masses, we employ the mass-to-light ratio () relation in Zibetti et al. (2009)222An initial mass function of Chabrier (2003) is adopted. as follows:
| (1) |
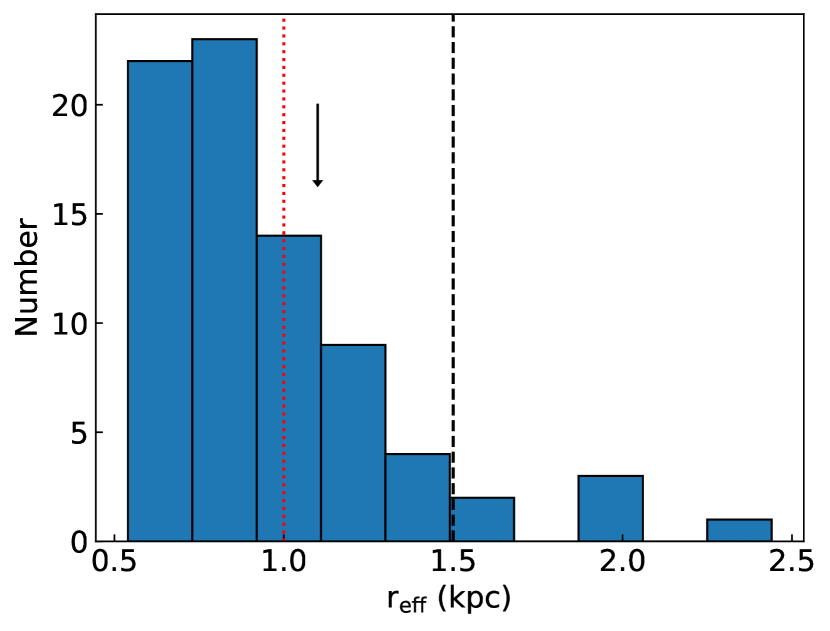
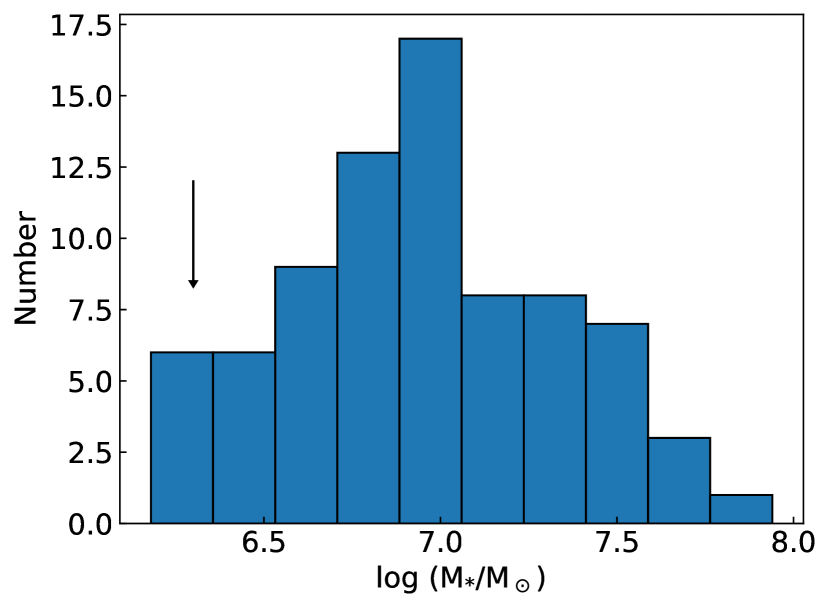
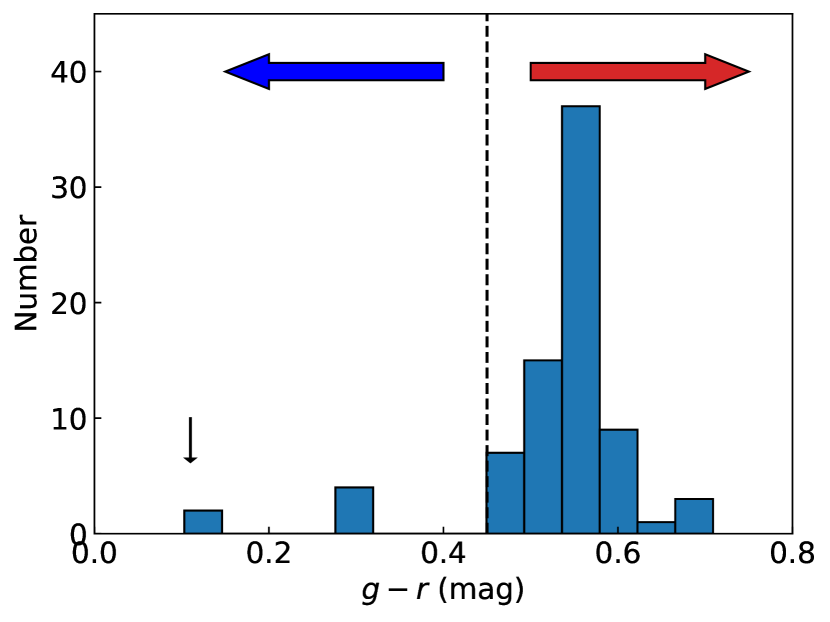
where is an extinction-corrected colour and is the -band luminosity measured from the DR9 DESI Legacy Survey images. The absolute magnitude of the sun () in different DES wavebands is given in Willmer (2018). The -band absolute magnitude is given as , where is the luminosity distance in pc. We adopt the (extinction) value in the -band used for the SMUDGes catalogue (Zaritsky et al., 2022). In Figure 2, we show the distributions of , and for our SMUDGes UDG candidates.
The definition of UDGs varies significantly in the literature. The widely accepted definition, i.e. 1.5 kpc and 24 mag arcsec-2, stems from the samples in van Dokkum et al. (2015). There is a wide range of parameters being explored as selection criteria by various studies. For example, Yagi et al. (2016) and Román & Trujillo (2017b) use kpc and kpc as their minimum radius definition, respectively. This is solely motivated by observational constraints rather than a physical reason. There are other constraints which have variously been suggested, such as stellar mass, absolute magnitude and/or luminosity, to explicitly limit UDGs to dwarf mass populations (see Mihos et al., 2015; Iodice et al., 2020; Lim et al., 2020).
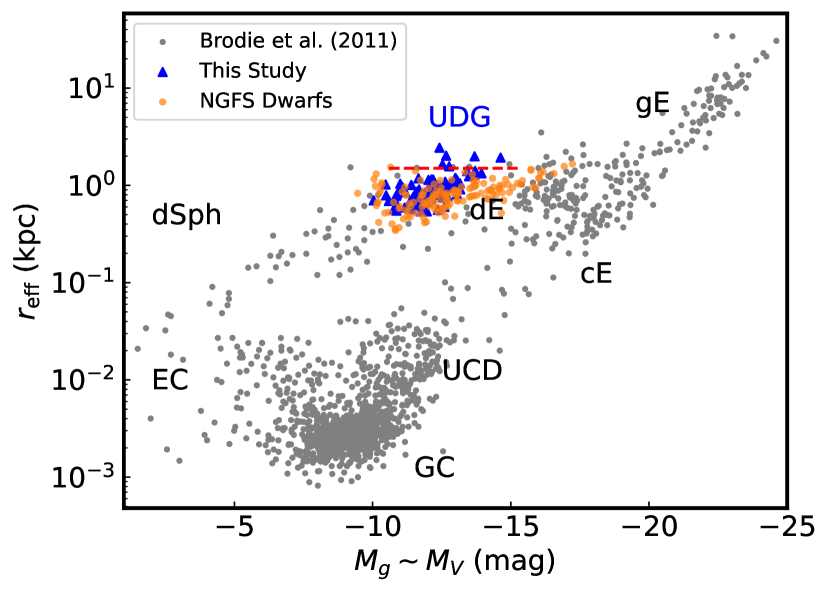
In this paper, we consider putative UDGs to have > 1.5 kpc. This allows us to make a direct comparison with previous studies. With this definition, we obtain six putative UDGs among our 78 SMUDGes UDG candidates, with five and one belonging to the Eridanus and NGC 1332 groups, respectively. WALLABY J033408232125 has > 1.1 kpc and hence will be considered as an LSB dwarf rather than a UDG in this work.333Note that if we were to consider the definition of kpc from the theoretical NIHAO simulation, the total number of putative UDGs would increase to 22 and WALLABY J033408232125 would be considered as a UDG instead based on its redshift. In Figure 3, we overplot our SMUDGes UDG candidates (LSB dwarfs + putative UDGs) onto the size–luminosity relation of dwarf galaxy populations (grey dots) compiled by Brodie et al. (2011)444https://sages.ucolick.org/spectral_database.html and the central dwarf galaxy population in the Next Generation Fornax Survey (NGFS; Eigenthaler et al., 2018). Brodie et al. (2011) samples are limited to objects that have confirmed distances either by spectroscopy, resolved stellar populations or surface brightness fluctuations. Our SMUDGes UDG candidates (LSB dwarfs + putative UDGs) sample extends to the fainter end of the dwarf Spheroidal (dSph) galaxies. The NGFS dwarf galaxy population (nucleated and non-nucleated) overlaps with the UDGs parameter space and is extended toward the brighter end of the dwarf Elliptical (dE). This has drawn some debate if UDGs are at the large end of the dwarf locus or are branching out into its own sequence. They are generally low-mass ( M⊙) and the majority of them are fairly red in colour ( as defined in Zaritsky et al., 2021). The median Sérsic index () is in the SMUDGes catalogue. This value is consistent with theoretical predictions (Jiang et al., 2019).
For non-H i detections, we calculate their upper H i mass limit () as follows:
| (2) |
where = 5 is the H i integrated flux, in Jy km s-1 and is the luminosity distance of 21 Mpc. We adopt a fiducial velocity width () of 30 km s-1 (see e.g., Jones et al., 2021). 1 noise level is calculated from 100 source free channels of each subcube that covers the velocity range of 680–2500 km s-1. We summarise the properties and physical parameters of our SMUDGes UDG candidates (LSB dwarfs + putative UDGs) sample in Table 1.
| ID | Designation | (J2000) | (J2000) | |||||||
|---|---|---|---|---|---|---|---|---|---|---|
| (deg) | (deg) | (mag) | (mag) | (M⊙) | (M⊙) | (arcsec) | (kpc) | |||
| (1) | (2) | (3) | (4) | (5) | (6) | (7) | (8) | (9) | (10) | (11) |
| Eridanus Group | ||||||||||
| 1 | SMDG 0336515242027 | 54.21476 | 24.34079 | 0.555 | 13.723 | 7.45 | < 7.55 | < 0.11 | 8.94 | 0.91 |
| 2 | SMDG 0337349241754 | 54.39532 | 24.29840 | 0.501 | 12.693 | 6.95 | < 7.56 | < 0.62 | 11.30 | 1.15 |
| 3 | SMDG 0335396240610 | 53.91490 | 24.10278 | 0.504 | 11.899 | 6.63 | < 7.55 | < 0.92 | 9.93 | 1.01 |
| 4 | SMDG 0335557240456 | 53.98221 | 24.08214 | 0.592 | 13.230 | 7.31 | < 7.55 | < 0.24 | 7.48 | 0.76 |
| 5 | SMDG 0335006240205 | 53.75237 | 24.03474 | 0.555 | 13.378 | 7.31 | < 7.55 | < 0.24 | 10.34 | 1.05 |
| 6 | SMDG 0342509235621 | 55.71210 | 23.93930 | 0.577 | 11.349 | 6.53 | < 7.66 | < 1.13 | 5.58 | 0.57 |
| 7 | SMDG 0340559235101 | 55.23296 | 23.85031 | 0.519 | 12.394 | 6.86 | < 7.67 | < 0.81 | 7.96 | 0.81 |
| 8 | SMDG 0338400234705 | 54.66684 | 23.78466 | 0.562 | 13.298 | 7.29 | < 7.64 | < 0.36 | 9.65 | 0.98 |
| 9 | SMDG 0342478234626 | 55.69903 | 23.77390 | 0.570 | 12.843 | 7.12 | < 7.66 | < 0.54 | 9.99 | 1.02 |
| 10 | SMDG 0339260234204 | 54.85834 | 23.70116 | 0.569 | 12.147 | 6.84 | < 7.66 | < 0.82 | 8.47 | 0.86 |
| 11 | SMDG 0336039233707 | 54.01629 | 23.61862 | 0.549 | 12.674 | 7.02 | < 7.58 | < 0.56 | 7.32 | 0.75 |
| 12 | SMDG 0345106232201 | 56.29428 | 23.36689 | 0.536 | 12.292 | 6.84 | < 7.63 | < 0.79 | 8.11 | 0.83 |
| 13 | SMDG 0334081232128‡ | 53.53354 | 23.35785 | 0.103 | 12.733 | 6.30 | 7.54 | 1.24 | 10.72 | 1.09 |
| 14 | SMDG 0338435231802 | 54.68114 | 23.30051 | 0.555 | 14.235 | 7.65 | < 7.63 | < 0.02 | 12.95 | 1.32 |
| 15 | SMDG 0338261231711† | 54.60877 | 23.28646 | 0.466 | 12.999 | 7.01 | < 7.64 | < 0.63 | 16.07 | 1.64 |
| 16 | SMDG 0341202231539 | 55.33436 | 23.26092 | 0.592 | 13.117 | 7.27 | < 7.63 | < 0.36 | 7.35 | 0.75 |
| 17 | SMDG 0339319231306 | 54.88274 | 23.21826 | 0.509 | 11.983 | 6.68 | < 7.63 | < 0.96 | 7.43 | 0.76 |
| 18 | SMDG 0332252231233 | 53.10507 | 23.20915 | 0.548 | 14.487 | 7.74 | < 7.54 | < 0.20 | 13.06 | 1.33 |
| 19 | SMDG 0336444231222 | 54.18518 | 23.20610 | 0.538 | 12.559 | 6.95 | < 7.62 | < 0.66 | 11.20 | 1.14 |
| 20 | SMDG 0337279231213 | 54.36616 | 23.20352 | 0.554 | 12.238 | 6.85 | < 7.63 | < 0.78 | 8.90 | 0.91 |
| 21 | SMDG 0341326231108 | 55.38587 | 23.18560 | 0.537∗ | 12.198∗ | 6.81 | < 7.62 | < 0.81 | 11.60 | 1.18 |
| 22 | SMDG 0341331230852 | 55.38812 | 23.14772 | 0.462 | 11.061 | 6.23 | < 7.61 | < 1.38 | 6.74 | 0.69 |
| 23 | SMDG 0335286230353 | 53.86915 | 23.06482 | 0.597∗ | 11.070∗ | 6.46 | < 7.58 | < 1.13 | 9.99 | 1.02 |
Note. This table is available in its entirety as Supporting Information with the electronic version of the paper. A portion is shown here for guidance regarding its form and content. : Putative UDG. : Also known as WALLABY J033408232125. : No bias correction due to being flagged as inaccurate (Zaritsky et al., 2022). : Within maximum radial extent of the NGC 1332 group but outside the WALLABY observed footprints. Col (1): Identification number. Cols (2)–(4): Designation, and (J2000) coordinates are based on the SMUDGes catalogue (Zaritsky et al., 2022). Col (5): Extinction and bias (if applicable) corrected magnitude. Col (6): Absolute magnitude in -band. Col (7): Stellar mass in logarithmic scale. Col (8): Upper limit of H i mass, with the exception of WALLABY J033408232125, in logarithmic scale. Col (9): Atomic gas fraction. Col (10): Effective radius in arcsec, which is derived using DR9 DESI Legacy Survey stacked images of -bands. Bias correction has been applied if applicable. Col (11): Effective radius in kpc for an assumed distance of 21 Mpc.
3 Analysis
3.1 Atomic Gas Fraction-Stellar Mass Scaling Relation
The atomic gas fraction () versus stellar mass () scaling relation allows us to understand the physical processes that regulate the conversion of gas into stars and drive the changes in galaxy morphology (see e.g., Janowiecki et al., 2017; Saintonge & Catinella, 2022).
The Extended Arecibo SDSS Survey (xGASS; Catinella et al., 2018) investigates this relation for a representative sample of 1200 galaxies, selected from the SDSS DR7 (Abazajian et al., 2009) by stellar mass and redshift only (9.0 < () < 11.5 and 0.01 < < 0.05), and observed down to a gas fraction limit of 2-10%, depending on . Its stellar mass selected H i sample shows a clear linear relation of increasing () with decreasing (), but it is unclear if the trend continues to rise below the () = 9.0 limit of the survey. Using the ALFALFA.40 sample with stellar masses derived from SDSS spectra and photometry, Maddox et al. (2015) show that the gas fraction follows the same trend as in the xGASS sample at higher stellar mass ( M⊙) but flattens out at the lower stellar mass end indicating a higher gas content in the low-mass regime.
To further investigate the trend in the low-mass regime, F21 compare various low-mass dwarf samples with the Maddox et al. (2015) empirical relations (see Figure 12 of F21). It is evident that the sub-sample of gas-rich Local Volume dwarfs selected from ALFALFA.40 in Huang et al. (2012) does not show the flattening trend as seen in Maddox et al. (2015). In Huang et al’s sub-sample, the atomic gas fraction continues to rise with decreasing . This is due to stellar masses in the ALFALFA.40 sample being underestimated for low-mass galaxies, which is a known issue with the SDSS reduction pipeline (Huang et al., 2012). The derived stellar masses via the spectral energy distribution (SED) fitting method in Huang et al. (2012) are higher by comparison. F21 show that the sample from the Survey of H i in Extremely Low-mass Dwarfs (SHIELD; McQuinn et al., 2021) also supports a non-flattening trend in the low-mass regime. The SHIELD sample mostly consists of isolated dwarf galaxies. It is unclear if the low-mass dwarf population in the Eridanus supergroup follows such a trend due to a lack of low-mass ( M⊙) galaxies in F21.
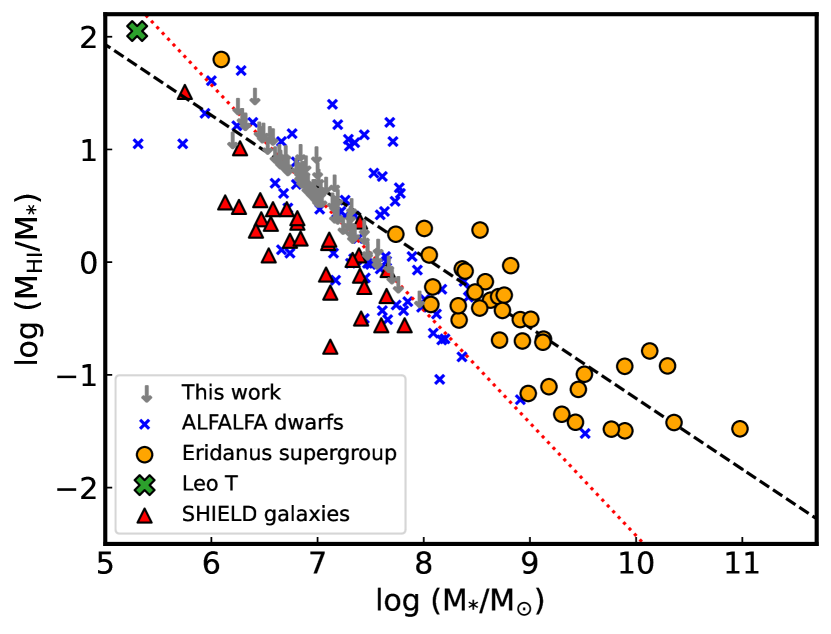
With a large number of low-mass galaxies in this study, we revisit the atomic gas fraction scaling relation in the low-mass regime of the Eridanus supergroup. In Figure 4, we show the distribution of the ALFALFA.40 sub-sample (blue crosses; Huang et al., 2012), the SHIELD sample (red triangles; McQuinn et al., 2021), the Eridanus supergroup sample (orange circles; F21), the Leo T dwarf galaxy (green cross; Adams & Oosterloo, 2018) and our SMUDGes UDG candidates (LSB dwarfs + putative UDGs) sample (grey points) on the atomic gas fraction scaling relation. The atomic gas fraction values for our SMUDGes UDG candidates (LSB dwarfs + putative UDGs) sample are set to be their upper limit with the exception of one H i detected LSB dwarf (see section 2.1). The dashed line is adopted from F21 and is for guidance only. Our sample falls along the WALLABY sensitivity limit line, which also lies within the scatter of the gas-rich dwarf population. We note that galaxies in the Eridanus supergroup are generally more H i-deficient as compared to galaxies in other galaxy groups (see e.g. For et al., 2019). Nevertheless, the finding of a non-flattening trend based on ALFALFA.40 sub-sample and SHIELD sample in the low-mass regime suggests that low-mass, high gas fraction galaxies might be rarer than expected. It is inconclusive regarding the flattening trend in the low-mass regime using our sample. It would be useful to revisit such relation in the low-mass regime with the full WALLABY survey in the future.
3.2 Gas Richness
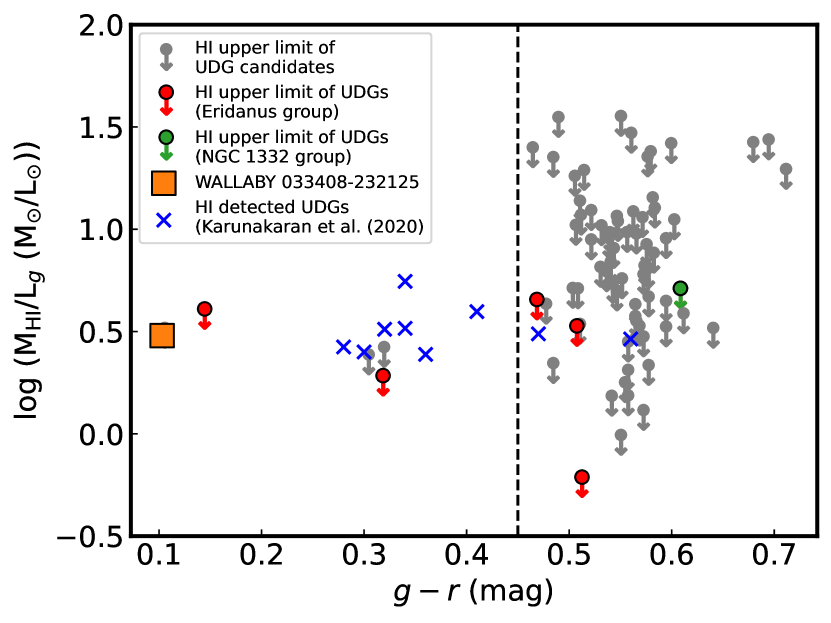
We investigate the gas richness of our SMUDGes UDG candidates (LSB dwarfs + putative UDGs) sample using distance independent measurements. In Figure 5 (top panel), we show the distribution of () versus . The H i upper limits of our sample are represented by the arrows, with six putative UDGs in red and green for the Eridanus and NGC 1332 groups, respectively. The H i detected UDGs in the Coma cluster (blue crosses; Karunakaran et al., 2020) and our H i detected LSB dwarf (orange square) are also shown. The dashed line represents that marks the blue and red color boundary. According to Karunakaran et al. (2020), H i detected UDGs are bluer and have more irregular morphologies, while the non-H i detected UDGs are redder and smoother in morphologies. We find that the two putative UDGs (red arrows) and two LSB dwarfs (grey arrows) with have a smooth morphology. While the sample is small, it is possible that different morphologies resulting from different evolutionary paths might affect the gas content of the UDGs. The majority () of putative UDGs and LSB dwarfs in this study are red in colour. This is not a surprise given that UDGs in denser environments tend to be redder (Kadowaki et al., 2021). The unusually blue colour of LSB dwarf, SMDG 0334081232128 (also known as WALLABY J033408232125), suggests ongoing star formation with a star formation rate estimated to be 0.0002 M⊙ yr-1 (F21).
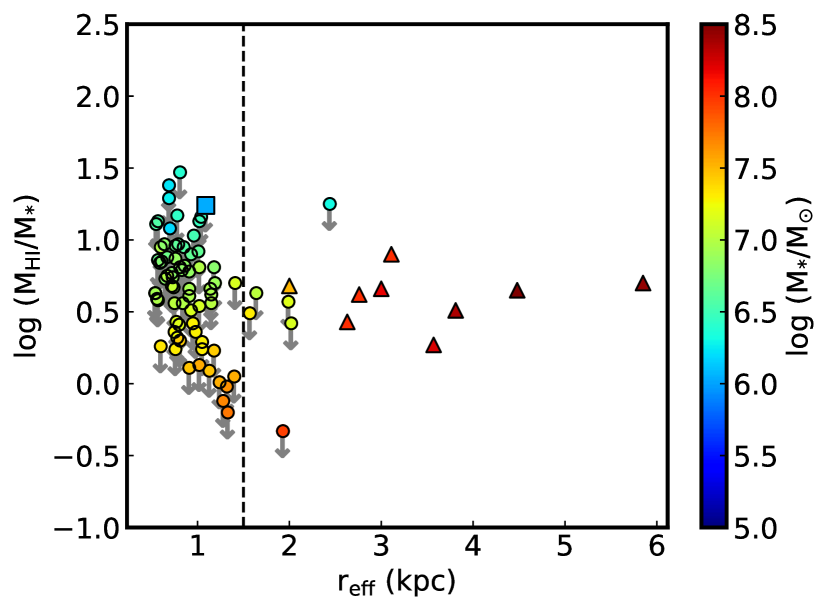
The bottom panel of Figure 5 shows the distribution of atomic gas fraction () versus with the colour scale representing stellar mass. The triangles, square and circles represent the H i detected UDGs in the Coma cluster (Karunakaran et al., 2020), LSB dwarfs with and without H i in our study, respectively. A scatter of 1 dex is present for kpc. There is no obvious trend beyond kpc but our sample size is small. UDGs in the Coma cluster are massive by comparison to our putative UDGs. The atomic gas fraction of Coma cluster UDGs also has ) < 1.0 indicating that the relative gas content is lower than our sample.
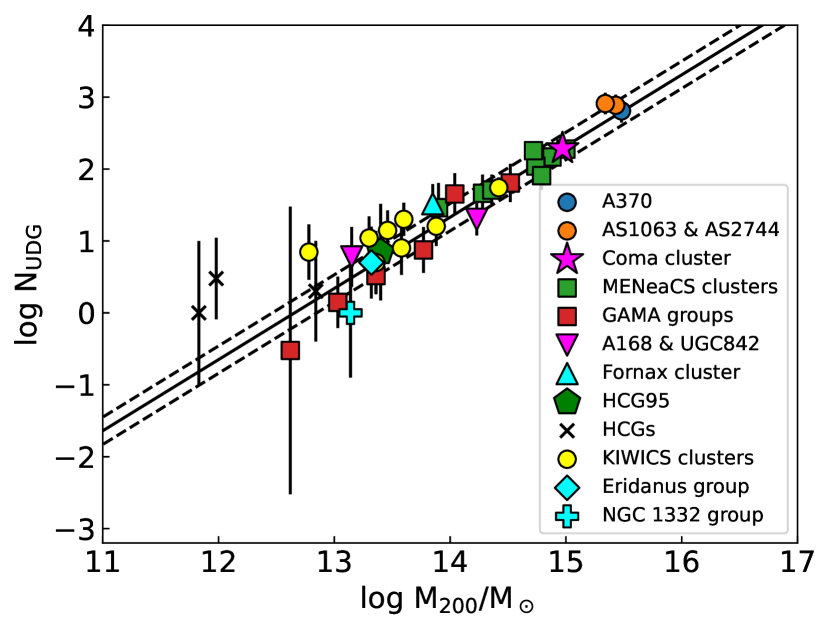
3.3 Number of UDGs and Virial Masses of their Host Halos
The number of UDGs () is known to have a power-law relation with the virial masses () of the host halos, (van der Burg et al., 2016; van der Burg et al., 2017; Janssens et al., 2017; Mancera Piña et al., 2018; Lee et al., 2020b). The power-law index, , gives an indication of how effectively a galaxy is formed and survives its environment. If , the number of galaxies is directly proportional to the mass of the host halo. In this case, these galaxies are not strongly affected by environmental effects. If , galaxies in low-density environments have relatively higher number densities per unit mass of their host halos. These galaxies are preferentially formed and survive in low-density environments (field or galaxy group). If , these galaxies are formed more efficiently or survive longer in high-density environments (cluster) (Lee et al., 2020b).
A list of UDG numbers and virial masses of galaxy groups and clusters has been compiled by Lee et al. (2020b) based on the same selection criteria as in this study. Lee et al. (2020b) fit the relation by considering the data points with M⊙, M⊙ and full range of . There are fewer data points for fitting the relation on host halos with M⊙ as there are fewer UDGs in low-mass halos. Using all available data in Lee et al. (2020b), we obtain a Pearson correlation coefficient of 0.94 indicating a tight correlation. Overall, their derived is close to 1, which suggests that the formation and survival of UDGs are less affected by the environment. However, we caution that the power-law fitting is affected by selection bias and small number statistics, especially for lower mass host halos. This is clearly demonstrated by using the GAMA group sample, where van der Burg et al. (2017) obtain . Their sample is also less abundant per unit halo mass than the Hickson Compact Groups (HCGs; Román & Trujillo, 2017b). The deviation might be due to the lack of UDGs in the GAMA groups and the group properties, as loose galaxy groups are not included in the HCGs.
Recently, Karunakaran & Zaritsky (2023) study the abundance of UDGs around 75 nearby Milky Way-like systems using literature satellite galaxy catalogues. Their investigation bolsters the low halo mass end of the UDG abundance relation and finds a slope of for this relation. Crucially, they demonstrate that there are various systematics (e.g. UDG definitions, photometric completeness, and host redshifts) between various UDG abundance studies in the literature that can affect the result slopes and highlight the need for more uniform studies of this trend. Nevertheless, as explained in their work, the majority of existing slopes hover around a slope of unity and imply little to no effect of the environment on UDG abundance.
To predict the number of UDGs in the Eridanus supergroup, we apply the power-law relation (with =0.99) in Lee et al. (2020b) to the halo masses of the NGC 1407 ( M⊙), NGC 1332 ( M⊙) and Eridanus ( M⊙) groups as listed in Brough et al. (2006). We obtain = 3, 5 and 17 for the NGC 1332, Eridanus and NGC 1407 groups, respectively. Our sample yields , and putative UDGs for the NGC 1332, Eridanus and NGC 1407 groups, respectively. The uncertainties are based on the Poisson statistics. Taking into account the uncertainties in halo masses, the predicted numbers of UDGs for the NGC 1332 and Eridanus groups are consistent with our finding (assuming the projected distance of 21 Mpc). However, the number of UDGs in the NGC 1407 group is lower than the number predicted by the power-law relation (). This is not a surprise given that the number of SMUDGes UDG candidates in the NGC 1407 group is small to begin with (refer to Figure 1). In Figure 6, we show the relation between and for a sample of groups and clusters, including the new data. The fit suggests = 0.99.
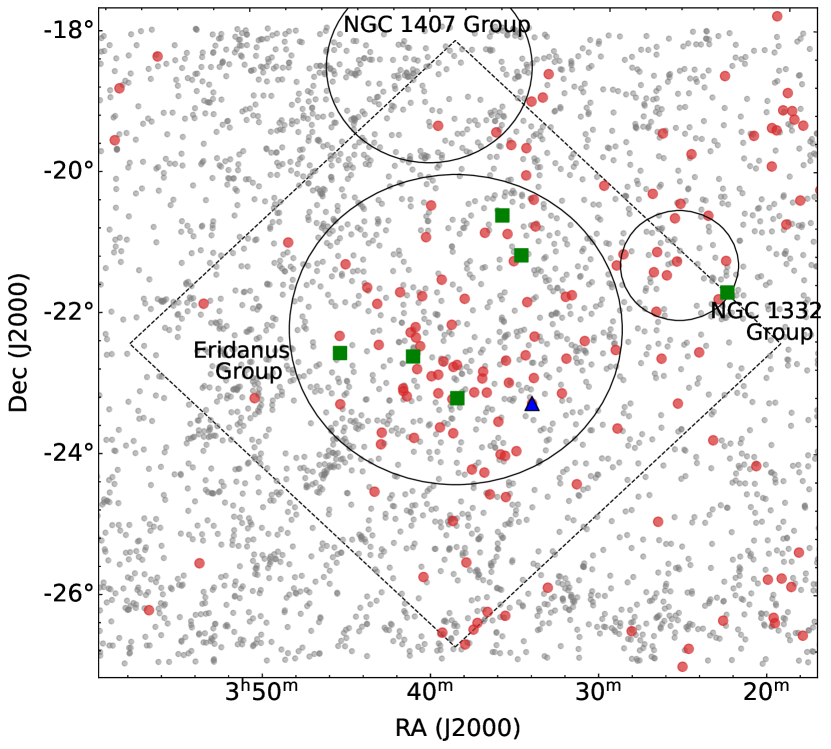
To investigate if spatial density might contribute to a higher number of SMUDGes UDG candidates in different groups, we plot the spatial projected distribution of galaxies in the region of the Eridanus supergroup (grey dots) in Figure 7. These galaxies are extracted from the 2MASS All-Sky Extended Catalogue (XSC; Jarrett et al., 2000). Our putative UDGs and H i detected LSB dwarf are represented by green squares and a blue triangle, respectively. The non-H i detected LSB dwarfs and other SMUDGes UDG candidates in the Eridanus field are represented by red dots. We find that the density of LSB dwarfs (initially as SMUDGes UDG candidates) in the Eridanus field is at its highest in the Eridanus group as compared to the NGC 1407 and NGC 1332 groups. The projected locations of putative UDGs do not show a correlation with the density of LSB dwarfs. The slightly different environments between these groups could explain the actual number of UDGs in the groups.
The NGC 1407 group has a centroid located 16 kpc from the large elliptical galaxy NGC 1407 (Brough et al., 2006). It is the only group in the supergroup that contains X-ray emission. Due to its high mass-to-light ratio, low spiral fraction and symmetric intragroup X-ray emission, it is considered to be virialised. The higher X-ray luminosity of the NGC 1407 group compared to other galaxy groups (Miles et al., 2004) also suggests that the NGC 1407 group is dynamically stable. While NGC 1407 group is not a cluster, the presence of X-ray emission and a large fraction of early-type galaxies suggest that its evolutionary stage is more consistent with galaxy clusters (where UDGs are gas-poor) than young galaxy groups. On the contrary, the Eridanus group is not centred on any particular galaxy. Its centroid is 300 kpc from the brightest elliptical galaxy (NGC 1395) in the group. It is a loose and dynamically young group that is yet to reach a stable stage of evolution (F21).
The centroid of the NGC 1332 group is 43 kpc from the brightest lenticular galaxy (NGC 1332). It lacks X-ray emission because it is not hot enough in a low-density environment and as a virialised low-mass group. It is also not as dynamically mature as the NGC 1407 group (Brough et al., 2006). The formation of UDGs is possibly ongoing in the NGC 1332 and Eridanus groups. If satellite accretion is one of the formation mechanisms for UDGs to exist in the Eridanus supergroup, it might explain why the mature group has fewer UDG candidates to begin with as they might have been disrupted or merged into the central galaxy. Further simulations might shed some light on the number of UDGs in various evolutionary stages of galaxy group. There are also only a few foreground galaxies (based on spectroscopic redshift) within the Eridanus field. Their large projected distances with our putative UDGs would make them unlikely to be the host galaxy.
3.4 Tidal or Ram-Pressure Stripping
Comparison of UDGs in the NIHAO simulations and in the simulation of a galaxy group (Jiang et al., 2019) shows that satellite UDGs are mostly quiescent and gas-poor. In this scenario, satellite UDGs are presumably puffed up in the field and later quenched when falling into a dense environment. The main quenching mechanisms in galaxy groups are tidal and/or ram-pressure stripping. If the tidal mechanism is dominant, the gas will be stripped and the stars will be removed from the outskirts of the satellite UDGs, which reduces their and . We would also expect to be lower for UDGs closer to the group centre due to stronger tidal effects. The studies of UDGs in HCGs (Román & Trujillo, 2017b) and in the Coma cluster (Alabi et al., 2018) support this scenario, with red UDGs predominantly located closer to the group and cluster centres.
In general, the NIHAO simulation is consistent with the observations of UDGs being quiescent (red) in the inner part of the galaxy groups and star-forming (bluer) toward the outskirts of the galaxy groups. However, simulations do not show an obvious radial gradient in size or stellar mass, which suggests that tidal stripping might not be the dominant mechanism in quenching the UDGs in groups (Jiang et al., 2019). Following the evolutionary paths of satellite UDGs in simulations, Jiang et al. (2019) show that tidally induced puffing is only partially responsible for the lack of radial extent, and the change in stellar mass is small. While the sample is small, our study with the five putative UDGs in the Eridanus group neither show colour nor stellar mass vs projected distance correlations. There are no such correlations for the rest of our LSB dwarfs either, which supports the scenario of UDGs being formed via accretion in the Eridanus and NGC 1332 groups.
To investigate if our putative UDGs have experienced tidal heating, tidal or ram-pressure stripping origin, we search for any bright galaxies within 2′ radius around them. While UDGs with tidal origin are generally located close (< 20 kpc projected distance) to their parent galaxies (see e.g., Jones et al., 2021), they potentially form as far as 40 kpc in projected distance from their progenitors (see e.g., Iodice et al., 2020). We find that SMDG 0345097223826 appears to be located at the tail end of a stellar stream of 6dFGS J034506.0223632 (see Figure 8). There is also a fairly blue spiral galaxy, LEDA 811216, that is located south of 6dFGS J034506.0223632 and alongside the stellar stream. The location of LEDA 811216 could be a projection effect or it could in fact be interacting with 6dFGS J034506.022363. We retrieve the spectroscopic and photometric redshifts of (Jones et al., 2009) and (Zhou et al., 2021) for 6dFGS J034506.022363 and LEDA 811216, respectively.
The photometric redshift error is built upon with a few assumptions and using the random forest regression routine of a machine learning library, Scikit-Learn (Pedregosa et al., 2011). It is subject to the training sets and does not include incompleteness in the training data or uncertainties in morphological parameters. Luminous red galaxies (LRGs) are the main sample in the study of Zhou et al. (2021), which is biased toward higher redshift and redder objects. LEDA 811216 is relatively blue with . Hence, the quoted photometric redshift of LEDA 811216 is unlikely to be accurate.
The slight disruption on the optical morphology of LEDA 811216 suggests that this pair is interacting. We do not find any H i in any of our velocity ranges at their locations. If SMDG 0345097223826 is associated with 6dFGS J034506.0223632, we can rule out that it is a member of the Eridanus group. At that redshift distance, SMDG 0345097223826 would be considered to be large in size ( > 13 kpc). We can not verify the nature and origin of SMDG 0345097223826 without follow-up spectroscopic redshift observation.
4 Summary and Future Work
We use the WALLABY pre-pilot survey data of the Eridanus field (F21) to search for H i in optically-identified UDG candidates in the third release of the SMUDGes catalogue (Zaritsky et al., 2022). There are 78 UDG candidates within the maximum radial extents of the Eridanus subgroups and there is only one reliable H i detection. The detection is a confirmed member of the Eridanus group (see F21). We investigate the properties and derive the physical parameters of these SMUDGes UDG candidates. Using kpc and 24 mag arcsec-2 as the definition of a UDG, we obtain six putative UDGs. The rest is classified as LSB dwarfs. We also find that our SMUDGes UDG candidates (LSB dwarfs + putative UDGs) sample is generally low-mass ( M⊙) and most of them are fairly red in colour ().
It is inconclusive if our SMUDGes UDG candidates (LSB dwarfs + putative UDGs) sample yields a flattening trend at the low-mass regime while examining the versus scaling relation. The distribution of gas richness versus colour shows no correlation in our SMUDGes UDG candidates (LSB dwarfs + putative UDGs) sample. The two putative UDGs and two LSB dwarfs that have appear to have smoother optical morphology. There is no H i detection among them. This supports the finding of Karunakaran et al. (2020), which states that the optical morphology is also an important parameter when looking for H i in UDGs.
We adopt the derived power-law relation of UDG number and the virial mass of their host halo in Lee et al. (2020b) to obtain the predicted numbers of UDGs for the Eridanus subgroups. Lee et al. (2020b) predict 3, 5 and 17 for the NGC 1332, Eridanus and NGC 1407 groups, respectively. The corresponding numbers of putative UDGs are , and . The lack of putative UDGs in the NGC 1407 group is likely due to the evolutionary stage of that group. We investigate if tidal or ram-pressure stripping is a possible formation mechanism for UDGs in the Eridanus supergroup. We find a putative UDG (SMDG 0345097223826) that could have been formed via tidal heating/interaction as it is located at the tail end of a stellar stream. If that was the case, this putative UDG would likely be a background UDG and would not be associated with the Eridanus group.
It is known that the gas content of galaxies in the group environment is more diverse as it depends on the evolutionary stages of the group. To understand if such variation is also observed for UDGs in groups, we conduct a pilot study of H i content of SMUDGes UDG candidates in the Eridanus supergroup using the WALLABY data in conjunction with deep optical images and catalogue. To extend what to expect for the WALLABY full survey, we cross-match the full WALLABY survey area with the third release of the SMUDGes catalogue (Zaritsky et al., 2022). We find 1750 SMUDGes UDG candidates within the overlapping survey area. With one H i detection out of 78 SMUDGes UDG candidates, we could expect 22 H i detections as the lower limit for the full WALLABY survey. There are WALLABY survey areas that are currently not covered by the DR9 DESI Legacy Survey, which is the third release of the SMUDGes catalogue based on. In addition, we expect the H i detection rate to be higher in the isolated and loose group environments. The H i redshift of isolate detections would be of great benefit as these are difficult to associate with local overdensities. In the future, this study will be expanded by using WALLABY current released pilot and full survey data, which will allow us to probe the H i content and UDG formation channels across environments.
Acknowledgements
This research was supported by the Australian Research Council Centre of Excellence for All Sky Astrophysics in 3 Dimensions (ASTRO 3D),
through project number CE170100013.
This scientific work uses data obtained from Inyarrimanha Ilgari Bundara / the Murchison Radio-astronomy Observatory.
We acknowledge the Wajarri Yamaji People as the Traditional Owners and native title holders of the Observatory site.
CSIRO’s ASKAP radio telescope is part of the Australia Telescope National Facility (https://ror.org/05qajvd42).
Operation of ASKAP is funded by the Australian Government with support from the National Collaborative Research Infrastructure Strategy.
ASKAP uses the resources of the Pawsey Supercomputing Research Centre. Establishment of ASKAP, Inyarrimanha Ilgari Bundara,
the CSIRO Murchison Radio-astronomy Observatory and the Pawsey Supercomputing Research Centre are initiatives of the Australian Government,
with support from the Government of Western Australia and the Science and Industry Endowment Fund.
This research has made use of images of the Legacy Surveys. The Legacy Surveys consist of three individual and
complementary projects: the Dark Energy Camera Legacy Survey (DECaLS; Proposal ID #2014B-0404; PIs: David Schlegel and Arjun Dey),
the Beijing-Arizona Sky Survey (BASS; NOAO Prop. ID #2015A-0801; PIs: Zhou Xu and Xiaohui Fan), and the Mayall z-band Legacy Survey
(MzLS; Prop. ID #2016A-0453; PI: Arjun Dey). DECaLS, BASS and MzLS together include data obtained, respectively, at the Blanco telescope,
Cerro Tololo Inter-American Observatory, NSF’s NOIRLab; the Bok telescope, Steward Observatory,
University of Arizona; and the Mayall telescope, Kitt Peak National Observatory, NOIRLab.
The Legacy Surveys project is honored to be permitted to conduct astronomical research on Iolkam Du’ag (Kitt Peak),
a mountain with particular significance to the Tohono O’odham Nation.
We thank the anonymous referee for their constructive comments to improve this manuscript. BQF thanks A. Bosma, A. Boselli, B. Holwerda, A. López-Sánchez, K. McQuinn, G. Muerer, J. Román and P. Zuo for their comments on the manuscript. KS acknowledges support from the Natural Sciences and Engineering Research Council of Canada (NSERC). AK acknowledges financial support from the grant CEX2021-001131-S funded by MCIN/AEI/ 10.13039/501100011033 and from the grant POSTDOC_21_00845 funded by the Economic Transformation, Industry, Knowledge and Universities Council of the Regional Government of Andalusia and financial support from the grant PID2021-123930OB-C21 funded by MCIN/AEI/ 10.13039/501100011033, by “ERDF A way of making Europe” and by the "European Union". DZ and RD gratefully acknowledge financial support for SMUDGes from NSF AST-1713841 and AST-2006785. DZ thanks the Astronomy Department at Columbia University for their gracious welcome during his sabbatical.
Data availability
The data underlying this article are available in the article and in its online supplementary material. The processed ASKAP data can be retrieved via CSIRO ASKAP Science Data Archive (CASDA) with a given scheduling block identification number. The DOI for the Eridanus data is https://dx.doi.org/10.25919/0yc5-f769.
References
- Abazajian et al. (2009) Abazajian K. N., et al., 2009, ApJS, 182, 543
- Abraham & van Dokkum (2014) Abraham R. G., van Dokkum P. G., 2014, PASP, 126, 55
- Adams & Oosterloo (2018) Adams E. A. K., Oosterloo T. A., 2018, A&A, 612, A26
- Alabi et al. (2018) Alabi A., et al., 2018, MNRAS, 479, 3308
- Amorisco & Loeb (2016) Amorisco N. C., Loeb A., 2016, MNRAS, 459, L51
- Baker (1933) Baker R. H., 1933, Annals of Harvard College Observatory, 88, 77
- Barnes et al. (2001) Barnes D. G., et al., 2001, MNRAS, 322, 486
- Beasley & Trujillo (2016) Beasley M. A., Trujillo I., 2016, ApJ, 830, 23
- Beasley et al. (2016) Beasley M. A., Romanowsky A. J., Pota V., Navarro I. M., Martinez Delgado D., Neyer F., Deich A. L., 2016, ApJ, 819, L20
- Bellazzini et al. (2017) Bellazzini M., Belokurov V., Magrini L., Fraternali F., Testa V., Beccari G., Marchetti A., Carini R., 2017, MNRAS, 467, 3751
- Bennet et al. (2018) Bennet P., Sand D. J., Zaritsky D., Crnojević D., Spekkens K., Karunakaran A., 2018, ApJ, 866, L11
- Bothun et al. (1991) Bothun G. D., Impey C. D., Malin D. F., 1991, ApJ, 376, 404
- Boylan-Kolchin et al. (2012) Boylan-Kolchin M., Bullock J. S., Kaplinghat M., 2012, MNRAS, 422, 1203
- Brodie et al. (2011) Brodie J. P., Romanowsky A. J., Strader J., Forbes D. A., 2011, AJ, 142, 199
- Brough et al. (2006) Brough S., Forbes D. A., Kilborn V. A., Couch W., Colless M., 2006, MNRAS, 369, 1351
- Carleton et al. (2021) Carleton T., Guo Y., Munshi F., Tremmel M., Wright A., 2021, MNRAS, 502, 398
- Catinella et al. (2018) Catinella B., et al., 2018, MNRAS, 476, 875
- Chabrier (2003) Chabrier G., 2003, PASP, 115, 763
- Chilingarian et al. (2019) Chilingarian I. V., Afanasiev A. V., Grishin K. A., Fabricant D., Moran S., 2019, ApJ, 884, 79
- Conselice (2018) Conselice C. J., 2018, Research Notes of the American Astronomical Society, 2, 43
- Dalcanton et al. (1997) Dalcanton J. J., Spergel D. N., Gunn J. E., Schmidt M., Schneider D. P., 1997, AJ, 114, 635
- Dey et al. (2019) Dey A., et al., 2019, AJ, 157, 168
- Di Cintio et al. (2017) Di Cintio A., Brook C. B., Dutton A. A., Macciò A. V., Obreja A., Dekel A., 2017, MNRAS, 466, L1
- Eigenthaler et al. (2018) Eigenthaler P., et al., 2018, ApJ, 855, 142
- Emsellem et al. (2019) Emsellem E., et al., 2019, A&A, 625, A76
- For et al. (2019) For B. Q., et al., 2019, MNRAS, 489, 5723
- For et al. (2021) For B. Q., et al., 2021, MNRAS, 507, 2300
- Forbes et al. (2020) Forbes D. A., Alabi A., Romanowsky A. J., Brodie J. P., Arimoto N., 2020, MNRAS, 492, 4874
- Giovanelli et al. (2005) Giovanelli R., et al., 2005, AJ, 130, 2598
- Habas et al. (2020) Habas R., et al., 2020, MNRAS, 491, 1901
- Hotan et al. (2021) Hotan A. W., et al., 2021, Publ. Astron. Soc. Australia, 38, e009
- Huang et al. (2012) Huang S., Haynes M. P., Giovanelli R., Brinchmann J., Stierwalt S., Neff S. G., 2012, AJ, 143, 133
- Impey et al. (1988) Impey C., Bothun G., Malin D., 1988, ApJ, 330, 634
- Iodice et al. (2020) Iodice E., et al., 2020, A&A, 642, A48
- Iodice et al. (2021) Iodice E., et al., 2021, A&A, 652, L11
- Janowiecki et al. (2017) Janowiecki S., Catinella B., Cortese L., Saintonge A., Brown T., Wang J., 2017, MNRAS, 466, 4795
- Janowiecki et al. (2019) Janowiecki S., Jones M. G., Leisman L., Webb A., 2019, MNRAS, 490, 566
- Janssens et al. (2017) Janssens S., Abraham R., Brodie J., Forbes D., Romanowsky A. J., van Dokkum P., 2017, ApJ, 839, L17
- Janssens et al. (2022) Janssens S. R., et al., 2022, MNRAS, 517, 858
- Jarrett et al. (2000) Jarrett T. H., Chester T., Cutri R., Schneider S., Skrutskie M., Huchra J. P., 2000, AJ, 119, 2498
- Jiang et al. (2019) Jiang F., Dekel A., Freundlich J., Romanowsky A. J., Dutton A. A., Macciò A. V., Di Cintio A., 2019, MNRAS, 487, 5272
- Johnston et al. (2007) Johnston S., et al., 2007, Publ. Astron. Soc. Australia, 24, 174
- Jones et al. (2004) Jones D. H., et al., 2004, MNRAS, 355, 747
- Jones et al. (2009) Jones D. H., et al., 2009, MNRAS, 399, 683
- Jones et al. (2021) Jones M. G., Bennet P., Mutlu-Pakdil B., Sand D. J., Spekkens K., Crnojević D., Karunakaran A., Zaritsky D., 2021, ApJ, 919, 72
- Junais et al. (2022) Junais et al., 2022, A&A, 667, A76
- Kado-Fong et al. (2022) Kado-Fong E., Greene J. E., Huang S., Goulding A., 2022, ApJ, 941, 11
- Kadowaki et al. (2017) Kadowaki J., Zaritsky D., Donnerstein R. L., 2017, ApJ, 838, L21
- Kadowaki et al. (2021) Kadowaki J., Zaritsky D., Donnerstein R. L., RS P., Karunakaran A., Spekkens K., 2021, ApJ, 923, 257
- Karunakaran & Zaritsky (2023) Karunakaran A., Zaritsky D., 2023, MNRAS, 519, 884
- Karunakaran et al. (2020) Karunakaran A., Spekkens K., Zaritsky D., Donnerstein R. L., Kadowaki J., Dey A., 2020, ApJ, 902, 39
- Kleiner et al. (2019) Kleiner D., et al., 2019, MNRAS, p. 2001
- Koda et al. (2015) Koda J., Yagi M., Yamanoi H., Komiyama Y., 2015, ApJ, 807, L2
- Koribalski et al. (2020) Koribalski B. S., et al., 2020, Ap&SS, 365, 118
- Lee et al. (2017) Lee M. G., Kang J., Lee J. H., Jang I. S., 2017, ApJ, 844, 157
- Lee et al. (2020a) Lee C. H., Hodges-Kluck E., Gallo E., 2020a, MNRAS, 497, 2759
- Lee et al. (2020b) Lee J. H., Kang J., Lee M. G., Jang I. S., 2020b, ApJ, 894, 75
- Leisman et al. (2017) Leisman L., et al., 2017, ApJ, 842, 133
- Lim et al. (2020) Lim S., et al., 2020, ApJ, 899, 69
- Maddox et al. (2015) Maddox N., Hess K. M., Obreschkow D., Jarvis M. J., Blyth S. L., 2015, MNRAS, 447, 1610
- Mancera Piña et al. (2018) Mancera Piña P. E., Peletier R. F., Aguerri J. A. L., Venhola A., Trager S., Choque Challapa N., 2018, MNRAS, 481, 4381
- Mancera Piña et al. (2020) Mancera Piña P. E., et al., 2020, MNRAS, 495, 3636
- Marleau et al. (2021) Marleau F. R., et al., 2021, A&A, 654, A105
- Martín-Navarro et al. (2019) Martín-Navarro I., et al., 2019, MNRAS, 484, 3425
- Martin et al. (2019) Martin G., et al., 2019, MNRAS, 485, 796
- McQuinn et al. (2021) McQuinn K. B. W., et al., 2021, ApJ, 918, 23
- Merritt et al. (2016) Merritt A., van Dokkum P., Danieli S., Abraham R., Zhang J., Karachentsev I. D., Makarova L. N., 2016, ApJ, 833, 168
- Mihos et al. (2015) Mihos J. C., et al., 2015, ApJ, 809, L21
- Miles et al. (2004) Miles T. A., Raychaudhury S., Forbes D. A., Goudfrooij P., Ponman T. J., Kozhurina-Platais V., 2004, MNRAS, 355, 785
- Murugeshan et al. (2021) Murugeshan C., et al., 2021, MNRAS
- Omar & Dwarakanath (2005) Omar A., Dwarakanath K. S., 2005, Journal of Astrophysics and Astronomy, 26, 1
- Papastergis et al. (2017) Papastergis E., Adams E. A. K., Romanowsky A. J., 2017, A&A, 601, L10
- Pedregosa et al. (2011) Pedregosa F., et al., 2011, Journal of Machine Learning Research, 12, 2825
- Prole et al. (2019) Prole D. J., van der Burg R. F. J., Hilker M., Davies J. I., 2019, MNRAS, 488, 2143
- Prole et al. (2021) Prole D. J., van der Burg R. F. J., Hilker M., Spitler L. R., 2021, MNRAS, 500, 2049
- Román & Trujillo (2017a) Román J., Trujillo I., 2017a, MNRAS, 468, 703
- Román & Trujillo (2017b) Román J., Trujillo I., 2017b, MNRAS, 468, 4039
- Román et al. (2021) Román J., Jones M. G., Montes M., Verdes-Montenegro L., Garrido J., Sánchez S., 2021, A&A, 649, L14
- Rong et al. (2017) Rong Y., Guo Q., Gao L., Liao S., Xie L., Puzia T. H., Sun S., Pan J., 2017, MNRAS, 470, 4231
- Ruiz-Lara et al. (2018) Ruiz-Lara T., et al., 2018, MNRAS, 478, 2034
- Saintonge & Catinella (2022) Saintonge A., Catinella B., 2022, ARA&A, 60, 319
- Sawala et al. (2016) Sawala T., et al., 2016, MNRAS, 457, 1931
- Scott et al. (2021) Scott T. C., Sengupta C., Lagos P., Chung A., Wong O. I., 2021, MNRAS, 503, 3953
- Serra et al. (2015) Serra P., et al., 2015, MNRAS, 448, 1922
- Shi et al. (2017) Shi D. D., et al., 2017, ApJ, 846, 26
- Spekkens & Karunakaran (2018) Spekkens K., Karunakaran A., 2018, ApJ, 855, 28
- Spergel et al. (2007) Spergel D. N., et al., 2007, ApJS, 170, 377
- Tran et al. (2009) Tran K.-V. H., Saintonge A., Moustakas J., Bai L., Gonzalez A. H., Holden B. P., Zaritsky D., Kautsch S. J., 2009, ApJ, 705, 809
- Venhola et al. (2017) Venhola A., et al., 2017, A&A, 608, A142
- Wang et al. (2015) Wang L., Dutton A. A., Stinson G. S., Macciò A. V., Penzo C., Kang X., Keller B. W., Wadsley J., 2015, MNRAS, 454, 83
- Wang et al. (2022) Wang S., et al., 2022, ApJ, 927, 66
- Westmeier et al. (2021) Westmeier T., et al., 2021, MNRAS,
- Willmer (2018) Willmer C. N. A., 2018, ApJS, 236, 47
- Willmer et al. (1989) Willmer C. N. A., Focardi P., da Costa L. N., Pellegrini P. S., 1989, AJ, 98, 1531
- Wolfinger et al. (2016) Wolfinger K., Kilborn V. A., Ryan-Weber E. V., Koribalski B. S., 2016, Publ. Astron. Soc. Australia, 33, e038
- Wong et al. (2021) Wong O. I., et al., 2021, MNRAS, 507, 2905
- Wright et al. (2021) Wright A. C., Tremmel M., Brooks A. M., Munshi F., Nagai D., Sharma R. S., Quinn T. R., 2021, MNRAS, 502, 5370
- Yagi et al. (2016) Yagi M., Koda J., Komiyama Y., Yamanoi H., 2016, ApJS, 225, 11
- Yozin & Bekki (2015) Yozin C., Bekki K., 2015, MNRAS, 452, 937
- Zaritsky (2017) Zaritsky D., 2017, MNRAS, 464, L110
- Zaritsky et al. (2019) Zaritsky D., et al., 2019, ApJS, 240, 1
- Zaritsky et al. (2021) Zaritsky D., Donnerstein R., Karunakaran A., Barbosa C. E., Dey A., Kadowaki J., Spekkens K., Zhang H., 2021, ApJS, 257, 60
- Zaritsky et al. (2022) Zaritsky D., Donnerstein R., Karunakaran A., Barbosa C. E., Dey A., Kadowaki J., Spekkens K., Zhang H., 2022, ApJS, 261, 11
- Zhou et al. (2021) Zhou R., et al., 2021, MNRAS, 501, 3309
- Zibetti et al. (2009) Zibetti S., Charlot S., Rix H.-W., 2009, MNRAS, 400, 1181
- da Costa et al. (1988) da Costa L. N., et al., 1988, ApJ, 327, 544
- de Vaucouleurs (1975) de Vaucouleurs G., 1975, Nearby Groups of Galaxies. University of Chicago Press, p. 557
- van Dokkum et al. (2015) van Dokkum P. G., Abraham R., Merritt A., Zhang J., Geha M., Conroy C., 2015, ApJ, 798, L45
- van der Burg et al. (2016) van der Burg R. F. J., Muzzin A., Hoekstra H., 2016, A&A, 590, A20
- van der Burg et al. (2017) van der Burg R. F. J., et al., 2017, A&A, 607, A79
Supporting information
Additional Supporting Information can be found in the online version of this article.
Table 1: Properties and derived parameters of selected SMUDGes sample.