From Out of the Blue: Swift Links 2002es-like, 2003fg-like, and Early-Time Bump Type Ia Supernovae
Abstract
We collect a sample of 42 SNe Ia with Swift UV photometry and well-measured early-time light curve rises and find that 2002es-like and 2003fg-like SNe Ia have different pre-peak UV color evolutions compared to normal SNe Ia and other spectroscopic subtypes. Specifically, 2002es-like and 2003fg-like SNe Ia are cleanly separated from other SNe Ia subtypes by mag at days relative to -band maximum. Furthermore, the SNe Ia that exhibit non-monotonic bumps in their rising light curves, to date, consist solely of 2002es-like and 2003fg-like SNe Ia. We also find that SNe Ia with two-component power-law rises are more luminous than SNe Ia with single-component power-law rises at pre-peak epochs. Given the similar UV colors, along with other observational similarities, we discuss a possible progenitor scenario that places 2002es-like and 2003fg-like SNe Ia along a continuum and may explain the unique UV colors, early-time bumps, and other observational similarities between these objects. Ultimately, further observations of both subtypes, especially in the near-infrared, are critical for constraining models of these peculiar thermonuclear explosions.
1 Introduction
Type Ia Supernovae (SNe Ia) are important astrophysical explosions that drive chemical enrichment (Matteucci & Recchi, 2001), produce heavy elements (Raiteri et al., 1996), and enable precise distance determinations (Phillips, 1993; Riess et al., 1998; Perlmutter et al., 1999; Phillips et al., 1999; Burns et al., 2018). Despite many large SNe Ia data sets (recent examples include Holoien et al., 2017a, b, c, 2019; Jones et al., 2019; Phillips et al., 2019; Fremling et al., 2020; Burns et al., 2021; Jones et al., 2021; Neumann et al., 2023; Peterson et al., 2023 and Do et al. 2023 in prep.) and numerous theoretical models (e.g., Nomoto 1982; Khokhlov 1991; Woosley & Weaver 1994; Röpke & Niemeyer 2007; Kashi & Soker 2011; Woosley & Kasen 2011; Thompson 2011; Pakmor et al. 2012; Hoeflich et al. 2017), the progenitor systems of SNe Ia are not yet comprehensively connected to observations (reviews include Maoz et al. 2014, Livio & Mazzali 2018, and Jha et al. 2019). While there is broad consensus that SNe Ia originate from carbon-oxygen white dwarf stars (CO WDs; Hoyle & Fowler 1960), theoretical models struggle to replicate all of the observed diversity of SNe Ia (Maoz et al., 2014; Livio & Mazzali, 2018).
Several progenitor scenarios may explain the origin of SNe Ia, including the single-degenerate (SD), double-degenerate (DD), and core-degenerate (CD) scenarios. The SD scenario consists of a CO WD with a non-degenerate companion such as a main sequence or red giant star (e.g., Whelan & Iben, 1973), the DD scenario consists of two CO WDs or a CO WD and a He WD (e.g., Nomoto, 1980), and the CD scenario consists of a CO WD and a degenerate CO core of an AGB star (e.g., Hoeflich & Khokhlov, 1996).
A variety of explosion mechanisms for each progenitor scenario may produce SNe Ia below, at, or above the Chandrasekhar mass. In either the SD or DD progenitor scenario, material from a companion can accrete onto the CO WD. It can trigger an explosion through central carbon ignition as the CO WD approaches the Chandrasekhar mass (Hoyle & Fowler, 1960; Whelan & Iben, 1973; Nomoto, 1982; Piersanti et al., 2003) or through a He detonation on the surface of a CO WD below the Chandrasekhar mass (Nomoto, 1980; Livne, 1990; Woosley & Weaver, 1994; Hoeflich & Khokhlov, 1996; Hoeflich et al., 2017; Polin et al., 2019). In addition to the aforementioned explosion mechanisms, the DD scenario has additional explosion mechanisms which include mergers below, at, or above (Iben & Tutukov, 1984; Webbink, 1984; van Kerkwijk et al., 2010; Scalzo et al., 2010; Pakmor et al., 2010, 2013; Kromer et al., 2013, 2016) and third- or fourth-body induced collisions (Thompson, 2011; Shappee & Thompson, 2013; Pejcha et al., 2013). Finally, the CD scenario may explode via the merger of a degenerate CO core of an asymptotic giant branch (AGB) star and a CO WD (Hoeflich & Khokhlov, 1996; Noebauer et al., 2016; Maeda et al., 2023).
Despite differences in the explosion mechanism and potentially the progenitor system(s) for SNe Ia, Phillips (1993) find an empirical relationship between the decline rate of SNe Ia light curves and their absolute magnitudes, which holds for a majority of SNe Ia. Conversely, UV observations of SNe Ia show greater spectral diversity than in the optical (Ellis et al., 2008; Foley et al., 2008; Walker et al., 2012), and photometrically, SNe Ia can be grouped into NUV-red and NUV-blue classes based on the UVoptical color curves (Milne et al., 2013). Furthermore, the UV colors have an intrinsic scatter that is incompletely explained by extinction and redshift (Brown et al., 2017) and are redder than the Kasen & Plewa (2007) predictions for asymmetric explosions (Brown et al., 2018). Pan et al. (2020) claim a correlation between UV flux and host-galaxy metallicity; however, Brown & Crumpler (2020) were unable to confirm this correlation.
In addition to UV differences between spectroscopically normal SNe Ia, some SNe Ia show significant spectroscopic differences from normal SNe Ia yet remain on the Phillips (1993) relation (e.g., SN 1991T Phillips et al. 1992; Filippenko et al. 1992a, and SN 1991bg Filippenko et al. 1992b), and other spectroscopically different SNe Ia deviate from the Phillips (1993) relationship (e.g., SN 2002es Ganeshalingam et al. 2012, SN 2003fg Howell et al. 2006, and SN 2006bt Foley et al. 2010). The growing number of these extreme SNe Ia offers a unique chance to probe the generally homogeneous nature of SNe Ia.
Two particularly interesting SNe Ia subtypes are 2002es-like and 2003fg-like SNe Ia. 2002es-like SNe Ia are subluminous and have spectra that are similar to 1991bg-like SNe Ia with Si ii , O i, and Ti ii features near . They lack a secondary -band rebrightening, similar to other subluminous SNe Ia. However, unlike other fast-declining, subluminous SNe Ia, 2002es-like SNe Ia decline at a rate similar to normal SNe Ia (Taubenberger, 2017). One model for these objects is in the DD scenario with CO WDs whose masses sum greater than and violently merge (Pakmor et al., 2010; Kromer et al., 2016). Unfortunately, this class of objects is small with 10 objects, and a homogeneous data set does not yet exist. Conversely, 2003fg-like SNe Ia have overluminous and broader optical light curves than normal SNe Ia yet also lack the secondary -band peak (Taubenberger, 2017; Ashall et al., 2021). In the UV, 2003fg-like SNe Ia have different colors than normal and 1991T-like SNe Ia (Brown et al., 2014b), and spectroscopically, they have weaker Ca ii and stronger O i and C ii features. For the first members discovered in this class, the Arnett (1982) relationship yields 56Ni masses for 2003fg-like SNe Ia exceeding (e.g., Howell et al. 2006; Tanaka et al. 2010; Scalzo et al. 2010; Taubenberger et al. 2011), leading to the colloquial “Super-Chandresekhar” designation (e.g., Howell et al., 2006; Chen & Li, 2009; Scalzo et al., 2010; Silverman et al., 2011; Scalzo et al., 2012; Das & Mukhopadhyay, 2013; Taubenberger et al., 2013b; Hsiao et al., 2020). However, lower luminosity 2003fg-like SNe Ia with derived 56Ni masses below have also been discovered, suggesting that not all members of this class are “super-Chandrasekhar” explosions (e.g., Hicken et al. 2007; Chakradhari et al. 2014; Chen et al. 2019; Lu et al. 2021). Potential models for 2003fg-like SNe Ia included a rapidly spinning CO WD (Langer et al., 2000; Yoon & Langer, 2005; Hachisu et al., 2012), the merger of two WDS (Bulla et al., 2016), and the CD scenario (e.g., Hoeflich & Khokhlov 1996, Ashall et al. 2021, Maeda et al. 2023).
Despite their spectroscopic and photometric differences, both 2002es-like and 2003fg-like have had observations of rising light curve bumps111Here we define a SN Ia with a non-monotonic rising light curve to have a bump (i.e., a light curve that has a decrease in flux at early times). Section 5.1 explains this definition more thoroughly. (Cao et al., 2015; Miller et al., 2020; Jiang et al., 2021; Dimitriadis et al., 2023; Srivastav et al., 2023a, b); conversely, other spectroscopic subtypes and normal SNe Ia show deviations from a single-component power-law rise, and it remains unclear if these events are connected to the rising light curve behavior of 2002es-like and 2003fg-like SNe Ia. While theoretical models of normal SNe Ia are similar at peak -band magnitude, at early times (0-5 days after explosion), various models make different predictions about the light curve shape (e.g., Kasen 2010; Piro & Nakar 2013, 2014; Piro & Morozova 2016; Polin et al. 2019; Magee & Maguire 2020; Maeda et al. 2023). Thus, probing the earliest stages of SNe Ia explosions can provide otherwise unavailable information about the underlying physics.
In this paper, we analyze the UV absolute luminosities and colors of SNe Ia with different rising light curve behavior. §2 details the observations, data reduction process, and sample selection. §3 presents the absolute magnitudes of our sample, and §4 presents the UV and optical color curves. Discussion is in §5, and conclusions are presented in §6. Throughout this work, we adopt km sec-1 Mpc-1, , and .
2 Data
We perform an exhaustive literature search and identify 42 SNe Ia with pre-peak ( days) Swift UV photometry and early-time ( days) optical observations which can be used to constrain the shape of the rising light curve. We relax the optical phase constraint if the SN Ia rises over four magnitudes after discovery (and thus must be young; iPTF13ebh Hsiao et al., 2015 and 2019ein Pellegrino et al., 2020; Kawabata et al., 2020) or if there is a non-detection within two days of the first detection (this is only for some SNe Ia in Burke et al. 2022b who use DLT40 discoveries). Of the 42 SNe Ia with pre-peak Swift observations, we exclude five due to issues with host-galaxy contamination or low signal-to-noise. Details for all SNe Ia in our sample, including reasons for exclusion from the subsequent analyses, are provided in Appendix A along with values for and extinction. Table 1 lists the SNe Ia in the final sample along with their redshift, distance, early-time light curve category, and host galaxy name and morphology.
Swift photometry is taken from the Swift Optical/UV Supernova Archive (SOUSA; Brown et al. 2014a), which uses the Breeveld et al. (2011) Vega magnitude system zero points that update the original (Poole et al., 2008) zero points. Either a 3- or 5-arcsecond aperture is used to perform photometry with aperture size chosen to maximize S/N. The host galaxy counts from a post-SN template image are subtracted to produce the final photometry. Three exceptions for host-galaxy subtraction are SN 2021hpr and SN 2021aefx, which had galaxy flux from pre-explosion Swift observations subtracted, and SN 2022ilv which does not have a clear host galaxy. Observations obtained within 0.75d are combined with a weighted average to increase the S/N in the final photometry.
Two Swift filters, and , have transmission functions extending into the optical wavelengths (i.e., a red leak). This creates a broader distribution of photons from the UV to the optical (Brown et al., 2010). The relative similarity of SNe Ia in the optical means that any peculiar behavior comes from the UV regime. Still, the effect of UV spectral variations is diluted in the filter compared to the neighboring filter. We use all filters in this work.
To calculate absolute magnitudes in each of the six Swift filters, we first correct for the distance and then Milky Way and host-galaxy extinction using values derived in the literature for each object. We adopt a Cardelli et al. (1989) extinction law to convert into a filter-specific extinction estimate for each Swift filter.
We also include a comparison sample of 2003fg-like SNe Ia that lack early-time optical observations yet still have Swift photometry. The comparison sample consists of SN2009dc (Yamanaka et al., 2009; Silverman et al., 2011; Taubenberger et al., 2011), SN2012dn (Chakradhari et al., 2014; Taubenberger et al., 2019), SN2015M (Ashall et al., 2021), ASASSN-15hy (Lu et al., 2021), ASASSN-15pz (Chen et al., 2019) with extinction and values from Ashall et al. (2021). A comparison sample of 2002es-like SNe Ia with Swift observations would also be useful in this work; however, such a sample does not yet exist.
| SN Name | Subtype | aafootnotemark: | bbfootnotemark: [mag] | Rise | Host Name | Host Type |
|---|---|---|---|---|---|---|
| SN 2009ig | Norm | 0.0088 (1) | (a) | Single | NGC 1015 | SB(r)a |
| SN 2011fe | Norm | 0.0008 (2) | (b) | Single | M 101 | SAB(rs)cd |
| SN 2012cg | Norm | 0.001458 (3) | (a) | Double | NGC 4424 | SB(s)a |
| SN 2012fr | Norm | 0.005457 (4) | (a) | Double | NGC 1365 | SB(s)b |
| SN 2012ht | Fast | 0.00356 (5) | (a) | Single | NGC 3447 | SAB(s)m pec |
| LSQ12gdj | 91T | 0.030324 (7) | (f) | Single | ESO 472-007 | Unclassified |
| SN 2013dy | Norm | 0.003889 (6) | (a) | Double | NGC 7250 | Sdm? |
| SN 2013gy | Norm | 0.014023 (8) | (d) | Single | NGC 1418 | SB(s)b: |
| iPTF13dge | Norm | 0.01586 (9) | (e) | Single | NGC 1762 | SA(rs)c: |
| iPTF13ebh | Fast | 0.01316 (10) | (g) | Double | NGC 0890 | SAB0 |
| ASASSN-14lp | Norm | 0.0051 (1) | (c) | Single | NGC 4666 | SABc: |
| iPTF14atg | 02es | 0.02129 (11) | (j) | Bump | IC 831 | Unclassified |
| ⋮ | ⋮ | ⋮ | ⋮ | ⋮ | ⋮ | ⋮ |
| ⋮ | ⋮ | ⋮ | ⋮ | ⋮ | ⋮ | ⋮ |
| SN 2019ein | Norm | 0.00775 (24) | (g) | Single | NGC 5353 | S0 edge-on |
| SN 2019yvq | 02es | 0.0094 (25) | (m) | Bump | NGC 4441 | SAB0-pec |
| SN 2020hvf | 03fg | 0.00581 (26) | (f) | Bump | NGC 3643 | SB0+(r) |
| SN 2020nlb | Norm | 0.00243 (27) | (d) | Single | NGC 4382 | SA0 pec |
| SN 2020tld | Fast | 0.011201 (28) | (h) | Single | ESO 194-021 | SA0 |
| SN 2020udy | 02cx | 0.01722 (9) | (c) | Single | NGC 0812 | S pec |
| SN 2021fxy | Norm | 0.0094 (29) | (i) | Single | NGC 5018 | E3 |
| SN 2021hpr | Norm | 0.009346 (30) | (a) | Double | NGC 3147 | SA(rs)bc |
| SN 2021zny | 03fg | 0.026602 (7) | (d) | Bump | CGCG 438-018 | Unclassified |
| SN 2021aefx | Norm | 0.005017 (31) | (n) | Double | NGC 1566 | SAB(s)bc |
| SN 2022eyw | 02cx | 0.0087 (12) | (f) | Single | MCG +11-16-003 | Unclassified |
| SN 2022ilv | 03fg | 0.0310 (32) | (o) | Bump | Hostless | Hostless |
| SN 2023bee | Norm | 0.0067 (9) | (d) | Double | NGC 2708 | SAB(s)b |
(1) Meyer et al. (2004); (2) de Vaucouleurs et al. (1991); (3) Kent et al. (2008); (4) Bureau et al. (1996); (5) Kerr & Lynden-Bell (1986); (6) Schneider et al. (1992); (7) Springob et al. (2005); (8) Catinella et al. (2005); (9) Falco et al. (1999); (10) van den Bosch et al. (2015); (11) Rines et al. (2016); (12) Albareti et al. (2017); (13) van der Tak et al. (2008); (14) Beers et al. (1995); (15) Koribalski et al. (2004); (16) Theureau et al. (2005); (17) Cappellari et al. (2011); (18) Schneider et al. (1990); (19) Smith et al. (2000); (20) Jones et al. (2009); (21) Norris & Kannappan (2011); (22) Bilicki et al. (2014); (23) Rhee & van Albada (1996); (24) van Driel et al. (2001); (25) Miller et al. (2020); (26) van Driel et al. (2016); (27) Smith et al. (2000); (28) Loveday et al. (1996); (29) Rothberg & Joseph (2006); (30) Epinat et al. (2008); (31) Allison et al. (2014); (32) Burke et al. (2022a), SN 2022ilv is hostless, so the redshift is determined using SNID (Blondin & Tonry, 2007).
bbfootnotemark: (a) Cepheids; Riess et al. (2022); (b) Cepheids; Shappee & Stanek (2011); (c) Tully-Fisher Tully et al. (2016); (d) Tully-Fisher Tully et al. (2013); (e) Tully-Fisher Theureau et al. (2007); (f) Hubble flow using km s-1 Mpc-1 and correcting for Virgo + GA + Shapley. (g) Tully-Fisher Jensen et al. (2021); (h) Fundamental Plane Springob et al. (2014); (i) Tully-Fisher Courtois & Tully (2012); (j) Fundamental Plance Saulder et al. (2016); (k) TRGB Tully et al. (2013); (l) TRGB Hoyt et al. (2021); (m) Peculiar Velocity Modelling Carrick et al. (2015); (n) TRGB Sabbi et al. (2018); (o) Hostless; from SN spectrum distance Srivastav et al. (2023a).
3 Optical and UV Absolute Magnitudes
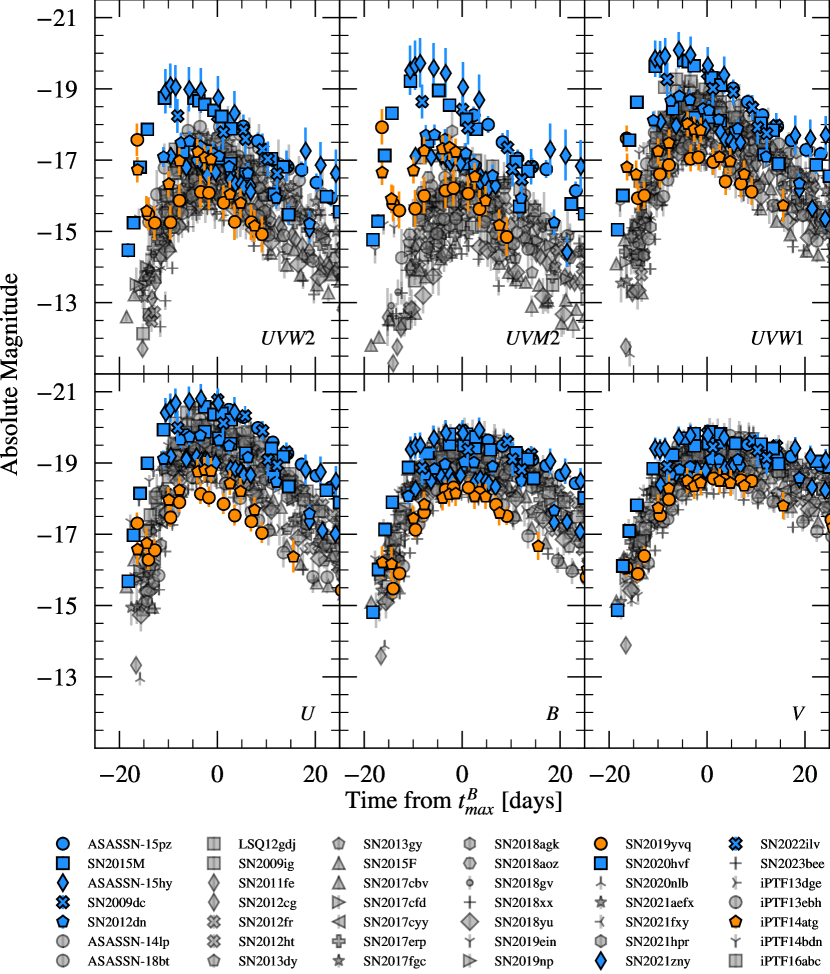
The 2002es-like and 2003fg-like SNe Ia in our sample have unique light curves, as shown in Figure 1. First, the two 2002es-like SNe Ia (iPTF14atg and SN 2019yvq) are underluminous at optical wavelengths yet distinctly overluminous in the UV, especially in the band. Second, the 2003fg-like SNe 2020hvf, 2021zny, and 2022ilv are overluminous in both optical and UV wavelengths. This behavior conflicts with the paradigm that more luminous SNe Ia should be powered by more 56Ni which in turn increases the opacity, reducing the ratio of UV to optical emission (Lentz et al., 2000; Walker et al., 2012; DerKacy et al., 2020). The observed UV brightness may be from the shock heating of an envelope of H/He-devoid material around the SN (Piro & Morozova, 2016; Maeda et al., 2023), which is consistent with the findings of Ashall et al. (2021) who found the most likely progenitor system was one within an envelope.
Finally, SNe 2020hvf and 2021zny peak222The main light curve peak from 56Ni decay. in the UV much earlier than the other SNe Ia. While iPTF14atg and SN 2019yvq both have UV peaks that are approximately concurrent with their optical maxima, the peaks of SN 2020hvf, and SN 2021zny are at least 10 days earlier than the optical peak. We fit the - and -band light curves with the template-independent Gaussian process method in SNooPy (Burns et al., 2011, 2014) to find the respective peak times, and . For iPTF14atg and SN 2019yvq, is 3.6 days and 0.9 days prior to , respectively. For SN 2020hvf and SN 2021zny, is 8.9 days and 10.8 days prior to , respectively.
4 Optical and UV Colors
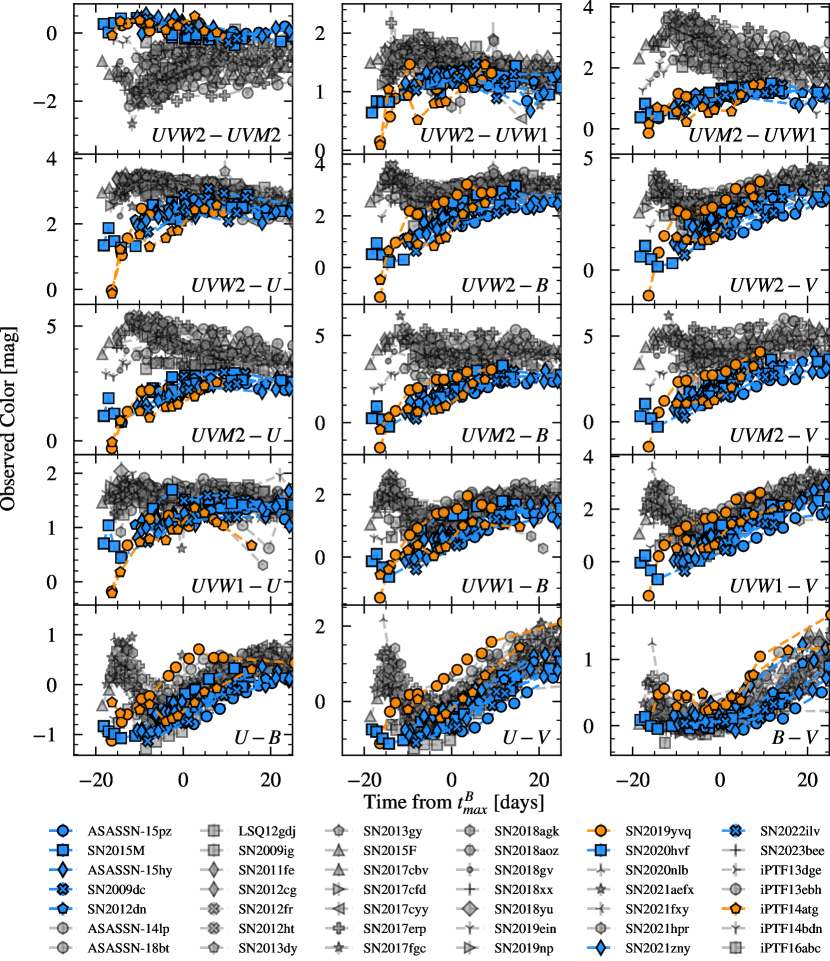
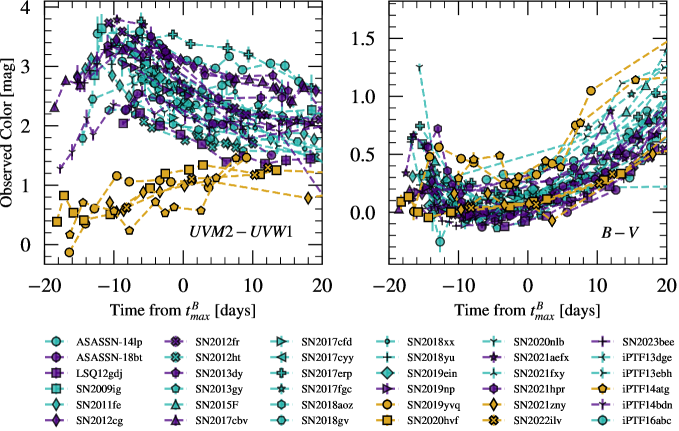
Figure 2 shows each unique color permutation of the Swift filters. We observe two disparate UV color evolutions in Figure 2, so we split our sample into two groups based on the UV color evolution. To avoid confusion with the existing terms of UV-blue and UV-red from Milne et al. (2013), we adopt different terms to refer to these groups. We define Group 1 as SNe Ia with mag at days, and the inverse is true for Group 2. Interestingly, these groupings also correspond to differentiation by spectral classification, with Group 2 consisting solely of 2002es-like and 2003fg-like SNe Ia, whereas Group 1 consists of other spectral subtypes (e.g., normal SNe Ia, 1999aa-like SNe Ia, fast-declining/transitional SNe Ia). The majority of SNe Ia are in Group 1. Group 2 consists of the 2003fg-like SNe Ia reference sample and iPTF14atg, SN 2019yvq, SN 2020hvf, SN 2021zny, and SN 2022ilv.
4.1 UV Colors
In the top row of Figure 2, Group 2 SNe Ia are bluer than Group 1 SNe Ia in the and color curves, whereas in the Group 2 SNe Ia are redder. This is due to the dilution of the UV excess due to the Swift filter transmission, i.e., the same amount of UV flux in the filter will have a small effect on the UV+optical flux, whereas the excess flux is a larger percentage in the filter. In the color curve, Group 2 SNe Ia have mag from explosion to . After , these same SNe Ia remain redder than other SNe Ia.
While Group 2 SNe Ia are slightly separated from the rest of the sample in the color curve, they are closer to the rest of the sample in than and .
The increased similarity between Group 1 and Group 2 SNe Ia in the color curve may originate from the red leak. In extreme cases, the optical component from the red leak provides over half of the total flux (e.g., Brown et al., 2010). Thus, contamination from optical light dilutes the observed difference from additional UV flux. The difference is still observed with filters with the red leak, which demonstrates that abnormal behavior does not arise from the red leak.
4.2 UVOptical Colors
The color curves are all characterized by the same rapid redward ascent of Group 2 SNe Ia. Prior to , Group 2 SNe Ia are all 2.6 mag, whereas Group 1 SNe Ia have mag mag. After , Group 2 SNe Ia are on the blue edge of the Group 1 distribution. Like the color curves, Group 2 SNe Ia become similar to the rest of our sample in the shortly after explosion. Overall, the colors evolve in the same manner as the filter.
Because the filter does not have a red leak, this filter is the best UV probe, so the color curves are the most important to consider. Similar to the other UVoptical colors, Group 2 SNe Ia quickly rise redward in the color curves, initially dominated by the UV. The color curve shows that even at , Group 2 SNe Ia have different colors, and this difference persists until 15 days. The and color curves are generally similar to the color curve.
4.3 Optical Colors
There are two phenomena in the optical color curves shown in the bottom row of Figure 2. First, Group 2 SNe Ia are not as uniform as in the UV, and second, Group 2 SNe Ia are not wholly different than Group 1 SNe Ia near and after .
There are several interesting features in the optical colors. First, in the and colors, SN 2019yvq is redder than other Group 2 SNe Ia. Second, iPTF14atg evolves similarly to SN 2019yvq when days, but then changes to evolve similarly to the other Group 1 members when . Either SN 2019yvq is evolving on an earlier time scale than the other bump SNe Ia and other early-time SNe Ia, similar to the color evolution in subluminous SNe Ia (see Figure 8 in Hoogendam et al. 2022), or the mechanism driving the first inflection point in the and colors for iPTF14atg may be absent from SN 2019yvq. Finally, in the color curve, it is difficult to differentiate Group 2 SNe Ia and the 2003fg-like SNe Ia from Group 1 SNe Ia in our sample.
5 Discussion
5.1 The Interesting Bump Cases
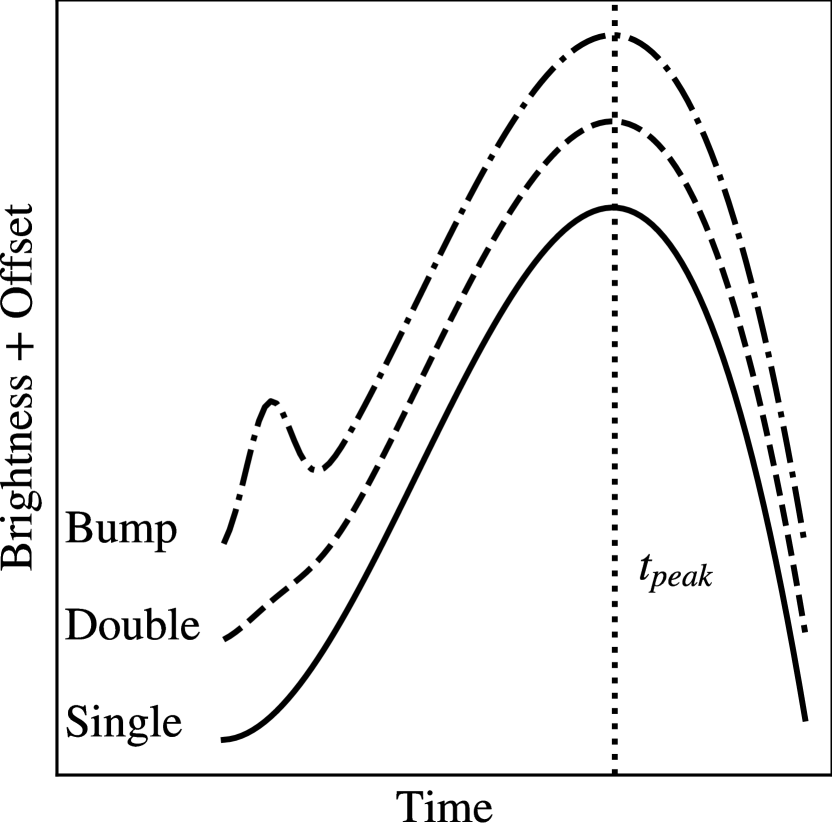
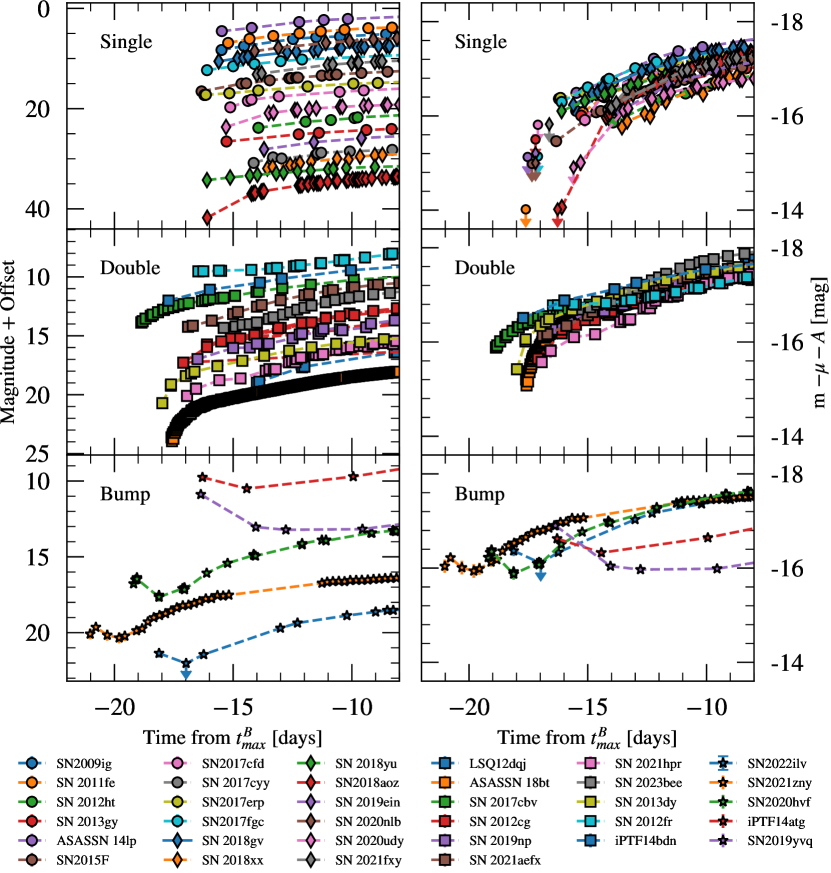
We separate the rising light curves of SNe Ia into three categories as shown in Figure 3: “single”, “double”, and “bump”. Single SNe Ia have rising light curves well fit by a single power law, whereas double SNe Ia have rising light curves better fit by a broken or two-component power law. Bump SNe Ia have non-monotonic light curve bumps in the UV and/or the optical (i.e., the flux decreases by at least 1 between any two epochs during the light curve rise). Figure 3 and the left-hand panel of Figure 4 elucidate these different rising light curve behaviors using idealized and observed light curves, respectively. The SNe Ia with bluer UV colors, iPTF14atg, SN 2019yvq, SN 2020hvf, SN 2021zny, and SN 2022ilv, are the only bump SNe Ia, and no spectroscopically normal SNe Ia display bumps by our definition in their rising light curve, despite composing the majority of our sample and the majority of SN Ia volumetrically (Desai et al., 2023). Thus, the color scheme in Figures 1 and 2 also correlates with rising light curve morphology. The blue and orange points correspond to SNe Ia with a rising light curve bump and the grey points correspond to SNe Ia without a rising light curve bump. However, we note that simultaneous high-cadence, high-signal-to-noise, early-time optical and UV data do not exist for most of the supernovae in our sample since the current observations come from heterogeneous survey and follow-up efforts. For example, there are no simultaneous UV observations of 2003fg-like SNe Ia since all the bumps are observed in the optical. Conversely, both 2002es-like SNe Ia in our sample have observed UV bumps but iPTF14atg does not show a clear bump in its optical light curves due to a gap in ground-based optical coverage at these epochs and low signal-to-noise in in the Swift optical observations. Ultimately, simultaneous high-cadence, high-signal-to-noise optical and UV data are needed for further study of SNe Ia rising light curves.
When considering the colors of the bump SNe Ia, the observed dichotomy of UV colors is inconsistent with the excess luminosity originating from interaction with a companion which is viewing-angle dependent (Kasen, 2010; Brown et al., 2012). This implies companion interaction and other viewing-angle dependent models are insufficient to explain both two-component rising light curves and rising light curve bumps. Thus, monotonically and non-monotonically rising light curves may have different physical origins. Despite our small sample, we can disfavor companion interaction as the cause of the early-time light curve bumps. Using the same viewing-angle argument as Burke et al. (2021), the probability of observing bumps in five out of five 2002es-like and 2003fg-like SNe Ia is 1 in . Underlying this claim is the assumption that the viewing angle is independent of the spectral subtype, which seems likely to be true but observations do not guarantee this is reality, and that the companion interaction results in the observables predicted by Kasen (2010). Thus, at the population level, the observed rate of SNe Ia with rising light curve bumps is too high to be fully explained by companion interaction.
Intriguingly, SN 2020hvf, SN 2021zny, and SN 2022ilv all display rising light curve bumps (Jiang et al., 2021; Dimitriadis et al., 2023; Srivastav et al., 2023a), and Figure 2 shows that the color evolutions of SN 2020hvf, SN 2021zny, and SN 2022ilv are consistent with the regular 2003fg-like SNe Ia in our comparison sample. This would naively suggest that other 2003fg-like SNe Ia have unobserved early-time light curve bumps. Such a conclusion remains speculative due to the small sample size. Initial analysis of SN 2022pul suggests there may not be a rising light curve bump Kwok et al., 2023; Siebert et al., 2023, but an in-depth study of the rising light curve is yet to be published. Similarly, iPTF14atg, SN 2019yvq are the only 2002es-like SNe Ia with UV data observed early enough to detect a bump. Three other 2002es-like SNe Ia, iPTF14dpk (Cao et al., 2016; Burke et al., 2021), SN 2022ywc (Srivastav et al., 2023b), and SN 2022vqz (Xi et al., 2023), have reported rising light curve bumps but no UV data. While the current sample is small, we can obtain preliminary statistical conclusions despite the small-number statistics.
Assuming the SNe Ia in our sample are representative, we can compute the fraction of 2002es-like and 2003fg-like SNe Ia that display a rising light curve bump at a confidence level. For 2002es-like SNe Ia, observing 2 rising light curve bumps from our 2 object sample implies that at least of early-time 2002es-like SN Ia light curves display a rising light curve bump. Similarly, for our sample of 2003fg-like SNe Ia, at least display a rising light curve bump. Combining our sample of 2002es-like and 2003fg-like SNe Ia and assuming 2002es-like and 2003fg-like SNe Ia arise from the same distribution, then at least 63% of the SNe Ia display a rising light curve bump. Finally, if we include 2002es-like and 2003fg-like SNe Ia that lack UV data in our statistical analysis, then 8 out of 9 SNe display a rising light curve bump, and thus at least 63% of SNe Ia in these subtypes display a rising light curve bump.
5.2 A Link Between 2002es-like SNe Ia and 2003fg-like SNe Ia
Brown et al. (2014b) show that 2003fg-like SNe Ia are different from normal as well as 1991T-like SNe Ia in the and colors. This work expands that analysis with color evolution data at days for more SNe Ia and the inclusion of three additional 2003fg-like SNe Ia and two 2002es-like SNe Ia.
There are several observational similarities between 2002es-like and 2003fg-like SNe Ia. Both classes lack a secondary -band maximum (Ashall et al., 2021; Burke et al., 2021), have some members with nebular [O i] emission (Taubenberger et al., 2013b, a; Kromer et al., 2016; Taubenberger et al., 2019; Dimitriadis et al., 2023; Siebert et al., 2023), and have members with C ii absorption of varying strengths in their near-peak optical spectra (Kromer et al., 2013; Cao et al., 2015; Ashall et al., 2021; Li et al., 2023; Siebert et al., 2023). Lastly, 2003fg-like SNe Ia prefer metal-poor, young environments (e.g., Lu et al. 2021, Galbany et al. in prep), whereas White et al. (2015) suggest 2002es-like SNe Ia prefer older, elliptical galaxies, but an in-depth study has not yet been performed for the local environments of 2002es-like SNe Ia.
Of the observational similarities between the two subtypes, the shared carbon absorption is perhaps the most intriguing. One proposed source for the C ii feature is a C-rich envelope either from the merger of two CO WDs in the DD scenario (e.g., Moll et al., 2014; Raskin & Kasen, 2013; Raskin et al., 2014) or a CO WD and an AGB core in the CD scenario where the AGB star has lost its H and/or He envelope (e.g., Lu et al., 2021; Hsiao et al., 2020; Ashall et al., 2021). Ashall et al. (2021) find a weak linear relationship between the pEW of C ii 6580Å and where faster-declining 2003fg-like SNe Ia have a smaller pEW value. Therefore, if there is a link between the progenitor scenario and/or explosion mechanism of 2002es-like and 2003fg-like SNe Ia, one may expect 2002es-like SNe Ia to follow this relationship with 2002es-like SNe Ia showing weak C ii features.
Observationally, only some 2002es-like SNe Ia display C ii absorption (e.g, SN 2010lp, Kromer et al., 2013; iPTF14atg, Cao et al., 2015; and SN 2016ije, Li et al., 2023), while others completely lack C ii (e.g., PTF10ops, Maguire et al., 2011; PTF10ujn, White et al., 2015; PTF10acdh, White et al., 2015; and SN 2019yvq, Miller et al., 2020). However, 2002es-like SNe Ia without C ii may still have an envelope which could be observed in a lower ionization state of carbon. C i 10693Å is the strongest C i feature, and visual inspection of Figure 2 in Burke et al. (2021) suggests the presence of C i in SN 2019yvq. Unfortunately, no other 2002es-like SNe Ia have published NIR spectra near peak light.
If we assume 2002es-like and 2003fg-like SNe Ia are linked, different scenarios can be constructed to explain a potential continuum in either the DD scenario or the CD scenario. The first-order explosion parameters would be the mass of the carbon envelope and the mass of the primary degenerate object (CO WD or CO AGB core, depending on the progenitor scenario). We do not consider potential higher-order effects such as flame speed or burning efficiency in our brief qualitative comparisons.
A larger core mass will produce a more optically luminous explosion with higher ionization features. In this picture, 2002es-like SNe Ia will have smaller core masses because they have lower optical luminosities (cf. Figure 1) and show lower ionization lines (e.g., Taubenberger 2017), and conversely, 2003fg-like SNe Ia will have larger core masses due to their larger optical luminosities (cf. Figure 1) and higher-ionization spectral features (e.g., Taubenberger 2017). Less massive circumstellar material results in weaker C features (i.e., smaller pEWs) since these features trace envelope mass (Ashall et al., 2021), whereas a larger envelope should produce stronger C ii and C i absorption, more luminous peak magnitudes, and lower Si ii velocities.
In addition to a nearby envelope, both a violent merger in the DD scenario and the CD scenario may have material extending out to larger distances (Kashi & Soker, 2011; Raskin & Kasen, 2013; Hsiao et al., 2020). If that material is either launched in a wind or dynamically ejected at a constant velocity, then the extended material will have a r-2 density profile (e.g., Moriya et al., 2023). That can be compared to the expected r-3 density profile of the nearby envelope (Piro & Morozova, 2016). Studies have investigated the effects of shock heating the envelope and wind separately, but to our knowledge, no study has simultaneously simulated both. Piro & Morozova (2016) and Maeda et al. (2023) show that a nearby envelope with an r-3 density profile is expected to produce a distinct bump in the early-time light curves whereas Moriya et al. (2023) show that a diffuse, r-2 wind may provide persistent additional UV luminosity through maximum light. Qualitatively, the combination of these two effects may reproduce the observed 2003fg-like and 2002es-like light curves with their observed rising light curve bumps and persistent blue UV colors through maximum light. A combined envelope and wind-driven circumstellar medium may produce a correlation between the size of the -day rising light curve bump or the UV luminosity and the combined pEW of the C i and C ii features at early times. Future theoretical and observational work is needed to test these qualitative considerations.
Finally, determining if 2003fg-like SNe Ia originate from the DD or CD scenario is another important open question. There are several predicted observational differences between the DD and CD scenarios. First, the DD scenario is predicted to show [O i] emission during the nebular phase (Pakmor et al., 2012) which may arise from low-velocity, asymmetric oxygen distributions caused by incomplete burning during a violent merger (Mazzali et al., 2022), whereas the CD scenario does not predict [O i] emission. Second, a violent merger in the DD scenario is predicted to be aspherical (Bulla et al., 2016); currently, no CD models offer predictions about polarization but intuitively one could expect these explosions to be spherical. Third and finally, the CD model of Lu et al. (2021) predicts a high X-ray flux due to a fast-receding photosphere and low opacity. This X-ray flux is as of yet undetected in any SN Ia to date (Lu et al., 2021), and future X-ray studies of 2002fg-like and 2003fg-like SNe Ia are also needed.
6 Conclusion
We present UV and optical photometry from Swift compiled in the SOUSA catalog (Brown et al., 2014a) for SNe Ia with early-time optical observations and pre- UV photometry. The data can be categorized by either the UV color evolution or the rising light curve morphology, and we find that both categorization criteria separate 2002es-like and 2003fg-like SNe Ia from the other spectroscopic subtypes of SNe Ia. Observationally,
-
1.
2002es-like and 2003fg-like SNe Ia are, on average, UV brighter than other SNe Ia (Figure 1),
-
2.
2002es-like and 2003fg-like SNe Ia have extreme blue UV colors through 10 days after maximum (Figure 2), and
-
3.
2002es-like and 2003fg-like SNe Ia are the only spectroscopic subtypes that exhibit rising light curve bumps (Figure 4).
Because 2002es-like and 2003fg-like SNe Ia show similar UV colors and also are the only spectroscopic subtypes to exhibit rising light curve bumps, we examine a potential relationship between these two subtypes. We propose a potential continuum between 2002es-like and 2003fg-like SNe Ia with the following progenitor properties. These SNe Ia may originate in low-metallicity DD or CD scenarios enshrouded by a carbon-rich circumstellar medium (Kromer et al., 2016; Lu et al., 2021; Ashall et al., 2021; Siebert et al., 2023; Kwok et al., 2023). 2003fg-like SNe Ia should have higher luminosities and 2002es-like SNe Ia are the lower-luminosity members of the continuum; the rising light curve bumps may arise from shock heating of an inner carbon envelope (e.g., Piro & Morozova 2016; Maeda et al. 2023) and wind-originated outer carbon material may cause the blue UV color evolution (e.g., Moriya et al. 2023). Future theoretical modeling should include two-layer circumstellar medium initial conditions.
With the advent of transient surveys (e.g., All-Sky Automated Survey for SuperNovae (ASAS-SN; Shappee et al. 2014; Kochanek et al. 2017; Hart et al. 2023), Asteroid Terrestrial-impact Last Alert System (ATLAS; Tonry et al. 2018), Panoramic Survey Telescope And Rapid Response System (Pan-STARRS; Chambers et al. 2016 and Zwicky Transient Facility (ZTF; Bellm et al. 2019), rapid classification groups (e.g., SCAT; Tucker et al., 2022c; ePESSTO+ Smartt et al., 2015) and dedicated follow-up groups (e.g., POISE; Burns et al., 2021; YSE Jones et al., 2021), many more SNe Ia will be quickly discovered and rapidly observed after the explosion. This is especially important for 2002es-like SNe Ia, which may initially be spectroscopically misclassified as 1991bg-like SNe Ia. Because of this, rapid follow-up programs with Swift (e.g., Brown et al. 2023) are doubly important. First, such programs increase the sample of well-observed SNe Ia in the UV, and more importantly, 2002es-like or 2003fg-like SN Ia can be differentiated from other subtypes with a single Swift epoch. If mag, then the SN Ia is either 2002es-like or 2003fg-like, with the difference between 2002es-like and 2003fg-like SNe Ia determined by peak absolute magnitude. Furthermore, the planned ULTRASAT satellite (Sagiv et al., 2014) will provide many transient discoveries and early-time UV light curves, which are crucial for SNe Ia science and may display early-time light curve bumps. Ultimately, further early-time observations across the electromagnetic spectrum are needed of 2002es-like and 2003fg-like SNe Ia.
References
- Albareti et al. (2017) Albareti, F. D., Allende Prieto, C., Almeida, A., et al. 2017, ApJS, 233, 25, doi: 10.3847/1538-4365/aa8992
- Allison et al. (2014) Allison, J. R., Sadler, E. M., & Meekin, A. M. 2014, MNRAS, 440, 696, doi: 10.1093/mnras/stu289
- Amanullah et al. (2014) Amanullah, R., Goobar, A., Johansson, J., et al. 2014, ApJ, 788, L21, doi: 10.1088/2041-8205/788/2/L21
- Arnett (1982) Arnett, W. D. 1982, ApJ, 253, 785, doi: 10.1086/159681
- Ashall et al. (2014) Ashall, C., Mazzali, P., Bersier, D., et al. 2014, MNRAS, 445, 4427, doi: 10.1093/mnras/stu1995
- Ashall et al. (2021) Ashall, C., Lu, J., Hsiao, E. Y., et al. 2021, ApJ, 922, 205, doi: 10.3847/1538-4357/ac19ac
- Ashall et al. (2022) Ashall, C., Lu, J., Shappee, B. J., et al. 2022, ApJ, 932, L2, doi: 10.3847/2041-8213/ac7235
- Beers et al. (1995) Beers, T. C., Kriessler, J. R., Bird, C. M., & Huchra, J. P. 1995, AJ, 109, 874, doi: 10.1086/117329
- Bellm et al. (2019) Bellm, E. C., Kulkarni, S. R., Graham, M. J., et al. 2019, PASP, 131, 018002, doi: 10.1088/1538-3873/aaecbe
- Bilicki et al. (2014) Bilicki, M., Jarrett, T. H., Peacock, J. A., Cluver, M. E., & Steward, L. 2014, ApJS, 210, 9, doi: 10.1088/0067-0049/210/1/9
- Blondin & Tonry (2007) Blondin, S., & Tonry, J. L. 2007, ApJ, 666, 1024, doi: 10.1086/520494
- Blondin et al. (2012) Blondin, S., Matheson, T., Kirshner, R. P., et al. 2012, AJ, 143, 126, doi: 10.1088/0004-6256/143/5/126
- Breeveld et al. (2011) Breeveld, A. A., Landsman, W., Holland, S. T., et al. 2011, in American Institute of Physics Conference Series, Vol. 1358, Gamma Ray Bursts 2010, ed. J. E. McEnery, J. L. Racusin, & N. Gehrels, 373–376, doi: 10.1063/1.3621807
- Brown et al. (2014a) Brown, P. J., Breeveld, A. A., Holland, S., Kuin, P., & Pritchard, T. 2014a, Ap&SS, 354, 89, doi: 10.1007/s10509-014-2059-8
- Brown & Crumpler (2020) Brown, P. J., & Crumpler, N. R. 2020, ApJ, 890, 45, doi: 10.3847/1538-4357/ab66b3
- Brown et al. (2012) Brown, P. J., Dawson, K. S., Harris, D. W., et al. 2012, ApJ, 749, 18, doi: 10.1088/0004-637X/749/1/18
- Brown et al. (2017) Brown, P. J., Landez, N. J., Milne, P. A., & Stritzinger, M. D. 2017, ApJ, 836, 232, doi: 10.3847/1538-4357/aa5f5a
- Brown et al. (2018) Brown, P. J., Perry, J. M., Beeny, B. A., Milne, P. A., & Wang, X. 2018, ApJ, 867, 56, doi: 10.3847/1538-4357/aae1ad
- Brown et al. (2023) Brown, P. J., Robertson, M., Devarakonda, Y., et al. 2023, Universe, 9, 218, doi: 10.3390/universe9050218
- Brown et al. (2010) Brown, P. J., Roming, P. W. A., Milne, P., et al. 2010, ApJ, 721, 1608, doi: 10.1088/0004-637X/721/2/1608
- Brown et al. (2014b) Brown, P. J., Kuin, P., Scalzo, R., et al. 2014b, ApJ, 787, 29, doi: 10.1088/0004-637X/787/1/29
- Brown et al. (2019) Brown, P. J., Hosseinzadeh, G., Jha, S. W., et al. 2019, ApJ, 877, 152, doi: 10.3847/1538-4357/ab1a3f
- Brown et al. (2013) Brown, T. M., Baliber, N., Bianco, F. B., et al. 2013, PASP, 125, 1031, doi: 10.1086/673168
- Bulla et al. (2016) Bulla, M., Sim, S. A., Pakmor, R., et al. 2016, MNRAS, 455, 1060, doi: 10.1093/mnras/stv2402
- Bureau et al. (1996) Bureau, M., Mould, J. R., & Staveley-Smith, L. 1996, ApJ, 463, 60, doi: 10.1086/177222
- Burgaz et al. (2021) Burgaz, U., Maeda, K., Kalomeni, B., et al. 2021, MNRAS, 502, 4112, doi: 10.1093/mnras/stab254
- Burke et al. (2022a) Burke, J., Howell, D. A., McCully, C., et al. 2022a, Transient Name Server Classification Report, 2022-1137, 1
- Burke et al. (2021) Burke, J., Howell, D. A., Sarbadhicary, S. K., et al. 2021, ApJ, 919, 142, doi: 10.3847/1538-4357/ac126b
- Burke et al. (2022b) Burke, J., Howell, D. A., Sand, D. J., et al. 2022b, arXiv e-prints, arXiv:2207.07681, doi: 10.48550/arXiv.2207.07681
- Burns et al. (2021) Burns, C., Hsiao, E., Suntzeff, N., et al. 2021, The Astronomer’s Telegram, 14441, 1
- Burns et al. (2011) Burns, C. R., Stritzinger, M., Phillips, M. M., et al. 2011, AJ, 141, 19, doi: 10.1088/0004-6256/141/1/19
- Burns et al. (2014) —. 2014, ApJ, 789, 32, doi: 10.1088/0004-637X/789/1/32
- Burns et al. (2018) Burns, C. R., Parent, E., Phillips, M. M., et al. 2018, ApJ, 869, 56, doi: 10.3847/1538-4357/aae51c
- Cao et al. (2016) Cao, Y., Kulkarni, S. R., Gal-Yam, A., et al. 2016, ApJ, 832, 86, doi: 10.3847/0004-637X/832/1/86
- Cao et al. (2015) Cao, Y., Kulkarni, S. R., Howell, D. A., et al. 2015, Nature, 521, 328, doi: 10.1038/nature14440
- Cappellari et al. (2011) Cappellari, M., Emsellem, E., Krajnović, D., et al. 2011, MNRAS, 413, 813, doi: 10.1111/j.1365-2966.2010.18174.x
- Cardelli et al. (1989) Cardelli, J. A., Clayton, G. C., & Mathis, J. S. 1989, ApJ, 345, 245, doi: 10.1086/167900
- Carrick et al. (2015) Carrick, J., Turnbull, S. J., Lavaux, G., & Hudson, M. J. 2015, MNRAS, 450, 317, doi: 10.1093/mnras/stv547
- Cartier et al. (2017) Cartier, R., Sullivan, M., Firth, R. E., et al. 2017, MNRAS, 464, 4476, doi: 10.1093/mnras/stw2678
- Catinella et al. (2005) Catinella, B., Haynes, M. P., & Giovanelli, R. 2005, AJ, 130, 1037, doi: 10.1086/432543
- Chakradhari et al. (2014) Chakradhari, N. K., Sahu, D. K., Srivastav, S., & Anupama, G. C. 2014, MNRAS, 443, 1663, doi: 10.1093/mnras/stu1258
- Chambers et al. (2016) Chambers, K. C., Magnier, E. A., Metcalfe, N., et al. 2016, arXiv e-prints, arXiv:1612.05560, doi: 10.48550/arXiv.1612.05560
- Chen et al. (2019) Chen, P., Dong, S., Katz, B., et al. 2019, ApJ, 880, 35, doi: 10.3847/1538-4357/ab2630
- Chen & Li (2009) Chen, W.-C., & Li, X.-D. 2009, ApJ, 702, 686, doi: 10.1088/0004-637X/702/1/686
- Childress et al. (2013) Childress, M. J., Scalzo, R. A., Sim, S. A., et al. 2013, ApJ, 770, 29, doi: 10.1088/0004-637X/770/1/29
- Contreras et al. (2018) Contreras, C., Phillips, M. M., Burns, C. R., et al. 2018, ApJ, 859, 24, doi: 10.3847/1538-4357/aabaf8
- Courtois & Tully (2012) Courtois, H. M., & Tully, R. B. 2012, ApJ, 749, 174, doi: 10.1088/0004-637X/749/2/174
- Das & Mukhopadhyay (2013) Das, U., & Mukhopadhyay, B. 2013, Phys. Rev. Lett., 110, 071102, doi: 10.1103/PhysRevLett.110.071102
- de Vaucouleurs et al. (1991) de Vaucouleurs, G., de Vaucouleurs, A., Corwin, Herold G., J., et al. 1991, Third Reference Catalogue of Bright Galaxies
- DerKacy et al. (2020) DerKacy, J. M., Baron, E., Branch, D., et al. 2020, ApJ, 901, 86, doi: 10.3847/1538-4357/abae67
- DerKacy et al. (2023) DerKacy, J. M., Paugh, S., Baron, E., et al. 2023, MNRAS, 522, 3481, doi: 10.1093/mnras/stad1171
- Desai et al. (2023) Desai, D. D., Kochanek, C. S., Shappee, B. J., et al. 2023, arXiv e-prints, arXiv:2306.11100, doi: 10.48550/arXiv.2306.11100
- Dhawan et al. (2018) Dhawan, S., Bulla, M., Goobar, A., et al. 2018, MNRAS, 480, 1445, doi: 10.1093/mnras/sty1908
- Dimitriadis et al. (2019) Dimitriadis, G., Foley, R. J., Rest, A., et al. 2019, ApJ, 870, L1, doi: 10.3847/2041-8213/aaedb0
- Dimitriadis et al. (2023) Dimitriadis, G., Maguire, K., Karambelkar, V. R., et al. 2023, MNRAS, 521, 1162, doi: 10.1093/mnras/stad536
- Ellis et al. (2008) Ellis, R. S., Sullivan, M., Nugent, P. E., et al. 2008, ApJ, 674, 51, doi: 10.1086/524981
- Epinat et al. (2008) Epinat, B., Amram, P., Marcelin, M., et al. 2008, MNRAS, 388, 500, doi: 10.1111/j.1365-2966.2008.13422.x
- Falco et al. (1999) Falco, E. E., Kurtz, M. J., Geller, M. J., et al. 1999, PASP, 111, 438, doi: 10.1086/316343
- Fausnaugh et al. (2023) Fausnaugh, M. M., Valleley, P. J., Tucker, M. A., et al. 2023, arXiv e-prints, arXiv:2307.11815. https://arxiv.org/abs/2307.11815
- Ferretti et al. (2016) Ferretti, R., Amanullah, R., Goobar, A., et al. 2016, A&A, 592, A40, doi: 10.1051/0004-6361/201628351
- Ferretti et al. (2017) —. 2017, A&A, 606, A111, doi: 10.1051/0004-6361/201731409
- Filippenko et al. (1992a) Filippenko, A. V., Richmond, M. W., Matheson, T., et al. 1992a, ApJ, 384, L15, doi: 10.1086/186252
- Filippenko et al. (1992b) Filippenko, A. V., Richmond, M. W., Branch, D., et al. 1992b, AJ, 104, 1543, doi: 10.1086/116339
- Fitzpatrick (1999) Fitzpatrick, E. L. 1999, PASP, 111, 63, doi: 10.1086/316293
- Foley et al. (2008) Foley, R. J., Filippenko, A. V., & Jha, S. W. 2008, ApJ, 686, 117, doi: 10.1086/590467
- Foley et al. (2010) Foley, R. J., Narayan, G., Challis, P. J., et al. 2010, ApJ, 708, 1748, doi: 10.1088/0004-637X/708/2/1748
- Foley et al. (2011) Foley, R. J., Sanders, N. E., & Kirshner, R. P. 2011, ApJ, 742, 89, doi: 10.1088/0004-637X/742/2/89
- Foley et al. (2012) Foley, R. J., Challis, P. J., Filippenko, A. V., et al. 2012, ApJ, 744, 38, doi: 10.1088/0004-637X/744/1/38
- Foley et al. (2014) Foley, R. J., Fox, O. D., McCully, C., et al. 2014, MNRAS, 443, 2887, doi: 10.1093/mnras/stu1378
- Foreman-Mackey et al. (2013) Foreman-Mackey, D., Hogg, D. W., Lang, D., & Goodman, J. 2013, PASP, 125, 306, doi: 10.1086/670067
- Fremling et al. (2020) Fremling, C., Miller, A. A., Sharma, Y., et al. 2020, ApJ, 895, 32, doi: 10.3847/1538-4357/ab8943
- Ganeshalingam et al. (2012) Ganeshalingam, M., Li, W., Filippenko, A. V., et al. 2012, ApJ, 751, 142, doi: 10.1088/0004-637X/751/2/142
- Goobar et al. (2014) Goobar, A., Johansson, J., Amanullah, R., et al. 2014, ApJ, 784, L12, doi: 10.1088/2041-8205/784/1/L12
- Goobar et al. (2015) Goobar, A., Kromer, M., Siverd, R., et al. 2015, ApJ, 799, 106, doi: 10.1088/0004-637X/799/1/106
- Graham et al. (2022) Graham, M. L., Kennedy, T. D., Kumar, S., et al. 2022, MNRAS, 511, 3682, doi: 10.1093/mnras/stac192
- Guy et al. (2007) Guy, J., Astier, P., Baumont, S., et al. 2007, A&A, 466, 11, doi: 10.1051/0004-6361:20066930
- Hachisu et al. (2012) Hachisu, I., Kato, M., & Nomoto, K. 2012, ApJ, 756, L4, doi: 10.1088/2041-8205/756/1/L4
- Han et al. (2020) Han, X., Zheng, W., Stahl, B. E., et al. 2020, ApJ, 892, 142, doi: 10.3847/1538-4357/ab7a27
- Hart et al. (2023) Hart, K., Shappee, B. J., Hey, D., et al. 2023, arXiv e-prints, arXiv:2304.03791, doi: 10.48550/arXiv.2304.03791
- Hicken et al. (2007) Hicken, M., Garnavich, P. M., Prieto, J. L., et al. 2007, ApJ, 669, L17, doi: 10.1086/523301
- Hoeflich & Khokhlov (1996) Hoeflich, P., & Khokhlov, A. 1996, ApJ, 457, 500, doi: 10.1086/176748
- Hoeflich et al. (2017) Hoeflich, P., Hsiao, E. Y., Ashall, C., et al. 2017, ApJ, 846, 58, doi: 10.3847/1538-4357/aa84b2
- Holmbo et al. (2019) Holmbo, S., Stritzinger, M. D., Shappee, B. J., et al. 2019, A&A, 627, A174, doi: 10.1051/0004-6361/201834389
- Holoien et al. (2017a) Holoien, T. W. S., Stanek, K. Z., Kochanek, C. S., et al. 2017a, MNRAS, 464, 2672, doi: 10.1093/mnras/stw2273
- Holoien et al. (2017b) Holoien, T. W. S., Brown, J. S., Stanek, K. Z., et al. 2017b, MNRAS, 471, 4966, doi: 10.1093/mnras/stx1544
- Holoien et al. (2017c) —. 2017c, MNRAS, 467, 1098, doi: 10.1093/mnras/stx057
- Holoien et al. (2019) Holoien, T. W. S., Brown, J. S., Vallely, P. J., et al. 2019, MNRAS, 484, 1899, doi: 10.1093/mnras/stz073
- Hoogendam et al. (2022) Hoogendam, W. B., Ashall, C., Galbany, L., et al. 2022, ApJ, 928, 103, doi: 10.3847/1538-4357/ac54aa
- Hosseinzadeh et al. (2017) Hosseinzadeh, G., Sand, D. J., Valenti, S., et al. 2017, ApJ, 845, L11, doi: 10.3847/2041-8213/aa8402
- Hosseinzadeh et al. (2022) Hosseinzadeh, G., Sand, D. J., Lundqvist, P., et al. 2022, ApJ, 933, L45, doi: 10.3847/2041-8213/ac7cef
- Hosseinzadeh et al. (2023) Hosseinzadeh, G., Sand, D. J., Sarbadhicary, S. K., et al. 2023, arXiv e-prints, arXiv:2305.03071, doi: 10.48550/arXiv.2305.03071
- Howell et al. (2006) Howell, D. A., Sullivan, M., Nugent, P. E., et al. 2006, Nature, 443, 308, doi: 10.1038/nature05103
- Hoyle & Fowler (1960) Hoyle, F., & Fowler, W. A. 1960, ApJ, 132, 565, doi: 10.1086/146963
- Hoyt et al. (2021) Hoyt, T. J., Beaton, R. L., Freedman, W. L., et al. 2021, ApJ, 915, 34, doi: 10.3847/1538-4357/abfe5a
- Hsiao et al. (2015) Hsiao, E. Y., Burns, C. R., Contreras, C., et al. 2015, A&A, 578, A9, doi: 10.1051/0004-6361/201425297
- Hsiao et al. (2020) Hsiao, E. Y., Hoeflich, P., Ashall, C., et al. 2020, ApJ, 900, 140, doi: 10.3847/1538-4357/abaf4c
- Iben & Tutukov (1984) Iben, I., J., & Tutukov, A. V. 1984, ApJS, 54, 335, doi: 10.1086/190932
- Im et al. (2015) Im, M., Choi, C., Yoon, S.-C., et al. 2015, ApJS, 221, 22, doi: 10.1088/0067-0049/221/1/22
- Jensen et al. (2021) Jensen, J. B., Blakeslee, J. P., Ma, C.-P., et al. 2021, arXiv e-prints, arXiv:2105.08299. https://arxiv.org/abs/2105.08299
- Jha et al. (2007) Jha, S., Riess, A. G., & Kirshner, R. P. 2007, ApJ, 659, 122, doi: 10.1086/512054
- Jha et al. (2019) Jha, S. W., Maguire, K., & Sullivan, M. 2019, Nature Astronomy, 3, 706, doi: 10.1038/s41550-019-0858-0
- Jiang et al. (2018) Jiang, J.-a., Doi, M., Maeda, K., & Shigeyama, T. 2018, ApJ, 865, 149, doi: 10.3847/1538-4357/aadb9a
- Jiang et al. (2021) Jiang, J.-a., Maeda, K., Kawabata, M., et al. 2021, ApJ, 923, L8, doi: 10.3847/2041-8213/ac375f
- Jones et al. (2009) Jones, D. H., Read, M. A., Saunders, W., et al. 2009, MNRAS, 399, 683, doi: 10.1111/j.1365-2966.2009.15338.x
- Jones et al. (2019) Jones, D. O., Scolnic, D. M., Foley, R. J., et al. 2019, ApJ, 881, 19, doi: 10.3847/1538-4357/ab2bec
- Jones et al. (2021) Jones, D. O., Foley, R. J., Narayan, G., et al. 2021, ApJ, 908, 143, doi: 10.3847/1538-4357/abd7f5
- Kasen (2010) Kasen, D. 2010, ApJ, 708, 1025, doi: 10.1088/0004-637X/708/2/1025
- Kasen & Plewa (2007) Kasen, D., & Plewa, T. 2007, ApJ, 662, 459, doi: 10.1086/516834
- Kashi & Soker (2011) Kashi, A., & Soker, N. 2011, MNRAS, 417, 1466, doi: 10.1111/j.1365-2966.2011.19361.x
- Kawabata et al. (2020) Kawabata, M., Maeda, K., Yamanaka, M., et al. 2020, ApJ, 893, 143, doi: 10.3847/1538-4357/ab8236
- Kent et al. (2008) Kent, B. R., Giovanelli, R., Haynes, M. P., et al. 2008, AJ, 136, 713, doi: 10.1088/0004-6256/136/2/713
- Kerr & Lynden-Bell (1986) Kerr, F. J., & Lynden-Bell, D. 1986, MNRAS, 221, 1023, doi: 10.1093/mnras/221.4.1023
- Khokhlov (1991) Khokhlov, A. M. 1991, A&A, 245, 114
- Kochanek et al. (2017) Kochanek, C. S., Shappee, B. J., Stanek, K. Z., et al. 2017, PASP, 129, 104502, doi: 10.1088/1538-3873/aa80d9
- Koribalski et al. (2004) Koribalski, B. S., Staveley-Smith, L., Kilborn, V. A., et al. 2004, AJ, 128, 16, doi: 10.1086/421744
- Krisciunas et al. (2004a) Krisciunas, K., Phillips, M. M., Suntzeff, N. B., et al. 2004a, AJ, 127, 1664, doi: 10.1086/381911
- Krisciunas et al. (2004b) Krisciunas, K., Suntzeff, N. B., Phillips, M. M., et al. 2004b, AJ, 128, 3034, doi: 10.1086/425629
- Kromer et al. (2013) Kromer, M., Pakmor, R., Taubenberger, S., et al. 2013, ApJ, 778, L18, doi: 10.1088/2041-8205/778/1/L18
- Kromer et al. (2015) Kromer, M., Ohlmann, S. T., Pakmor, R., et al. 2015, MNRAS, 450, 3045, doi: 10.1093/mnras/stv886
- Kromer et al. (2016) Kromer, M., Fremling, C., Pakmor, R., et al. 2016, MNRAS, 459, 4428, doi: 10.1093/mnras/stw962
- Kwok et al. (2023) Kwok, L. A., Siebert, M. R., Johansson, J., et al. 2023, arXiv e-prints, arXiv:2308.12450. https://arxiv.org/abs/2308.12450
- Langer et al. (2000) Langer, N., Deutschmann, A., Wellstein, S., & Höflich, P. 2000, A&A, 362, 1046, doi: 10.48550/arXiv.astro-ph/0008444
- Lentz et al. (2000) Lentz, E. J., Baron, E., Branch, D., Hauschildt, P. H., & Nugent, P. E. 2000, ApJ, 530, 966, doi: 10.1086/308400
- Li et al. (2022) Li, L., Zhang, J., Dai, B., et al. 2022, ApJ, 924, 35, doi: 10.3847/1538-4357/ac323f
- Li et al. (2011) Li, W., Leaman, J., Chornock, R., et al. 2011, MNRAS, 412, 1441, doi: 10.1111/j.1365-2966.2011.18160.x
- Li et al. (2019) Li, W., Wang, X., Vinkó, J., et al. 2019, ApJ, 870, 12, doi: 10.3847/1538-4357/aaec74
- Li et al. (2023) Li, Z., Zhang, T., Wang, X., et al. 2023, ApJ, 950, 17, doi: 10.3847/1538-4357/accde3
- Lim et al. (2023) Lim, G., Im, M., Paek, G. S. H., et al. 2023, ApJ, 949, 33, doi: 10.3847/1538-4357/acc10c
- Lira et al. (1998) Lira, P., Suntzeff, N. B., Phillips, M. M., et al. 1998, AJ, 115, 234, doi: 10.1086/300175
- Livio & Mazzali (2018) Livio, M., & Mazzali, P. 2018, Phys. Rep., 736, 1, doi: 10.1016/j.physrep.2018.02.002
- Livne (1990) Livne, E. 1990, ApJ, 354, L53, doi: 10.1086/185721
- Loveday et al. (1996) Loveday, J., Peterson, B. A., Maddox, S. J., & Efstathiou, G. 1996, ApJS, 107, 201, doi: 10.1086/192360
- Lu et al. (2021) Lu, J., Ashall, C., Hsiao, E. Y., et al. 2021, ApJ, 920, 107, doi: 10.3847/1538-4357/ac1606
- Lundqvist et al. (2015) Lundqvist, P., Nyholm, A., Taddia, F., et al. 2015, A&A, 577, A39, doi: 10.1051/0004-6361/201525719
- Maeda et al. (2023) Maeda, K., Jiang, J.-a., Doi, M., Kawabata, M., & Shigeyama, T. 2023, MNRAS, 521, 1897, doi: 10.1093/mnras/stad618
- Magee & Maguire (2020) Magee, M. R., & Maguire, K. 2020, A&A, 642, A189, doi: 10.1051/0004-6361/202037870
- Maguire et al. (2011) Maguire, K., Sullivan, M., Thomas, R. C., et al. 2011, MNRAS, 418, 747, doi: 10.1111/j.1365-2966.2011.19526.x
- Maguire et al. (2023) Maguire, K., Magee, M. R., Leloudas, G., et al. 2023, arXiv e-prints, arXiv:2304.12361, doi: 10.48550/arXiv.2304.12361
- Mandel et al. (2022) Mandel, K. S., Thorp, S., Narayan, G., Friedman, A. S., & Avelino, A. 2022, MNRAS, 510, 3939, doi: 10.1093/mnras/stab3496
- Maoz et al. (2014) Maoz, D., Mannucci, F., & Nelemans, G. 2014, ARA&A, 52, 107, doi: 10.1146/annurev-astro-082812-141031
- Marion et al. (2016) Marion, G. H., Brown, P. J., Vinkó, J., et al. 2016, ApJ, 820, 92, doi: 10.3847/0004-637X/820/2/92
- Matteucci & Recchi (2001) Matteucci, F., & Recchi, S. 2001, ApJ, 558, 351, doi: 10.1086/322472
- Mazzali et al. (2022) Mazzali, P. A., Benetti, S., Stritzinger, M., & Ashall, C. 2022, MNRAS, 511, 5560, doi: 10.1093/mnras/stac409
- Meyer et al. (2004) Meyer, M. J., Zwaan, M. A., Webster, R. L., et al. 2004, MNRAS, 350, 1195, doi: 10.1111/j.1365-2966.2004.07710.x
- Miller et al. (2018) Miller, A. A., Cao, Y., Piro, A. L., et al. 2018, ApJ, 852, 100, doi: 10.3847/1538-4357/aaa01f
- Miller et al. (2020) Miller, A. A., Magee, M. R., Polin, A., et al. 2020, ApJ, 898, 56, doi: 10.3847/1538-4357/ab9e05
- Milne et al. (2013) Milne, P. A., Brown, P. J., Roming, P. W. A., Bufano, F., & Gehrels, N. 2013, ApJ, 779, 23, doi: 10.1088/0004-637X/779/1/23
- Moll et al. (2014) Moll, R., Raskin, C., Kasen, D., & Woosley, S. E. 2014, ApJ, 785, 105, doi: 10.1088/0004-637X/785/2/105
- Moriya et al. (2023) Moriya, T. J., Mazzali, P. A., Ashall, C., & Pian, E. 2023, MNRAS, 522, 6035, doi: 10.1093/mnras/stad1386
- Munari et al. (2013) Munari, U., Henden, A., Belligoli, R., et al. 2013, New A, 20, 30, doi: 10.1016/j.newast.2012.09.003
- Neumann et al. (2023) Neumann, K. D., Holoien, T. W. S., Kochanek, C. S., et al. 2023, MNRAS, 520, 4356, doi: 10.1093/mnras/stad355
- Ni et al. (2022) Ni, Y. Q., Moon, D.-S., Drout, M. R., et al. 2022, Nature Astronomy, 6, 568, doi: 10.1038/s41550-022-01603-4
- Ni et al. (2023) —. 2023, ApJ, 946, 7, doi: 10.3847/1538-4357/aca9be
- Noebauer et al. (2016) Noebauer, U. M., Taubenberger, S., Blinnikov, S., Sorokina, E., & Hillebrandt, W. 2016, MNRAS, 463, 2972, doi: 10.1093/mnras/stw2197
- Nomoto (1980) Nomoto, K. 1980, in Texas Workshop on Type I Supernovae, ed. J. C. Wheeler, 164–181
- Nomoto (1982) Nomoto, K. 1982, ApJ, 253, 798, doi: 10.1086/159682
- Norris & Kannappan (2011) Norris, M. A., & Kannappan, S. J. 2011, MNRAS, 414, 739, doi: 10.1111/j.1365-2966.2011.18440.x
- Nugent et al. (2011) Nugent, P. E., Sullivan, M., Cenko, S. B., et al. 2011, Nature, 480, 344, doi: 10.1038/nature10644
- Pakmor et al. (2010) Pakmor, R., Kromer, M., Röpke, F. K., et al. 2010, Nature, 463, 61, doi: 10.1038/nature08642
- Pakmor et al. (2012) Pakmor, R., Kromer, M., Taubenberger, S., et al. 2012, ApJ, 747, L10, doi: 10.1088/2041-8205/747/1/L10
- Pakmor et al. (2013) Pakmor, R., Kromer, M., Taubenberger, S., & Springel, V. 2013, ApJ, 770, L8, doi: 10.1088/2041-8205/770/1/L8
- Pan et al. (2020) Pan, Y. C., Foley, R. J., Jones, D. O., Filippenko, A. V., & Kuin, N. P. M. 2020, MNRAS, 491, 5897, doi: 10.1093/mnras/stz3391
- Pejcha et al. (2013) Pejcha, O., Antognini, J. M., Shappee, B. J., & Thompson, T. A. 2013, MNRAS, 435, 943, doi: 10.1093/mnras/stt1281
- Pellegrino et al. (2020) Pellegrino, C., Howell, D. A., Sarbadhicary, S. K., et al. 2020, ApJ, 897, 159, doi: 10.3847/1538-4357/ab8e3f
- Pepper et al. (2007) Pepper, J., Pogge, R. W., DePoy, D. L., et al. 2007, PASP, 119, 923, doi: 10.1086/521836
- Pereira et al. (2013) Pereira, R., Thomas, R. C., Aldering, G., et al. 2013, A&A, 554, A27, doi: 10.1051/0004-6361/201221008
- Perlmutter et al. (1999) Perlmutter, S., Aldering, G., Goldhaber, G., et al. 1999, ApJ, 517, 565, doi: 10.1086/307221
- Peterson et al. (2023) Peterson, E. R., Jones, D. O., Scolnic, D., et al. 2023, MNRAS, 522, 2478, doi: 10.1093/mnras/stad1077
- Phillips (1993) Phillips, M. M. 1993, ApJ, 413, L105, doi: 10.1086/186970
- Phillips et al. (1999) Phillips, M. M., Lira, P., Suntzeff, N. B., et al. 1999, AJ, 118, 1766, doi: 10.1086/301032
- Phillips et al. (1992) Phillips, M. M., Wells, L. A., Suntzeff, N. B., et al. 1992, AJ, 103, 1632, doi: 10.1086/116177
- Phillips et al. (2013) Phillips, M. M., Simon, J. D., Morrell, N., et al. 2013, ApJ, 779, 38, doi: 10.1088/0004-637X/779/1/38
- Phillips et al. (2019) Phillips, M. M., Contreras, C., Hsiao, E. Y., et al. 2019, PASP, 131, 014001, doi: 10.1088/1538-3873/aae8bd
- Piersanti et al. (2003) Piersanti, L., Gagliardi, S., Iben, Icko, J., & Tornambé, A. 2003, ApJ, 598, 1229, doi: 10.1086/378952
- Piro & Morozova (2016) Piro, A. L., & Morozova, V. S. 2016, ApJ, 826, 96, doi: 10.3847/0004-637X/826/1/96
- Piro & Nakar (2013) Piro, A. L., & Nakar, E. 2013, ApJ, 769, 67, doi: 10.1088/0004-637X/769/1/67
- Piro & Nakar (2014) —. 2014, ApJ, 784, 85, doi: 10.1088/0004-637X/784/1/85
- Polin et al. (2019) Polin, A., Nugent, P., & Kasen, D. 2019, ApJ, 873, 84, doi: 10.3847/1538-4357/aafb6a
- Poole et al. (2008) Poole, T. S., Breeveld, A. A., Page, M. J., et al. 2008, MNRAS, 383, 627, doi: 10.1111/j.1365-2966.2007.12563.x
- Poznanski et al. (2012) Poznanski, D., Prochaska, J. X., & Bloom, J. S. 2012, MNRAS, 426, 1465, doi: 10.1111/j.1365-2966.2012.21796.x
- Raiteri et al. (1996) Raiteri, C. M., Villata, M., & Navarro, J. F. 1996, A&A, 315, 105
- Raskin & Kasen (2013) Raskin, C., & Kasen, D. 2013, ApJ, 772, 1, doi: 10.1088/0004-637X/772/1/1
- Raskin et al. (2014) Raskin, C., Kasen, D., Moll, R., Schwab, J., & Woosley, S. 2014, ApJ, 788, 75, doi: 10.1088/0004-637X/788/1/75
- Reindl et al. (2005) Reindl, B., Tammann, G. A., Sandage, A., & Saha, A. 2005, ApJ, 624, 532, doi: 10.1086/429218
- Rhee & van Albada (1996) Rhee, M. H., & van Albada, T. S. 1996, A&AS, 115, 407
- Riess et al. (1998) Riess, A. G., Filippenko, A. V., Challis, P., et al. 1998, AJ, 116, 1009, doi: 10.1086/300499
- Riess et al. (2022) Riess, A. G., Yuan, W., Macri, L. M., et al. 2022, ApJ, 934, L7, doi: 10.3847/2041-8213/ac5c5b
- Rines et al. (2016) Rines, K. J., Geller, M. J., Diaferio, A., & Hwang, H. S. 2016, ApJ, 819, 63, doi: 10.3847/0004-637X/819/1/63
- Röpke & Niemeyer (2007) Röpke, F. K., & Niemeyer, J. C. 2007, A&A, 464, 683, doi: 10.1051/0004-6361:20066585
- Röpke et al. (2012) Röpke, F. K., Kromer, M., Seitenzahl, I. R., et al. 2012, ApJ, 750, L19, doi: 10.1088/2041-8205/750/1/L19
- Rothberg & Joseph (2006) Rothberg, B., & Joseph, R. D. 2006, AJ, 131, 185, doi: 10.1086/498452
- Sabbi et al. (2018) Sabbi, E., Calzetti, D., Ubeda, L., et al. 2018, ApJS, 235, 23, doi: 10.3847/1538-4365/aaa8e5
- Sagiv et al. (2014) Sagiv, I., Gal-Yam, A., Ofek, E. O., et al. 2014, AJ, 147, 79, doi: 10.1088/0004-6256/147/4/79
- Sai et al. (2022) Sai, H., Wang, X., Elias-Rosa, N., et al. 2022, MNRAS, 514, 3541, doi: 10.1093/mnras/stac1525
- Sand et al. (2021) Sand, D. J., Sarbadhicary, S. K., Pellegrino, C., et al. 2021, ApJ, 922, 21, doi: 10.3847/1538-4357/ac20da
- Saulder et al. (2016) Saulder, C., van Kampen, E., Chilingarian, I. V., Mieske, S., & Zeilinger, W. W. 2016, A&A, 596, A14, doi: 10.1051/0004-6361/201526711
- Scalzo et al. (2012) Scalzo, R., Aldering, G., Antilogus, P., et al. 2012, ApJ, 757, 12, doi: 10.1088/0004-637X/757/1/12
- Scalzo et al. (2010) Scalzo, R. A., Aldering, G., Antilogus, P., et al. 2010, ApJ, 713, 1073, doi: 10.1088/0004-637X/713/2/1073
- Scalzo et al. (2014) Scalzo, R. A., Childress, M., Tucker, B., et al. 2014, MNRAS, 445, 30, doi: 10.1093/mnras/stu1723
- Schlafly & Finkbeiner (2011) Schlafly, E. F., & Finkbeiner, D. P. 2011, ApJ, 737, 103, doi: 10.1088/0004-637X/737/2/103
- Schneider et al. (1990) Schneider, S. E., Thuan, T. X., Magri, C., & Wadiak, J. E. 1990, ApJS, 72, 245, doi: 10.1086/191416
- Schneider et al. (1992) Schneider, S. E., Thuan, T. X., Mangum, J. G., & Miller, J. 1992, ApJS, 81, 5, doi: 10.1086/191684
- Shappee et al. (2013a) Shappee, B. J., Kochanek, C. S., & Stanek, K. Z. 2013a, ApJ, 765, 150, doi: 10.1088/0004-637X/765/2/150
- Shappee et al. (2018) Shappee, B. J., Piro, A. L., Stanek, K. Z., et al. 2018, ApJ, 855, 6, doi: 10.3847/1538-4357/aaa1e9
- Shappee & Stanek (2011) Shappee, B. J., & Stanek, K. Z. 2011, ApJ, 733, 124, doi: 10.1088/0004-637X/733/2/124
- Shappee et al. (2017) Shappee, B. J., Stanek, K. Z., Kochanek, C. S., & Garnavich, P. M. 2017, ApJ, 841, 48, doi: 10.3847/1538-4357/aa6eab
- Shappee et al. (2013b) Shappee, B. J., Stanek, K. Z., Pogge, R. W., & Garnavich, P. M. 2013b, ApJ, 762, L5, doi: 10.1088/2041-8205/762/1/L5
- Shappee & Thompson (2013) Shappee, B. J., & Thompson, T. A. 2013, ApJ, 766, 64, doi: 10.1088/0004-637X/766/1/64
- Shappee et al. (2014) Shappee, B. J., Prieto, J. L., Grupe, D., et al. 2014, ApJ, 788, 48, doi: 10.1088/0004-637X/788/1/48
- Shappee et al. (2016) Shappee, B. J., Piro, A. L., Holoien, T. W. S., et al. 2016, ApJ, 826, 144, doi: 10.3847/0004-637X/826/2/144
- Shappee et al. (2019) Shappee, B. J., Holoien, T. W. S., Drout, M. R., et al. 2019, ApJ, 870, 13, doi: 10.3847/1538-4357/aaec79
- Siebert et al. (2020) Siebert, M. R., Dimitriadis, G., Polin, A., & Foley, R. J. 2020, ApJ, 900, L27, doi: 10.3847/2041-8213/abae6e
- Siebert et al. (2023) Siebert, M. R., Kwok, L. A., Johansson, J., et al. 2023, arXiv e-prints, arXiv:2308.12449. https://arxiv.org/abs/2308.12449
- Silverman et al. (2011) Silverman, J. M., Ganeshalingam, M., Li, W., et al. 2011, MNRAS, 410, 585, doi: 10.1111/j.1365-2966.2010.17474.x
- Silverman et al. (2012) Silverman, J. M., Foley, R. J., Filippenko, A. V., et al. 2012, MNRAS, 425, 1789, doi: 10.1111/j.1365-2966.2012.21270.x
- Siverd et al. (2015) Siverd, R. J., Goobar, A., Stassun, K. G., & Pepper, J. 2015, ApJ, 799, 105, doi: 10.1088/0004-637X/799/1/105
- Siverd et al. (2012) Siverd, R. J., Beatty, T. G., Pepper, J., et al. 2012, ApJ, 761, 123, doi: 10.1088/0004-637X/761/2/123
- Smartt et al. (2015) Smartt, S. J., Valenti, S., Fraser, M., et al. 2015, A&A, 579, A40, doi: 10.1051/0004-6361/201425237
- Smith et al. (2000) Smith, R. J., Lucey, J. R., Hudson, M. J., Schlegel, D. J., & Davies, R. L. 2000, MNRAS, 313, 469, doi: 10.1046/j.1365-8711.2000.03251.x
- Smitka et al. (2015) Smitka, M. T., Brown, P. J., Suntzeff, N. B., et al. 2015, ApJ, 813, 30, doi: 10.1088/0004-637X/813/1/30
- Springob et al. (2005) Springob, C. M., Haynes, M. P., Giovanelli, R., & Kent, B. R. 2005, ApJS, 160, 149, doi: 10.1086/431550
- Springob et al. (2014) Springob, C. M., Magoulas, C., Colless, M., et al. 2014, MNRAS, 445, 2677, doi: 10.1093/mnras/stu1743
- Srivastav et al. (2023a) Srivastav, S., Smartt, S. J., Huber, M. E., et al. 2023a, ApJ, 943, L20, doi: 10.3847/2041-8213/acb2ce
- Srivastav et al. (2023b) Srivastav, S., Moore, T., Nicholl, M., et al. 2023b, arXiv e-prints, arXiv:2308.06019, doi: 10.48550/arXiv.2308.06019
- Tanaka et al. (2010) Tanaka, M., Kawabata, K. S., Yamanaka, M., et al. 2010, ApJ, 714, 1209, doi: 10.1088/0004-637X/714/2/1209
- Taubenberger (2017) Taubenberger, S. 2017, The Extremes of Thermonuclear Supernovae, ed. A. W. Alsabti & P. Murdin, 317, doi: 10.1007/978-3-319-21846-5_37
- Taubenberger et al. (2013a) Taubenberger, S., Kromer, M., Pakmor, R., et al. 2013a, ApJ, 775, L43, doi: 10.1088/2041-8205/775/2/L43
- Taubenberger et al. (2011) Taubenberger, S., Benetti, S., Childress, M., et al. 2011, MNRAS, 412, 2735, doi: 10.1111/j.1365-2966.2010.18107.x
- Taubenberger et al. (2013b) Taubenberger, S., Kromer, M., Hachinger, S., et al. 2013b, MNRAS, 432, 3117, doi: 10.1093/mnras/stt668
- Taubenberger et al. (2019) Taubenberger, S., Floers, A., Vogl, C., et al. 2019, MNRAS, 488, 5473, doi: 10.1093/mnras/stz1977
- Theureau et al. (2007) Theureau, G., Hanski, M. O., Coudreau, N., Hallet, N., & Martin, J. M. 2007, A&A, 465, 71, doi: 10.1051/0004-6361:20066187
- Theureau et al. (2005) Theureau, G., Coudreau, N., Hallet, N., et al. 2005, A&A, 430, 373, doi: 10.1051/0004-6361:20047152
- Thompson (2011) Thompson, T. A. 2011, ApJ, 741, 82, doi: 10.1088/0004-637X/741/2/82
- Thorp et al. (2021) Thorp, S., Mandel, K. S., Jones, D. O., Ward, S. M., & Narayan, G. 2021, MNRAS, 508, 4310, doi: 10.1093/mnras/stab2849
- Tonry et al. (2018) Tonry, J. L., Denneau, L., Heinze, A. N., et al. 2018, PASP, 130, 064505, doi: 10.1088/1538-3873/aabadf
- Tucker et al. (2022a) Tucker, M. A., Ashall, C., Shappee, B. J., et al. 2022a, ApJ, 926, L25, doi: 10.3847/2041-8213/ac4fbd
- Tucker et al. (2022b) Tucker, M. A., Shappee, B. J., Kochanek, C. S., et al. 2022b, MNRAS, 517, 4119, doi: 10.1093/mnras/stac2873
- Tucker et al. (2020) Tucker, M. A., Shappee, B. J., Vallely, P. J., et al. 2020, MNRAS, 493, 1044, doi: 10.1093/mnras/stz3390
- Tucker et al. (2021) Tucker, M. A., Ashall, C., Shappee, B. J., et al. 2021, ApJ, 914, 50, doi: 10.3847/1538-4357/abf93b
- Tucker et al. (2022c) Tucker, M. A., Shappee, B. J., Huber, M. E., et al. 2022c, PASP, 134, 124502, doi: 10.1088/1538-3873/aca719
- Tully et al. (2016) Tully, R. B., Courtois, H. M., & Sorce, J. G. 2016, AJ, 152, 50, doi: 10.3847/0004-6256/152/2/50
- Tully et al. (2013) Tully, R. B., Courtois, H. M., Dolphin, A. E., et al. 2013, AJ, 146, 86, doi: 10.1088/0004-6256/146/4/86
- van den Bosch et al. (2015) van den Bosch, R. C. E., Gebhardt, K., Gültekin, K., Yıldırım, A., & Walsh, J. L. 2015, ApJS, 218, 10, doi: 10.1088/0067-0049/218/1/10
- van der Tak et al. (2008) van der Tak, F. F. S., Aalto, S., & Meijerink, R. 2008, A&A, 477, L5, doi: 10.1051/0004-6361:20078824
- van Driel et al. (2001) van Driel, W., Marcum, P., Gallagher, J. S., I., et al. 2001, A&A, 378, 370, doi: 10.1051/0004-6361:20011241
- van Driel et al. (2016) van Driel, W., Butcher, Z., Schneider, S., et al. 2016, A&A, 595, A118, doi: 10.1051/0004-6361/201528048
- van Kerkwijk et al. (2010) van Kerkwijk, M. H., Chang, P., & Justham, S. 2010, ApJ, 722, L157, doi: 10.1088/2041-8205/722/2/L157
- Walker et al. (2012) Walker, E. S., Hachinger, S., Mazzali, P. A., et al. 2012, MNRAS, 427, 103, doi: 10.1111/j.1365-2966.2012.21928.x
- Wang et al. (2020) Wang, L., Contreras, C., Hu, M., et al. 2020, ApJ, 904, 14, doi: 10.3847/1538-4357/abba82
- Wang et al. (2021) Wang, Q., Rest, A., Zenati, Y., et al. 2021, ApJ, 923, 167, doi: 10.3847/1538-4357/ac2c84
- Wang et al. (2023) Wang, Q., Rest, A., Dimitriadis, G., et al. 2023, arXiv e-prints, arXiv:2305.03779, doi: 10.48550/arXiv.2305.03779
- Ward et al. (2022) Ward, S. M., Thorp, S., Mandel, K. S., et al. 2022, arXiv e-prints, arXiv:2209.10558, doi: 10.48550/arXiv.2209.10558
- Webbink (1984) Webbink, R. F. 1984, ApJ, 277, 355, doi: 10.1086/161701
- Wee et al. (2018) Wee, J., Chakraborty, N., Wang, J., & Penprase, B. E. 2018, ApJ, 863, 90, doi: 10.3847/1538-4357/aacd4e
- Whelan & Iben (1973) Whelan, J., & Iben, Icko, J. 1973, ApJ, 186, 1007, doi: 10.1086/152565
- White et al. (2015) White, C. J., Kasliwal, M. M., Nugent, P. E., et al. 2015, ApJ, 799, 52, doi: 10.1088/0004-637X/799/1/52
- Woosley & Kasen (2011) Woosley, S. E., & Kasen, D. 2011, ApJ, 734, 38, doi: 10.1088/0004-637X/734/1/38
- Woosley & Weaver (1994) Woosley, S. E., & Weaver, T. A. 1994, ApJ, 423, 371, doi: 10.1086/173813
- Xi et al. (2023) Xi, G., Wang, X., Li, G., et al. 2023, arXiv e-prints, arXiv:2309.09213. https://arxiv.org/abs/2309.09213
- Yamanaka et al. (2009) Yamanaka, M., Kawabata, K. S., Kinugasa, K., et al. 2009, ApJ, 707, L118, doi: 10.1088/0004-637X/707/2/L118
- Yamanaka et al. (2014) Yamanaka, M., Maeda, K., Kawabata, M., et al. 2014, ApJ, 782, L35, doi: 10.1088/2041-8205/782/2/L35
- Yang et al. (2020) Yang, Y., Hoeflich, P., Baade, D., et al. 2020, ApJ, 902, 46, doi: 10.3847/1538-4357/aba759
- Yoon & Langer (2005) Yoon, S. C., & Langer, N. 2005, A&A, 435, 967, doi: 10.1051/0004-6361:20042542
- Zeng et al. (2021) Zeng, X., Wang, X., Esamdin, A., et al. 2021, ApJ, 919, 49, doi: 10.3847/1538-4357/ac0e9c
- Zhang et al. (2022) Zhang, Y., Zhang, T., Danzengluobu, et al. 2022, PASP, 134, 074201, doi: 10.1088/1538-3873/ac7583
- Zheng et al. (2013) Zheng, W., Silverman, J. M., Filippenko, A. V., et al. 2013, ApJ, 778, L15, doi: 10.1088/2041-8205/778/1/L15
- Zheng et al. (2014) Zheng, W., Shivvers, I., Filippenko, A. V., et al. 2014, ApJ, 783, L24, doi: 10.1088/2041-8205/783/1/L24
Appendix A Specific Comments on SNe Ia in Our Sample
The majority of SNe Ia in our sample are well documented in the literature due to their early discoveries and intense follow-up campaigns compared to the majority of SNe Ia. In this section, we comment on our early-time light curve categorization for each SN Ia, which categorizes the SNe Ia sample into three groups: single, double, and bump as discussed in Section 2. We also provide a discussion on adopted values as well as . For some SNe Ia, the only literature extinction estimate is from the Poznanski et al. (2012) Na i D pEW relationship, which we adopt with the reported uncertainties (although see Phillips et al. 2013). Lastly, spectroscopic classification data were taken from TNS or individual object papers, as available.
A.1 SN 2009ig
Foley et al. (2012) report mag for the host galaxy of SN 2009ig and on MJD 55080.04. The Milky Way extinction is mag (Schlafly & Finkbeiner, 2011).
Foley et al. (2012) reported early-time observations of SN 2009ig, a normal SN Ia. After subtracting a Arnett (1982) fireball model, SN 2009ig has positive residuals which are indicative of excess flux above what is expected with the fireball model. However, Foley et al. (2012) found the rise was well fit with a single component power law. Given this acceptable single-component fit, we categorize SN 2009ig as an SN Ia without early-time excess flux (i.e., as a single SN Ia). This determination is similar to Jiang et al. (2018), who also categorize SN 2009ig as having no early excess in either the UV or the optical.
A.2 SN 2011fe
Pereira et al. (2013) report on MJD 55814.51 and a host galaxy extinction of mag. The Milky Way extinction is mag (Schlafly & Finkbeiner, 2011).
SN 2011fe was an incredibly nearby normal SN Ia Nugent et al. (2011). Located in M 101 (NGC 5457) at 6.4 Mpc (Shappee & Stanek, 2011), SN 2011fe is one of the most nearby SN Ia to date. As such, extensive searches for companion interaction under the Kasen (2010) models have been performed, all yielding no evidence of companion interaction (Li et al., 2011; Röpke et al., 2012; Brown et al., 2012; Shappee et al., 2013b, 2017; Tucker et al., 2022a, b) or even a surviving companion (Lundqvist et al., 2015) which are predicted to be overluminous (Shappee et al., 2013a). Given the large sample of early data indicating strong agreement with the fireball model, we categorize SN 2011fe as a single SN Ia.
A.3 SN 2012cg
SN 2012cg was initially reported by Silverman et al. (2012), and they found occurred on MJD =56080.0 and mag. Marion et al. (2016) also studied SN 2012cg and found on MJD 56081.3. Finally, Munari et al. (2013) determined happened on MJD 56082.0. We elect to use the Marion et al. (2016) value for , which is consistent with the Munari et al. (2013) value. The Milky Way extinction is mag (Schlafly & Finkbeiner, 2011).
SN 2012cg was initially reported by Silverman et al. (2012). Subsequent studies found evidence for (Marion et al., 2016) and against (Shappee et al., 2018) companion interaction. Irrespective to the mechanism of the early-time emission, it is clear that emission beyond the predicted fireball model was detected. Thus, we categorize SN 2012 in the doube category.
A.4 SN 2012fr
Childress et al. (2013) presented the first study of SN 2012fr and derived on MJD 56243.0 and an upper limit of mag via the Na i D line. A later study by Contreras et al. (2018) found a similar on MJD 56242.6. Contreras et al. (2018) examined the host-galaxy extinction using both the Na i D line from different spectra than Childress et al. (2013) as well as high quality Carnegie Supernova Project II (Phillips et al., 2019) photometry. This analysis by Contreras et al. (2018) resulted in a final mag. We use the values from Contreras et al. (2018) in our analysis. The Milky Way extinction is mag (Schlafly & Finkbeiner, 2011).
There is a similarity between SN 2012fr and SN 2014J shown in Contreras et al. (2018), which suggests that the broken power law fitted to SN 2014J by Zheng et al. (2014) matches the data of SN 2012fr well. We categorize SN 2012fr as a double SN Ia, which is different than the categorization of Jiang et al. (2018), who categorize SN 2012fr as having no excess. Our determination is based on information provided in Contreras et al. (2018) which Jiang et al. (2018) may not have had available to the,.
A.5 SN 2012ht
Yamanaka et al. (2014) found to be on MJD 56295.6, and they claim host-galaxy extinction is negligible. We accept their claim as valid given the presented color curve in their Figure 1, as well as the lack of visible Na i D in their spectra. However, a negligible extinction in the optical will be larger in the UV, so we assume a host galaxy extinction of mag to extrapolate to the Swift UV filters. The Milky Way line of sight extinction from Schlafly & Finkbeiner (2011) is mag.
A.6 LSQ12gdj
A.7 SN 2013dy
A.8 SN 2013gy
Holmbo et al. (2019) present the discovery and an analysis of SN 2013gy where they find mag and on MJD 56648.5 from SNooPy (Burns et al., 2011, 2014) fits. The Schlafly & Finkbeiner (2011) Milky Way extinction toward SN 2013gy is mag.
A single power-law rise fits the early-time light curve of SN 2013gy (Holmbo et al., 2019), so we categorize it as a single SN Ia.
A.9 iPTF13dge
iPTF13dge was studied by Ferretti et al. (2016) who found occurred on MJD 56558.0. Ferretti et al. (2016) determined there was minimal host-galaxy toward iPTF13dge. They derived a value of mag. The Milky Way extinction for SN 2013gh is mag (Schlafly & Finkbeiner, 2011).
In their analysis, Ferretti et al. (2016) did not include fits to the early-time light curve, however, we find no evidence for a two-component power-law rise hence we categorize iPTF13dge as a single SN Ia.
A.10 iPTF13ebh
A.11 ASASSN-14lp
SNooPY fits performed by Shappee et al. (2016) show that the -band maximum of ASASSN-14lp was on MJD 57015.3 and had a host-galaxy extinction of mag. Fits performed by Shappee et al. (2016) find that ASASSN-14lp is in good agreement with a single-component power-law early-time light curve rise. The Milky Way extinction is mag (Schlafly & Finkbeiner, 2011).
A.12 iPTF14atg
Determinations for the and for iPTF14atg come from two different sources. First, Cao et al. (2015) determine that of iPTF14atg occurred on MJD 56799.2, but they do not provide an estimate for the host-galaxy extinction in their manuscript. Second, Kromer et al. (2016) determine the host-galaxy extinction for iPTF14atg is mag based on the Na i D line. We adopt a slightly different value of mag, which is consistent with the Kromer et al. (2015) value but is in the same band as all the other SNe Ia in our sample. The Milky Way extinction is mag (Schlafly & Finkbeiner, 2011).
A.13 iPTF14bdn
Smitka et al. (2015) find no evidence of extinction in the spectra of iPTF14bdn, thus we assume mag. is on MJD 56822.5 (Smitka et al., 2015). The Milky Way extinction is mag (Schlafly & Finkbeiner, 2011).
While the early-time Swift photometry in Smitka et al. (2015) may have an early-time bump, we found no bump after redoing the photometry. Thus, we categorize iPTF14bdn as double SN Ia.
A.14 SN 2014J
We adopt from Foley et al. (2014) which is MJD 56690.0. Unfortunately, determining the host-galaxy extinction is not so straightforward.
SN 2014J is one of the most heavily extincted SNe Ia to date. As such, there are a plethora of estimates on the host-galaxy extinction for this object. Amanullah et al. (2014) perform various extinction fits to their data. Their power-law fit () yielded mag, whereas their MW-like fit based on the Fitzpatrick (1999) parametrization yielded mag with .
Alternatively, Ashall et al. (2014) determine the host-galaxy extinction via selecting the and values which optimize their abundance tomography models. This yields mag and .
Goobar et al. (2014) present two extinction values, one from SNooPy fits and the other based on the Phillips et al. (2013) method. The SNooPy fits yield mag with and the Phillips et al. (2013) method yields mag
Finally, Foley et al. (2014) presents several further calculations of for SN 2014J. First, by using distant independent optical-infrared colors, they derive mag. Second, using the Phillips et al. (2013) relation, they derive mag from their high-resolution spectrum. Finally, using the color excess method, they derive mag using a Fitzpatrick (1999) parametrization and mag using a Cardelli et al. (1989) parametrization.
We elect to adopt the Foley et al. (2014) value measured by the high-resolution spectrum, which is also consistent with their color excess fits as well as the power-law model from Amanullah et al. (2014). Specifically, we take the value to be mag.
Siverd et al. (2015) find peak light on MJD 56690.62 using data from the Kilodegree Extremely Little Telescope North (Pepper et al., 2007; Siverd et al., 2012).
Zheng et al. (2014) demonstrate a two-component power-law fit to the early-time light curve rise, and Goobar et al. (2015) also found that multiple components better fit the rising light curve. Thus, we categorize SN 2014J as a double SN Ia. Unfortunately, the extinction is so severe in the UV that SN 2014J is not comparable in the UV to other SNe Ia, thus we do not include it in plots and only include this discussion for completeness of the early-time SN Ia sample.
A.15 SN 2015F
Using MLCS2k2 (Jha et al., 2007), Im et al. (2015) find mag and on MJD 57105.98. Cartier et al. (2017) estimate the to be MJD 57106.5. Using the optical and near-infrared colors, they calculate various values, the weighted average of which they calculate to be mag. Their individual calculations use bot the optical (Phillips et al., 1999) and near-infrared (Krisciunas et al., 2004a, b) colors. The Milky Way extinction is mag (Schlafly & Finkbeiner, 2011).
Im et al. (2015) fit both single and double power laws to the early-time data of SN 2015F and find that the single-component power-law gives the best fit and that the double power law fit converges to the single power law result. Thus, we categorize SN 2015F as a single SN Ia, which is consistent with the categorization of Jiang et al. (2018).
A.16 SN 2015bq
Li et al. (2022) determined was on MJD 57084.1. By performing fits using the SALT2 modelling program (Guy et al., 2007), Li et al. (2022) calculate mag. The Milky Way extinction is mag (Schlafly & Finkbeiner, 2011).
An early-time flux excess is claimed by Li et al. (2022). Their data show SN 2015bq has early-time flux which is greater than the normal SNe Ia they compare to. While the data is not early enough to be fit by power-law rises, we still opt to categorize SN 2015bq as an double SN Ia. Because SN 2015bq lacks Swift detections in the critical band, we do not include it in our analysis, but we mention it here for completeness.
A.17 iPTF16abc
Ferretti et al. (2017) find a value of MJD 57498.8 for and mag from fitting the SED of SN 2011fe to the iPTF16abc data. Using SALT2, they find mag. Despite finding deep Na i D lines, Ferretti et al. (2017) find weak reddening in the photometry of iPTF16abc. Dhawan et al. (2018) fit iPTF16abc using SNooPy and find mag and . Finally, Miller et al. (2018) adopt mag from Ferretti et al. (2017) and determine occurred on MJD 57499.5.
We adopt the values from Ferretti et al. (2017). Finally, the Milky Way extinction from Schlafly & Finkbeiner (2011) is mag.
Miller et al. (2018) present early-rise fits and find that a model does not adequately describe the rising light curve of iPTF16abc whereas a nearly linear model fits the rise well. They did not fit a two-component power law, but given the single-component power law fits the rise well, we categorize iPTF16abc as a single SN Ia, which is different than the determination of Jiang et al. (2018).
A.18 SN 2017cbv
The five papers on SN 2017cbv agree on both and host-galaxy extinction. First, Hosseinzadeh et al. (2017) find on MJD 57841.1 and negligible host-galaxy extinction due to the lack of Na i D absorption in their spectra. Second, Ferretti et al. (2017) find mag from the Na i D line using the method of Poznanski et al. (2012). Third, Wee et al. (2018) determine to be on MJD 57840.4 and negligible host-galaxy extinction. Fourth, Wang et al. (2020) again find no significant host-galaxy extinction and a value of MJD 57840.4. Finally, Burke et al. (2022b) find no host-galaxy extinction and MJD 57840.3 as . For this work, we will use on MJD 57841.1 from Hosseinzadeh et al. (2017) and mag from Ferretti et al. (2017) (assuming ). The Milky Way extinction from Schlafly & Finkbeiner (2011) is mag.
Hosseinzadeh et al. (2017) and Burke et al. (2022b) show SN 2017cbv is fit better by multiple component models, and Jiang et al. (2018) categorize SN 2017cbv as a SN Ia with an early excess. Given that the light curve for SN 2017cbv monotonically increases in all the optical and UV bands, we place SN 2017cbv in our double category rather than the bump category.
A.19 SN 2017cfd
Han et al. (2020) estimate mag from MLCS2k2 (Jha et al., 2007) fitting with an assumed . This was presumably chosen by Han et al. (2020) to yield a peak -band absolute magnitude of mag. They also derive mag from the Na i D absorption line, however, they note that this large of an extinction value would make SN 2017cfd significantly brighter than most other SNe Ia at its on MJD 57843.4. The Milky Way extinction is mag (Schlafly & Finkbeiner, 2011). Finally, Han et al. (2020) show that SN 2017cfd is a normal SN Ia with a single power-law rise, thus we categorize SN 2017cfd as a single SN Ia.
A.20 SN 2017cyy
Burke et al. (2022b) find on MJD 57870.1 and negligible host-galaxy extinction. Thus, we assume a nominal host-galaxy extinction of mag. The Milky Way extinction is mag (Schlafly & Finkbeiner, 2011). Burke et al. (2022b) find no evidence of a two-component power-law rise. Thus, we categorize SN 2017cyy as a single SN Ia.
A.21 SN 2017erp
Brown et al. (2019) find MJD 57934.9 for as well as several values for the host-galaxy extinction which they list in their Table 3. The methods Brown et al. (2019) use to estimate the host-galaxy extinction are the peak color, the Lira et al. (1998) law, Na i D fitting, and color excess from SNooPy and MLCS2k2 fits. Consistently, Burke et al. (2022b) find mag and on MJD 57934.4 from SNooPy fits. We opt to combine the values from Brown et al. (2019) using a weighted average for our final extinction of mag. The Milky Way extinction is mag (Schlafly & Finkbeiner, 2011).
We categorize SN 2017erp as a single SN Ia despite the claim of companion interaction from Burke et al. (2022b). While they claim a two-component model fits the data better, the additional flux from the second component appears to only marginally improve the quality of the light curve fit.
A.22 SN 2017fgc
Three studies independently derive SN properties for SN 2017fgc. First, Zeng et al. (2021) also fit SN 2017fgc with SNooPy and find from the fits that was on MJD 57959.4 that the host-galaxy extinction is mag. Second, Burgaz et al. (2021) derive on MJD 57958.7 and adopt a host-galaxy extinction of mag from the Lira law Phillips et al. (1999). Finally, Burke et al. (2022b) fit SN 2017 with SNooPY and derived on MJD 57959.5 and a host-galaxy extinction of mag. We adopt the values from Burke et al. (2022b) because their light curve is the most dense and their data is solely from Las Cumbres Observatory Global Telescope observations (Brown et al., 2013), so -corrections do not introduce an additional systematic uncertainty. The Milky Way extinction is mag Schlafly & Finkbeiner (2011).
A.23 ASASSN-18bt (SN 2018oh)
The three synoptic studies of ASASSN-18bt shortly after explosion (Dimitriadis et al. 2019; Li et al. 2019; Shappee et al. 2019) all used the and derived by Li et al. (2019). Li et al. (2019) performed fits using SALT2, SNooPy, and MLCS2k2, which were all consistent. The values of their SNooPy fits are and on MJD 58162.7. We adopt their values but alter their value to be such that we can extrapolate the small host-galaxy extinction into the UV. The Milky Way extinction is mag (Schlafly & Finkbeiner, 2011).
Shappee et al. (2019) showed the rising light curve of ASASSN-18bt was fit the best by a two-component power law, so we categorize ASASSN-18bt as a double SN Ia.
A.24 SN 2018gv
Both Yang et al. (2020) and Burke et al. (2022b) agree that there is negligible optical host-galaxy extinction. While Burke et al. (2022b) does not provide an estimate for the host galaxy-extinction, Yang et al. (2020) uses the “CMAGIC” technique to estimate mag, which we adopt. The Milky Way extinction is mag (Schlafly & Finkbeiner, 2011).
A.25 SN 2018xx
A.26 SN 2018yu
From SNooPy fits, Burke et al. (2022b) determine MJD 58183.3 for . Burke et al. (2022b) claim negligible host-galaxy extinction, thus we adopt mag. The Milky Way extinction is mag (Schlafly & Finkbeiner, 2011).
While Burke et al. (2022b) claim an early-excess flux from companion interaction in the rising light curve of SN 2018yu, the companion shock contribution to the early-time light curve rise is small, and neither Tucker et al. (2020) nor Graham et al. (2022) find evidence of H in the nebular spectra. Additionally, the companion flux contribution appears small, so the improvement to the fit is marginal. Thus, we categorize SN 2018yu as a single SN Ia.
A.27 SN 2018agk
Wang et al. (2021) determined was on MJD 58203.8 and from the Na i D line relationship from Poznanski et al. (2012) they estimate mag. The Milky Way extinction is mag (Schlafly & Finkbeiner, 2011).
The early-time light curve was fit best by a single power law by Wang et al. (2021) using Kepler data. Hence, we categorize SN 2018agk as a single SN Ia. SN 2018agk is distant ( Mpc), so the UV data is faint – there is only 1 detection in the band and it is barely above 3. SN 2018agk is included in the tables for completion but is not factored into our analysis.
A.28 SN 2018aoz
Ni et al. (2022) found on MJD 58222.2 via a SNooPy fit and an upper limit for the host-galaxy extinction of mag via fitting the Na i D line.
Burke et al. (2022b) also performed SNooPy fits and derived MJD 58222.1 for and negligible host-galaxy extinction. We adopt the values from Ni et al. (2022). The Milky Way extinction is mag (Schlafly & Finkbeiner, 2011).
A.29 SN 2019np
Burke et al. (2022b) used SNooPy to fit SN 2019np and found MJD 58509.6 to be . Sai et al. (2022) fit a polynomial to the light curve of SN 2019np and found on MJD 58510.2. From SNooPy fits and the Na i D absorption equivalent width, Sai et al. (2022) determine mag. The Milky Way extinction is mag (Schlafly & Finkbeiner, 2011).
Burke et al. (2022b) do not find signatures of companion interaction, which is consistent with the later work by Ni et al. (2022) and Ni et al. (2023). However, Ni et al. (2023) finds that, while reddened at early times (Ni et al., 2022), SN 2019np has an early-excess flux consistent with a multiple-power-law rise. Thus, we categorize SN 2019np as a double SN Ia.
A.30 SN 2019ein
Pellegrino et al. (2020) find on MJD 58619.5 from SALT2 fits, and they assume the host-galaxy extinction from Kawabata et al. (2020). Kawabata et al. (2020) determine on MJD 58618.2 from polynomial fit to data around maximum. We adopt the SALT2 fit result from Pellegrino et al. (2020) as our . The Milky Way extinction is mag (Schlafly & Finkbeiner, 2011).
They estimate the host-galaxy extinction from SNooPy fits, Phillips et al. (1999) and Reindl et al. (2005) evolution relationships, and the Si ii 6355 and peak intrinsic color relationships from Foley et al. (2011) and Blondin et al. (2012). Ultimately, they assume the SNooPy value, which we will also adopt. This value is mag and which corresponds to mag.
SN 2019ein does not show an early excess Kawabata et al. (2020), so we label it as a single SN Ia.
A.31 SN 2019yvq
Both Miller et al. (2020) and Burke et al. (2021) are in agreement on when occurred, with respective values of MJD 58863.3 and 58863.1. We adopt the mean value of MJD 58863.2 for .
With respect to host-galaxy extinction, Miller et al. (2020) used Na i D lines to find mag. Burke et al. (2021) found that light curve fitting methods resulted in highly discordant estimates for the host-galaxy extinction. This is to be expected given how unique SN 2019yvq is. However, Burke et al. (2021) fit the Na i D line and found mag. This is consistent with the derived host-galaxy extinction from Miller et al. (2020). We adopt the Burke et al. (2021) host-galaxy extinction value. The Milky Way extinction is mag (Schlafly & Finkbeiner, 2011).
A.32 SN 2020hvf
Jiang et al. (2021) suggest negligible host-galaxy extinction from a lack of Na i D absorption in their spectra as well as a large distance from the center of the host galaxy and a of MJD 58979.3 from a polynomial fit to the data near peak. We adopt their values, assuming mag. The Milky Way extinction is mag (Schlafly & Finkbeiner, 2011).
The data presented by Jiang et al. (2021) show a clear early bump for SN 2020hvf, thus we categorize it as a bump SN Ia.
A.33 SN 2020nlb
Sand et al. (2021) fit a fourth-order polynomial to the data near peak and perform 1000 resamples based on the photometric uncertainties. They find negligible host-galaxy extinction based on the Phillips et al. (1999) relationship and MJD 59041.8 as . We adopt their value for and assume mag. The Milky Way extinction is mag (Schlafly & Finkbeiner, 2011).
There are early-time data available for SN 2020nlb, however, Sand et al. (2021) does not fit the early-time light curve. We perform an MCMC fit using emcee (Foreman-Mackey et al., 2013) to the rising light curve and find it is consistent with a single-power-law rise. Thus, we categorize SN 2020nlb as a single SN Ia.
A.34 SN 2020tld
Fausnaugh et al. (2023) present TESS observations of SN 2020tld. The TESS data do not cover the light curve peak. Since their observations are only in one band and they have no spectra, the host-galaxy extinction is uncertain. However, SN 2020tld lies well outside its host, so we assume mag. Finally, the rising light curve fits from Fausnaugh et al. (2023) disfavor companion interaction, so we categorize SN 2020tld as a single SN Ia. There are no pre-explosion images, nor post-explosion templates in Swift for SN 2020tld, so we do not include it in our figures or analysis. We mention it here for completeness
A.35 SN 2020udy
Maguire et al. (2023) found a -band maximum light on MJD 59131.0, which we adopt as . and are close enough that this assumption will not significantly impact any of our results. Since they do not observe any Na i D absorption in their spectra, Maguire et al. (2023) claim negligible host-galaxy extinction. Thus, we assume mag for SN 2020udy. The Milky Way extinction is mag (Schlafly & Finkbeiner, 2011). Finally, Maguire et al. (2023) fit a single power law to the early-time light curve rise, thus we categorize SN 2020udy as a single SN Ia. Unfortunately, SN 2020udy lacks pre-explosion imaging, so we exclude it from our analysis because the photometry would not be host-subtracted.
A.36 SN 2021fxy
DerKacy et al. (2023) fit the light curves of SN 2021fxy with SNooPy. From these fits, they find on MJD 59305.1 and a small host-galaxy extinction of mag. We adopt these values, along with a Milky Way extinction of mag (Schlafly & Finkbeiner, 2011). The light curves presented by DerKacy et al. (2023) are consistent with a single-component rise, so we categorize SN 2021fxy as a single SN Ia.
A.37 SN 2021hpr
Zhang et al. (2022) fit the light curve peak with a 2nd order polynomial and determine was on MJD 59321.9. They posit negligible host-galaxy extinction. Ward et al. (2022) fit SN 2021hpr using the BayeSN fitting program (Thorp et al., 2021; Mandel et al., 2022). They find on MJD 59321.4. Their Bayesian framework enables fitting with a fixed and with a uniform prior between 1 and 6. With fixed at , they find mag; with drawn from a uniform prior distribution , they find mag. Finally, Lim et al. (2023) use the Phillips et al. (1999) relationship to estimate the host-galaxy extinction, which yields an estimate of mag. For , they find that the light curve peaked on MJD 59321.7. We adopt the values from Ward et al. (2022). The Milky Way extinction is mag (Schlafly & Finkbeiner, 2011).
Lim et al. (2023) found a two-component best fit SN 2021hpr, thus we categorize it as an double SN Ia.
A.38 SN 2021zny
Dimitriadis et al. (2023) found that SN 2021zny peaked on MJD 59498.4 by fitting the light curve near peak with a polynomial. Using the Na i D line and the Poznanski et al. (2012) relationship, they derive mag. We adopt both of their values for this work. The Milky Way extinction is mag (Schlafly & Finkbeiner, 2011).
TESS observed SN 2021zny, and the rising TESS lightcurve shows a small bump (Dimitriadis et al., 2023; Fausnaugh et al., 2023). However, Fausnaugh et al. (2023) express some concerns over the veracity of this bump. They note similar light curve variations at the light curve peak. Furthermore, they note that SN 2021zny is on a CCD strap, which should produce noise similar to the observed peak variations. Their light curve fits disfavor companion interaction, so this is an argument against an astrophysical origin for the bump. We categorize SN 2021zny as a bump Ia with the caveats noted by Fausnaugh et al. (2023).
A.39 SN 2021aefx
Ashall et al. (2022) find on MJD 59547.2 and do not provide a host-galaxy extinction value. Hosseinzadeh et al. (2022) find MJD 59546.5 as using a polynomial fit to the data near peak. They use their high-resolution spectrum to determine host-galaxy extinction from the Na i D line using the method of Poznanski et al. (2012). They find mag. Using the Phillips et al. (1999) relationship, they find mag, which is consistent with their Na i D-derived value. We adopt the values from Hosseinzadeh et al. (2022) for both and , specifically, mag from the Na i D line. The Milky Way extinction is mag (Schlafly & Finkbeiner, 2011).
A.40 SN 2022eyw
Fausnaugh et al. (2023) present TESS observations of SN 2022eyw, however, the TESS sector only covers the rising light curve and not the peak. Since their observations are only in one band, we adopt an extinction of mag, motivated by the lack of Na i D in the TNS spectra, but the position is in the host galaxy, so there may be some extinction. The Milky Way extinction is mag (Schlafly & Finkbeiner, 2011).
The rising light curve fits from Fausnaugh et al. (2023) disfavor companion interaction, so we categorize SN 2022eyw as a single SN Ia. There are no pre-explosion images, nor post-explosion templates in Swift for SN 2022eyw, so we do not include it in our figures or analysis. We mention it here for completeness.
A.41 SN 2022ilv
Srivastav et al. (2023a) searched for a host-galaxy, however, they did not satisfactorily locate a clear host-galaxy candidate. Because there is no sign of a host galaxy or Na i D lines, we conclude that there is negligible host-galaxy extinction. In line with other SNe Ia in our sample with negligible host-galaxy extinction, we assume mag. While they do not clearly state the they derive, it can be inferred from other statements in the paper to be on MJD 59707.5. The Milky Way extinction is mag (Schlafly & Finkbeiner, 2011).
SN 2022ilv shows an early-time bump based on an ATLAS non-detection. Srivastav et al. (2023a) evaluate this non-detection and determine it is valid. We agree with their determination and thus, we categorize SN 2022ilv as a bump SN Ia.
A.42 SN 2023bee
Both Wang et al. (2023) and Hosseinzadeh et al. (2023) agree that host-galaxy extinction is negligible, thus we adopt mag. For , we adopt MJD 59992.5 as our value, which is the average between the Wang et al. (2023) and Hosseinzadeh et al. (2023) values of MJD 59992.6 and MJD 59992.4, respectively. The Milky Way extinction is mag (Schlafly & Finkbeiner, 2011).