Access to the full 3D Brillouin zone with time resolution, using a new tool for pump-probe ARPES
Abstract
Here we report the first time- and angle-resolved photoemission spectroscopy (TR-ARPES) with the new Fermiologics “FeSuMa” analyzer. The new experimental setup has been commissioned at the Artemis laboratory of the UK Central Laser Facility. We explain here some of the advantages of the FeSuMa for TR-ARPES and discuss how its capabilities relate to those of hemispherical analyzers and momentum microscopes. We have integrated the FeSuMa into an optimized pump-probe beamline that permits photon-energy- (i.e., -) dependent scanning, using probe energies generated from high harmonics in a gas jet. The advantages of using the FeSuMa in this situation include the possibility of taking advantage of its “fisheye” mode of operation.
pacs:
73.20.At,73.20.r,07.81.a,07.05.FbI Introduction
Pump-probe time- and angle-resolved photoemission spectroscopy (TR-ARPES) presents challenges, both with respect to light sources and to detection, that do not arise in “static” ARPES measurements of systems at equilibrium. In this paper, we describe the commissioning of the newly-developed “FeSuMa” analyser on a beamline for high-harmonic generation (HHG) at the UK Central Laser Facility’s Artemis Laboratory. We demonstrate efficient acquisition of high-quality ARPES spectra of optically pumped excitations close to the Fermi level, and we use the FeSuMa’s “fisheye” measurement mode in combination with the beamline’s capability to switch rapidly between ultraviolet photon energies that are generated as high harmonics in an Ar gas jet. We suggest that this measurement configuration offers major benefits as a cost-efficient laboratory-scale approach to time-resolved TR-ARPES.
I.1 State of the Art in Pump-Probe TR-ARPES
Compared to its static equivalent, an ultrafast TR-ARPES measurement adds a “pump” laser pulse, which—arriving at a well-defined delay time before the system is probed—promotes the system into an optically excited state. The transient, out-of-equilibrium state and its evolution in time are the subject of study. Both the probe and the pump pulses must be short (i.e., must have narrow width in the time domain) relative to the time scales of the physical phenomena to be measured, and the pulse train of the pump must be well synchronized to that of the probe. The pulse widths and the pulse synchronization determine the limits of time resolution in the experiment.
I.1.1 Background: Light Sources
Pump-probe methods require the simultaneous generation of synchronized pulse trains of very different energies. In TR-ARPES, an infrared (IR) or visible pulsed beam is needed for excitation, while an ultraviolet (UV) or extreme ultraviolet (XUV) beam probes the system via photoexcitation. The Fourier limit places a strict boundary on the energy resolution achievable in an experiment, depending on what time resolution is needed (or, vice versa, if energy resolution is critical, then the Fourier limit determines the maximum achievable time resolution). The demands on the resolution are set by the time and energy scales of the physical phenomena of interest: for example, studies of electron-electron interactions typically demand time resolution of no worse than tens of fs Petek and Ogawa (1997).
Light sources commonly used to supply the pulsed ultraviolet probe beam include tabletop laser setups Zhou et al. (2018); Suzuki, Shin, and Ozaki (2021) and free-electron lasers Zhou et al. (2018); Grychtol et al. (2022); Kutnyakhov et al. (2020). This paper deals with tabletop laser setups. Wavelengths down to approximately 115 nm (i.e., energies up to approximately 11 eV) are achievable with commercial off-the-shelf laser systems Peng et al. (2018). However, even at 11 eV, one can access only a relatively small section of momentum space up to approximately 1.3 Å-1. Off-the-shelf laser systems cannot generate photons in the tens-of-eV range that allows ARPES to access the full three-dimensional (3D) Brillioun zone of most crystalline materials, or that gives access to shallow-lying core-level states. To reach this range in a tabletop setup, one typically relies on HHG—usually in a gas jetSuzuki, Shin, and Ozaki (2021); Frassetto et al. (2011).
It is possible to use a single powerful laser to generate both the IR pump and the HHG XUV beam. An advantage of this approach is that the pulse trains of the two beams are automatically synchronized. The method works by taking the IR beam from a commercial laser system and splitting it into two parts, one of which is used to generate HHG, and the other of which is sent along a separate beam path for use as a pump. A movable delay stage in one of the beamlines (typically the pump beamline) controls the pulse separation , and then the two beams are recombined.
In a 3D-dispersing system, the probe photon energy determines which part of the 3D Brillouin zone is measured. Control of the probe energy also allows for optimization of photoemission intensity in electronic states of interest, via control of final state and matrix element effects Damascelli, Hussain, and Shen (2003); Sobota, He, and Shen (2021); Boschini et al. (2020); Gierz et al. (2011, 2012). While this is the basis for photon-energy-dependent synchrotron-based studies of out-of-plane-dispersing “” states, the situation is more challenging for laser-based experiments: while a synchrotron (or FEL) undulator can generate probe photons with continuously tunable energy across a wide range Peatman (1997), no such continuous spectrum is possible with laser-based HHG. Rather, HHG produces a “frequency comb” of odd-ordered harmonics Jaeglé (2000) (Fig. 1(b)). A single frequency from the comb can be selected with a combination of reflective and transmissive optics Puppin et al. (2019). At Artemis, we take an alternative approach, using a grating monochromator, which spatially separates the frequencies of the HHG comb into a “fan”, and a slit that picks out a single frequency from the fan Frassetto et al. (2011); Heber et al. (2022). When the monochromator is properly aligned, any frequency in the comb can be quickly selected on-the-fly, which provides great flexibility to choose different photon energiesFrassetto et al. (2011). The power of this type of approach has recently been demonstrated Heber et al. (2022).
I.1.2 Background: Photoelectron Detection and Analysers
The best-established technology for photoelectron spectroscopy is the hemispherical analyser (HA). This tool measures photoemission intensity as a function of momentum and energy across a wide range of binding energies and with energy resolution that is better than 1 meV Iwasawa et al. (2017). The HA has been the workhorse of the photoemission community, and is likely to remain so for the foreseeable future. Moreover, state-of-the art HA technology increasingly incorporates advanced features; for example, spin detection. However, if electronic states of interest do not correspond to a single set of emission angles along the slit direction of the analyzer, then multiple HA measurements must be taken—either by rotating the sample in front of the analyzer, or by applying “deflector” voltages to the electron lens column in order to sample emission angles away from the slit direction. This works well, but can be a challenge in the context of pump-probe measurements, where each data set is intrinsically time consuming (on account of the need to acquire spectra at multiple time delays). When important physics arise simultaneously in multiple parts of the Brillouin zone, or when photon-energy-dependent measurements will cause the 3D Brillouin zone to shrink and expand on the detector, an alternative approach to detection is desirable. Moreover, in the case of short-pulse pump-probe applications, the high energy resolution of the analyser greatly exceeds the Fourier limit of the short light pulses.
Recent years have seen rapid advancements in new types of analyser technologies Schönhense, Medjanik, and Elmers (2015); Maklar et al. (2020); Tusche et al. (2020). Some are based on time-of-flight (ToF), among which are various types of photoemission electron microscopes (PEEMs) and momentum microscopes (MMs) Suga, Sekiyama, and Tusche (2021). These new techniques are powerful, permitting sophisticated momentum-space and real-space mapping, but they also present new challenges. In the case of PEEM and ToF-MM, a large potential difference must be applied between the sample and the objective lens of the electron optics. Because these are close together (on the order of several mm), there is a possibility of dielectric breakdown across the small vacuum gap and, as a result, sample damage. Another challenge, in the case of pulsed-probe measurements, arises with space charge effects in the electron optics Kutnyakhov et al. (2020). This latter issue is discussed below.
Very recently, a new type of simple, economical, and yet highly effective photoelectron analyser has been developed. The working principle—similar to that of velocity map imaging Eppink and Parker (1997); Stei et al. (2013)—has been described in a recent paper Borisenko et al. (2022). From the point of view of pump-probe measurements, we find that this new analyser, which is available commercially under the name“FeSuMa” (“Fermi Surface Mapper”), offers advantages over other types of analysers for some of the most commonly required types of pump-probe ARPES measurements. The technology offers an efficient approach to measurement of the full Brillouin zone. It has a very straightforward application to states near the Fermi surface, which are the primary states of interest for many pump-probe ARPES studies; however, it can also probe deeper-lying states, including shallow-lying core levels. When used on a beamline with photon-energy control, it offers an efficient method for 3D measurements of -dispersing states. Additionally, its user-friendly operation and compact profile make it easy to incorporate into crowded lab spaces and into vacuum chambers that might contain several other tools for various other types of measurements. In the sections that follow, we describe how these advantages have been integrated into our tabletop HHG beamline at Artemis to take advantage of the special capabilities of the FeSuMa in the context of pump-probe ARPES measurements.
II Experimental Details
II.1 Optical Setup
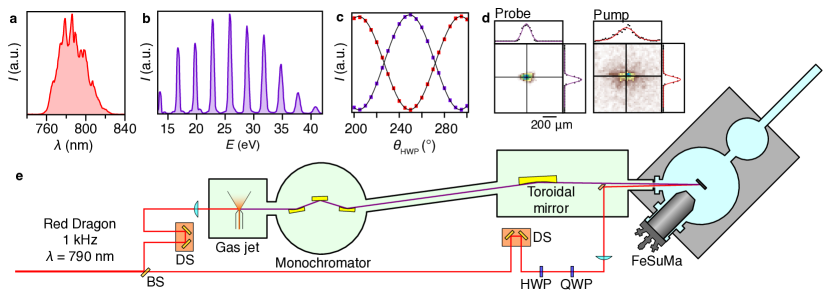
In Fig. 1, we present the layout of the Artemis optical setup for the tests described here. The pump and probe pulses are generated from the output of a 1-kHz Ti:Sapphire laser (upgraded from the RedDragon, KMLabs) with a pulse energy of about 3 mJ at 790 nm. The bandwidth is approximately 50 nm, as shown in Fig. 1(a). The output laser beam is split into two parts, with 80% focused onto a 200 m Ar gas jet, via a lens of 500-mm focal length, for HHG. An example of the resulting XUV spectrum—i.e. the frequency comb—is shown in panel (b). For these conditions, the usable high-harmonic energies range from approximately 17 eV to 45 eV, with a maximum photon flux of about 1010 photons/second/harmonic at 27 eV. A single harmonic is selected by a time-preserving grating monochromatorFrassetto et al. (2008). To avoid space-charge effects, which are discussed in Section IV.2, the photon flux was reduced to 108 photons/second/harmonic by an adjustable slit after the monochromator.
The remaining 20 percent of the output beam is used for pumping, either at its fundamental wavelength or after frequency-doubling or -quadrupling by beta barium borate crystals. A delay stage in the pump beamline enables time-resolved measurements. A half-wave plate (HWP) and a quarter-wave plate (QWP) are added into the pump beamline for polarization control: Fig. 1(c) shows calibration data for the HWP rotation angle (QWP angle was held fixed). The pump beam is finally focused on the sample, using a lens with focal length of 1.5 m. The pump and probe beams reach the sample almost collinearly, with an angle of 45° relative to the sample normal when the sample is at normal emission relative to the detector. The pump fluence is about 2 mJ/cm2, with pump spot size of approximately 250 m at FWHM (450 m at 1/e2 width). The XUV spot size of about 80 m is measured roughly by the size of the spot on a scintillating crystal, and confirmed by the FeSuMa in Direct Mode (see Section II.2). The images of the two beam spots recorded by FeSuMa are presented in Fig. 1(d). The time resolution is determined from the auto-correlation spectrum, as shown in the Supplementary Material sup .
II.2 Working Principles of FeSuMa
The FeSuMa is a new type of ARPES analyser that combines Fourier electron optics with retarding field techniques Borisenko et al. (2022). The lens of the device consists of several cylindrical elements that represent the simplest element of electron optics—the Einzel lens. It focuses parallel electron beams, originating from the sample surface, into corresponding points in the focal plane. This is similar to the action of a convex optical lens which makes a Fourier transformation of light. The novelty of the approach is in placing the detector, a multichannel plate (MCP), directly in the focal plane, and applying a retarding potential, , to the front of the MCP. In practice, the focal points lie not on a plane but on a curved surface, and the detector is placed so as to achieve a reasonable balance between angular acceptance and angular resolution. The signal is amplified by a pair of MCPs in “chevron” geometry, and is converted into photons by a phosphorus screen. A camera outside the vacuum captures the image and sends it to the computer for further processing.
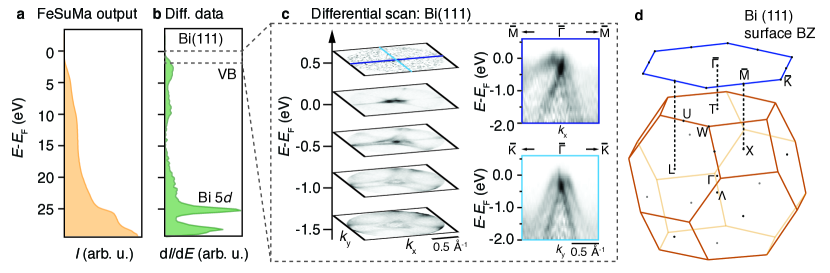
By setting such that only Fermi-level electrons can reach the detector from an unpumped sample, one can observe the Fermi surface map directly on the screen. In order to obtain information about electrons with higher binding energies, is reduced step-by-step while the detector collects the integrated signal. Subsequent differentiation results in a conventional photoemission spectrum. An example of such a measurement is in Fig. 2(a), where we show a Bi core-level spectrum acquired from the Bi(111) surfacesup . The spin-orbit splitting in the Bi doublet is well resolved when the spectrum is differentiated, in Fig. 2(b). In like manner, to obtain the intensity distribution of a photoemission signal from valence states as a function of momentum and energy, a three-dimensional data set is recorded and then differentiated along the energy axis across a smaller range of energies close to the Fermi level. We show the example for the case of Bi(111) in Fig. 2(c), where the Fermi surface, momentum distribution, and underlying dispersion of the electronic states are visible. Due to the semimetallic nature of bulk Bi, the photoemission intensity at the Fermi level is dominated by surface states Koroteev et al. (2004). The bulk and surface Brillouin zone (BZ) of Bi(111) is provided in Fig. 2(d) for reference.
The FeSuMa operates in three regimes: Fourier Mode, Direct Mode and Optical Mode. Within the first of these regimes, there are actually three settings, characterized by angular acceptances of , and . Angular acceptance in the Fourier modes can be extended by applying a bias potential (see discussion below and Fig. 5)—a technique that is also used in conventional ARPES Gauthier et al. (2021). The FeSuMa’s ability to instantly detect the angular distribution of intensity allows the parameters to be quickly adjusted, minimising the distortion of the electric field caused by any non-cylindrical symmetry in the sample environment.
In the Direct Mode, the lens projects an image of the electron source in real coordinates; thus, it can be used to characterize and track the beam spot in two dimensions (see Fig. 1(d)). This is a significant advantage in comparison with conventional HAs, where only one spatial coordinate, corresponding to the direction along the entrance slit, is accessible. Since the MCP is sensitive to UV photons, Direct Mode can also be used to detect reflected or scattered light from surface features and sample edges, and thus either to track the position of the photon beam or to find flat portions of the surface (since no photons should enter the analyser from a flat sample region if the electron signal is optimised).
We finally mention here an advantage of the FeSuMa for pump-probe experiments: unlike in HAs and MMs, electron trajectories in the FeSuMa (being an order of magnitude shorter) do not pass through auxiliary focal planes or crossing points. In HAs, there are two imaging planes and one crossing point where electron trajectories are brought together (e.g., Ref. Zouros and Benis (2002)), and Coulombic electron-electron interactions are presumably enhanced at such points. It is generally desirable to avoid such space charge effects, as they degrade angular and energy resolution. In the case of MMs, electron-electron interactions both inside the focusing column and in front of the objective lens are complex and problematic Maklar et al. (2020); Schönhense et al. (2018); Kutnyakhov et al. (2020). The FeSuMa’s design, which reduces the effects of space charge inside the electron optics, is beneficial to pump-probe measurements. This will be discussed further below.
III Proof of Principle Data
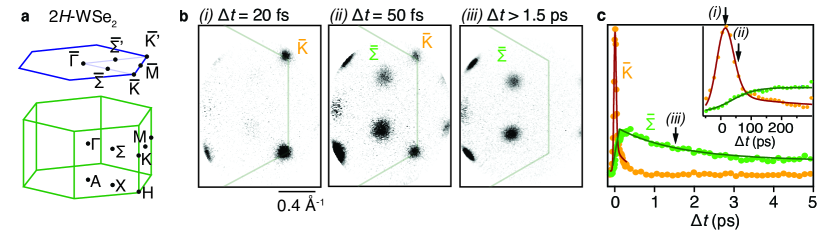
In the following, we summarise the versatile applications of the FeSuMa analyser when coupled with a pump-probe setup. To facilitate comparison with similar approacheas involving HAs and MMs Maklar et al. (2020), we benchmark the capabilities of the system using a widely studied layered transition metal dichalcogenide, cleaved bulk trigonal prismatic tungsten diselenide (2-WSe2). Bulk WSe2 is an indirect bandgap semiconductor Hsu et al. (2017) with a hexagonal BZ that is sketched in Fig. 3(a). Its valence band maximum (VBM) is located at the -point, and the conduction band minimum (CBM) at the -valley, in between and . Upon optical excitation with a circularly polarized infrared pulse, the material exhibits spin-, valley-, and layer-polarisation Bertoni et al. (2016).
We start by demonstrating a simple approach to a common (but historically challenging) application of TR-ARPES: namely, characterization of excited carrier relaxation between local conduction band minima in different parts of the BZ. In Fig. 3(b), we present the evolution of excited state signals that have been collected with set so as to probe just above the Fermi level. Since every electron with a kinetic energy greater than is collected by the FeSuMa, all the unoccupied states can be monitored concurrently, regardless of their energy dispersion. A comprehensive discussion of the dynamics, both for bulk and single-layer WSe2, can be found in multiple publications (e.g. Refs. Bertoni et al. (2016); Puppin et al. (2022); Madéo et al. (2020)). Here, we simply highlight that the FeSuMa allows detection of localised charge populations in a large portion of the BZ simultaneously, allowing for identification of scattering pathways in the material. The time traces in Fig. 3(c) were collected over 20 mins, corresponding to 36 s of acquisition per frame. As can be seen in the figure, the statistics are excellent, despite having been acquired with a low probe flux of only 108 photons/second.
We note certain limitations of the efficient approach just described: here, time-resolved measurements are performed by integration, maintaining at a set value. The analysis of data acquired in this way can be challenging if there are multiple excitations at different binding energies but similar ; furthermore, access to information about band curvatures is restricted. Of course, the dataset can be extended to four dimensions (, , , ), simply by sweeping in the manner described above (leading to longer acquisition times).
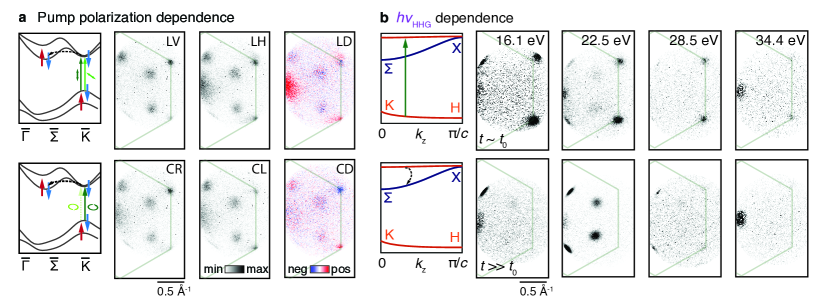
An advantage that the FeSuMa shares with PEEM and momentum microscopy is the capability for maintaining a fixed sample geometry while mapping the momentum space. Incident light polarisation can remain fixed and photoemission matrix elements unchanged throughout an experiment, and one can straightforwardly extract information such as dichroism from excited-state populations. In Fig. 4(a), we show the excited carrier distributions that arise in 2-WSe2 pumped with four polarisations: linear vertical (LV), linear horizontal (LH), circular right (CR), and circular left (CL). Here, the choices of photon energy and acceptance angle do not image the whole BZ, but allow us to simultaneously see dynamics at the inequivalent - and ’-points and at the corresponding - and ’-points. The excitation with linearly polarised light leads to negligible linear dichroic (LD) contrast in the population at - and -points. Pumping with LH light produces a strong signal around the -point; this is a known consequence of multi-photon photoemission process enhanced by this polarisation Miaja-Avila et al. (2006); Keunecke et al. (2020). On the other hand, we see significant circular dichroic (CD) signal at the adjacent - and ′-points. This arises due to a combination of (1) the primarily two-dimensional character of the states at - and ′, and (2) the surface sensitivity of the ARPES measurement Bertoni et al. (2016); Riley et al. (2014). Indeed, the low photoelectron kinetic energies in the measurements described here mean that these spectra are highly sensitive to the physics of the topmost atomic layer of the crystalline structure Seah and Dench (1979).
A full movie of dynamics in a different material system—Bi(111)—is available in the Supplementary Materials sup .
A powerful aspect of the Artemis setup is its ability to switch efficiently between different HHG probe energies. (See also Ref. Heber et al. (2022).) This is possible because of carefully optimized optical alignment in the beamline and fine angular control of the final toroidal focusing mirror. Thus, we can coarsely map the out-of-plane dispersion of unoccupied states, in a manner analogous to that by which the occupied-state -dispersion is obtained at synchrotron light sources. We demonstrate this principle in Fig. 4(b). Varying the probe energy leads to strikingly different excited state signals across the BZ. The lowest-lying conduction-band states along the - path are nearly non-dispersive Voß et al. (1999), and are visible at all photon energies. However, the scattering from to is well captured at only one probe energy, 22.4 eV. In this connection, we note both that the out-of-plane dispersion along the - path is more pronounced than that along - path Voß et al. (1999), and also that the photoemission matrix elements are presumably enhanced at particular probe energies Heber et al. (2022); Boschini et al. (2020); Moser (2017). The first of these points highlights the importance of thoughtful HHG photon-energy selection in studies of materials in which 3D-dispersing band structures play an important role; this is the case, for example, in Weyl candidates Co3Sn2S2Liu et al. (2021) and PtTe2 Yan et al. (2017). The second points to the possibility of using matrix element effects to optimise signal-to-noise for all types of samples, including those with a primarily 2D electronic character.
IV Additional technical considerations
IV.1 “Fisheye” Data Acquisition
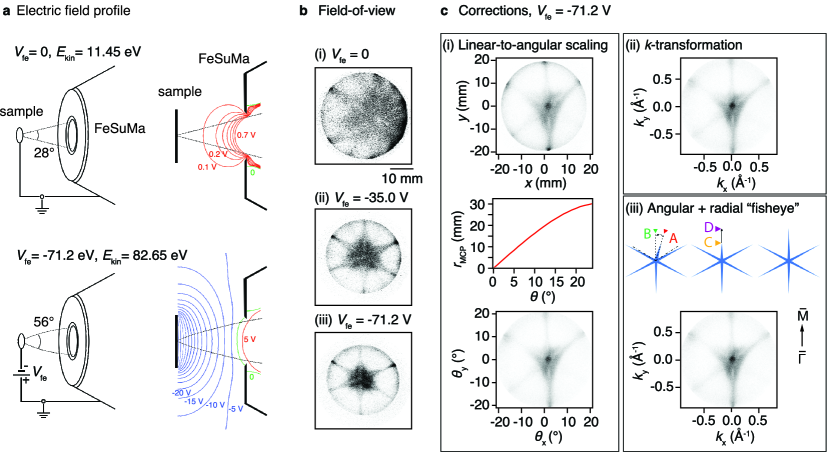
Applying a bias voltage to the sample holder is a very convenient approach to increase the momentum field of view Gauthier et al. (2021). Due to the additional component of the field towards the analyser (shown schematically in Fig. 5(a)), electron trajectories are bent, and electrons that initially deviate strongly from the lens axis are nevertheless able to enter the analyser. Thus, using photon energies of only 16.2, 22.2, 28.6, and 34.2 eV, we cover portions of the momentum space at the Fermi level that are much larger than we would otherwise be able to access without the fisheye voltage, achieving radii of 0.81, 0.88, 0.9, and 0.97 Å-1, respectively. The drawback of this approach is that it can lead to distortions resulting from the presence of the electrical field, especially when cylindrical symmetry around the lens axis is broken by the sample’s immediate environment (i.e., non-cylindrical sample holder, manipulator shape, cables, etc.). Because we can easily see the momentum distribution “live” before acquiring a spectrum, we can take some steps to minimize distortions by adjusting of the geometry of the experiment. Further processing after the measurement, based on purely symmetry-driven considerations, allows us to eliminate all visible distortions of the angular distribution. This will now be explained.
We introduce two types of corrections to deal with angular and radial distortions, taking as our starting point the known symmetries of our material systems. In the angular case, we are concerned with a segment of the dataset where there are distortions like those illustrated schematically by black dashed lines in the left panel of Fig. 5(c)(iii). We take the two axes A and B, as indicated by dashed lines leading to the red and green triangles, respectively, in the left panel of Fig. 5(c)(iii). In the affected segment of the data we then shift all points that lie along the A-axis onto the B-axis. For all other points in this segment, a linear interpolation then squeezes the part of the image that lies to the left of B and stretches the part of the image that lies to the right of B.
For the radial correction, we show an illustrative example in Fig. 5(iii). In this simple cartoon, we only need to correct one portion of the image that is obviously compressed relative to the others. Identifying the two points C and D that lie along the same axis (orange and purple triangles in the central panel of Fig. 5(c)(iii)), we perform a linear interpolation such that C is moved onto D, and all other points in a segment are stretched (or squeezed) linearly while keeping the centre of the image intact.
IV.2 Space-charge
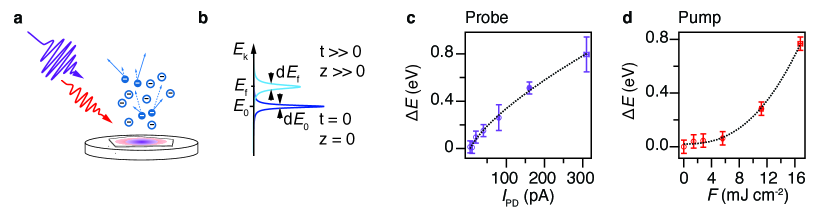
As sketched schematically in Fig. 6(a), space charge arises due to Coulombic repulsive interactions within the dense cloud of photoelectrons emitted from the sample surface, leading to energy shifts and distortions of electron trajectories as they move towards the analyser Hellmann et al. (2009); Passlack et al. (2006). The resultant photoemission spectra exhibit reduced effective energy- and momentum-resolution, as well as other artifacts, such as shifting of spectra and possible “ghost” peaks Passlack et al. (2006). The energy shift and broadening are illustrated schematically in Fig. 6(b). In addition to the fact that a dense cloud of Coulombically interacting photoelectrons can be generated by the probe pulse, the pump beam can produce an unwanted cloud of “slow” secondary electrons via multiphoton photoemission and emission from surface defects Oloff et al. (2016). This latter effect can contribute additional space-charge effects.
In our setup, photoemitted electrons are tightly confined in space and time only once, at the sample surface, before they interact with the MCP Borisenko et al. (2022). This is an advantageous situation relative to HAs and MMs, where additional focal planes and spatial confinement can cause further Coulombic interaction Schönhense, Medjanik, and Elmers (2015); Maklar et al. (2020); Kutnyakhov et al. (2020). Moreover, in a ToF, a long-range electric field develops as slow electrons produced by the pump propagate through the lens tube, and fast valence electrons experience an accelerating or decelerating force, depending on the time delay, culminating in a “fake” time-zero at a large (tens-of-ps) time delay Kutnyakhov et al. (2020). These effects are largely avoided in the FeSuMa. The retarding voltage readily repels the slowest secondaries—possibly even at the very entrance of the lens column, depending their kinetic energies—so as to reduce their interaction with the other photoelectrons in the lens tube.
Of course, the severity of distortions always depends also on XUV beam diameter and on pulse energy Hellmann et al. (2012). At the relatively low 1-kHz repetition rate of the Artemis set-up that was used for this particular experiment, the choice of photon flux was a compromise between the space-charge and the acquisition time required to achieve sufficient signal-to-noise ratio. In future experiments on the Artemis 100-kHz beamline, we expect to see this issue partially remedied.
In Fig. 6(c), we characterise the spectral modifications due to probe-induced space-charge. We use Bi(111) spectra to estimate the shift of the Fermi edge, which occurs across the entire investigated XUV range as a function of flux Passlack et al. (2006). Fig 6(d) shows the pump-induced Fermi-edge shift. The pump-induced spectral distortions exhibit a complex dependence on the time delay, and are present over a range of several picoseconds after temporal overlap Ulstrup et al. (2015). The secondary-electron population scales non-linearly with the -power of the laser fluence and, in general, affects primarily the low kinetic energy portion of a spectrum. These pump-fluence-dependent measurements were made at a time delay of 150 fs before the optical excitation, in order to exclude the affects of real ultrafast dynamics happening in the sample. Up to a fluence of approximately 5 mJ cm-2, the spectra are virtually unaltered by any pump-induced space-charge. Above this threshold, the spectral shift shows a power dependence of (), in agreement with a previous study of the excitation with a 1.55 eV pump Oloff et al. (2016).
V Conclusions
The FeSuMa offers a simple, affordable approach to high-quality pump-probe photoemission measurements, particularly for time-resolved ARPES of valence and conduction states near the Fermi level. Like certain PEEM-based approaches, it permits measurement of dynamics spanning the entire Brillouin zone. In the context of an HHG beamline that permits scanning of the probe energy, the fisheye mode of operation offers particular benefit for studies of 3D-dispersing states. The FeSuMa is highly complementary to hemispherical analyzers, and constitutes an attractive option for laboratory-scale measurements of electron dynamics. Measurements of conduction-band dynamics in layered 2H-WSe2 yield excellent agreement with previously published results based on momentum microscopy.
Acknowledgements.
We thank Phil Rice, Alistair Cox, and the CLF Engineering Section for technical support; and Drs. James O. F. Thompson and Marco Bianchi for helpful discussion. We acknowledge funding from VILLUM FONDEN through the Centre of Excellence for Dirac Materials (Grant No. 11744) and from the Independent Research Fund Denmark (Grant No. 1026-00089B). Work at the Artemis Facility is funded by the UK Science and Technology Facilities Council. The research leading to these results has received funding from LASERLAB-EUROPE (grant agreement no. 871124, European Union’s Horizon 2020 research and innovation programme). Supplementary material is available online. It includes a movie of data acquired with the FeSuMa across a range of delay times before and after an optically pumped excitation in Bi(111)/Bi2Se3, and information about the time resolution and laser stability on the beamline used for this experiment.References
- Petek and Ogawa (1997) H. Petek and S. Ogawa, “Femtosecond time-resolved two-photon photoemission studies of electron dynamics in metals,” Prog. Surf. Sci. 56, 239–310 (1997).
- Zhou et al. (2018) X. Zhou, S. He, G. Liu, L. Zhao, L. Yu, and W. Zhang, “New developments in laser-based photoemission spectroscopy and its scientific applications: a key issues review,” Reports on Progress in Physics 81, 062101 (2018).
- Suzuki, Shin, and Ozaki (2021) T. Suzuki, S. Shin, and K. Ozaki, “HHG-laser-based time- and angle-resolved photoemission spectroscopy of quantum materials,” J. Electron Spectrosc. Relat. Phenom. 251, 147105 (2021).
- Grychtol et al. (2022) P. Grychtol, N. Kohlstrunk, J. Buck, S. Thiess, V. Vardanyan, D. Doblas-Jimenez, J. Ohnesorge, S. Babenkov, M. Dommach, D. La Civita, M. Vannoni, K. Rossnagel, G. Schönhense, S. Molodtsov, and M. Izquierdo, “The SXP instrument at the European XFEL,” Journal of Physics: Conference Series 2380, 012043 (2022).
- Kutnyakhov et al. (2020) D. Kutnyakhov, R. P. Xian, M. Dendzik, M. Heber, F. Pressacco, S. Y. Agustsson, L. Wenthaus, H. Meyer, S. Gieschen, G. Mercurio, A. Benz, K. Bühlman, S. Däster, R. Gort, D. Curcio, K. Volckaert, M. Bianchi, C. Sanders, J. A. Miwa, S. Ulstrup, A. Oelsner, C. Tusche, Y.-J. Chen, D. Vasilyev, K. Medjanik, G. Brenner, S. Dziarzhytski, H. Redlin, B. Manschwetus, S. Dong, J. Hauer, L. Rettig, F. Diekmann, K. Rossnagel, J. Demsar, H.-J. Elmers, P. Hofmann, R. Ernstorfer, G. Schönhense, Y. Acremann, and W. Wurth, “Time- and momentum-resolved photoemission studies using time-of-flight momentum microscopy at a free-electron laser,” Review of Scientific Instruments 91, 13109 (2020).
- Peng et al. (2018) Q.-J. Peng, N. Zong, S.-J. Zhang, Z.-M. Wang, F. Yang, F.-F. Zhang, Z.-Y. Xu, and X.-J. Zhou, “DUV/VUV all-solid-state lasers: Twenty years of progress and the future,” IEEE J. Quantum Electron. 24, 1–12 (2018).
- Frassetto et al. (2011) F. Frassetto, C. Cacho, C. A. Froud, E. Turcu, P. Villoresi, W. A. Bryan, E. Springate, and L. Poletto, “Single-grating monochromator for extreme-ultraviolet ultrashort pulses,” Opt. Express 19, 19169–19181 (2011).
- Damascelli, Hussain, and Shen (2003) A. Damascelli, Z. Hussain, and Z.-X. Shen, “Angle-resolved photoemission studies of the cuprate superconductors,” Reviews of Modern Physics 75, 473–541 (2003).
- Sobota, He, and Shen (2021) J. A. Sobota, Y. He, and Z.-X. Shen, “Angle-resolved photoemission studies of quantum materials,” Reviews of Modern Physics 93, 025006 (2021).
- Boschini et al. (2020) F. Boschini, D. Bugini, M. Zonno, M. Michiardi, R. P. Day, E. Razzoli, B. Zwartsenberg, M. Schneider, E. H. da Silva Neto, S. dal Conte, S. K. Kushwaha, R. J. Cava, S. Zhdanovich, A. K. Mills, G. Levy, E. Carpene, C. Dallera, C. Giannetti, D. J. Jones, G. Cerullo, and A. Damascelli, “Role of matrix elements in the time-resolved photoemission signal,” New Journal of Physics 22, 23031 (2020).
- Gierz et al. (2011) I. Gierz, J. Henk, H. Höchst, C. R. Ast, and K. Kern, “Illuminating the dark corridor in graphene: Polarization dependence of angle-resolved photoemission spectroscopy on graphene,” Physical Review B 83, 121408 (2011).
- Gierz et al. (2012) I. Gierz, M. Lindroos, H. Höchst, C. R. Ast, and K. Kern, “Graphene sublattice symmetry and isospin determined by circular dichroism in angle-resolved photoemission spectroscopy,” Nano Letters 12, 3900–3904 (2012).
- Peatman (1997) W. B. Peatman, Gratings, Mirrors, and Slits: Beamline Design for Soft X-Ray Synchrotron Radiation Sources (Gordon and Breach Science Publishers, Amsterdam, 1997).
- Jaeglé (2000) P. Jaeglé, “Vacuum ultraviolet lasers,” in Vacuum Ultraviolet Spectroscopy, edited by J. A. R. Samson and D. L. Ederer (Academic Press, London, 2000) pp. 101–118.
- Puppin et al. (2019) M. Puppin, Y. Deng, C. W. Nicholson, J. Feldl, Schröter, H. Vita, P. S. Kirchmann, C. Monney, L. Rettig, M. Wolf, and R. Ernstorfer, “Time- and angle-resolved photoemission spectroscopy of solids in the extreme ultraviolet at 500 kHz repetition rate,” Rev. Sci. Instrum. 90, 023104 (2019).
- Heber et al. (2022) M. Heber, N. Wind, D. Kutnyakhov, F. Pressacco, T. Arion, F. Roth, W. Eberhardt, and K. Rossnagel, “Multispectral time-resolved energy–momentum microscopy using high-harmonic extreme ultraviolet radiation,” Review of Scientific Instruments 93, 083905 (2022).
- Iwasawa et al. (2017) H. Iwasawa, E. F. Schwier, M. Arita, A. Ino, H. Namatame, M. Taniguchi, Y. Aiura, and K. Shimada, “Development of laser-based scanning µ-ARPES system with ultimate energy and momentum resolutions,” Ultramicroscopy 182, 85–91 (2017).
- Schönhense, Medjanik, and Elmers (2015) G. Schönhense, K. Medjanik, and H.-J. Elmers, “Space-, time- and spin-resolved photoemission,” Journal of Electron Spectroscopy and Related Phenomena 200, 94–118 (2015).
- Maklar et al. (2020) J. Maklar, S. Dong, S. Beaulieu, T. Pincelli, M. Dendzik, Y. W. Windsor, R. P. Xian, M. Wolf, R. Ernstorfer, and L. Rettig, “A quantitative comparison of time-of-flight momentum microscopes and hemispherical analyzers for time- and angle-resolved photoemission spectroscopy experiments,” Review of Scientific Instruments 91, 123112 (2020).
- Tusche et al. (2020) C. Tusche, Y.-J. Chen, L. Plucinski, and C. M. Schneider, “From photoemission microscopy to an “all-in-one” photoemission experiment,” e-J. Surf. Sci. Nanotechnol. 18, 48–56 (2020).
- Suga, Sekiyama, and Tusche (2021) S. Suga, A. Sekiyama, and C. Tusche, Photoelectron Spectroscopy: Bulk and Surface Electronic Structures, 2nd ed. (Springer Nature, Switzerland, 2021) pp. 351–416.
- Eppink and Parker (1997) A. T. J. B. Eppink and D. H. Parker, “Velocity map imaging of ions and electrons using electrostatic lenses: Application in photoelectron and photofragment ion imaging of molecular oxygen,” Rev. Sci. Instrum. 68, 3477–3484 (1997).
- Stei et al. (2013) M. Stei, J. von Vangerow, R. Otto, A. H. Kelkar, E. Carrascosa, T. Best, and R. Wester, “High resolution spatial map imaging of a gaseous target,” Journal of Chemical Physics 138, 214201 (2013).
- Borisenko et al. (2022) S. Borisenko, A. Fedorov, A. Kuibarov, M. Bianchi, V. Bezguba, P. Majchrzak, P. Hofmann, P. Baumgärtel, V. Voroshnin, Y. Kushnirenko, J. Sánchez-Barriga, A. Varykhalov, R. Ovsyannikov, I. Morozov, S. Aswartham, O. Feia, L. Harnagea, S. Wurmehl, A. Kordyuk, A. Yaresko, H. Berger, and B. Büchner, “Fermi surface tomography,” Nature Communications 13, 4132 (2022).
- Frassetto et al. (2008) F. Frassetto, S. Bonora, P. Villoresi, L. Poletto, E. Springate, C. A. Froud, I. C. E. Turcu, A. J. Langley, D. S. Wolff, J. L. Collier, S. S. Dhesi, and A. Cavalleri, “Design and characterization of the XUV monochromator for ultrashort pulses at the ARTEMIS facility,” in Proc. SPIE, Vol. 7077 (2008) p. 707713.
- (26) See Supplemental Material for a movie of a representative three-dimensional dataset and for details about time resolution and laser stability.
- Koroteev et al. (2004) Y. M. Koroteev, G. Bihlmayer, J. E. Gayone, E. V. Chulkov, S. Blügel, P. M. Echenique, and P. Hofmann, “Strong spin-orbit splitting on Bi surfaces,” Physical Review Letters 93, 046403 (2004).
- Hirahara et al. (2006) T. Hirahara, T. Nagao, I. Matsuda, G. Bihlmayer, E. V. Chulkov, Y. M. Koroteev, P. M. Echenique, M. Saito, and S. Hasegawa, “Role of spin-orbit coupling and hybridization effects in the electronic structure of ultrathin bi films,” Physical Review Letters 97, 146803 (2006).
- Gauthier et al. (2021) N. Gauthier, J. A. Sobota, H. Pfau, A. Gauthier, H. Soifer, M. D. Bachmann, I. R. Fisher, Z.-X. Shen, and P. S. Kirchmann, “Expanding the momentum field of view in angle-resolved photoemission systems with hemispherical analyzers,” Review of Scientific Instruments 92, 123907 (2021).
- Zouros and Benis (2002) T. J. M. Zouros and E. P. Benis, “The hemispherical deflector analyser revisted. I. Motion in the ideal 1/r potential, generalized entry conditions, Kepler orbits and spectrometer basic equation,” Journal of Electron Spectroscopy and Related Phenomena 125, 221–248 (2002).
- Schönhense et al. (2018) B. Schönhense, K. Medjanik, O. Fedchenko, S. Chernov, M. Ellguth, D. Vasilyev, A. Oelsner, J. Viefhaus, D. Kutnyakhov, W. Wurth, H. J. Elmers, and G. Schönhense, “Multidimensional photoemission spectroscopy—the space-charge limit,” New Journal of Physics 20, 033004 (2018).
- Hsu et al. (2017) W.-T. Hsu, L.-S. Lu, D. Wang, J.-K. Huang, M.-Y. Li, T.-R. Chang, Y.-C. Chou, Z.-Y. Juang, H.-T. Jeng, L.-J. Li, and W.-H. Chang, “Evidence of indirect gap in monolayer WSe2,” Nature Communications 8, 929 (2017).
- Bertoni et al. (2016) R. Bertoni, C. W. Nicholson, L. Waldecker, H. Hübener, C. Monney, U. De Giovannini, M. Puppin, M. Hoesch, E. Springate, R. T. Chapman, C. Cacho, M. Wolf, A. Rubio, and R. Ernstorfer, “Generation and evolution of spin-, valley-, and layer-polarized excited carriers in inversion-symmetric WSe2,” Physical Review Letters 117, 277201 (2016).
- Puppin et al. (2022) M. Puppin, C. W. Nicholson, C. Monney, Y. Deng, R. P. Xian, J. Feldl, S. Dong, A. Dominguez, H. Hübener, A. Rubio, M. Wolf, L. Rettig, and R. Ernstorfer, “Excited-state band structure mapping,” Physical Review B 105, 075417 (2022).
- Madéo et al. (2020) J. Madéo, M. K. L. Man, C. Sahoo, M. Campbell, V. Pareek, E. L. Wong, A. Al-Mahboob, N. S. Chan, A. Karmakar, B. M. K. Mariserla, X. Li, T. F. Heinz, T. Cao, and K. M. Dani, “Directly visualizing the momentum-forbidden dark excitons and their dynamics in atomically thin semiconductors,” Science 370, 1199–1204 (2020).
- Miaja-Avila et al. (2006) L. Miaja-Avila, C. Lei, M. Aeschlimann, J. L. Gland, M. M. Murnane, H. C. Kapteyn, and G. Saathoff, “Laser-assisted photoelectric effect from surfaces,” Physical Review Letters 97, 113604 (2006).
- Keunecke et al. (2020) M. Keunecke, M. Reutzel, D. Schmitt, A. Osterkorn, T. A. Mishra, C. Möller, W. Bennecke, G. S. M. Jansen, D. Steil, S. R. Manmana, S. Steil, S. Kehrein, and S. Mathias, “Electromagnetic dressing of the electron energy spectrum of Au(111) at high momenta,” Physical Review B 102, 161403 (2020).
- Riley et al. (2014) J. M. Riley, F. Mazzola, M. Dendzik, M. Michiardi, T. Takayama, L. Bawden, C. Granerød, M. Leandersson, T. Balasubramanian, M. Hoesch, T. K. Kim, H. Takagi, W. Meevasana, P. Hofmann, M. S. Bahramy, J. W. Wells, and P. D. C. King, “Direct observation of spin-polarized bulk bands in an inversion-symmetric semiconductor,” Nature Physics 10, 835–839 (2014).
- Seah and Dench (1979) M. P. Seah and W. A. Dench, “Quantitative electron spectroscopy of surfaces: A standard data base for electron inelastic mean free paths in solids,” Surf. Interface Anal. (1979), 10.1002/sia.740010103.
- Voß et al. (1999) D. Voß, P. Krüger, A. Mazur, and J. Pollmann, “Atomic and electronic structure of WSe2 from ab initio theory: Bulk crystal and thin film systems,” Physical Review B 60, 14 311–14317 (1999).
- Moser (2017) S. Moser, “An experimentalist’s guide to the matrix element in angle resolved photoemission,” Journal of Electron Spectroscopy and Related Phenomena 214, 29–52 (2017).
- Liu et al. (2021) D. F. Liu, Q. N. Xu, E. K. Liu, J. L. Shen, C. C. Le, Y. W. Li, D. Pei, A. J. Liang, P. Dudin, T. K. Kim, C. Cacho, Y. F. Xu, Y. Sun, L. X. Yang, Z. K. Liu, C. Felser, S. S. P. Parkin, and Y. L. Chen, “Topological phase transition in a magnetic Weyl semimetal,” Physical Review B 104, 205140 (2021).
- Yan et al. (2017) M. Yan, H. Huang, K. Zhang, E. Wang, W. Yao, K. Deng, G. Wan, H. Zhang, M. Arita, H. Yang, Z. Sun, H. Yao, Y. Wu, S. Fan, W. Duan, and S. Zhou, “Lorentz-violating type-II Dirac fermions in transition metal dichalcogenide PtTe2,” Nature Communications 8, 257 (2017).
- Dahl (2000) D. A. Dahl, “SIMION for the personal computer in reflection,” International Journal of Mass Spectrometry 200, 3–25 (2000).
- Hellmann et al. (2009) S. Hellmann, K. Rossnagel, M. Marczynski-Bühlow, and L. Kipp, “Vacuum space-charge effects in solid-state photoemission,” Physical Review B 79, 035402 (2009).
- Passlack et al. (2006) S. Passlack, S. Mathias, O. Andreyev, D. Mittnacht, M. Aeschlimann, and M. Bauer, “Space charge effects in photoemission with a low repetition, high intensity femtosecond laser source,” Journal of Applied Physics 100, 024912 (2006).
- Oloff et al. (2016) L.-P. Oloff, K. Hanff, A. Stange, G. Rohde, F. Diekmann, M. Bauer, and K. Rossnagel, “Pump laser-induced space-charge effects in HHG-driven time- and angle-resolved photoelectron spectroscopy,” Journal of Applied Physics 119, 225106 (2016).
- Hellmann et al. (2012) S. Hellmann, T. Ott, L. Kipp, and K. Rossnagel, “Vacuum space-charge effects in nano-ARPES,” Physical Review B 85, 075109 (2012).
- Ulstrup et al. (2015) S. Ulstrup, J. C. Johannsen, F. Cilento, A. Crepaldi, J. A. Miwa, M. Zacchigna, C. Cacho, R. T. Chapman, E. Springate, F. Fromm, C. Raidel, T. Seyller, P. D. C. King, F. Parmigiani, M. Grioni, and P. Hofmann, “Ramifications of optical pumping on the interpretation of time-resolved photoemission experiments on graphene,” Journal of Electron Spectroscopy and Related Phenomena 200, 340–346 (2015).