Quantifying nematic order in evaporation-driven self-assembly of Halloysite nanotubes: Nematic islands and critical aspect ratio
Abstract
Halloysite nanotubes (HNTs) are naturally occurring clay minerals found in Earth’s crust that typically exist in the form of high aspect-ratio nanometers-long rods. Here, we investigate the evaporation-driven self-assembly process of HNTs and show that a highly polydisperse collection of HNTs self-sort into a spatially inhomogeneous structure, displaying a systematic variation in the resulting nematic order. Through detailed quantification using nematic order parameter and nematic correlation functions, we show the existence of well-defined isotropic-nematic transitions in the emerging structures. We also show that the onset of these transitions gives rise to the formation of nematic islands phase coexisting ordered nematic domains surrounded by isotropic phase which grow in size with . Detailed image analysis indicates a strong correlation between local and the local aspect ratio, , with nematic order possible only for rods with . Finally, we conclude that observed phenomena directly result from aspect ratio-based sorting in our system. Altogether, our results provide a unique method of tuning the local microscopic structure in self-assembled HNTs using as an external parameter.
pacs:
05.40.-a, 05.70.Ln, 45.70.Vn1 Introduction
Clay minerals refer to fine-grained hydrous layered silicate minerals, known as phyllosilicates, found abundantly in the Earth’s crust. They consist of tetrahedral layer (T) bonded to an Al-OH/Mg-OH octahedral layer (O) to form T-O sheets arranged in layers with inter-layer spacing 0.7 nm-1.5 nm [1, 2, 3]. Halloysite ; n=0 (dehydrated), 2 (hydrated)) is one such naturally occurring clay [4], composed of 15-20 T-O sheets rolling to give them unique nanoscroll morphology known as Halloysite Nanotubes (HNTs) [5, 6, 7]. At the microscopic level, they appear as rods with a high aspect ratio. The HNTs have interesting properties, including thermally stable hydroxyl groups [8], an empty lumen [9], and bio-compatibility [10, 11], which make them suitable for a variety of applications [12, 13, 14, 15, 16, 17]. Achieving these requires better control and understanding of their self-assembled structures at the microscopic length scales.
A dense collection of high aspect ratio rods forming a lyotropic nematic liquid crystalline phase is a universal phenomenon observed in many systems across a vast spectrum of length scales[18, 19, 20, 21, 22, 23, 24, 25, 26, 27]. Such a phase of matter is characterized by a high degree of orientational order, which can be quantified using a director field [28] representing the average local orientation of the rods. Recently, aqueous dispersions of HNTs have been shown to exhibit a lyotropic phase transition between isotropic and nematic states with profound implications on their physical properties [29]. However, a detailed characterization of the nematic order in the aqueous medium poses challenges, preventing a comprehensive understanding of the complex behavior of these systems. Thus, an alternate approach is required, providing an easy yet extensive way to quantify emerging nematic order in these systems.
Self-assembly of nanoscopic particles using the evaporative technique provides one such method to investigate complex pattern formation at microscopic scales [30, 31, 32, 33, 34, 35, 36, 37, 38, 39, 40]. Consequently, in the past few years, many such studies have been performed with HNTs, revealing the presence of emerging nematic order and topological defects [41, 42]. However, most of these studies were performed at lower concentrations ( 5 wt. %) with the nematic phase confined to a narrow region near the trailing edge of the drop [41, 43]. Whether or not more interesting structures form at higher , and a general approach to quantify the emerging nematic order in terms of the order parameter, , is lacking.
In this study, we investigate the emergence of nematic order in evaporation-driven structures of HNTs. We dry out an aqueous droplet containing charge-stabilized HNTs with a high degree of polydispersity in the rod length () and diameter () at = 20 wt. %. Later, we take multiple SEM images of the dried droplet captured from the center to the edge at regular intervals. We perform comprehensive image analysis to extract the nematic director field and measure the nematic order parameter, , as a function of radial distance. We find that the rods self-assemble into three regions: isotropic near the center, nematic at a distance of about half the droplet radius, and, again isotropic near the droplet edge. In addition, we also report hitherto unknown structures near phase transition regions resembling highly ordered local nematic domains surrounded by an isotropic phase, which we call nematic islands. The size of these islands grows with the nematic order and closely matches the nematic correlation length. In all our experiments, we find a strong linear correlation between local and the local rod aspect ratio, , signifying size-dependent sorting. Finally, our data suggests that a highly ordered nematic structure is possible only for . Our findings reveal a universal protocol for tunable self-assembled structures in nanorod systems, with as a convenient control parameter.
2 Results & Discussion
Pristine HNTs contain impurities such as quartz and illite [44]. We remove these impurities through a purification process, as shown in Fig. 1 (a). This process involves treating the pristine HNTs with sodium hexametaphosphate [(NaPO3)6] in alkaline pH, leading to the purification and augmentation of their surface charge (see experimental methods section and procedure described in [29]). Fig. 1(b) compares zeta potential, , between the pristine HNTs and purified HNTs, which shows an increase from -16.7 mV to -36.6 mV after purification. This increase is caused by excess deprotonated silanol groups (Si-OH) on the outer surface of purified HNTs [45]. The higher negative value enhances colloidal stability, facilitating their self-assembly process. Additionally, we perform TEM imaging to characterize the shape and dimensions of purified HNTs, as shown in Fig. 1 (c). The TEM micrograph reveals the tubular shape and empty lumen with a 12-20 nm diameter. We also capture SEM images of HNTs (Fig. 1(d)) to determine the length () and outer diameter (), as shown in Fig. 1(e). We find average values , , and of HNTs to be 0.62 0.38 m , 93 21 nm, and 7.8 4.5, respectively. The distributions are quite broad, suggesting a high degree of polydispersity in our system.
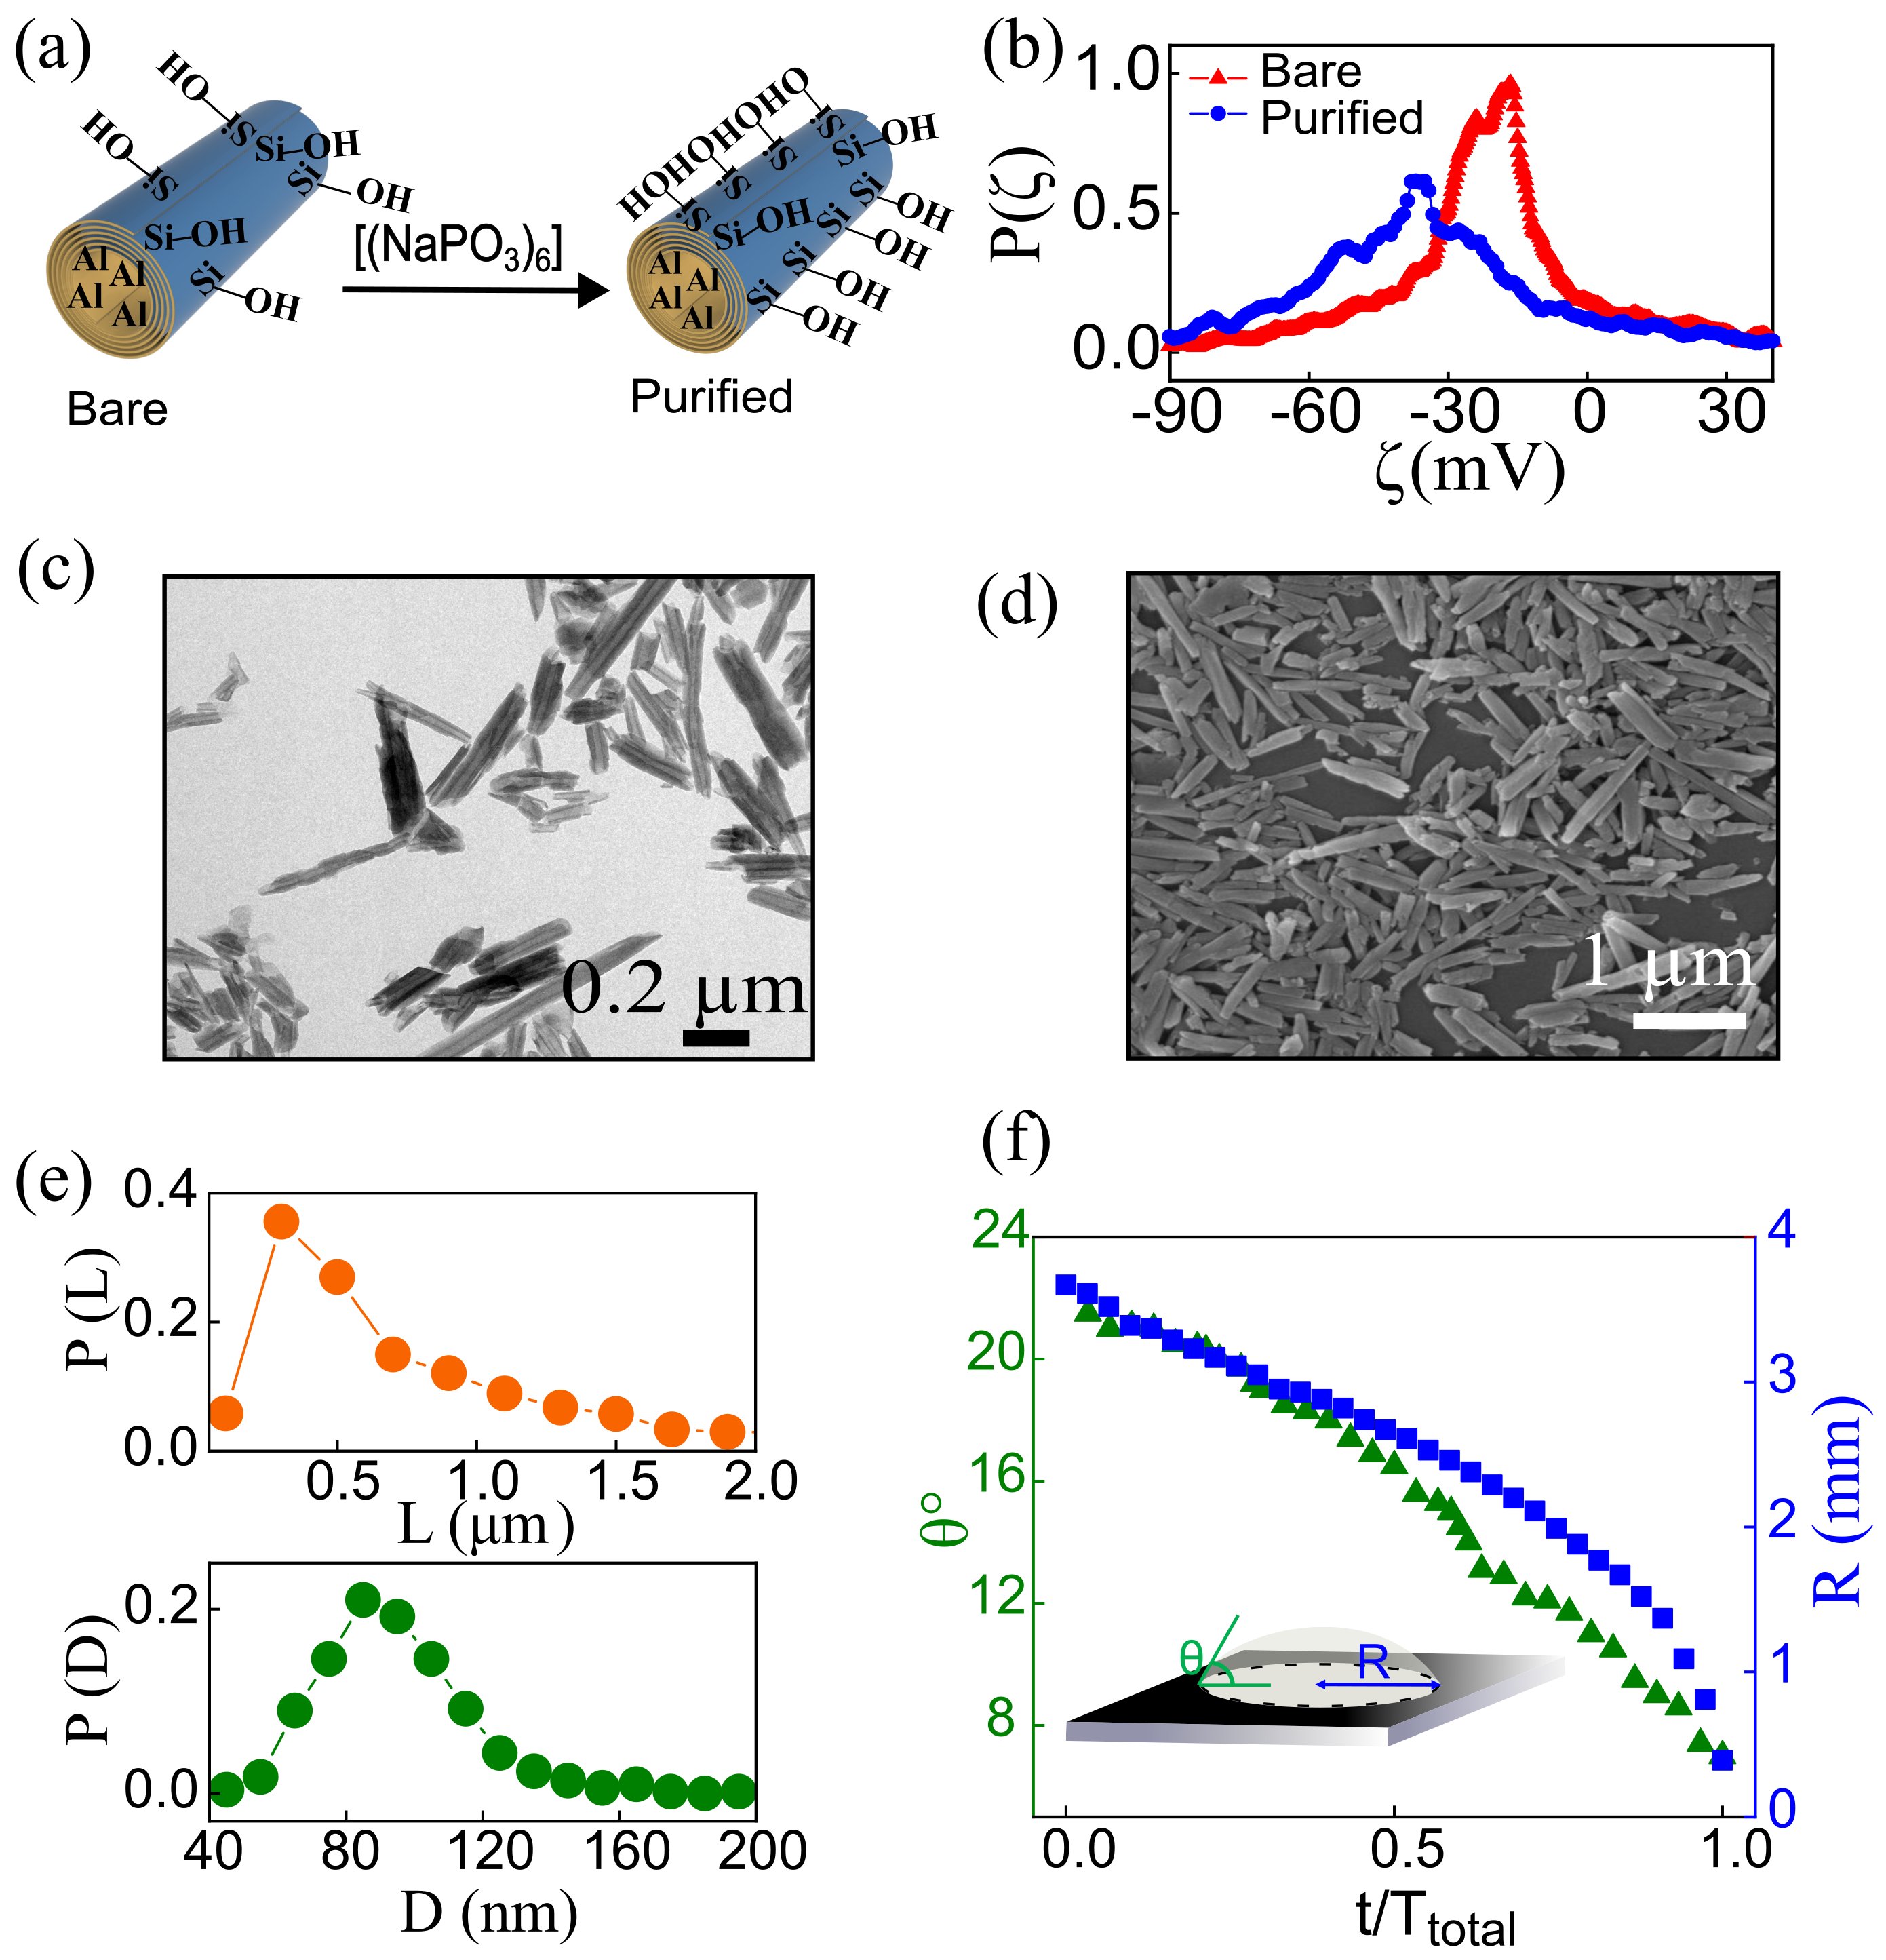
To gain insights into the self-assembly process, we first analyze the evaporation dynamics of sessile droplets, the results of which are summarized in Fig. 1 (f). We begin by drying a droplet of volume = 10 µL containing HNTs at a concentration = 20 wt.% on a hydrophilic silicon substrate under ambient conditions. Fig 1(f) shows a typical droplet drying profile, which suggests a continuously receding droplet radius, , ensuring a weak coffee-ring effect in our system [40]. Moreover, the contact angle, , also decreases with time, indicating that our system undergoes a mixed drying mode [46, 47]. Therefore, we expect a combination of high , , and mixed drying modes to lead to a uniform deposition throughout the surface.
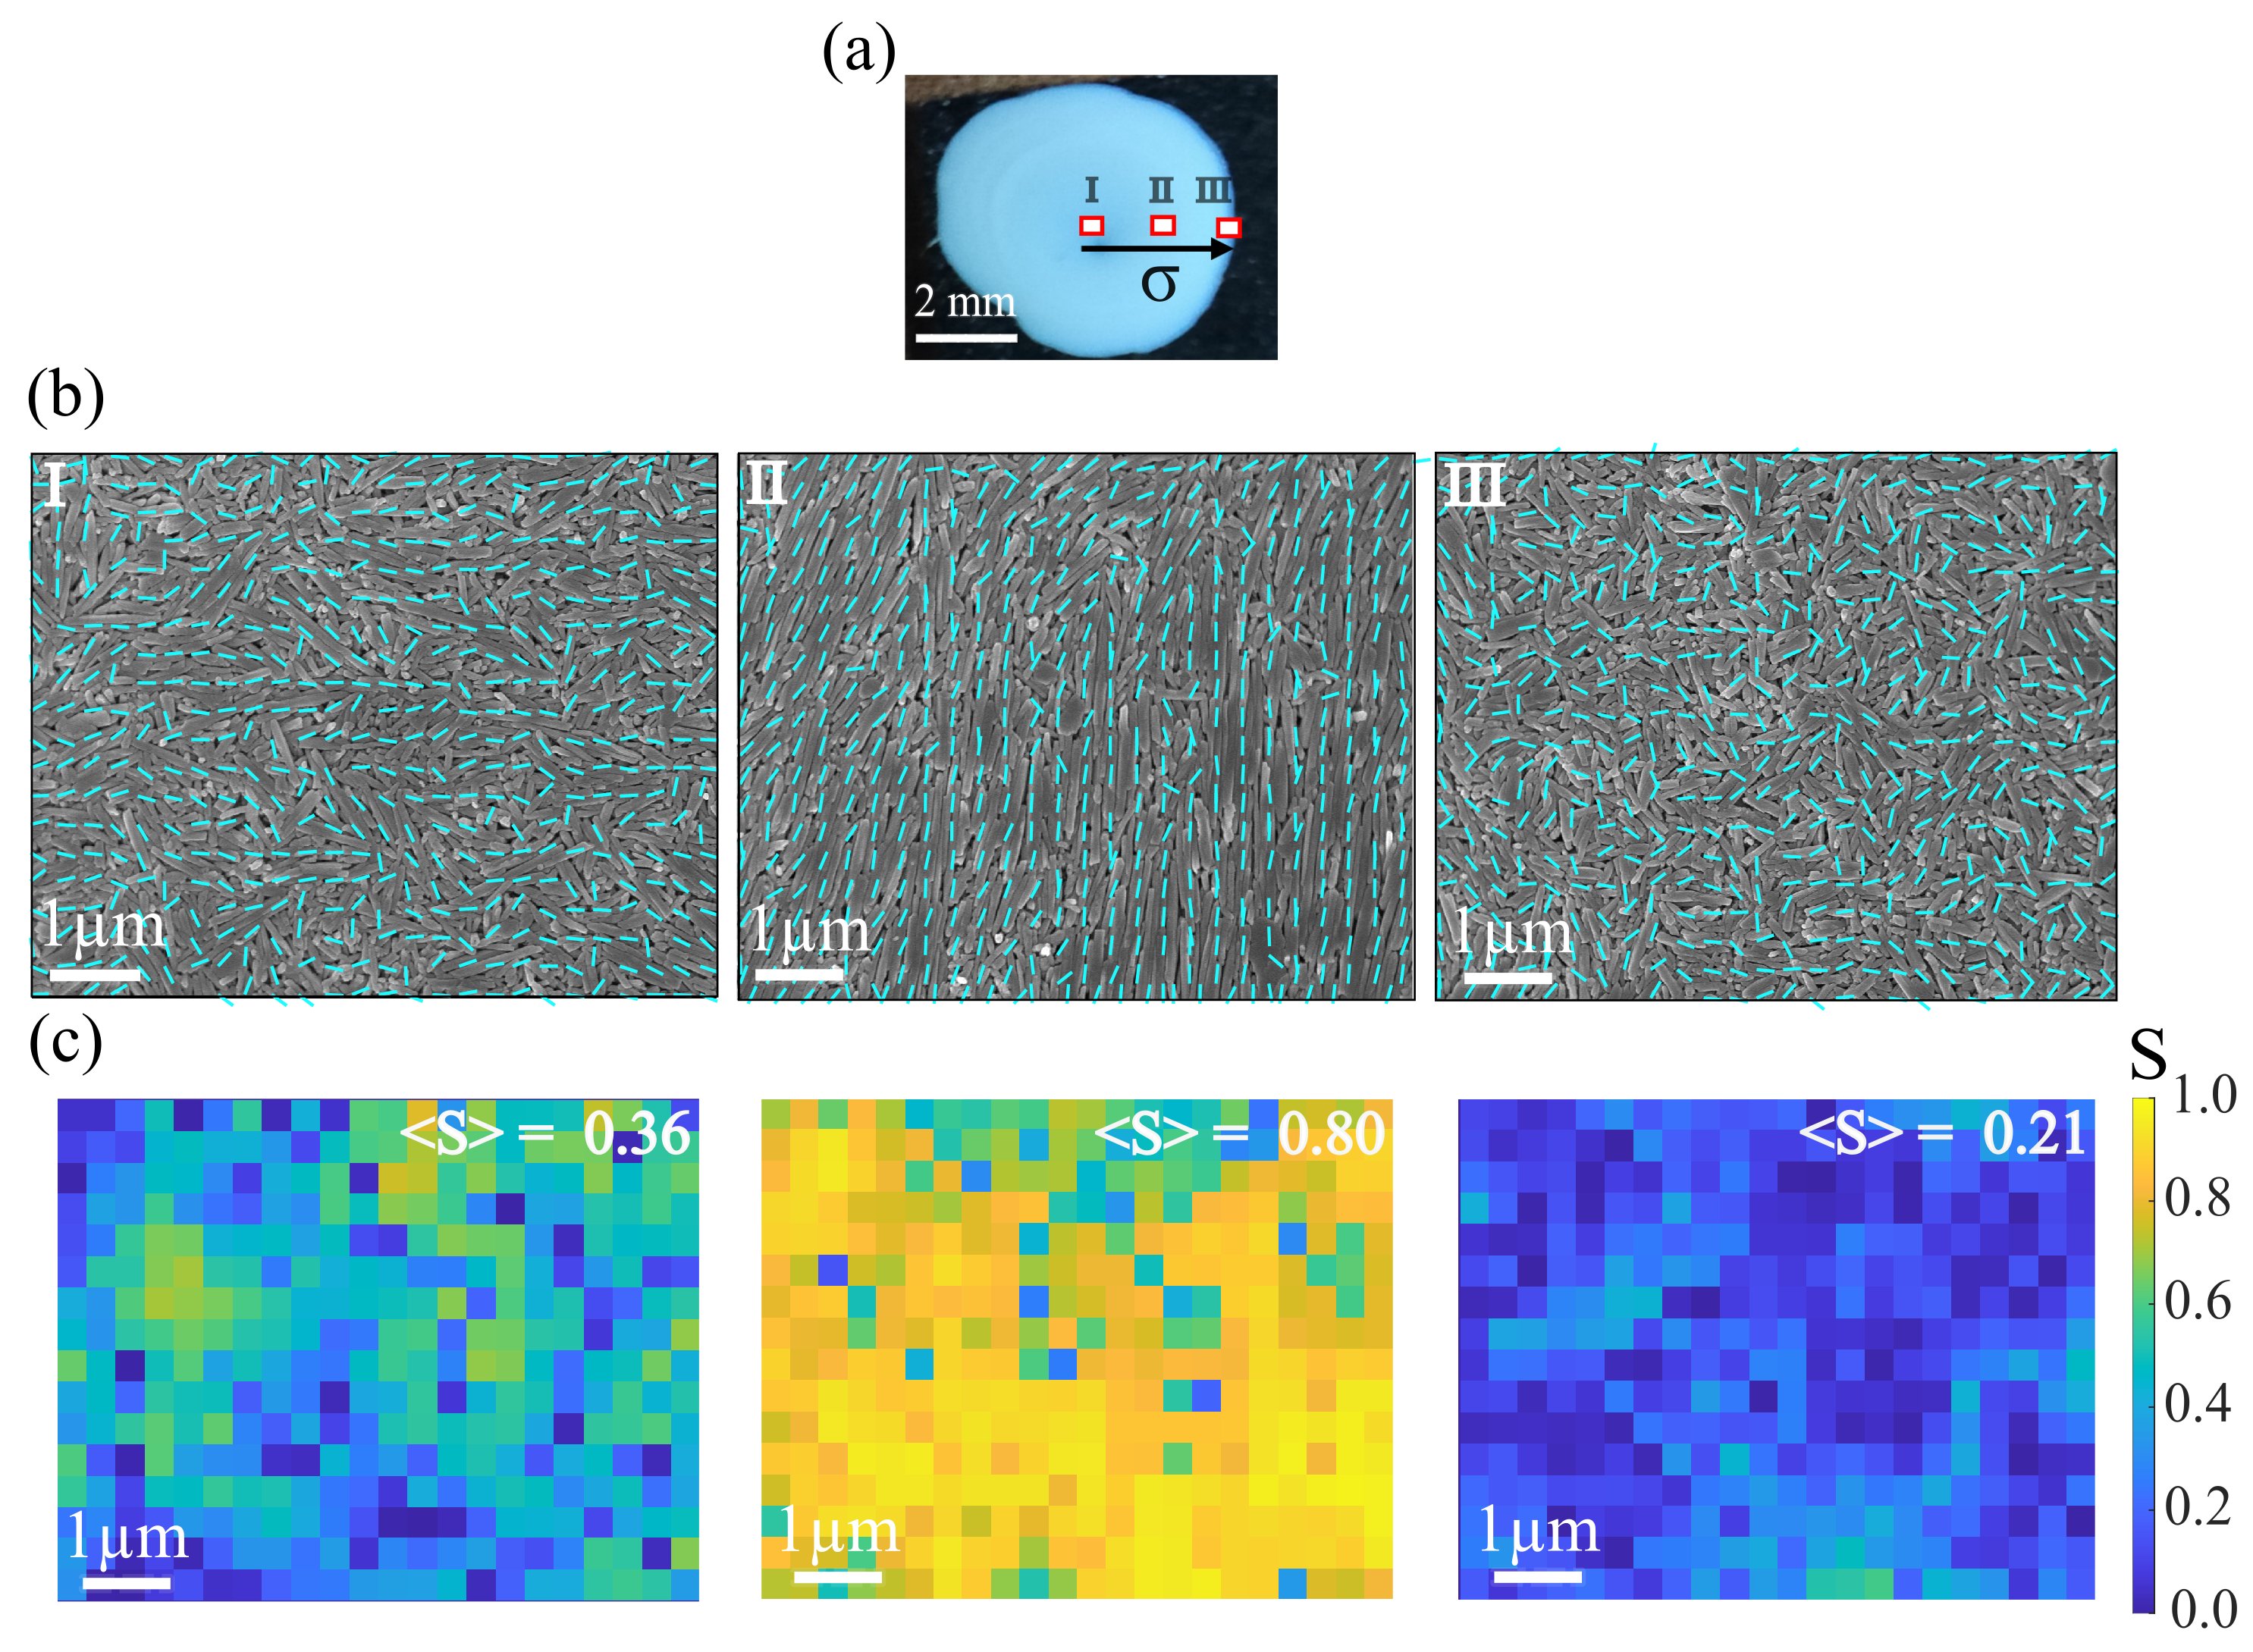
To quantify the underlying order in the self-assembled HNTs, we capture SEM images at three different locations in a radially outward direction, as shown in Fig. 2(a). The position of the image is identified by the parameter , which is the radial distance in the units of droplet radius, (i.e., , 3 mm). Three typical SEM images of the marked positions in Fig. 2(a) are shown in Fig. 2(b). The cyan lines represent the director field generated using an algorithm originally developed by Cetera et al. [48], which captures the underlying orientation of HNTs quite faithfully. Here, an individual director is evaluated by averaging the local direction of rods inside a square-shaped area of = 0.06 m2 (see Image analysis in the Experimental Methods section). We use this director-field information to extract the local two-dimensional nematic order parameter, , where denotes the angle subtended by a rod with its average, , calculated over all the rods inside . is averaged over all the rods in that region. The value of ranges between 0 and 1, corresponding to a randomly oriented and perfectly aligned state, respectively. The results are shown as a heat map in Fig. 2(c), where the color represents the local value with its average value, , mentioned in each plot. Clearly, seems to vary non-monotonically with . To confirm this, we systematically take multiple images from the droplet’s center to the edge and calculate for each image as a function of , as shown in Fig. 3(a). The plot shows a sustained period of low before sharply rising to a higher value at , which persists up to before dropping again abruptly. These results indicate that the system first undergoes an isotropic-nematic (I N) and then a nematic-isotropic (N I) transition with increasing .
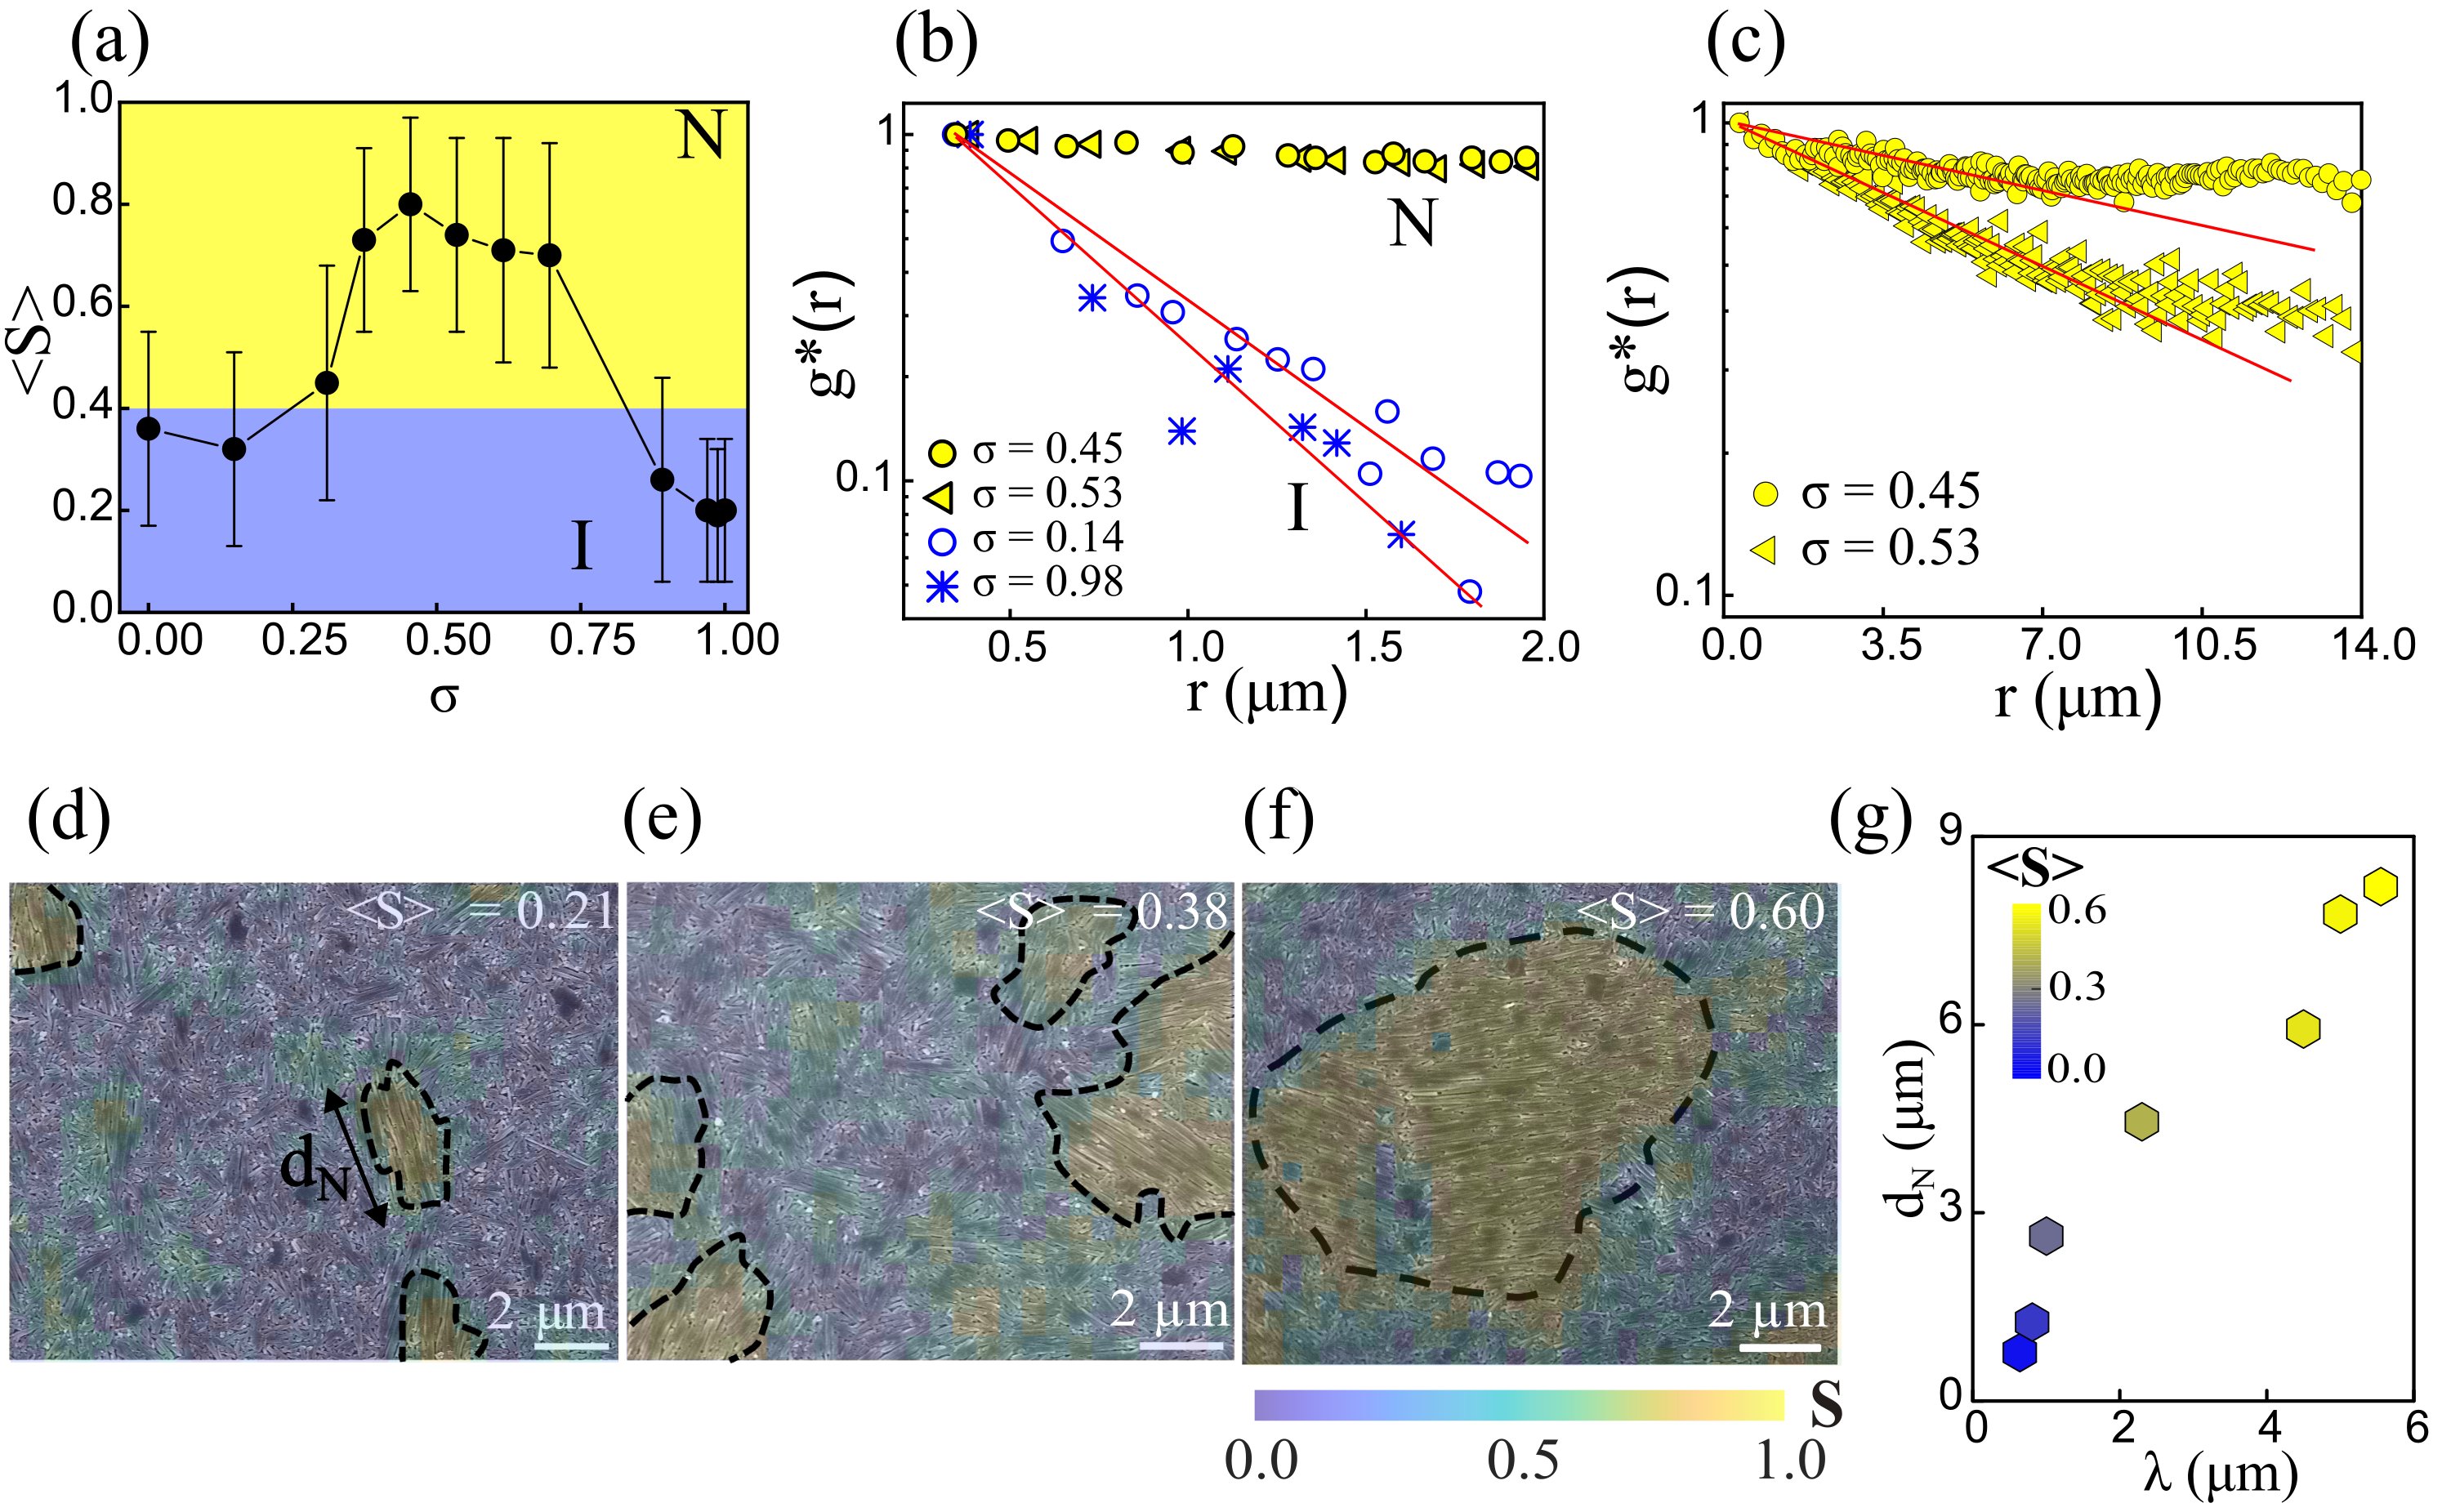
This is further validated by evaluating the nematic correlation function, , which measures the propensity for directors averaged over all pairs separated by a distance to orient in the same direction. We calculate its normalized value defined as (i.e., scaled by its value at the smallest ), as shown in Fig. 3(b). Clearly, can be divided into two groups. The first one, indicated by yellow symbols, shows a slow decay with correlation persisting over large . Its expanded view in Fig. 3(c) even shows an initial exponential decay followed by a saturation to a finite value indicative of a true long-range order. On the other hand, the second group (blue symbols in Fig. 3(b)) exhibits a much faster exponential decay to zero, suggestive of a disordered phase. It is worth mentioning that in Fig. 3(c), we do not see a signature of quasi-long-range order in the form of power-law decaying correlation functions, as one might expect in a two-dimensional system [49, 50, 51, 52]. Regardless, we reckon these two groups correspond to nematic and isotropic phases, thus pointing to a first-order phase transition in our system.
Next, we fit exponential functions of the form to all the curves and compute a nematic correlation length . Based on the resulting values, we divide vs. in Fig. 3(a) into well-defined isotropic (I) and nematic (N) regions with marking the transition boundary. Therefore, we conclude that the rods undergo two discontinuous phase transitions with increasing : I N and then N I. Surprisingly, even though these phase transitions happen under non-equilibrium conditions driven by a complex evaporation process, they still show similar properties to an equilibrium isotropic-nematic transition for hard spherocylinders reported in the past [53].
Furthermore, we also see signatures of these transitions in the form of phase-coexistence. Figs. 3(d), (e) (f) captured for various across the transition line clearly show co-existing nematic and isotropic phases. We observe highly ordered nematic regions (yellow, marked by a dashed line) surrounded by an isotropic background (blue), where the colors indicate local . We name them nematic islands, which grow in size as a function of . The observation of these islands is similar to the previously reported phenomenon of size fractionation where longer rods tend to form distinct nematic structures in a two-sized binary mixture [54, 55, 56]. We measure the average island size, (estimated by taking the square root of the area and taking the average over all visible islands), and find that it shows a near-linear correlation with as shown in Fig. 3(g). This implies that the correlation length determines the island size near the transition regions. The symbol colors represent the value of , suggesting that both and increase with the degree of nematic order. In conclusion, the onset of nematic order leads to increasing nematic correlation length, which provides a way to determine the size of nematic islands in the system.
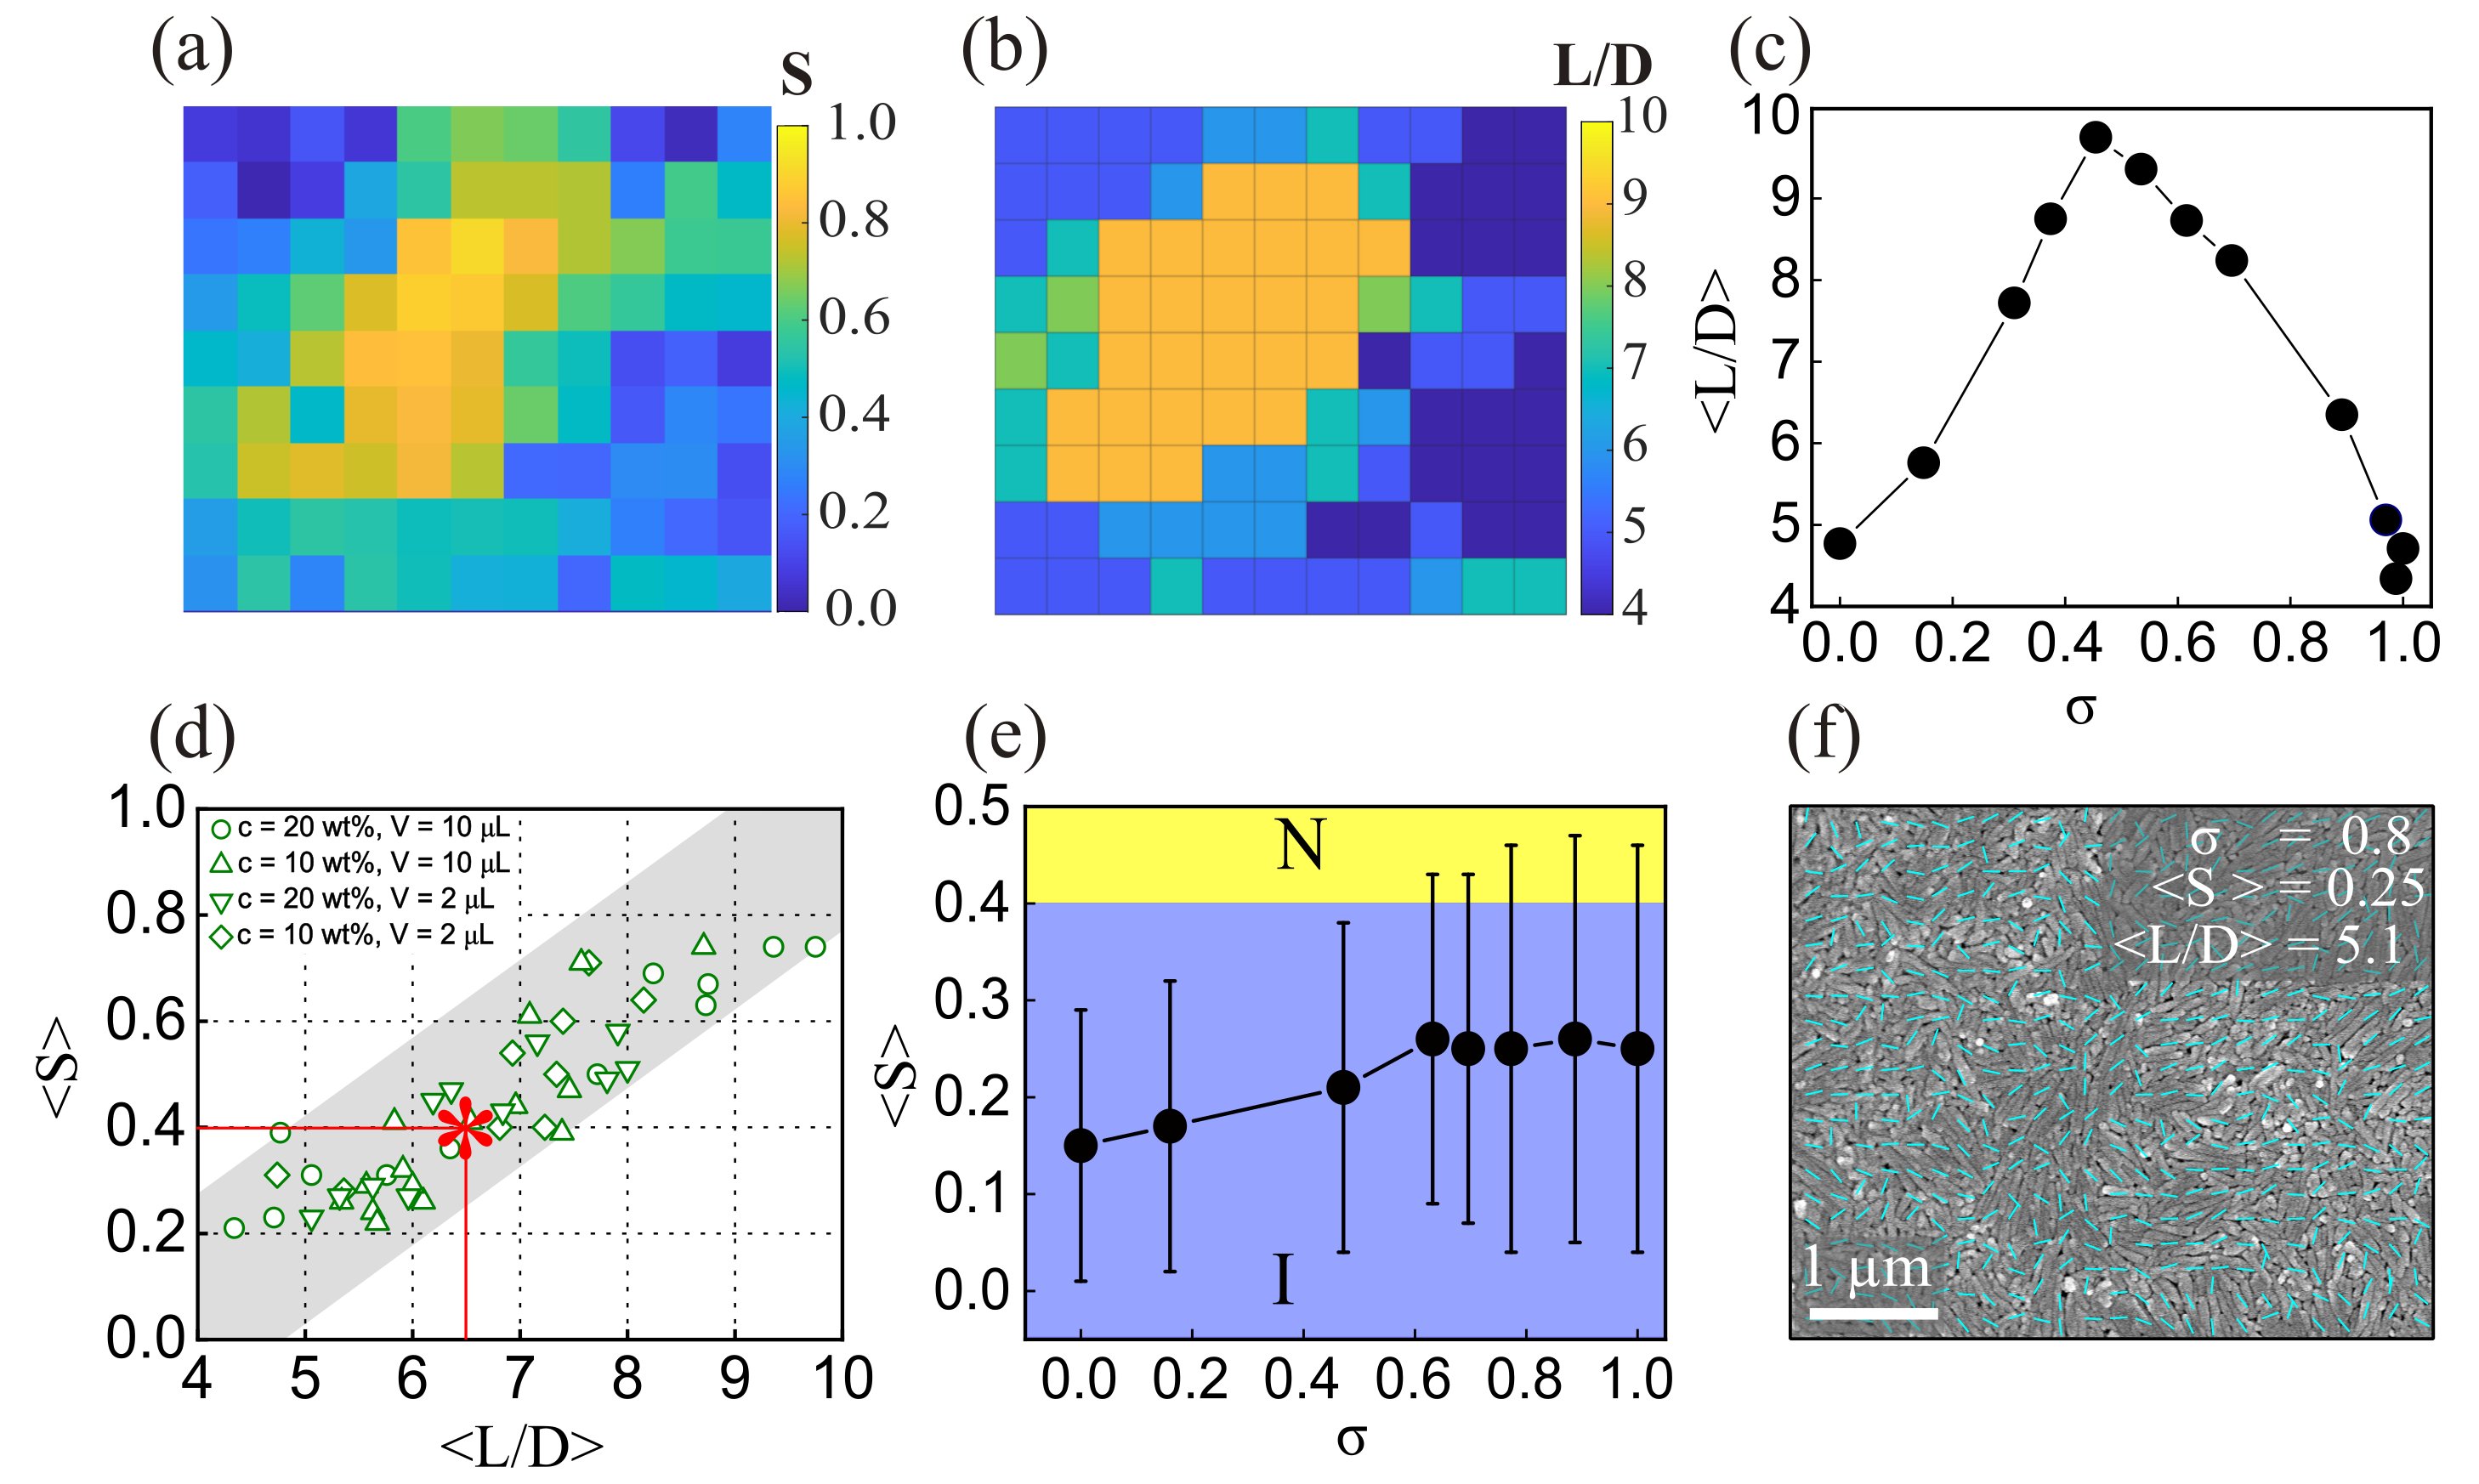
Next, we aim to uncover the parameter that determines the nematic order in self-assembled structures. To this end, we plot heat maps of and , shown in Figs. 4(a) (b) respectively, corresponding to the SEM image of Fig. 3(f). Interestingly, we find a strong spatial correlation between them down to the micrometer length scales. Later, we measure the average aspect ratio as a function of , where the averaging is performed over all the rods visible in the image. Notably, the vs. curve (Fig. 4(c)) shows qualitatively similar non-monotonic dependence as in Fig. 3(a). This corroborates our claim that and are correlated with each other. To further test the robustness of this result, we perform experiments with droplets of varying and and plot their vs. together in Fig. 4(d). We find that the linear relationship is valid for all the experiments over a wide range of and . This implies that the aspect ratio alone plays a crucial role in determining the local nematic order in self-assembled HNTs. Using as the I-N phase transition point (Fig. 3(a)), we estimate critical (indicated by a red asterisk symbol in Fig. 4(d)) beyond which the nematic phase appears in the system.
To put this number into perspective, previous numerical studies show a critical of 7 for two-dimensional cases on a square lattice in strictly equilibrium conditions [57, 58], which drops down to 6 when non-equilibrium effects are considered [59]. An even lower of 5 has been reported for numerical studies conducted in continuum limit for three dimensions [60, 53], and in the monolayer of vibrated granular rods [61]. Considering the complexity of self-assembly in our experiments, it is hard to determine similarities and differences with previous studies. Nevertheless, our findings demonstrate that an -dependent self-sorting is happening in our system, which, in turn, determines the local nematic order. This result underscores the importance of rod-anisotropy in affecting self-assembled structures.
Finally, we put this hypothesis to the test by specifically preparing a modified HNT dispersion with an = 5.1 ± 2.0 (see methods), much below the observed critical value of 6.5 1. In this case, increases monotonically with but never crosses into the nematic state, as shown in Fig. 4(e). A typical SEM image with the director field superimposed shown in Fig. 4(f) verifies that the rods always exist in the isotropic phase even at the highest . These findings confirm our premise that the aspect ratio alone is sufficient to tune the order of HNTs.
3 Conclusions
Here, we explored the evaporation-based self-assembly to investigate liquid crystalline behavior observed within a sessile droplet of HNTs dispersion. We performed these experiments with much higher volume fraction, aspect ratio polydispersity, and droplet volume using a mixed mode of drying so that we get a uniform deposition of rods throughout the surface. Our observations revealed that the polydispersity of rods within the droplet led to self-sorting behavior, forming a spatially inhomogeneous nematic state resulting in well-defined Isotropic-Nematic transitions. We observed the formation of novel structures, called nematic islands, signifying phase co-existence in our system. Their size increased linearly with nematic correlation length and the nematic order parameter value. We also found that the local aspect ratio of the HNTs solely determined the local nematic order parameter, which was true for all samples irrespective of the initial drop volume and concentration of the HNTs. From our data, we found a critical aspect ratio of required to observe an orientationally ordered structure of rods. These findings highlight the tunability and robustness of the underlying order of the assembly with aspect ratio as a control parameter.
The formation of phase-coexistence structures in the context of evaporation dynamics is not strange. Evaporation of liquid droplets containing a polydisperse collection of amyloid fibers has shown tactoids in the evaporating liquid [40]. Tactoids are distinct droplets of nematically aligned rods in an isotropic background. It will be interesting to see whether such structures also form in our system owing to our size polydispersity and if there is any connection between tactoids and the islands reported here.
Finally, the reported phenomena are a delicate interplay of a high degree of polydispersity in rod aspect ratio and an aspect ratio-dependent isotropic-nematic phase transition. Since the dynamics of the evaporation and precipitation process are physical in nature, we believe that our results are not unique to HNTs but should be valid universally, irrespective of the chemical composition. That is to say, any charge-stabilized colloidal suspension of a given size polydispersity, concentration, and volume should give rise to similar microstructures. Thus, using HNTs as a model system, our study provides valuable insights into the emergence of nematic structures in the evaporation-driven assembly of anisotropic nanorods.
Acknowledgements
NK acknowledges financial support from DST-SERB for CRG grant number CRG/2020/002925 and IITB for the seed grant. MP acknowledges the financial support from BARC for the departmental project ”Irradiation induced transformations in nuclear materials” (UID: RBA4043). MP thanks Dr. Rajib Ganguly, Chemistry Division, BARC, for Zeta potential measurements. AD gratefully acknowledges IIT Bombay for providing a post-doctoral fellowship. AD thanks Dr. Sunita Srivastava for permitting the use of her laboratory facilities and Somnath Paramanick for his assistance with the figures. NK thanks Dr. Guruswamy Kumaraswamy, Dr. Dibyendu Das and Dr. Sriram Ramaswamy for their insightful comments. We thank SAIF-IITB for the TEM facility and Dr. Rejin for his help with the FEG-SEM (Dept. of Chemical Engineering) facility.
4 Experimental methods
4.1 Materials
Halloysite nanotubes (HNTs) and sodium hexametaphosphate [(NaPO3)6] were procured from Sigma Aldrich, while sodium hydroxide (NaOH) was obtained from Merck Chemicals. For the assembly studies, single-side polished Si wafers of 100 orientation were used. The 1 cm × 1 cm substrates were used after cleaning with freshly prepared piranha solution. The cleaning process effectively removed the organic residue and imparted hydrophilicity to the substrate.
4.2 Purification of HNTs
HNTs were purified using the method reported in the literature [29]. In a typical procedure, 25 g of halloysite powder was added to a flask containing 100 mL of water, and the resulting mixture was stirred continuously for two hours. Na(PO3)6 (2 g) was gradually added to the above mixture under continuous stirring, followed by adjusting the pH of the resulting mixture to a range of 8-9 using a 10 wt.% aqueous NaOH solution. Subsequently, this mixture was stirred at room temperature for 24 hours and left standing for two hours to precipitate the aggregates. The impurities and larger HNTs aggregates precipitated at the flask’s bottom while individual HNTs remained in the supernatant. The supernatant was collected and then centrifuged at 3000 rpm for 5 min. The supernatant was decanted again, followed by centrifugation at 9000 rpm for 10 min. The resulting precipitates were washed multiple times using deionized (DI) water until they became neutral. Finally, the obtained solid was dried at room temperature.
4.3 Tuning the aspect ratio of HNTs
This was achieved by slightly modifying our functionalization protocol which is as follows. Firstly, we performed centrifugation at 3000 rpm to separate the supernatant, which was then subjected to subsequent centrifugation at 6000 rpm. The supernatant was then separated again and subjected to centrifugation at 10,000 rpm. The resulting solid material thus obtained was then dried at room temperature.
4.4 Droplet deposit and assembly Characterization
The deposited HNTs were investigated using a field emission gun (FEG)-scanning electron microscope (JSM 7600F) operating at an acceleration voltage of 5 keV. The morphology of HNTs was observed using a transmission electron microscope (TEM) JEOL model JEM 2100F operated at an accelerating voltage of 200 keV. The Zeta potential of the nanoparticle suspensions was measured using Anton Paar Litesizer 500 particle analyzer by electrophoretic light scattering method. Contact angle measurements were carried out using a video camera equipped with a macro lens.
4.5 Image Analysis
Director field analysis: Using ImageJ software [62], we first band-pass filtered the SEM image to remove pixel noise and achieve a uniform brightness across the image. Later, we used the unsharp mask algorithm to make the rod edges more pronounced. The resulting images were analyzed using an algorithm described in the methods of Cetera et al. [48]. This algorithm relies on a 2D Fast Fourier transform on a small local section (area ), giving a vector orthogonal to the actual director field. Depending upon the resolution and the clarity of the original SEM image, we vary anywhere between . Smaller values provide much finer details of the nematic director but are prone to errors. Greater values give a more accurate representation but tend to lose finer details in the structure. However, our results are statistically independent of the choice of .
References
- Bergaya and Lagaly [2013] F. Bergaya and G. Lagaly, Chapter 1 - general introduction: Clays, clay minerals, and clay science, in Handbook of Clay Science, Developments in Clay Science, Vol. 5, edited by F. Bergaya and G. Lagaly (Elsevier, 2013) pp. 1–19.
- Kumari and Mohan [2021] N. Kumari and C. Mohan, Basics of clay minerals and their characteristic properties, Clay Clay Miner 24, 1 (2021).
- Brigatti et al. [2006] M. Brigatti, E. Galan, and B. Theng, Chapter 2 structures and mineralogy of clay minerals, in Handbook of Clay Science, Developments in Clay Science, Vol. 1, edited by F. Bergaya, B. K. Theng, and G. Lagaly (Elsevier, 2006) pp. 19–86.
- Wilson and Keeling [2016] I. Wilson and J. Keeling, Global occurrence, geology and characteristics of tubular halloysite deposits, Clay Minerals 51, 309 (2016).
- Yuan et al. [2008] P. Yuan, P. D. Southon, Z. Liu, M. E. Green, J. M. Hook, S. J. Antill, and C. J. Kepert, Functionalization of halloysite clay nanotubes by grafting with -aminopropyltriethoxysilane, The Journal of Physical Chemistry C 112, 15742 (2008).
- Yuan et al. [2015] P. Yuan, D. Tan, and F. Annabi-Bergaya, Properties and applications of halloysite nanotubes: recent research advances and future prospects, Applied Clay Science 112, 75 (2015).
- Joussein et al. [2005] E. Joussein, S. Petit, J. Churchman, B. Theng, D. Righi, and B. Delvaux, Halloysite clay minerals—a review, Clay minerals 40, 383 (2005).
- Asgar et al. [2021] H. Asgar, J. Jin, J. Miller, I. Kuzmenko, and G. Gadikota, Contrasting thermally-induced structural and microstructural evolution of alumino-silicates with tubular and planar arrangements: Case study of halloysite and kaolinite, Colloids and Surfaces A: Physicochemical and Engineering Aspects 613, 126106 (2021).
- Li et al. [2022] Y. Li, X. Yuan, L. Jiang, H. Dai, Y. Zhao, X. Guan, J. Bai, and H. Wang, Manipulation of the halloysite clay nanotube lumen for environmental remediation: a review, Environ. Sci.: Nano 9, 841 (2022).
- Hanif et al. [2016] M. Hanif, F. Jabbar, S. Sharif, G. Abbas, A. Farooq, and M. Aziz, Halloysite nanotubes as a new drug-delivery system: a review, Clay Minerals 51, 469 (2016), https://pubs.geoscienceworld.org/claymin/article-pdf/51/3/469/3273723/CM_12_HANIF.pdf .
- Goda et al. [2019] E. S. Goda, M. Gab-Allah, B. S. Singu, and K. R. Yoon, Halloysite nanotubes based electrochemical sensors: A review, Microchemical Journal 147, 1083 (2019).
- Mahmoud et al. [2023] K. Mahmoud, M. Sayyed, S. Hashim, A. H. Almuqrin, and A. E.-S. AM, Impacts of halloysite clay nanoparticles on the structural and -ray shielding properties of the epoxy resin, Nuclear Engineering and Technology 55, 1585 (2023).
- Vergaro et al. [2010] V. Vergaro, E. Abdullayev, Y. M. Lvov, A. Zeitoun, R. Cingolani, R. Rinaldi, and S. Leporatti, Cytocompatibility and uptake of halloysite clay nanotubes, Biomacromolecules 11, 820 (2010).
- Massaro et al. [2017] M. Massaro, C. Colletti, G. Lazzara, S. Milioto, R. Noto, and S. Riela, Halloysite nanotubes as support for metal-based catalysts, Journal of Materials Chemistry A 5, 13276 (2017).
- Danyliuk et al. [2020] N. Danyliuk, J. Tomaszewska, and T. Tatarchuk, Halloysite nanotubes and halloysite-based composites for environmental and biomedical applications, Journal of Molecular Liquids 309, 113077 (2020).
- Lisuzzo et al. [2022] L. Lisuzzo, G. Cavallaro, S. Milioto, and G. Lazzara, Pickering emulsions stabilized by halloysite nanotubes: from general aspects to technological applications, Advanced Materials Interfaces 9, 2102346 (2022).
- Zhang et al. [2016] Y. Zhang, A. Tang, H. Yang, and J. Ouyang, Applications and interfaces of halloysite nanocomposites, Applied Clay Science 119, 8 (2016).
- Wijnhoven et al. [2005] J. E. Wijnhoven, D. D. Van’t Zand, D. van der Beek, and H. N. Lekkerkerker, Sedimentation and phase transitions of colloidal gibbsite platelets, Langmuir 21, 10422 (2005).
- Narayan et al. [2007] V. Narayan, S. Ramaswamy, and N. Menon, Long-lived giant number fluctuations in a swarming granular nematic, Science 317, 105 (2007).
- Mourad et al. [2009] M. C. Mourad, D. V. Byelov, A. V. Petukhov, D. Matthijs de Winter, A. J. Verkleij, and H. N. Lekkerkerker, Sol- gel transitions and liquid crystal phase transitions in concentrated aqueous suspensions of colloidal gibbsite platelets, The Journal of Physical Chemistry B 113, 11604 (2009).
- Xu and Gao [2011] Z. Xu and C. Gao, Aqueous liquid crystals of graphene oxide, ACS nano 5, 2908 (2011).
- Puech et al. [2011] N. Puech, C. Blanc, E. Grelet, C. Zamora-Ledezma, M. Maugey, C. Zakri, E. Anglaret, and P. Poulin, Highly ordered carbon nanotube nematic liquid crystals, The Journal of Physical Chemistry C 115, 3272 (2011).
- Liu et al. [2018] Y. Liu, M. Liu, S. Yang, B. Luo, and C. Zhou, Liquid crystalline behaviors of chitin nanocrystals and their reinforcing effect on natural rubber, ACS Sustainable Chemistry & Engineering 6, 325 (2018).
- Nyström et al. [2018] u. Nyström, M. Arcari, and R. Mezzenga, Confinement-induced liquid crystalline transitions in amyloid fibril cholesteric tactoids, Nature nanotechnology 13, 330 (2018).
- Bagnani et al. [2018] M. Bagnani, G. Nyström, C. De Michele, and R. Mezzenga, Amyloid fibrils length controls shape and structure of nematic and cholesteric tactoids, Acs Nano 13, 591 (2018).
- Kádár et al. [2021] R. Kádár, S. Spirk, and T. Nypelo, Cellulose nanocrystal liquid crystal phases: Progress and challenges in characterization using rheology coupled to optics, scattering, and spectroscopy, ACS nano 15, 7931 (2021).
- Kumar et al. [2022] N. Kumar, R. Zhang, S. A. Redford, J. J. de Pablo, and M. L. Gardel, Catapulting of topological defects through elasticity bands in active nematics, Soft Matter 18, 5271 (2022).
- De Gennes and Prost [1993] P.-G. De Gennes and J. Prost, The physics of liquid crystals, 83 (Oxford university press, 1993).
- Luo et al. [2013] Z. Luo, H. Song, X. Feng, M. Run, H. Cui, L. Wu, J. Gao, and Z. Wang, Liquid crystalline phase behavior and sol–gel transition in aqueous halloysite nanotube dispersions, Langmuir 29, 12358 (2013).
- Song et al. [2003] W. Song, I. A. Kinloch, and A. H. Windle, Nematic liquid crystallinity of multiwall carbon nanotubes, Science 302, 1363 (2003).
- Zhang et al. [2010] S. Zhang, Q. Li, I. A. Kinloch, and A. H. Windle, Ordering in a droplet of an aqueous suspension of single-wall carbon nanotubes on a solid substrate, Langmuir 26, 2107 (2010).
- Ming et al. [2008] T. Ming, X. Kou, H. Chen, T. Wang, H.-L. Tam, K.-W. Cheah, J.-Y. Chen, and J. Wang, Ordered gold nanostructure assemblies formed by droplet evaporation, Angewandte Chemie 120, 9831 (2008).
- Nobile et al. [2009] C. Nobile, L. Carbone, A. Fiore, R. Cingolani, L. Manna, and R. Krahne, Self-assembly of highly fluorescent semiconductor nanorods into large scale smectic liquid crystal structures by coffee stain evaporation dynamics, Journal of Physics: Condensed Matter 21, 264013 (2009).
- Lin et al. [2011] Y. Lin, Z. Su, G. Xiao, E. Balizan, G. Kaur, Z. Niu, and Q. Wang, Self-assembly of virus particles on flat surfaces via controlled evaporation, Langmuir 27, 1398 (2011).
- Dugyala et al. [2013] V. R. Dugyala, S. V. Daware, and M. G. Basavaraj, Shape anisotropic colloids: synthesis, packing behavior, evaporation driven assembly, and their application in emulsion stabilization, Soft Matter 9, 6711 (2013).
- Dugyala and Basavaraj [2015] V. R. Dugyala and M. G. Basavaraj, Evaporation of sessile drops containing colloidal rods: coffee-ring and order–disorder transition, The Journal of Physical Chemistry B 119, 3860 (2015).
- Li et al. [2016] P. Li, Y. Li, Z.-K. Zhou, S. Tang, X.-F. Yu, S. Xiao, Z. Wu, Q. Xiao, Y. Zhao, H. Wang, et al., Evaporative self-assembly of gold nanorods into macroscopic 3d plasmonic superlattice arrays, Advanced Materials 28, 2511 (2016).
- Zaibudeen et al. [2021] A. Zaibudeen, S. Khawas, and S. Srivastava, Understanding multiscale assembly mechanism in evaporative droplet of gold nanorods, Colloid and Interface Science Communications 44, 100492 (2021).
- Khawas and Srivastava [2023] S. Khawas and S. Srivastava, Anisotropic nanocluster arrays to a diminished zone: different regimes of surface deposition of gold nanocolloids, Soft Matter 19, 3580 (2023).
- Almohammadi et al. [2023] H. Almohammadi, Y. Fu, and R. Mezzenga, Evaporation-driven liquid–liquid crystalline phase separation in droplets of anisotropic colloids, ACS nano 17, 3098 (2023).
- Zhao et al. [2015] Y. Zhao, G. Cavallaro, and Y. Lvov, Orientation of charged clay nanotubes in evaporating droplet meniscus, Journal of colloid and interface science 440, 68 (2015).
- Liu et al. [2017] M. Liu, Z. Huo, T. Liu, Y. Shen, R. He, and C. Zhou, Self-assembling halloysite nanotubes into concentric ring patterns in a sphere-on-flat geometry, Langmuir 33, 3088 (2017).
- Liu et al. [2021] H. Liu, Y. Wang, Y. Luo, M. Guo, Y. Feng, and M. Liu, Tunable coffee-ring formation of halloysite nanotubes by evaporating sessile drops, Soft Matter 17, 9514 (2021).
- Huang et al. [2023] H. Huang, Y. Chen, M. Ni, J. Du, C. Hou, X. Qiao, G. Cao, and T. Wang, Sodium hexametaphosphate-treated halloysite based solid-phase extraction of biguanides from dietary supplements, Analytical Methods 15, 2685 (2023).
- Zeng et al. [2014] S. Zeng, C. Reyes, J. Liu, P. A. Rodgers, S. H. Wentworth, and L. Sun, Facile hydroxylation of halloysite nanotubes for epoxy nanocomposite applications, Polymer 55, 6519 (2014).
- Xu et al. [2013] W. Xu, R. Leeladhar, Y. T. Kang, and C.-H. Choi, Evaporation kinetics of sessile water droplets on micropillared superhydrophobic surfaces, Langmuir 29, 6032 (2013).
- Parsa et al. [2018] M. Parsa, S. Harmand, and K. Sefiane, Mechanisms of pattern formation from dried sessile drops, Advances in colloid and interface science 254, 22 (2018).
- Cetera et al. [2014] M. Cetera, G. R. Ramirez-San Juan, P. W. Oakes, L. Lewellyn, M. J. Fairchild, G. Tanentzapf, M. L. Gardel, and S. Horne-Badovinac, Epithelial rotation promotes the global alignment of contractile actin bundles during drosophila egg chamber elongation, Nature communications 5, 5511 (2014).
- Chaikin and Lubensky [1995] P. M. Chaikin and T. C. Lubensky, Principles of Condensed Matter Physics (Cambridge University Press, 1995).
- Kosterlitz and Thouless [1973] J. M. Kosterlitz and D. J. Thouless, Ordering, metastability and phase transitions in two-dimensional systems, Journal of Physics C: Solid State Physics 6, 1181 (1973).
- Chaté et al. [2006] H. Chaté, F. Ginelli, and R. Montagne, Simple model for active nematics: Quasi-long-range order and giant fluctuations, Physical Review Letters 96, 10.1103/physrevlett.96.180602 (2006).
- Shankar et al. [2018] S. Shankar, S. Ramaswamy, and M. C. Marchetti, Low-noise phase of a two-dimensional active nematic system, Physical Review E 97, 10.1103/physreve.97.012707 (2018).
- Bolhuis and Frenkel [1997] P. Bolhuis and D. Frenkel, Tracing the phase boundaries of hard spherocylinders, The Journal of Chemical Physics 106, 666 (1997).
- Hamade et al. [2020] F. Hamade, S. K. Amit, M. B. Woods, and V. A. Davis, The effects of size and shape dispersity on the phase behavior of nanomesogen lyotropic liquid crystals, Crystals 10, 715 (2020).
- Donald et al. [2006] A. M. Donald, A. H. Windle, and S. Hanna, Liquid Crystalline Polymers, 2nd ed. (Cambridge University Press, 2006) p. 133–228.
- Birshtein et al. [1988] T. Birshtein, B. Kolegov, and V. Pryamitsyn, Theory of athermal lyotropic liquid crystal systems, Polymer Science U.S.S.R. 30, 316 (1988).
- Ghosh and Dhar [2007] A. Ghosh and D. Dhar, On the orientational ordering of long rods on a lattice, Europhysics Letters (EPL) 78, 20003 (2007).
- Bates and Frenkel [2000] M. A. Bates and D. Frenkel, Phase behavior of two-dimensional hard rod fluids, The Journal of Chemical Physics 112, 10034 (2000).
- Patra et al. [2018] S. Patra, D. Das, R. Rajesh, and M. K. Mitra, Diffusion dynamics and steady states of systems of hard rods on a square lattice, Physical Review E 97, 10.1103/physreve.97.022108 (2018).
- Frenkel et al. [1988] D. Frenkel, H. N. W. Lekkerkerker, and A. Stroobants, Thermodynamic stability of a smectic phase in a system of hard rods, Nature 332, 822 (1988).
- Narayan et al. [2006] V. Narayan, N. Menon, and S. Ramaswamy, Nonequilibrium steady states in a vibrated-rod monolayer: tetratic, nematic, and smectic correlations, Journal of Statistical Mechanics: Theory and Experiment 2006, P01005 (2006).
- Abràmoff et al. [2004] M. D. Abràmoff, P. J. Magalhães, and S. J. Ram, Image processing with imagej, Biophotonics international 11, 36 (2004).