StructChart: Perception, Structuring, Reasoning for Visual Chart Understanding
Abstract
Charts are common in literature across different scientific fields, conveying rich information easily accessible to readers. Current chart-related tasks focus on either chart perception which refers to extracting information from the visual charts, or performing reasoning given the extracted data, e.g. in a tabular form. In this paper, we aim to establish a unified and label-efficient learning paradigm for joint perception and reasoning tasks, which can be generally applicable to different downstream tasks, beyond the question-answering task as specifically studied in peer works. Specifically, StructChart first reformulates the chart information from the popular tubular form (specifically linearized CSV) to the proposed Structured Triplet Representations (STR), which is more friendly for reducing the task gap between chart perception and reasoning due to the employed structured information extraction for charts. We then propose a Structuring Chart-oriented Representation Metric (SCRM) to quantitatively evaluate the performance for the chart perception task. To enrich the dataset for training, we further explore the possibility of leveraging the Large Language Model (LLM), enhancing the chart diversity in terms of both chart visual style and its statistical information. Extensive experiments are conducted on various chart-related tasks, demonstrating the effectiveness and promising potential for a unified chart perception-reasoning paradigm to push the frontier of chart understanding. Our chart dataset is available at: https://github.com/UniModal4Reasoning/SimChart9K.
1 Introduction
Charts are common tools for visualizing large amounts of information. Automatically extracting the underlying information from the visual charts has become an emerging research topic in learning (Masry et al., 2022; Nam et al., 2023) and vision communities (Luo et al., 2021; Obeid & Hoque, 2020; Rane et al., 2021), which can ultimately help better acquiring the data from the existing massive multi-modal corpus beyond raw texts or numbers.
Visual Chart Understanding (CU) aims to extract the statistical information contained within a given visual chart and perform the corresponding downstream tasks (e.g., chart question answering or chart redrawing) according to the extracted information, which is practical in many fields including medical tabular analysis (Ulmer et al., 2020), chart Optical Character Recognition (OCR) (Luo et al., 2021; Hegselmann et al., 2023; Obeid & Hoque, 2020; Masry et al., 2022), and knowledge data extraction for Large Language Models (LLMs) (Brown et al., 2020; Chung et al., 2022; He et al., 2022). Recently, chart-related research works can be categorized into two classes (1) Chart Perception (CP) class that focuses on recognizing valuable information from a chart, converting the chart from a visual-level image to text-level representation, and (2) Chart Reasoning (CR) class that aims to understand the chart information by a tabular form. Although these works (Masry et al., 2022; Raffel et al., 2020; Luo et al., 2021; Chung et al., 2022) are inspiring and have achieved promising performance gains on chart perception or chart reasoning task, joint perception-reasoning is still under-explored and challenged by the following aspects.
(1) Large perception-reasoning task gap: Perception task tries to extract as accurate chart information as possible, ignoring the subtle relations between data columns and rows. However, the task of reasoning is often required to consider the complicated data relations to output the right answer or summarize the chart information, especially for chart data that combine both numerical and textual information. (2) Incomplete metric evaluation: There lacks a comprehensive metric to evaluate chart perception performance from the perspective of structured information extraction with data relations. Besides, the current performance metric (Masry et al., 2022) only covers a single type of chart data such as bars (Choi et al., 2019), pie (Liu et al., 2019), and line (Luo et al., 2021), which is hard to be generalized to different chart domains when scaling up the number of chart data. (3) Expensive chart data: Acquiring charts from different fields and manually annotating these charts are highly dependent on professionals from different fields, which makes the chart data acquisition and annotation more difficult, labor-intensive, and time-consuming (Ulmer et al., 2020).
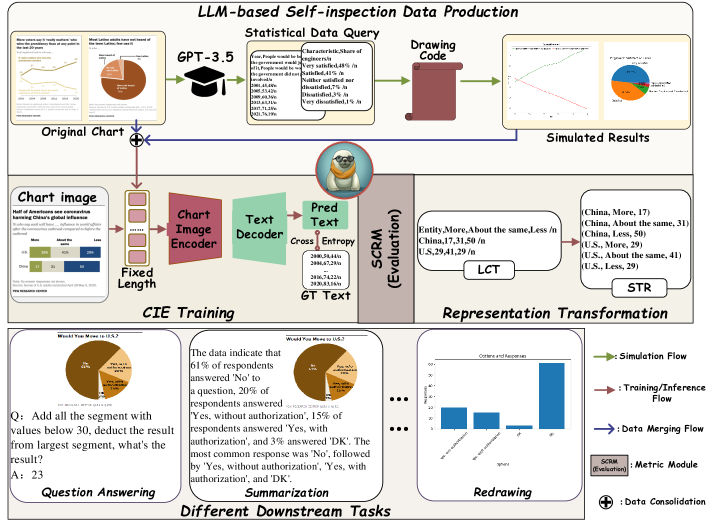
To tackle the above challenges, we propose StructChart, a novel approach for a unified and label-efficient learning paradigm for joint perception and reasoning tasks. Firstly, to alleviate the task gap, StructChart adopts an image-encoder and text-decoder to facilitate the representation transformation from chart images to text format using Linearized Comma-Separated Values Tokens (LCT). But we argue that LCT ignores the entity relation within the chart, and thus, propose to reformulate the chart from the commonly-used LCT format to a well-designed Structured Triplet Representations (STR) format. Secondly, to unify the metric evaluation, we develop a Structuring Chart-oriented representation Metric (SCRM) based on the proposed STR, which evaluates the chart perception ability from the STR (structured information description), enabling the perception evaluation process for different types of chart data. Finally, to expand the chart data, we propose an LLM-based self-inspection data production scheme that generates more chart data with different domain distributions by statistical data query and drawing code generation leveraging the LLMs. We found that the chart perception and reasoning ability can be enhanced by the LLMs-based simulation method.
Experiments are conducted on both chart perception and reasoning tasks, including chart perception, chart question answering, chart summarization, and chart redrawing. Besides, we produce a synthetic chart dataset termed SimChart9K. We observe that the SimChart9K significantly boosts the chart perception performance, even obtaining a high performance under the few-shot condition. Overall, experimental results verify that the proposed StructChart paradigm is able to achieve a high-performance chart perception and unify the chart understanding.
Contribution. (1) For robust chart perception and reasoning, we propose the so-called Structured Triplet Representations (STR), which replaces the widely-used linearized CSV tokens for chart-related tasks. (2) Based on the proposed STR format, we design a novel Structuring Chart-oriented Representation Metric (SCRM) applicable to various chart-related perception tasks whose evaluation sensitivity can be flexibly tuned by a preset hyper-parameter. (3) We perform data augmentation for chart perception and reasoning by leveraging an LLMs-based self-inspection data production scheme, producing the SimChart9K dataset. Besides, we observe that StructChart continuously improves the chart perception performance as more simulated charts are used for pre-training.
2 Related Works
Our work is focused on Chart Understanding (CU). We discuss works in this emerging area in several aspects, and leave the literature on Vision Language Pre-trained Models (VLPMs) in Appendix A.
Chart Perception refers to obtaining the numerical and textual values (often in the tabular) from the charts. ChartReader (Rane et al., 2021) takes a combined approach, using rule or heuristic-based edge extraction supported by OCR for text elements. (Choi et al., 2019) adopted the idea of general object detection to detect the bar components by treating each bar as an object. ChartOCR (Luo et al., 2021) employs a modified version of CornerNet (Law & Deng, 2018) backbone for keypoint detection to reconstruct the chart components (e.g. bars and sectors), and OCR for component value.
Chart Reasoning seeks to leverage chart image information in order to execute logical or mathematical reasoning processes, where Question Answering (QA) is a representative task for showing the chart reasoning ability. VL-T5-OCR (Masry et al., 2022) and VisionTaPas-OCR (Masry et al., 2022) extend cross-modality encoder in T5 (Raffel et al., 2020) and TaPas (Herzig et al., 2020) to consider chart image features. Besides, Pix2Struct (Lee et al., 2022) tries to use the screenshot parsing input to perform the self-supervised pre-training from abundant website data.
Chart Understanding is at a wider level than chart reasoning (at least by the scope of this paper), covering more open-ended and high-level tasks. Besides question answering task, chart understanding contains a wider variety of generative tasks, such as chart summarization, chart redrawing, etc. Matcha (Liu et al., 2022b) and Deplot (Liu et al., 2022a) are the pioneering attempts for chart understanding, with both carrying out the QA and summarization tasks. Matcha (Liu et al., 2022b) pre-trains a Pix2Struct (Lee et al., 2022) with chart derendering and math reasoning tasks, while Deplot (Liu et al., 2022a) harnesses Vision Language Pre-trained Model (VLPM) to extract chart information, and subsequently employs LLMs to conduct inference for the QA and summarization.
| Methods | Chart Types | Perception | Reasoning / | Perception | Downstream Tasks | ||||||
| Line | Bar | Pie | Understanding | Format | Metric | QA | S. | R. | |||
| CP | ReVision (Savva et al., 2011) | ✓ | ✓ | ✓ | JSON | ||||||
| ChartReader (Rane et al., 2021) | ✓ | ✓ | Component | ||||||||
| (Liu et al., 2019) | ✓ | ✓ | -level | ||||||||
| (Choi et al., 2019) | ✓ | ✓ | |||||||||
| ChartOCR (Luo et al., 2021) | ✓ | ✓ | ✓ | ✓ | Type-level | ||||||
| CR | T5-OCR (Masry et al., 2022) | ✓ | ✓ | ✓ | ✓ | ✓ | LCT | ✓ | |||
| TaPas-OCR (Masry et al., 2022) | ✓ | ✓ | ✓ | ✓ | ✓ | ✓ | |||||
| VL-T5-OCR (Masry et al., 2022) | ✓ | ✓ | ✓ | ✓ | ✓ | ✓ | |||||
| VisionTaPas-OCR (Masry et al., 2022) | ✓ | ✓ | ✓ | ✓ | ✓ | ✓ | |||||
| CU | Matcha (Liu et al., 2022b) | ✓ | ✓ | ✓ | – | ✓ | – | – | ✓ | ✓ | |
| Deplot (Liu et al., 2022a) | ✓ | ✓ | ✓ | ✓ | ✓ | LCT | – | ✓ | ✓ | ||
| StructChart (Ours) | ✓ | ✓ | ✓ | ✓ | ✓ | STR | SCRM | ✓ | ✓ | ✓ | |
Overall, Table 1 summarizes the differences between our StructChart and other chart-related works.
3 The Proposed Method
StructChart includes four key components: (1) Transformer-based Chart-oriented Information Extractor (CIE). It incorporates an image-encoder and text-decoder to facilitate the transformation from chart images to text format using Comma-Separated Values (CSV). (2) Structured Representation Transformation. The extracted intermediate CSV text is structured into a triplet form to elucidate the intricate position relationship between the header and index. (3) Structuring Chart-oriented Representation Metric (SCRM). We further design a metric that comprehensively evaluates the quality of the transformed triplets, which facilitates the subsequent reasoning. (4) LLM-based Self-inspection Data Production Scheme. We devise a novel methodology for chart data simulation to enhance zero-shot and few-shot perception and reasoning ability, achieving continuous performance gains when scaling up the simulated charts. The whole paradigm is illustrated in Fig. 1.
3.1 Design for Two-stage StructChart
Different from end-to-end multi-modal reasoning tasks (Masry et al., 2022; Obeid & Hoque, 2020), we fulfill CU by solving two independent tasks: perception and reasoning, with the Structured Triplet Representations (STR) data representation serving as a bridge between them.
Perception Stage. We propose a CIE that utilizes a pixel-level encoder and text-level decoder, both based on the Vision Transformer (ViT) (Dosovitskiy et al., 2020). Instead of standard ViT, which scales the input images to a predefined resolution, we propose to always scale the input image to a fixed number of patches that can fit within the longest given sequence length, according to the original resolution of the input image. Moreover, we add 2-dimensional absolute positional embeddings for the input patches, allowing the perception module to handle variable resolutions. At this stage, the chart at pixel level can be converted to text-level Linearized CSV Tokens (LCT).
Reasoning Stage. Before performing the reasoning process, we structure the LCT into the designed STR to facilitate the module’s understanding of chart-oriented information (see Sec. 3.2 for details). This structuring process enables us to reason over the text, providing a better understanding of the entity relation within a chart. Considering the difficulty of evaluating downstream tasks, the reasoning process is performed on the QA task using GPT-3.5 (Brown et al., 2020) without any prompt engineering strategies. Additionally, we verify the effectiveness of the proposed STR and compare with previous research works (Luo et al., 2021; Masry et al., 2022; Liu et al., 2022a; b).
The motivations of the designed two-stage pipeline are: 1) explicit chart image representations can enhance the interpretability of the subsequent reasoning stage, and 2) the extracted STR/LCT can be used as the pre-training corpus for large language models and vision-language models.
3.2 Structured Triplet Representations (STR) for Chart Understanding
Visual charts often contain rich textual and numerical information. Generally, the chart information is represented by long-form texts in the form of CSV, i.e. previously-mentioned LCT. However, the LCT format is sensitive to positional variations of entities from charts due to that it is used in a linear form. Thus, we propose to reformulate the LCT format in order to effectively and robustly represent the positional relations between row and column headers of a given chart.
Task Definition and Structuring. Given a chart image, the extracted LCT can be described as:
| (1) | ||||
where refers to line break, and and indicate -th row header entity and -th column header entity, respectively, where (). in Eq. 1 contains the positional information of and . However, the LCT still faces two issues: (1) The evaluation process for the predicted long-form texts containing positional information for perception model selection is non-trivial. (2) Highly position-sensitive LCT format increases the inference difficulty of different downstream chart tasks.
Considering that chart information has matrix-like row-column transformation invariance and transpose transformation invariance, the LCT is structured into a well-designed triplet, with higher granularity for evaluation and downstream. Given LCT tokens shown in Eq. 1, the structured triplet representations can be obtained as follows:
| (2) | ||||
Evaluation Metric Design. Furthermore, we design a Structuring Chart-oriented Representation Metric (SCRM) to comprehensively evaluate the extracted chart information represented using the proposed STR. When comparing the predicted STR and Ground Truth (GT) STR , we treat as strings and as floats, respectively. More detailed description of the matching process is provided in Appendix B.
1) Image-wise. Suppose that there are totally triplets from the model prediction and triplets from GT (), the evaluation process is shown as follows:
-
-
For , we obtain the edit distance of the -th prediction string and the -th GT string:
(3) -
-
For , we calculate the relative error between the -th prediction value and the -th GT value:
(4) -
-
To achieve a comprehensive evaluation, we design three levels of tolerance for fine-grained judgment, aiming to measure the similarity between the predicted triplets and GT triplets, by calculating the Intersection over Union , under the given tolerance level as follows:
(5) (6) (7)
2) Dataset-wise. Given the dataset with chart images (), the Intersection over Union of the -th image can be denoted as . Besides, given a preset similarity threshold , the corresponding discriminant function towards the positive and negative images can be written as:
| (8) |
When the preset similarity threshold becomes a variable (denoted as ), it changes to:
| (9) |
The proposed metric SCRM consists of two indicators ( with a fixed similarity threshold and with a varying one in the range ):
| (10) |
3.3 Simulating Charts with Enhanced Diversity for Pretraining-Finetuning
Considering the difficulty and cost of chart data acquisition and labeling, we introduce an LLM-based text-to-chart level data production scheme, dividing into: (1) statistical data query to ensure the data-level diversity, and (2) drawing code generation to ensure the drawing style diversity. The complete schematic simulation paradigm is shown in Appendix E.
Statistical Data Query. Given the chart dataset , where are the images and are the corresponding labeled texts in CSV format. At this stage, we define the task as the imitation of labeled CSV texts in origin chart dataset through an LLM (specifically GPT-3.5) to generate simulated CSV labels . In detail, We employ the few-shot prompting, leveraging generative model (Brown et al., 2020) to complete the imitation task. For diversity and effectiveness of the imitation data, we impose three restrictions on the demonstration and instruction: (1) The simulated content must be in CSV format, (2) The scale of can be altered compared with , including the number of rows, and (3) The combination of text in must be reasonable, even though it may be highly irrelevant to .
Drawing Code Generation. Having obtained the simulated texts (in CSV format) , the next step is to create images based on . We still employ the advanced GPT-3.5 to directly generate the drawing code, and draw the simulated chart based on the aforementioned statistical data , by means of our developed instruction prompting. To guarantee the diversity of chart distribution at the image level, we implement the following limitations within the instruction prompting: (1) Random selection of a chart type that is appropriate for , comprising histograms, scatterplots, line charts, and pie charts, (2) Random choice of drawing style, including fonts, colors, line styles, backgrounds, etc, and (3) Transformation of scale with different coordinate axes.
To guarantee that the generated drawing code can be executed correctly, we design a self-inspection mechanism to iteratively skip the non-executable code generated by GPT-3.5, until all the drawing code that matches the corresponding text can be executable. Benefiting from the diversities of the texts generated by GPT-3.5, we can generate more diverse Statistical Data Queries and Drawing Codes, according to the given . As a result, the proposed LLM-based text-to-chart level data production scheme can be used to simulate scalable, data-rich and style-diverse chart dataset based on scale-invariant or few-shot original chart datasets
4 Experiments
4.1 Evaluation Datasets and Implementation Details
Datasets. We evaluate our StructChart on three real-world chart benchmarks and our simulated dataset with image-CSV pairs. ChartQA (Masry et al., 2022) is a large-scale visual reasoning dataset with 20,882 charts collected from online sources, which can be divided into an augmented set generated synthetically and a human set written by humans. PlotQA (Methani et al., 2019) is a synthetic dataset that covers 28.9 million question-answer pairs spread across 224,377 plots. FigureQA (Kahou et al., 2017) is a visual reasoning corpus consisting of over one million human-designed question-answer pairs. Chart2Text (Obeid & Hoque, 2020) is a dataset for automatic summarization of statistical charts crawled from statista.com, yielding total 8,305 charts with annotations. SimChart9K is the proposed simulated dataset composed of 9,098 charts and associated data annotations in CSV format. We have previously elucidated the simulation methodology in Sec. 3.3, where it was generated via ChartQA using a generative model.
Implementation and Evaluation Metrics. We design various data consolidation settings based on both real and simulated data, when training StructChart using the architecture mentioned in Sec. 3.1. For perception, we employ SCRM (Sec. 3.2) for perception model selection, and obtain STR of input chart from the well-trained StructChart model. For reasoning, we use GPT-3.5 without prompt engineering strategy to perform different downstream tasks for fair comparison with other methods.
4.2 Chart Perception Results on Real-world and Simulation Data
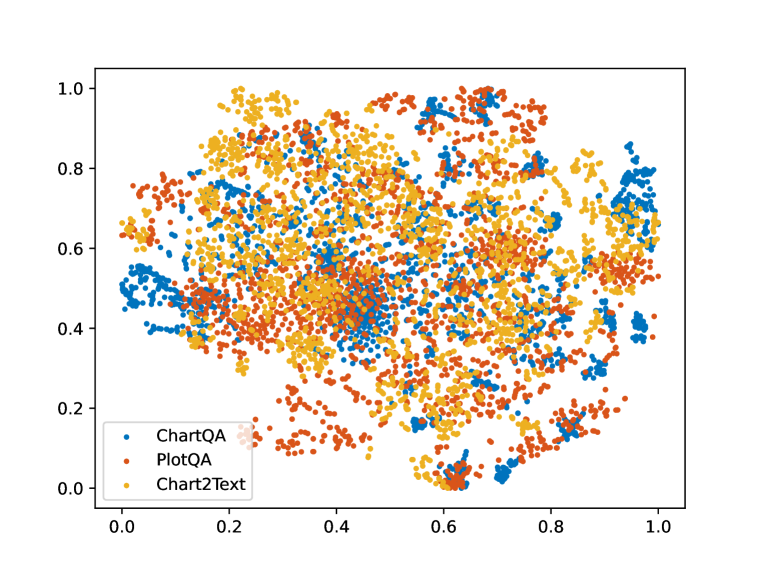
We first conduct the experiments on real-world datasets including ChartQA, PlotQA, and Chart2Text, and further merge them for joint-dataset training, to better evaluate the performance scalability given more training data. From Table 2, with a generalizability study conducted on ChartQA, PlotQA and Chart2Text, StructChart continuously improves the perception performance of chart data on each domain given more real or simulated training samples. Moreover, Fig. 2(a) visualizes the feature distributions via t-SNE (Van der Maaten & Hinton, 2008), where features from different datasets are basically consistent.
| Val Set | Model | Train Set | mPrecision | Precision | |||||||
|---|---|---|---|---|---|---|---|---|---|---|---|
| Tolerance | 0.5:0.05:0.95 | 0.5 | 0.75 | 0.95 | 1 (EM) | ||||||
| ChartQA | Matcha (Liu et al., 2022b) | ChartQA+ | strict | 0.5160 | 0.5814 | 0.5114 | 0.4678 | 0.4460 | |||
| PlotQA+ | slight | 0.6598 | 0.7045 | 0.6572 | 0.6250 | - | |||||
| C.D. | high | 0.7161 | 0.7519 | 0.7150 | 0.6894 | - | |||||
| Deplot (Liu et al., 2022a) | ChartQA+ | strict | 0.6331 | 0.7008 | 0.6326 | 0.5814 | 0.5663 | ||||
| PlotQA+ | slight | 0.7666 | 0.8229 | 0.7661 | 0.7282 | - | |||||
| C.D. | high | 0.8150 | 0.8759 | 0.8087 | 0.7812 | - | |||||
| Our StructChart | ChartQA | strict | 0.6770 | 0.7273 | 0.6714 | 0.6458 | 0.6326 | ||||
| slight | 0.7792 | 0.8220 | 0.7746 | 0.7519 | - | ||||||
| high | 0.8274 | 0.8703 | 0.8210 | 0.8011 | - | ||||||
| Our StructChart | Real Merging | strict | 0.7017 | 0.7547 | 0.6998 | 0.6610 | 0.6506 | ||||
| slight | 0.8227 | 0.8674 | 0.8201 | 0.7926 | - | ||||||
| high | 0.8591 | 0.8987 | 0.8551 | 0.8362 | - | ||||||
| Our StructChart | Real&Sim Merging | strict | 0.7187 | 0.7683 | 0.7153 | 0.6705 | 0.6642 | ||||
| slight | 0.8311 | 0.8761 | 0.8301 | 0.8001 | - | ||||||
| high | 0.8568 | 0.8990 | 0.8542 | 0.8358 | - | ||||||
| PlotQA | Matcha (Liu et al., 2022b) | ChartQA+ | strict | 0.0048 | 0.0089 | 0.0048 | 0.0036 | 0.0036 | |||
| PlotQA+ | slight | 0.0752 | 0.0909 | 0.0754 | 0.0635 | - | |||||
| C.D. | high | 0.0823 | 0.1093 | 0.0837 | 0.0719 | - | |||||
| Deplot (Liu et al., 2022a) | ChartQA+ | strict | 0.0997 | 0.1532 | 0.1021 | 0.0641 | 0.0629 | ||||
| PlotQA+ | slight | 0.6969 | 0.8664 | 0.7435 | 0.5463 | - | |||||
| C.D. | high | 0.7471 | 0.9679 | 0.8034 | 0.5992 | - | |||||
| Our StructChart | PlotQA | strict | 0.1995 | 0.2500 | 0.1931 | 0.1765 | 0.1736 | ||||
| slight | 0.7848 | 0.8519 | 0.7784 | 0.7405 | - | ||||||
| high | 0.8271 | 0.8922 | 0.8223 | 0.7861 | - | ||||||
| Our StructChart | Real Merging | strict | 0.4549 | 0.5855 | 0.4525 | 0.3521 | 0.3385 | ||||
| slight | 0.8589 | 0.9210 | 0.8569 | 0.8118 | - | ||||||
| high | 0.8921 | 0.9466 | 0.8860 | 0.8557 | - | ||||||
| Our StructChart | Real&Sim Merging | strict | 0.4596 | 0.5901 | 0.4569 | 0.3563 | 0.3612 | ||||
| slight | 0.8612 | 0.9234 | 0.8590 | 0.8138 | - | ||||||
| high | 0.8998 | 0.9547 | 0.8935 | 0.8591 | - | ||||||
| Chart2Text | Our StructChart | Chart2Text | strict | 0.1936 | 0.2473 | 0.1892 | 0.1533 | 0.1442 | |||
| slight | 0.5524 | 0.6603 | 0.5529 | 0.4672 | - | ||||||
| high | 0.6945 | 0.7676 | 0.6934 | 0.6356 | - | ||||||
| Our StructChart | Real Merging | strict | 0.3156 | 0.4002 | 0.3123 | 0.2509 | 0.2318 | ||||
| slight | 0.7141 | 0.7938 | 0.7205 | 0.6426 | - | ||||||
| high | 0.8085 | 0.8595 | 0.8090 | 0.7673 | - | ||||||
| Our StructChart | Real&Sim Merging | strict | 0.3394 | 0.4261 | 0.3367 | 0.2749 | 0.2635 | ||||
| slight | 0.7759 | 0.8522 | 0.7701 | 0.7096 | - | ||||||
| high | 0.8296 | 0.8791 | 0.8287 | 0.7700 | - | ||||||
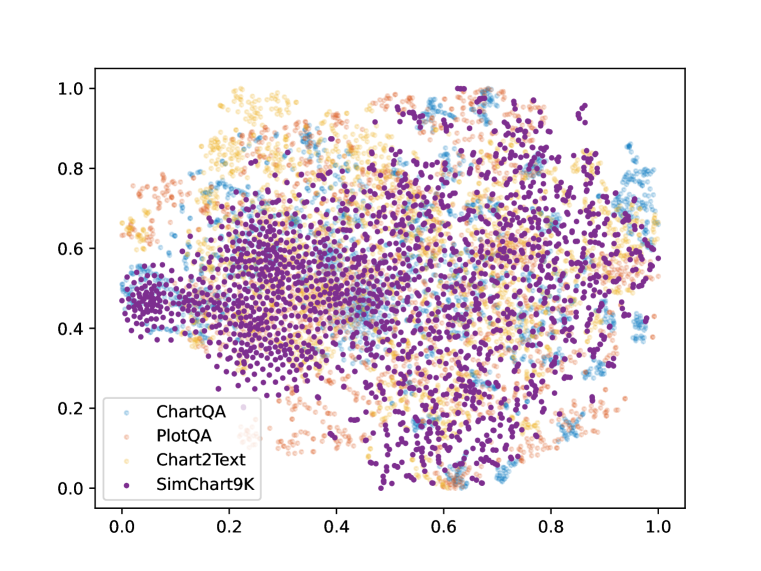
We randomly divide the proposed SimChart9K dataset into four subsets with different amounts (0.1K, 1K, 6K, 9K), and train the StructChart on the mixed dataset (including ChartQA training set and SimChart with different amounts). All evaluations are conducted on the ChartQA validation set based on the proposed SCRM metrics. In Table 3, it can be seen that the introduction of simulation dataset significantly improves the CIE performance of StructChart; that is, the larger the simulation dataset, the greater the performance gains in CIE. Furthermore, we also illustrate feature distributions of SimChart9K in Fig. 2(b). It can be observed from Fig. 2(b) that the feature distribution of the simulated data (SimChart9K) can be better matched with that of the real data such as ChartQA, PlotQA, and Chart2Text. As a result, the simulated charts are beneficial to boost the CIE performance of the model towards the real-world charts.
| Train Set | mPrecision | Precision | ||||||||
|---|---|---|---|---|---|---|---|---|---|---|
| Tolerance | 0.5:0.05:0.95 | 0.5 | 0.75 | 0.95 | 1 (EM) | |||||
| ChartQA (w/o simulation data) | strict | 0.6770 | 0.7273 | 0.6714 | 0.6458 | 0.6326 | ||||
| slight | 0.7792 | 0.8220 | 0.7746 | 0.7519 | - | |||||
| high | 0.8274 | 0.8703 | 0.8210 | 0.8011 | - | |||||
| Real & Simulated Source | ChartQA+SimChart 0.1K | strict | 0.6804 | 0.7282 | 0.6752 | 0.6468 | 0.6383 | |||
| slight | 0.7893 | 0.8305 | 0.7850 | 0.7595 | - | |||||
| high | 0.8326 | 0.8731 | 0.8277 | 0.8087 | - | |||||
| ChartQA+SimChart 1K | strict | 0.6871 | 0.7367 | 0.6828 | 0.6544 | 0.6458 | ||||
| slight | 0.7938 | 0.8371 | 0.7907 | 0.7661 | - | |||||
| high | 0.8394 | 0.8788 | 0.8362 | 0.8116 | - | |||||
| ChartQA+SimChart 6K | strict | 0.7040 | 0.7491 | 0.7036 | 0.6686 | 0.6591 | ||||
| slight | 0.8128 | 0.8580 | 0.8116 | 0.7794 | - | |||||
| high | 0.8450 | 0.8835 | 0.8428 | 0.8182 | - | |||||
| ChartQA+SimChart 9K | strict | 0.7116 | 0.7595 | 0.7074 | 0.6809 | 0.6686 | ||||
| slight | 0.8182 | 0.8674 | 0.8144 | 0.7850 | - | |||||
| high | 0.8527 | 0.8958 | 0.8532 | 0.8220 | - | |||||
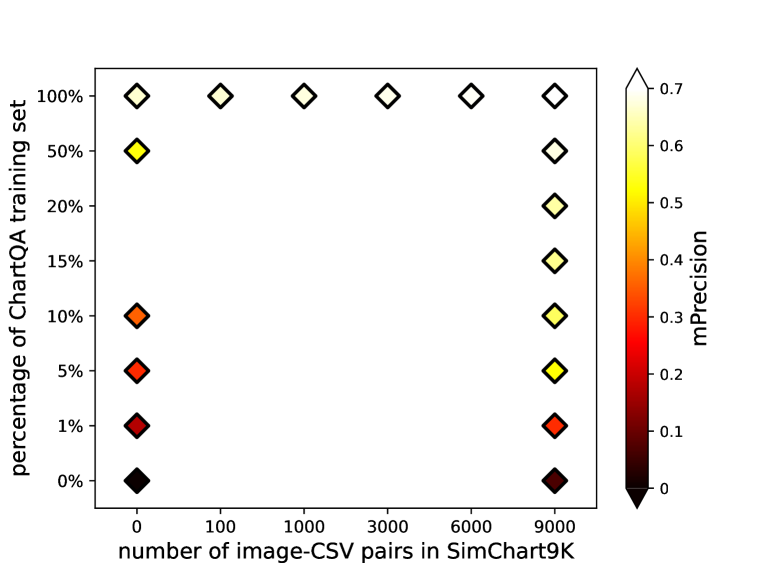
4.3 Achieving 100% Performance by Only 20% Real Data
The purpose of this part is to answer two questions: 1) Can we achieve a high-performance CIE only leveraging few-shot real samples? 2) With the help of SimChart9K, how many real-world samples can obtain the CIE performance that is achieved on the full training set? To answer these questions, we split the real chart dataset ChartQA into subsets with different sizes, including subsets with 1%, 10%, 20% and 50% original real-world samples. We demonstrate zero-shot and few-shot results in Table 5, obtaining the following observations: (1) When the model is trained on the real dataset ChartQA alone without any simulated samples, the CIE performance is still positively correlated with the number of real-world training samples. (2) Training only on the simulated dataset without any real samples (zero-shot training) fails to achieve a satisfactory CIE performance, due to the insufficiency in real-world charts. (3) By leveraging the proposed method to generate many simulated charts (SimChart9K), only 20% real-world charts can basically achieve equal CIE performance under the 100% real-world training samples. Besides, it can be observed from Table 5 that the CIE performance obtained using 50% real-world charts significantly outperforms that obtained using the full-set training examples. Besides, we conduct experiments on PloatQA and Chart2Text, and the results in Table 6 show that, with the help of SimChart9K, only 10% original real samples in PlotQA and 20% in Chart2Text can achieve equivalent CIE performance under the 100% real training samples. We further illustrate the above observations in Fig. 3.
| Model | Train Set | ChartQA val | ||||
|---|---|---|---|---|---|---|
| aug. | human | avg. | ||||
| Baseline | VL-T5-OCR (Masry et al., 2022) | ChartQA | - | - | 41.6 | |
| Tapas-OCR (Masry et al., 2022) | ChartQA | - | - | 45.5 | ||
| PaLI-17B (Chen et al., 2022b) | ChartQA | 64.9 | 30.4 | 47.6 | ||
| Pix2Struct (Lee et al., 2022) | ChartQA | 81.6 | 30.5 | 56.0 | ||
| MatCha (Liu et al., 2022b) | ChartQA/PlotQA/C.D. | 90.2 | 38.2 | 64.2 | ||
| Deplot (Liu et al., 2022a)+GPT3.5 | ChartQA/PlotQA/C.D. | 69.3 | 36.6 | 52.9 | ||
| LCT | StructChart+GPT3.5 | ChartQA | 64.2 | 37.1 | 50.7 | |
| Raal Merging | 69.9 | 39.1 | 54.5 | |||
| ChartQA0.2+SimChart9K | 62.6 | 36.0 | 49.3 | |||
| ChartQA+SimChart9K | 71.3 | 41.2 | 56.3 | |||
| STR | StructChart+GPT3.5 | ChartQA | 78.5 | 42.8 | 60.7 | |
| Raal Merging | 80.2 | 44.3 | 62.2 | |||
| ChartQA0.2+SimChart9K | 76.3 | 40.7 | 58.5 | |||
| ChartQA+SimChart9K | 83.9 | 46.7 | 65.3 | |||
| Train Set | mPrecision | Precision | ||||||||
|---|---|---|---|---|---|---|---|---|---|---|
| Tolerance | 0.5:0.05:0.95 | 0.5 | 0.75 | 0.95 | 1 (EM) | |||||
| No Simulated Source | ChartQA0.01 | strict | 0.1797 | 0.2121 | 0.1771 | 0.1591 | 0.1534 | |||
| slight | 0.2384 | 0.2850 | 0.2339 | 0.2178 | - | |||||
| high | 0.2686 | 0.3277 | 0.2633 | 0.2424 | - | |||||
| ChartQA0.1 | strict | 0.3616 | 0.4015 | 0.3598 | 0.3277 | 0.3210 | ||||
| slight | 0.4242 | 0.4612 | 0.4195 | 0.4025 | - | |||||
| high | 0.4653 | 0.5038 | 0.4631 | 0.4422 | - | |||||
| ChartQA0.5 | strict | 0.5389 | 0.5786 | 0.5350 | 0.5085 | 0.4981 | ||||
| slight | 0.6150 | 0.6525 | 0.6089 | 0.5890 | - | |||||
| high | 0.6603 | 0.6951 | 0.6553 | 0.6392 | - | |||||
| ChartQA | strict | 0.6770 | 0.7273 | 0.6714 | 0.6458 | 0.6326 | ||||
| slight | 0.7792 | 0.8220 | 0.7746 | 0.7519 | - | |||||
| high | 0.8274 | 0.8703 | 0.8210 | 0.8011 | - | |||||
| Zero-shot | SimChart9K | strict | 0.0688 | 0.0890 | 0.0691 | 0.0483 | 0.0483 | |||
| slight | 0.1577 | 0.1979 | 0.1562 | 0.1288 | - | |||||
| high | 0.2527 | 0.3021 | 0.2491 | 0.2235 | - | |||||
| Few-shot | ChartQA0.01+SimChart9K | strict | 0.3074 | 0.3797 | 0.3078 | 0.2500 | 0.2348 | |||
| slight | 0.4672 | 0.5227 | 0.4706 | 0.4138 | - | |||||
| high | 0.5402 | 0.5909 | 0.5398 | 0.4981 | - | |||||
| ChartQA0.1+SimChart9K | strict | 0.5973 | 0.6619 | 0.6013 | 0.5483 | 0.5294 | ||||
| slight | 0.7466 | 0.7936 | 0.7500 | 0.7112 | - | |||||
| high | 0.7980 | 0.8419 | 0.8002 | 0.7661 | - | |||||
| strict | 0.6465 | 0.7055 | 0.6468 | 0.5956 | 0.5814 | |||||
| slight | 0.7787 | 0.8229 | 0.7775 | 0.7443 | - | |||||
| ChartQA0.2+SimChart9K | high | 0.8206 | 0.8646 | 0.8201 | 0.7888 | - | ||||
| strict | 0.6902 | 0.7434 | 0.6913 | 0.6487 | 0.6420 | |||||
| slight | 0.8015 | 0.8466 | 0.8002 | 0.7642 | - | |||||
| ChartQA0.5+SimChart9K | high | 0.8380 | 0.8788 | 0.8400 | 0.8040 | - | ||||
| Val Set | Model | Train Set | mPrecision | Precision | |||||||
|---|---|---|---|---|---|---|---|---|---|---|---|
| Tolerance | 0.5:0.05:0.95 | 0.5 | 0.75 | 0.95 | 1 (EM) | ||||||
| PlotQA | Our StructChart | PlotQA | strict | 0.1995 | 0.2500 | 0.1931 | 0.1765 | 0.1736 | |||
| slight | 0.7848 | 0.8519 | 0.7784 | 0.7405 | - | ||||||
| high | 0.8271 | 0.8922 | 0.8223 | 0.7861 | - | ||||||
| Our StructChart | PlotQA0.1+SimChart9K | strict | 0.1887 | 0.2452 | 0.1874 | 0.1684 | 0.1612 | ||||
| slight | 0.7976 | 0.6624 | 0.7948 | 0.7517 | - | ||||||
| high | 0.8063 | 0.8689 | 0.8033 | 0.7614 | - | ||||||
| Chart2Text | Our StructChart | Chart2Text | strict | 0.1936 | 0.2473 | 0.1892 | 0.1533 | 0.1442 | |||
| slight | 0.5524 | 0.6603 | 0.5529 | 0.4672 | - | ||||||
| high | 0.6945 | 0.7676 | 0.6934 | 0.6356 | - | ||||||
| Our StructChart | Chart2Text0.2+SimChart9K | strict | 0.2610 | 0.3177 | 0.2601 | 0.2248 | 0.1729 | ||||
| slight | 0.5711 | 0.6731 | 0.5698 | 0.4872 | - | ||||||
| high | 0.6871 | 0.7512 | 0.6855 | 0.6309 | - | ||||||
4.4 From Perception to Reasoning: Structured Triplet Representations (STR)
We conduct experiments to verify the effectiveness of STR as the intermediate representations of chart for various downstream reasoning tasks. We compare STR with commonly-used LCT. Besides, we leverage GPT-3.5 (Brown et al., 2020) as the reasoning module in a one-shot prompting way.
For QA Task, we evaluate on ChartQA (Masry et al., 2022) using the Exact Match (EM) metric for the text answer, where a 5% tolerance for the numerical answer is allowed to make a fair comparison. Table 3 shows that: (1) SCRM can effectively reflect the quality of CIE, as verified on the QA task, (2) By comparing LCT, the proposed STR facilitates a better understanding of LLMs, yielding higher answer accuracies. In our analysis, this is mainly due to that the STR is designed using a structural description, with a row-column matching relation compared with the previous LCT format. (3) Our StructChart+GPT3.5 pipeline surpasses all baselines on the ChartQA validation set and achieves comparable QA performance with the recently-proposed method (Liu et al., 2022b) trained on a closed-source dataset (actually covers a large number of charts in the wild). We also verify the performance of QA task on FigureQA (Kahou et al., 2017) in Table D.
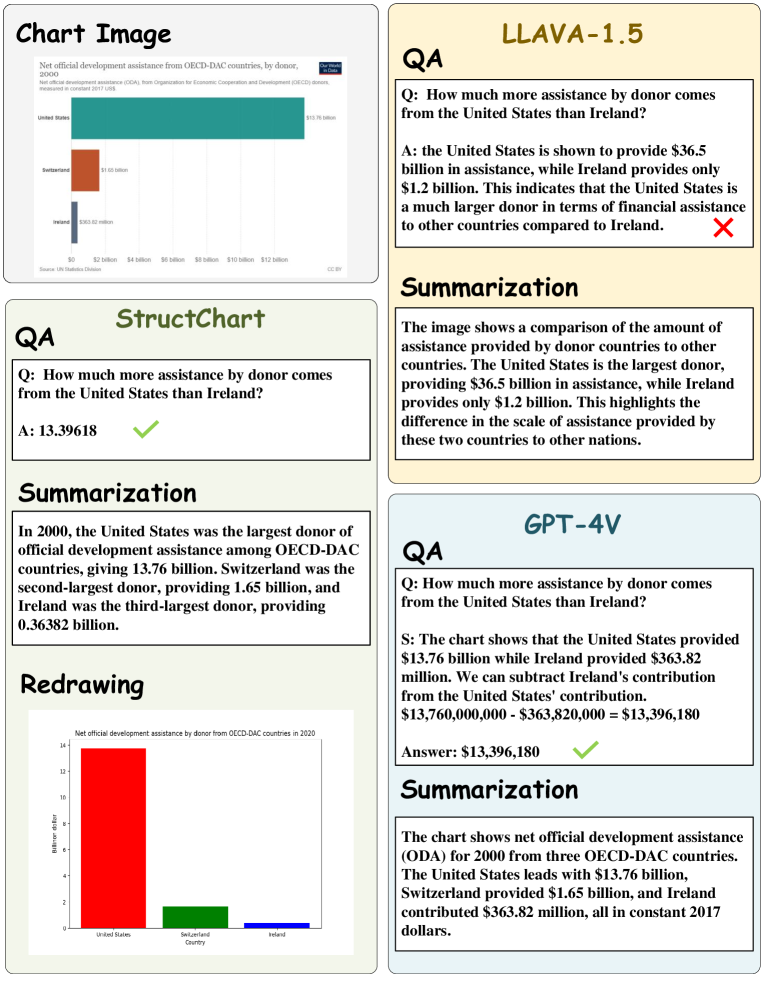
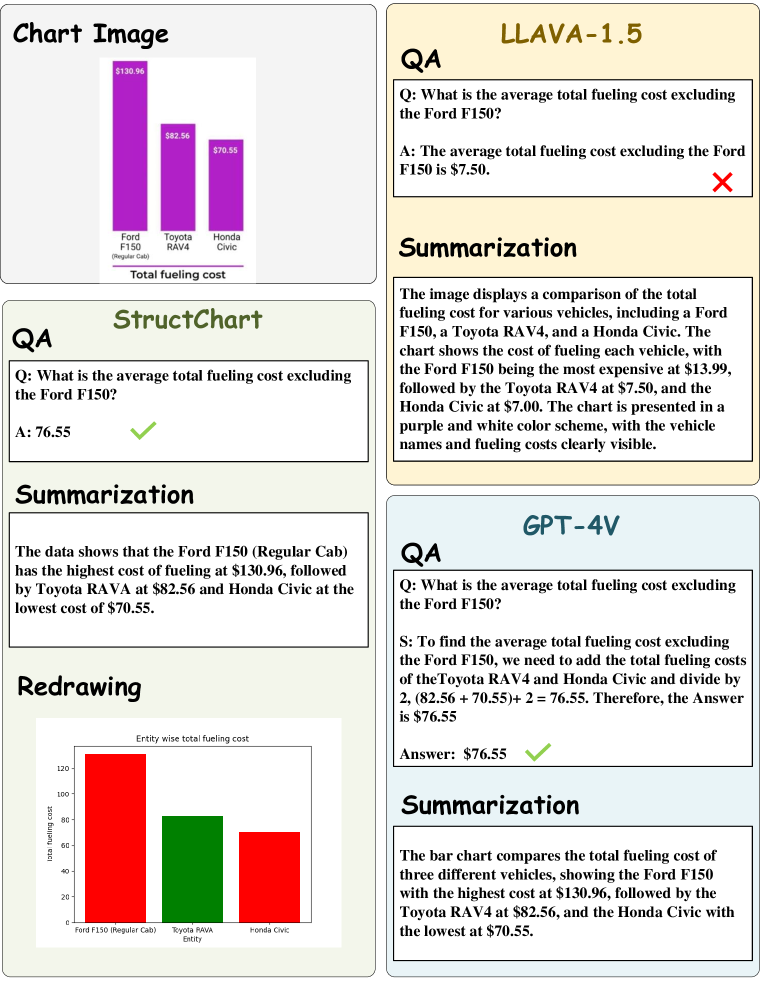
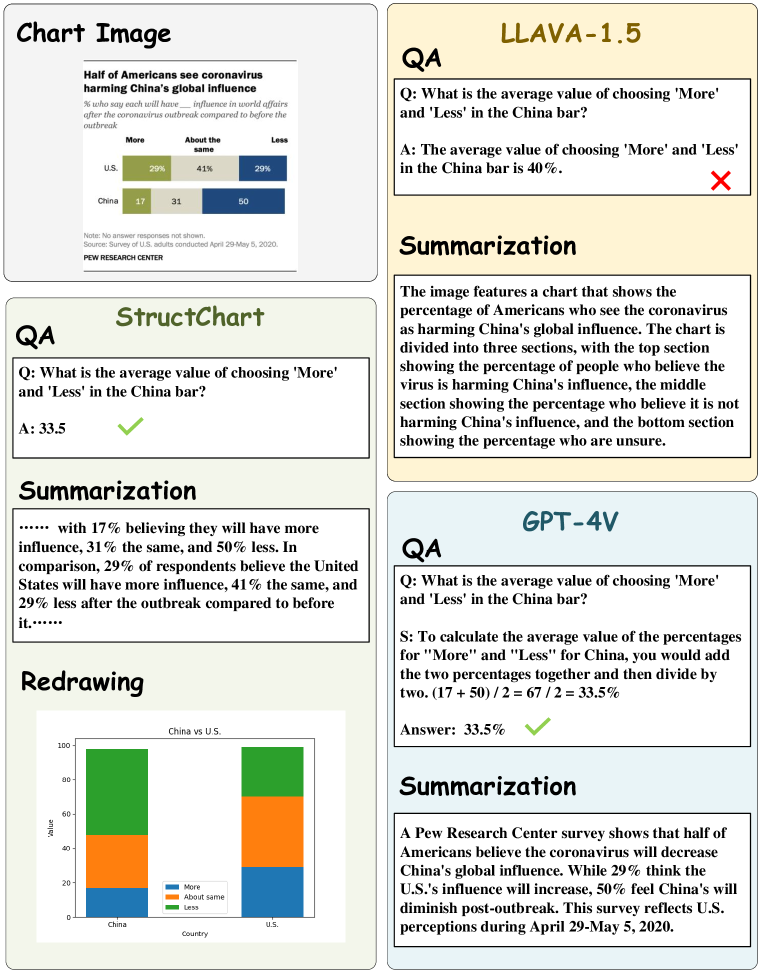
For Summarization and Redrawing Tasks, due to the lack of public datasets and annotations, it is difficult to provide quantitative results. Thus we present qualitative results by employing different intermediate representations (LCT and STR) in Appendix H, which further shows that the STR has a stronger ability to represent chart information and help chart understanding. More comparisons with other general vision language models (i.e. GPT-4V (OpenAI, 2023) and LLaVA-1.5 (Liu et al., 2023)) on downstream tasks are shown in Figs. 13, 14 and 15 of Appendix I.
5 Conclusion and Outlook
This work has addressed the task of extracting and understanding the structured information from a visual chart. We propose a plot-to-triplet transformation to achieve objectivity and precision for chart perception. Besides, we leverage the LLM to generate more query data and drawing codes to enhance the generalization ability under practical settings e.g. few-shot chart perception, chart redrawing, and question answering. For future work, we may seek an end-to-end framework with our techniques, which is still an open question.
References
- Brown et al. (2020) Tom B. Brown, Benjamin Mann, Nick Ryder, Melanie Subbiah, Jared Kaplan, Prafulla Dhariwal, Arvind Neelakantan, Pranav Shyam, Girish Sastry, Amanda Askell, Sandhini Agarwal, Ariel Herbert-Voss, Gretchen Krueger, Tom Henighan, Rewon Child, Aditya Ramesh, Daniel M. Ziegler, Jeffrey Wu, Clemens Winter, Christopher Hesse, Mark Chen, Eric Sigler, Mateusz Litwin, Scott Gray, Benjamin Chess, Jack Clark, Christopher Berner, Sam McCandlish, Alec Radford, Ilya Sutskever, and Dario Amodei. Language models are few-shot learners. In Proceedings of the 34th International Conference on Neural Information Processing Systems, volume 33, pp. 1877–1901, 2020.
- Chen et al. (2022a) Wenhu Chen, Xueguang Ma, Xinyi Wang, and William W. Cohen. Program of thoughts prompting: Disentangling computation from reasoning for numerical reasoning tasks. ArXiv, abs/2211.12588, 2022a.
- Chen et al. (2022b) Xi Chen, Xiao Wang, Soravit Changpinyo, A. J. Piergiovanni, Piotr Padlewski, Daniel M. Salz, Sebastian Goodman, Adam Grycner, Basil Mustafa, Lucas Beyer, Alexander Kolesnikov, Joan Puigcerver, Nan Ding, Keran Rong, Hassan Akbari, Gaurav Mishra, Linting Xue, Ashish V. Thapliyal, James Bradbury, Weicheng Kuo, Mojtaba Seyedhosseini, Chao Jia, Burcu Karagol Ayan, Carlos Riquelme, Andreas Steiner, Anelia Angelova, Xiaohua Zhai, Neil Houlsby, and Radu Soricut. Pali: A jointly-scaled multilingual language-image model. ArXiv, abs/2209.06794, 2022b.
- Cho et al. (2021) Jaemin Cho, Jie Lei, Hao Tan, and Mohit Bansal. Unifying vision-and-language tasks via text generation. ArXiv, abs/2102.02779, 2021.
- Choi et al. (2019) Jinho Choi, Sanghun Jung, Deok Gun Park, Jaegul Choo, and Niklas Elmqvist. Visualizing for the non‐visual: Enabling the visually impaired to use visualization. Computer Graphics Forum, 38, 2019.
- Chung et al. (2022) Hyung Won Chung, Le Hou, Shayne Longpre, Barret Zoph, Yi Tay, William Fedus, Eric Li, Xuezhi Wang, Mostafa Dehghani, Siddhartha Brahma, et al. Scaling instruction-finetuned language models. arXiv preprint arXiv:2210.11416, 2022.
- Dosovitskiy et al. (2020) Alexey Dosovitskiy, Lucas Beyer, Alexander Kolesnikov, Dirk Weissenborn, Xiaohua Zhai, Thomas Unterthiner, Mostafa Dehghani, Matthias Minderer, Georg Heigold, Sylvain Gelly, Jakob Uszkoreit, and Neil Houlsby. An image is worth 16x16 words: Transformers for image recognition at scale. ArXiv, abs/2010.11929, 2020.
- Fan et al. (2022) Hehe Fan, Xiaojun Chang, Wanyue Zhang, Yi Cheng, Ying Sun, and Mohan Kankanhalli. Self-supervised global-local structure modeling for point cloud domain adaptation with reliable voted pseudo labels. In Proceedings of the IEEE/CVF Conference on Computer Vision and Pattern Recognition, pp. 6377–6386, 2022.
- He et al. (2022) Kaiming He, Xinlei Chen, Saining Xie, Yanghao Li, Piotr Dollár, and Ross Girshick. Masked autoencoders are scalable vision learners. In Proceedings of the IEEE/CVF conference on computer vision and pattern recognition, pp. 16000–16009, 2022.
- Hegselmann et al. (2023) Stefan Hegselmann, Alejandro Buendia, Hunter Lang, Monica Agrawal, Xiaoyi Jiang, and David Sontag. Tabllm: Few-shot classification of tabular data with large language models. In International Conference on Artificial Intelligence and Statistics, pp. 5549–5581. PMLR, 2023.
- Herzig et al. (2020) Jonathan Herzig, Pawel Krzysztof Nowak, Thomas Müller, Francesco Piccinno, and Julian Martin Eisenschlos. Tapas: Weakly supervised table parsing via pre-training. In Annual Meeting of the Association for Computational Linguistics, 2020.
- Huang et al. (2021) Zhicheng Huang, Zhaoyang Zeng, Yupan Huang, Bei Liu, Dongmei Fu, and Jianlong Fu. Seeing out of the box: End-to-end pre-training for vision-language representation learning. 2021 IEEE/CVF Conference on Computer Vision and Pattern Recognition (CVPR), pp. 12971–12980, 2021.
- Huo et al. (2021) Yuqi Huo, Manli Zhang, Guangzhen Liu, Haoyu Lu, Yizhao Gao, Guoxing Yang, Jing Wen, Heng Zhang, Baogui Xu, Weihao Zheng, Zongzheng Xi, Yueqian Yang, Anwen Hu, Jinming Zhao, Ruichen Li, Yida Zhao, Liang Zhang, Yuqing Song, Xin Hong, Wanqing Cui, Danyang Hou, Yingyan Li, Junyi Li, Peiyu Liu, Zheng Gong, Chu Jin, Yuchong Sun, Shizhe Chen, Zhiwu Lu, Zhicheng Dou, Qin Jin, Yanyan Lan, Wayne Xin Zhao, Ruihua Song, and Ji rong Wen. Wenlan: Bridging vision and language by large-scale multi-modal pre-training. ArXiv, abs/2103.06561, 2021.
- Jia et al. (2021) Chao Jia, Yinfei Yang, Ye Xia, Yi-Ting Chen, Zarana Parekh, Hieu Pham, Quoc V. Le, Yun-Hsuan Sung, Zhen Li, and Tom Duerig. Scaling up visual and vision-language representation learning with noisy text supervision. In International Conference on Machine Learning, 2021.
- Kahou et al. (2017) Samira Ebrahimi Kahou, Adam Atkinson, Vincent Michalski, Ákos Kádár, Adam Trischler, and Yoshua Bengio. Figureqa: An annotated figure dataset for visual reasoning. ArXiv, abs/1710.07300, 2017.
- Kim et al. (2021) Wonjae Kim, Bokyung Son, and Ildoo Kim. Vilt: Vision-and-language transformer without convolution or region supervision. In International Conference on Machine Learning, 2021.
- Law & Deng (2018) Hei Law and Jia Deng. Cornernet: Detecting objects as paired keypoints. International Journal of Computer Vision, 128:642 – 656, 2018.
- Lee et al. (2022) Kenton Lee, Mandar Joshi, Iulia Turc, Hexiang Hu, Fangyu Liu, Julian Martin Eisenschlos, Urvashi Khandelwal, Peter Shaw, Ming-Wei Chang, and Kristina Toutanova. Pix2struct: Screenshot parsing as pretraining for visual language understanding. In Proceedings of the 40th International Conference on Machine Learning, 2022.
- Li et al. (2021a) Junnan Li, Ramprasaath R. Selvaraju, Akhilesh Deepak Gotmare, Shafiq R. Joty, Caiming Xiong, and Steven C. H. Hoi. Align before fuse: Vision and language representation learning with momentum distillation. In Neural Information Processing Systems, 2021a.
- Li et al. (2020) Wei Li, Can Gao, Guocheng Niu, Xinyan Xiao, Hao Liu, Jiachen Liu, Hua Wu, and Haifeng Wang. Unimo: Towards unified-modal understanding and generation via cross-modal contrastive learning. ArXiv, abs/2012.15409, 2020. URL https://api.semanticscholar.org/CorpusID:229924402.
- Li et al. (2022) Wei Li, Can Gao, Guocheng Niu, Xinyan Xiao, Hao Liu, Jiachen Liu, Hua Wu, and Haifeng Wang. Unimo-2: End-to-end unified vision-language grounded learning. ArXiv, abs/2203.09067, 2022. URL https://api.semanticscholar.org/CorpusID:247519008.
- Li et al. (2021b) Yangguang Li, Feng Liang, Lichen Zhao, Yufeng Cui, Wanli Ouyang, Jing Shao, Fengwei Yu, and Junjie Yan. Supervision exists everywhere: A data efficient contrastive language-image pre-training paradigm. ArXiv, abs/2110.05208, 2021b.
- Liu et al. (2022a) Fangyu Liu, Julian Martin Eisenschlos, Francesco Piccinno, Syrine Krichene, Chenxi Pang, Kenton Lee, Mandar Joshi, Wenhu Chen, Nigel Collier, and Yasemin Altun. Deplot: One-shot visual language reasoning by plot-to-table translation. ArXiv, abs/2212.10505, 2022a.
- Liu et al. (2022b) Fangyu Liu, Francesco Piccinno, Syrine Krichene, Chenxi Pang, Kenton Lee, Mandar Joshi, Yasemin Altun, Nigel Collier, and Julian Martin Eisenschlos. Matcha: Enhancing visual language pretraining with math reasoning and chart derendering. In Annual Meeting of the Association for Computational Linguistics, 2022b.
- Liu et al. (2023) Haotian Liu, Chunyuan Li, Qingyang Wu, and Yong Jae Lee. Visual instruction tuning. ArXiv, abs/2304.08485, 2023.
- Liu et al. (2019) Xiaoyi Liu, Diego Klabjan, and Patrick N. Bless. Data extraction from charts via single deep neural network. ArXiv, abs/1906.11906, 2019.
- Lu et al. (2019) Jiasen Lu, Dhruv Batra, Devi Parikh, and Stefan Lee. Vilbert: Pretraining task-agnostic visiolinguistic representations for vision-and-language tasks. In Neural Information Processing Systems, 2019.
- Luo et al. (2021) Junyu Luo, Zekun Li, Jinpeng Wang, and Chin-Yew Lin. Chartocr: Data extraction from charts images via a deep hybrid framework. 2021 IEEE Winter Conference on Applications of Computer Vision (WACV), pp. 1916–1924, 2021.
- Masry et al. (2022) Ahmed Masry, Xuan Long Do, Jia Qing Tan, Shafiq R. Joty, and Enamul Hoque. Chartqa: A benchmark for question answering about charts with visual and logical reasoning. ArXiv, abs/2203.10244, 2022.
- Methani et al. (2019) Nitesh Methani, Pritha Ganguly, Mitesh M. Khapra, and Pratyush Kumar. Plotqa: Reasoning over scientific plots. 2020 IEEE Winter Conference on Applications of Computer Vision (WACV), pp. 1516–1525, 2019.
- Nam et al. (2023) Jaehyun Nam, Jihoon Tack, Kyungmin Lee, Hankook Lee, and Jinwoo Shin. Stunt: Few-shot tabular learning with self-generated tasks from unlabeled tables. arXiv preprint arXiv:2303.00918, 2023.
- Obeid & Hoque (2020) Jason Obeid and Enamul Hoque. Chart-to-text: Generating natural language descriptions for charts by adapting the transformer model. ArXiv, abs/2010.09142, 2020.
- OpenAI (2023) OpenAI. Gpt-4 technical report. ArXiv, abs/2303.08774, 2023.
- Raffel et al. (2020) Colin Raffel, Noam Shazeer, Adam Roberts, Katherine Lee, Sharan Narang, Michael Matena, Yanqi Zhou, Wei Li, and Peter J Liu. Exploring the limits of transfer learning with a unified text-to-text transformer. The Journal of Machine Learning Research, 21(1):5485–5551, 2020.
- Rane et al. (2021) Chinmayee Rane, Seshasayee Mahadevan Subramanya, Devi Sandeep Endluri, Jian Wu, and C. Lee Giles. Chartreader: Automatic parsing of bar-plots. 2021 IEEE 22nd International Conference on Information Reuse and Integration for Data Science (IRI), pp. 318–325, 2021.
- Savva et al. (2011) Manolis Savva, Nicholas Kong, Arti Chhajta, Li Fei-Fei, Maneesh Agrawala, and Jeffrey Heer. Revision: automated classification, analysis and redesign of chart images. Proceedings of the 24th annual ACM symposium on User interface software and technology, 2011.
- Singh et al. (2021) Amanpreet Singh, Ronghang Hu, Vedanuj Goswami, Guillaume Couairon, Wojciech Galuba, Marcus Rohrbach, and Douwe Kiela. Flava: A foundational language and vision alignment model. 2022 IEEE/CVF Conference on Computer Vision and Pattern Recognition (CVPR), pp. 15617–15629, 2021.
- Su et al. (2019) Weijie Su, Xizhou Zhu, Yue Cao, Bin Li, Lewei Lu, Furu Wei, and Jifeng Dai. Vl-bert: Pre-training of generic visual-linguistic representations. ArXiv, abs/1908.08530, 2019.
- Ulmer et al. (2020) Dennis Ulmer, Lotta Meijerink, and Giovanni Cinà. Trust issues: Uncertainty estimation does not enable reliable ood detection on medical tabular data. In Machine Learning for Health, pp. 341–354. PMLR, 2020.
- Van der Maaten & Hinton (2008) Laurens Van der Maaten and Geoffrey Hinton. Visualizing data using t-sne. Journal of machine learning research, 9(11), 2008.
- Wang et al. (2022) Wenhui Wang, Hangbo Bao, Li Dong, and Furu Wei. Vlmo: Unified vision-language pre-training with mixture-of-modality-experts. In NeurIPS, 2022.
- Wang et al. (2021) Zirui Wang, Jiahui Yu, Adams Wei Yu, Zihang Dai, Yulia Tsvetkov, and Yuan Cao. Simvlm: Simple visual language model pretraining with weak supervision. ArXiv, abs/2108.10904, 2021.
- Wei et al. (2022) Jason Wei, Xuezhi Wang, Dale Schuurmans, Maarten Bosma, Ed Huai hsin Chi, F. Xia, Quoc Le, and Denny Zhou. Chain of thought prompting elicits reasoning in large language models. ArXiv, abs/2201.11903, 2022.
- Xue et al. (2021) Hongwei Xue, Yupan Huang, Bei Liu, Houwen Peng, Jianlong Fu, Houqiang Li, and Jiebo Luo. Probing inter-modality: Visual parsing with self-attention for vision-language pre-training. In Neural Information Processing Systems, 2021.
Appendix A Related Works on Vision Language Pre-trained Models (VLPMs)
Here, we also discuss related works on Vision Language Pre-trained Models (VLPMs). According to the way of aggregating information from different modalities, VLPMs can be categorized into fusion-encoder based, dual-encoder based, and combination based models.
Fusion-encoder based VLPMs take text embeddings and image features as input and involve several fusion approaches to model Vision Languate (VL) interaction. VL-BERT (Su et al., 2019), UNIMO (Li et al., 2020; 2022), SOHO (Huang et al., 2021), VL-T5 (Cho et al., 2021), SimVLM (Wang et al., 2021), and ViLT (Kim et al., 2021) assume that the potential correlation and alignment between modalities can be learned by a single transformer encoder. Thus, the text embeddings and image features are concatenated with additional embeddings that indicate position and modalities, and fed into a transformer-based encoder. Further, ViLBERT (Lu et al., 2019), Visual Parsing (Xue et al., 2021), ALBEF (Li et al., 2021a), and WenLan (Huo et al., 2021) adopt a cross-attention mechanism to model the interaction between VL modalities, where the query vectors originate from one modality and the key and value vectors from the other. Typical pre-training tasks for fusion-encoder based VLPMs include: masked language/vision modeling, image-text matching, masked region classification, masked region feature regression, visual grounding, visual question answering, and grounded captioning. Thus, fusion-encoder based VLPMs can be effective in VL understanding downstream tasks.
Dual-encoder based VLPMs utilize two individual single-modal encoders to encode each modality separately, then convert the image and text embeddings into the same semantic space to calculate the VL similarity scores. CLIP (Cho et al., 2021), ALIGN (Jia et al., 2021) and DeCLIP (Li et al., 2021b) leverage large-scale image-text pairs to learn transferable visual representations for retrieval tasks and exhibit surprising zero-shot transfer to image classification tasks.
Combination based VLPMs combine the benefits of fusion-encoder based and dual-encoder based architectures. FLAVA (Singh et al., 2021) firstly utilizes a dual-encoder to acquire single-modal representations. Then, the single-modal embeddings are processed by a fusion-encoder to obtain cross-modal representations. VLMo (Wang et al., 2022) introduces a novel approach called Mixture-of-Modality Expert (MoME), combining a dual-encoder and a fusion-encoder into one unified framework, which can be fine-tuned on both VL understanding and image-text retrieval tasks.
Appendix B Detailed Explanation of Matching Process between Prediction and Ground Truth
Prediction results and Ground Truth (GT) are both in the form of STR, which is a set of tuples . The complete matching process for these two sets is as follows:
As mentioned in 3.2, we firstly query whether each tuple in GT set has a matching tuple in prediction set. Specifically, for two Entity strings in each tuple, we reorder them according to the following pre-process: 1) lowercase all characters in Entity strings; 2) the two Entity strings in each Tuple are sorted by the ASCII of the first letter; 3) if the ASCII of the first letter is the same, the second letter is compared, etc. After reordering, we concatenate the two Entity strings together and calculate the edit distance according to Eq. 3. Actually, and in Eq. 3 are both concatenated strings after reordering. For the value string, we convert it to floating-point and calculate the relative error according to Eq. 4. When the editing distance and relative error are less than the threshold, the two tuples (the prediction tuple and GT tuple) are matched. It should be noted that under different tolerance level, the threshold of edit distance and relative error are different for performing more comprehensive evaluation.
Then, we calculate the Intersection over Union () between prediction set and GT set according to Eq. 7 in the main text. If the calculated is larger than the preset threshold , the prediction and GT are matched. Also, the preset threshold here is variable for more flexible evaluation.
Appendix C Experimental Results and Empirical Analyses of Matcha and Deplot on QA Task
Matcha (Liu et al., 2022b) is an end-to-end model (without the help of GPT-3 or 3.5), and we cannot modify its reasoning module (including network design and language model selection) during the evaluation process. As a result, we only choose to directly compare with Matcha. Experimental results in Table 3 show that our StructChart has a 1.1% lead over Matcha (Liu et al., 2022b) in average accuracy.
However, Deplot (Liu et al., 2022a) applies Chain-of-Thought (CoT) (Wei et al., 2022), Program-of-Thought (PoT) (Chen et al., 2022a) and Self-Consistency (SC) (Fan et al., 2022) strategies to help the reasoning module boost the performance. Since we cannot access specific prompt designs in Deplot (Liu et al., 2022a), the fairness of result comparison on QA task cannot be guaranteed.
Appendix D QA results on FigureQA by StructChart and other methods
FigureQA (Kahou et al., 2017) is also a benchmark for chart understanding task. However, there are still some differences between FigureQA and the mentioned datasets (ChartQA, PlotQA and Chart2Text): 1) Overall, the images in FigureQA dataset are all simulated samples based on manual rules, while ChartQA and Chart2Text are sampled from real world. 2) For perception stage, ChartQA and Chart2Text provide annotations in CSV format for CIE task. But for FigureQA and PlotQA, we need to preprocess relatively complex retrieval from the raw annotation (JSON file). 3) For reasoning stage, the questions in FigureQA dataset are based on fifteen sentence patterns (e.g. ”Is X the minimum?”, ”Does X have the lowest value?”). And all the answer pairs are ”yes” or ”no”. In contrast, the mentioned datasets, such as ChartQA, PlotQA, use human-authored QA annotations. Besides, Chart2Text is designed for chart summarization task.
Appendix E LLM-based Self-inspection Data Production Scheme
The complete schematic simulation process can be divided into two stage, containing (1) Data simulation stage for label generation. (2) Image simulation stage for chart generation. We demonstrate two examples in Figs. 4 and 5.
| Data Simulation Stage |
|---|
| Prompt: |
| Copying the following table information can be expanded and adapted as appropriate, The imitation is as irrelevant as possible to the original text. |
| Input LCT data: |
| Year,It matters wins the really who presidential election,Things will be pretty much the same regardless of who is elected/n 2000,50,44/n |
| 2004,67,29/n |
| 2008,63,32/n |
| 2012,63,34/n |
| 2016,74,22/n |
| 2020,83,16 |
| Simulated LCT data (completed by GPT-3.5): |
| Year,People would be better off if the government would just stay out of it,People would be worse off if the government did not get involved/n |
| 2001,45,48/n |
| 2005,53,42/n |
| 2009,60,36/n |
| 2013,63,31/n |
| 2017,71,25/n |
| 2021,76,19 |
| Image Simulation Stage |
| Prompt: |
| Consider you are a professional Python grapher. |
| Please draw and save a chart based on the following data using python, and images must be clear and intuitive. |
| Choose a plot type that best suits the value, for example line, column, scatter and pie charts. |
| Drawing techniques such as background grids can be used. |
| Code generated by GPT3.5: |
| import matplotlib.pyplot as plt |
| data = [[2001, 45, 48],[2005, 53, 42],[2009, 6, 36],[2013, 63, 31],[2017, 71, 25],[2021, 76, 19]] year, better_off,worse_off = zip(*data) |
| fig,ax = plt.subplots(figsize=(15,7)) |
| ax.plot(year,better off,color=’green”,label-’People would be better off if the government would just stay out of it’) |
| ax.plot(year.worse off, color=’red’, label=’people would be worse off if the government did not get involved’) |
| ax.legend(loc=’upper left”,fontsize=12,ncol=2) |
| ax.set_xlabel(’Year’,fontsize=14) |
| ax.set_ylabel(”Number’,fontsize=14) |
| ax.set_title(’Government Involvement’, fontsize=14fontweight=’bold’) |
| ax.set_xticks(year) |
| plt.tight_layout() |
| plt.savefig(”34.png”,dpi-400) |
| plt.cla() |
| Chart image simulated: |
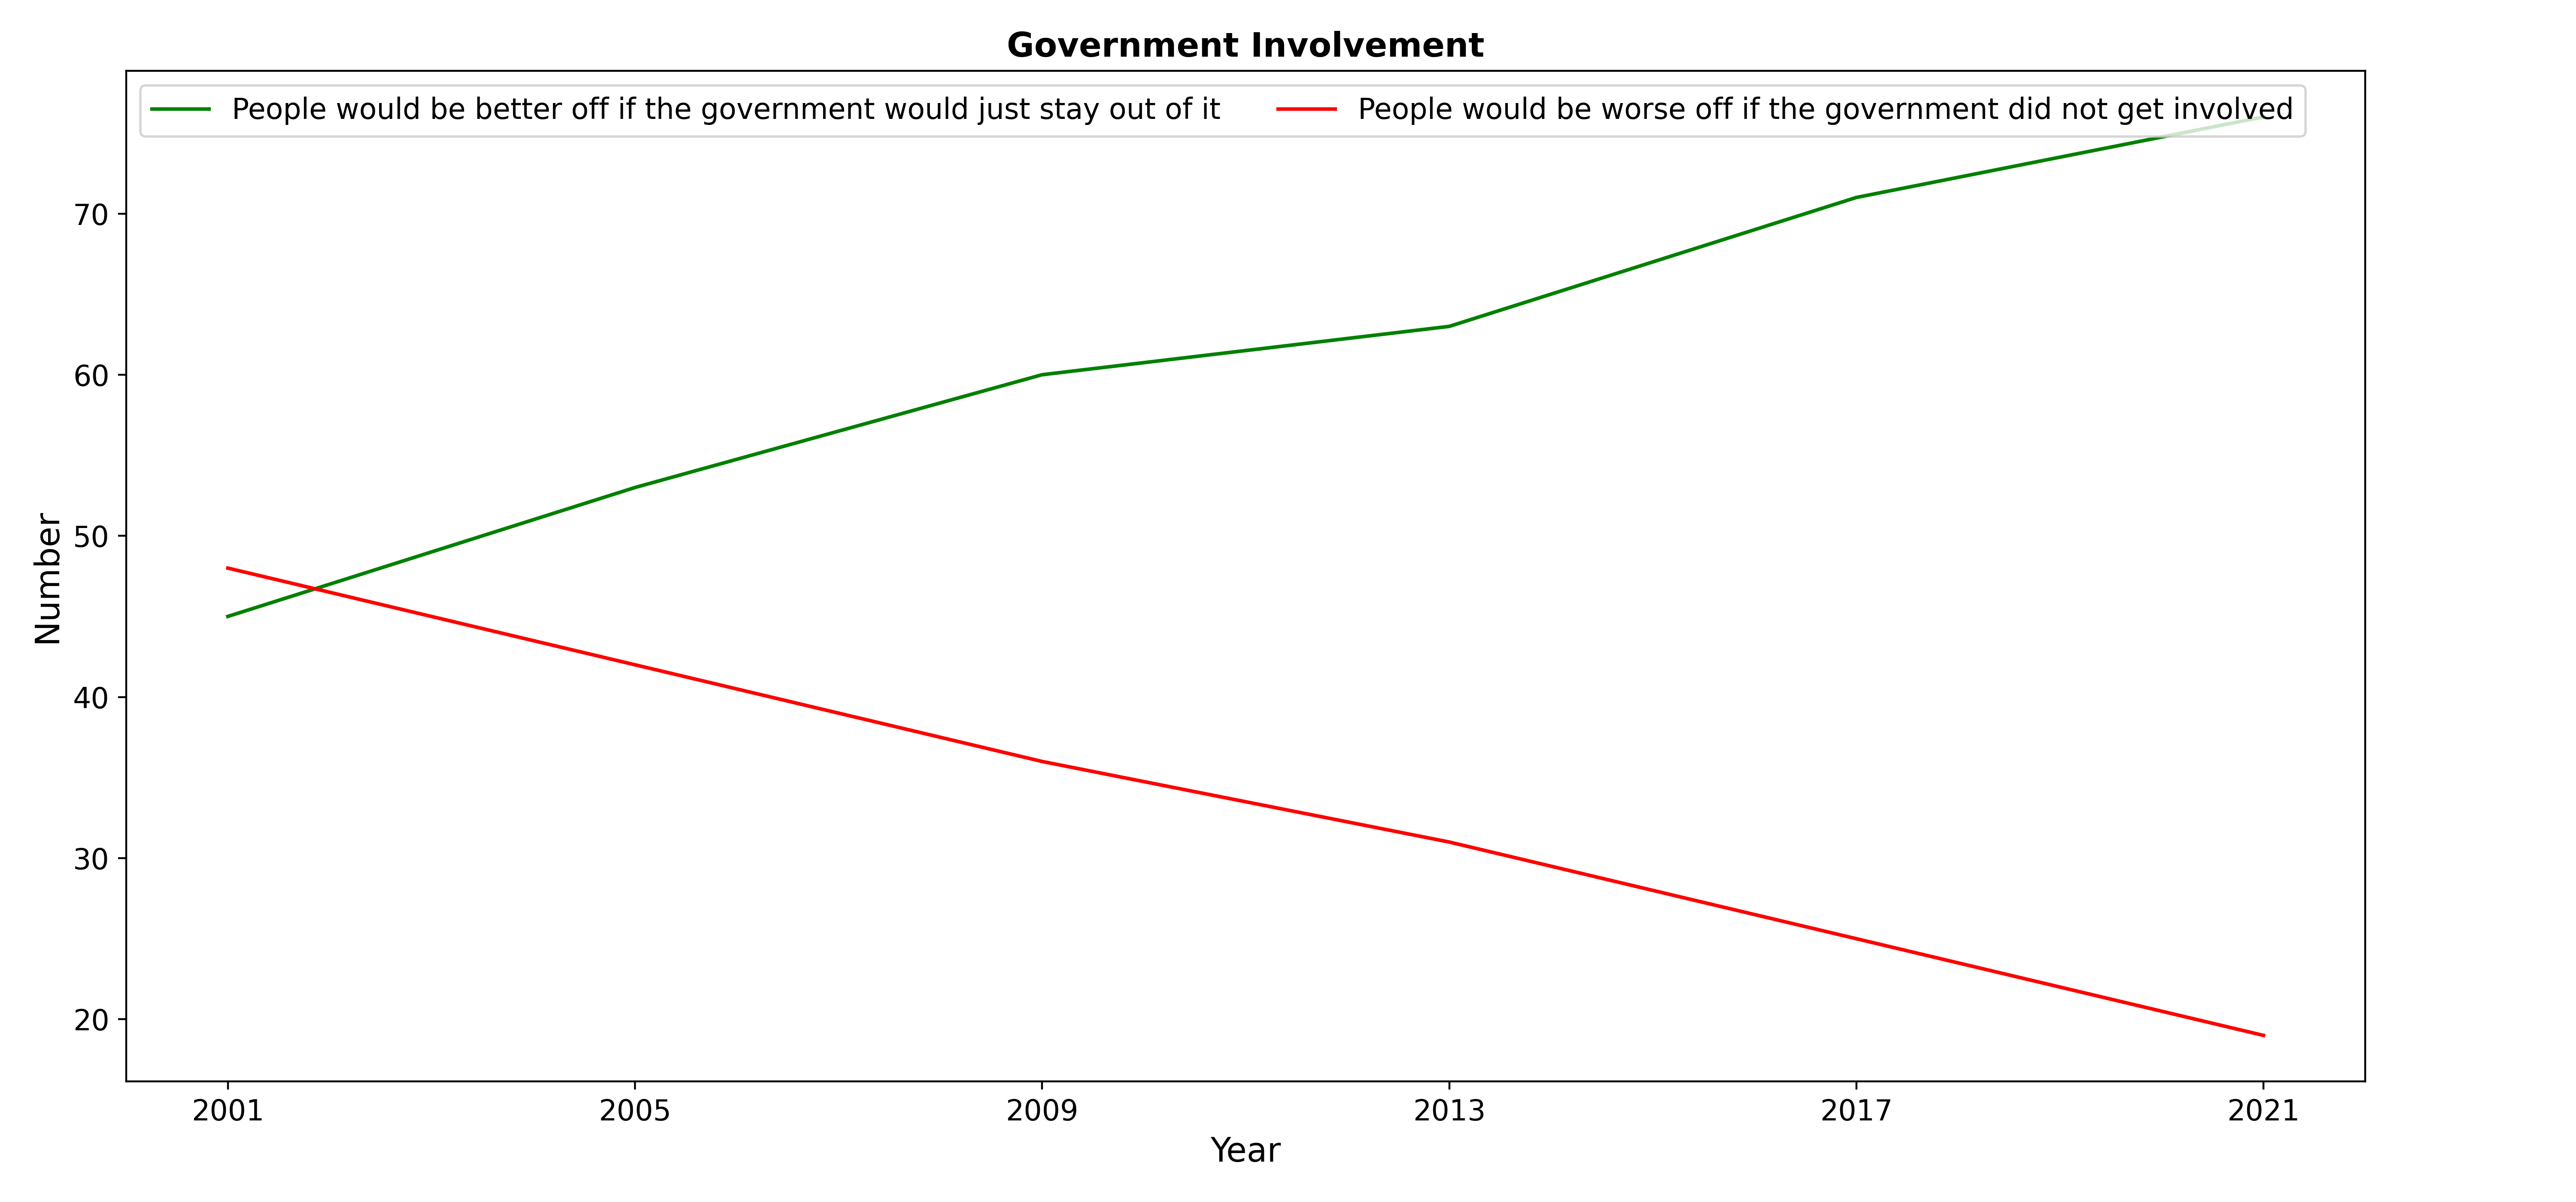
|
| Data Simulation Stage |
|---|
| Prompt: |
| Copying the following table information can be expanded and adapted as appropriate. The imitation is as irrelevant as possible to the original text. |
| Input LCT data: |
| Entity,Value/n |
| Have not heard of Latinx,76.0/n |
| Have not heard of Latinx,76.0/n |
| Do not use Latinx,20.0/n |
| Do not Latinx u,20.0/n |
| Simulated LCT data (completed by GPT-3.5): |
| Characteristic, Share of engineers/n |
| Very satisfied,48% /n |
| Satisfied,41% /n |
| Neither satisfied nor dissatisfied,7% /n |
| Dissatisfied,3% /n |
| Very dissatisfied,1% /n |
| Image Simulation Stage |
| Prompt: |
| Consider you are a professional Python grapher. |
| Please draw and save a chart based on the following data using python, and images must be clear and intuitive. |
| Choose a plot type that best suits the value, for example, line, column, scatter and pie charts. |
| Drawing techniques such as background grids can be used. |
| Code generated by GPT3.5: |
| import matplotlib.pyplot as plt |
| Char= [’Very Satisfied’, ’Satisfied’, ’Neither Satisfied not Dissatisfied’, ’Dissatisfied’, ’Very Dissatisfied’] |
| Share=[48, 41, 7, 3, 1] |
| plt.figure(figsize=(5,5)) |
| plt.pie(Share,labels=Char,autopct=’%1.2f%%’,textprops=’fontsize’: 10) |
| plt.title(’EngineersŚatisfaction Level’) |
| plt.tight_layout() |
| plt.savefig(’86.png’) |
| plt.cla() |
| Chart image simulated: |
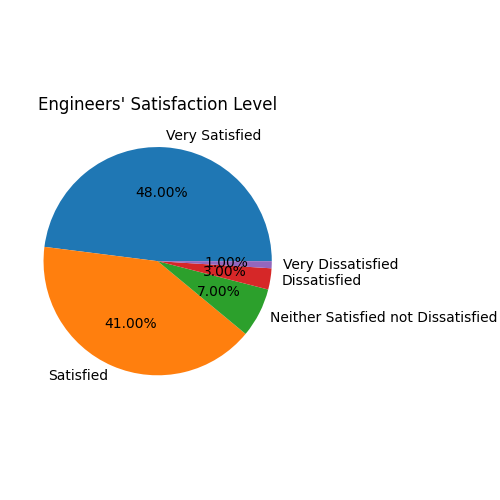
|
Appendix F Visualization Comparisons with Matcha and Deplot
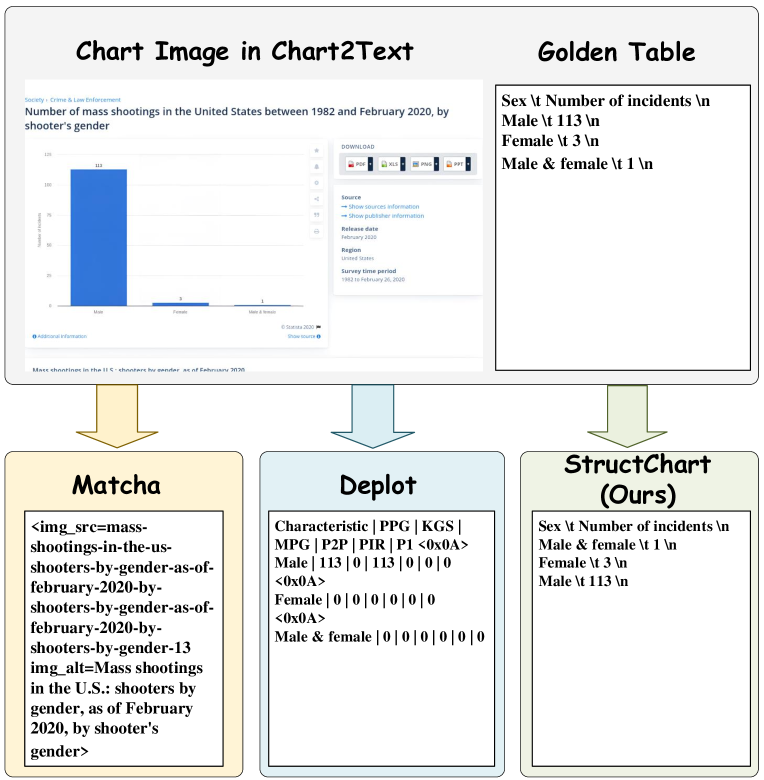
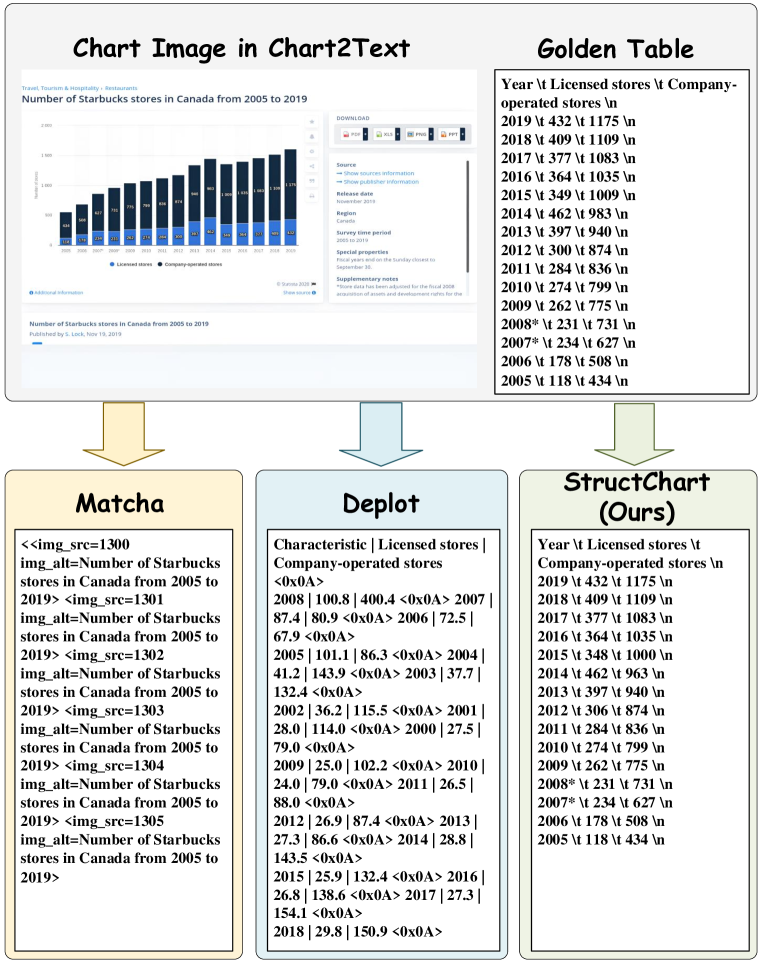
We compare the proposed Structchart with Matcha (Liu et al., 2022b) and Deplot (Liu et al., 2022a) in Chart Information Extraction (CIE) task in Figs. 6, 7 and 8. Matcha (Liu et al., 2022b) cannot perform CIE task and can only output the content in the form of HTML format during the pre-training phase, and Deplot (Liu et al., 2022a) is affected by noisy backgrounds (e.g. web page environment containing other irrelevant text). By comparison, our Structchart can extract accurate information of the chart from complicated background, such as information from the website.
Appendix G More Results of StructChart on Different Downstream Tasks
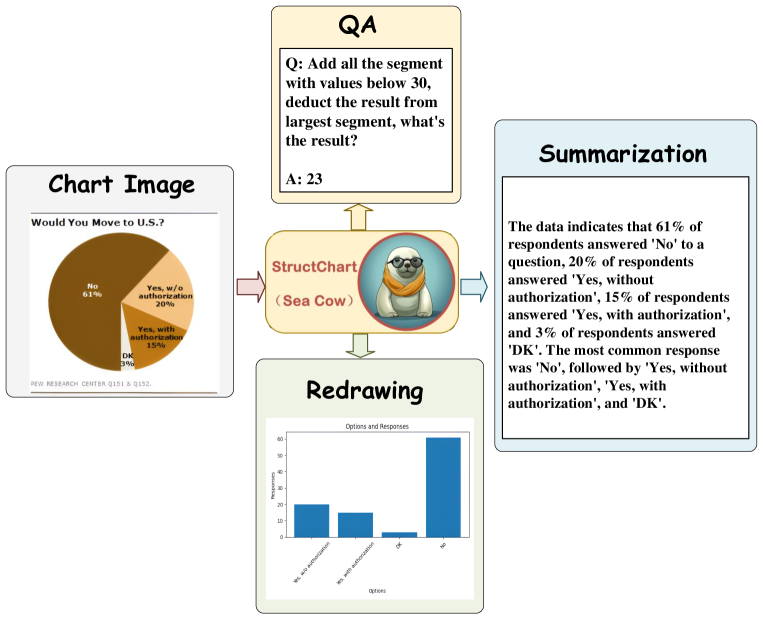
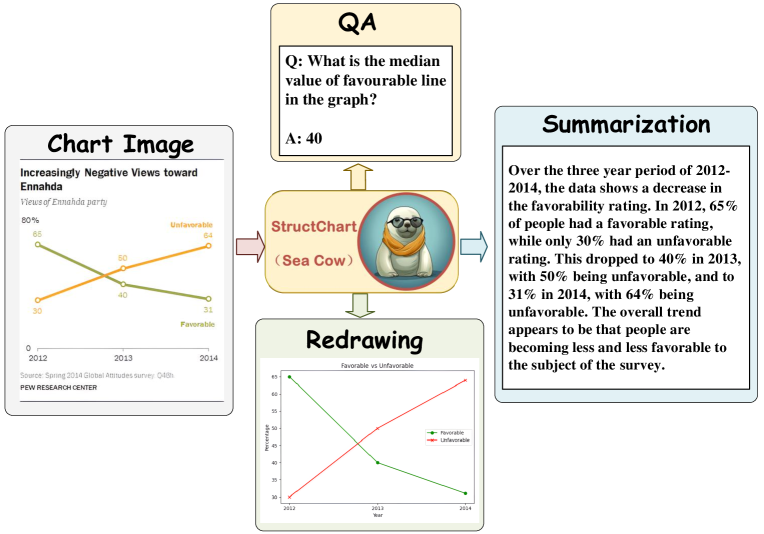
We visually demonstrate StructChart on downstream tasks in Figs. 9 and 10, including Question Answering (QA), summarization, and redrawing. For QA task, quantitative evaluation results are shown in Tab 3, and here, we further give many visualization results. For summarization task, some open-ended summary descriptions can be conducted beyond the basic numeric description. For redrawing, different types of charts can be obtained by redrawing chart image given the statistical data (e.g., line chart bar chart, bar chart pie chart, etc.)
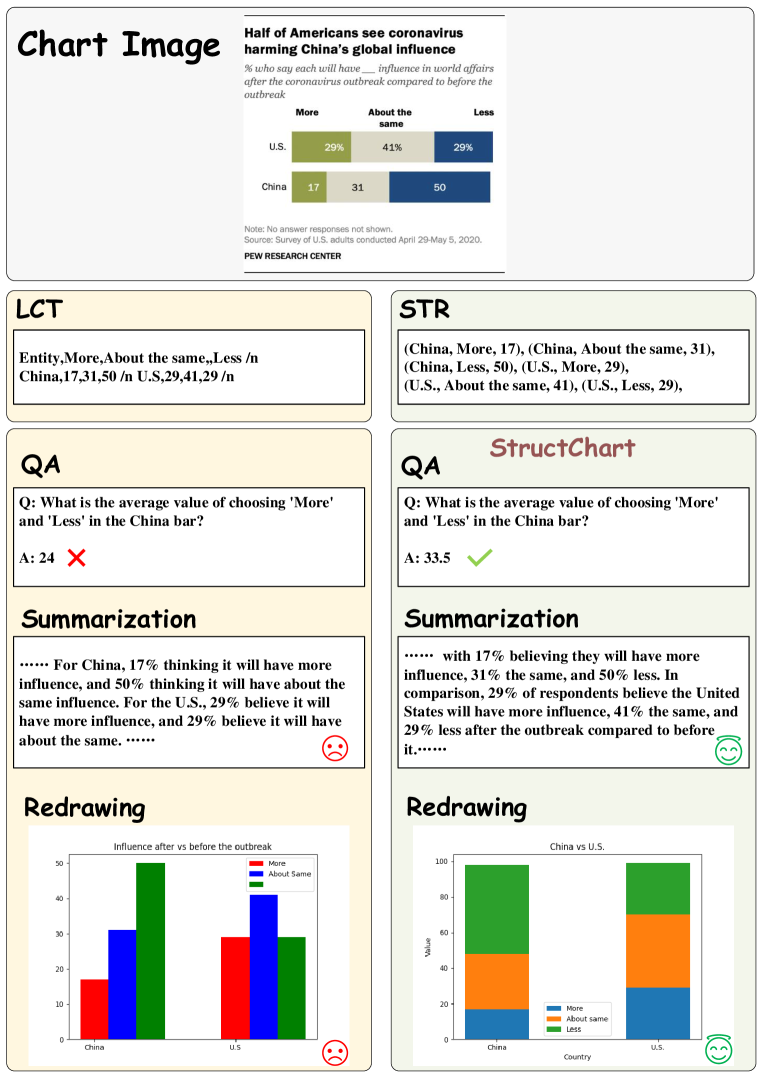
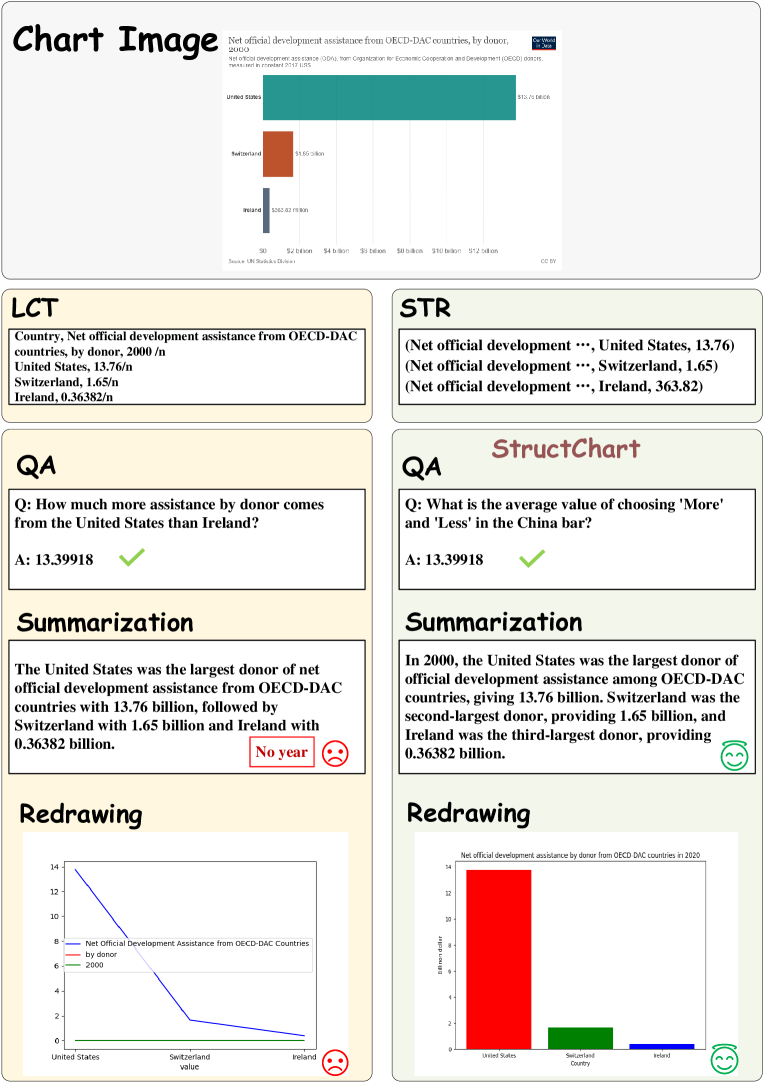
Appendix H Demonstrations on Downstream tasks with Linear CSV Tokens (LCT) v.s. Structured Triplet Representations (STR)
We respectively use Linear CSV Tokens (LCT) and Structured Triplet Representations (STR) as intermediate representations of chart information for different downstream tasks. Figs. 11 and 12 show that STR used in StructChart has better robustness compared to LCT. When noise is introduced into the highly position-sensitive LCT (a comma is introduced as noise as illustrated in Fig. 11, and separator comma itself is included as illustrated in Fig. 12), all downstream tasks will be affected negatively. By comparison, our StructChart achieves better performance on QA, summarization, and redrawing tasks, owing to the proposed STR.

Appendix I Comparisons with Other General Vision Language Models (VLM) on Downstream Tasks
We demonstrate three visualization comparisons among StrcutChart, GPT-4V (OpenAI, 2023) and LLaVA-1.5 (Liu et al., 2023) for downstream tasks in Figs. 13, 14 and 15. It is worth noting that for QA task, our StructChart is restricted to generating answers only in order to report the quantitative results on ChartQA dataset. From the visualization results, it can be seen that the proposed StructChart has a strong Chart-based reasoning ability, showing promising performance on multiple downstream tasks. Although GPT-4V (OpenAI, 2023) also has a strong performance, our model weights, training code, simulation code, and simulation dataset will all be open-sourced.
Appendix J Discussion About How To Obtain General Chart Large Model (CLM)
Here, we discuss one possible direction for training a Chart Large Model (CLM), which is challenging due to: (1) Scarce chart data covering as comprehensive scientific fields as possible; (2) Perception-reasoning task gap. This paper provides a preliminary attempt to tackle the above challenges. In the future, we intend to collect more chart data from different scientific subjects and perform the proposed LLM-based self-inspection data production scheme to enhance chart data diversity. This would be the foundation for training a general CLM with a large amount of simulated chart data which are rendered using real-world chart data from multiple fields.