[a]Connor Poggemann
Temporal and Spectral Analysis of 1ES 2344+514 in Two Flaring States Observed by VERITAS
Abstract
VERITAS observed the bright blazar 1ES 2344+514 during two flaring periods, one from Dec. 17 to Dec. 18, 2015 (MJD 57373-57374) with a peak flux of of the Crab and another from Nov. 28 to Dec. 3, 2021 (MJD 59546-59551) with a peak flux of of the Crab. This blazar, located at a redshift of , is classified as an extreme high-frequency-peaked BL Lacertae object (HBL). It is known to be variable, including several previous day-scale flares: Whipple on Dec. 20, 1995, VERITAS on Dec. 7, 2007, and MAGIC on Aug. 11, 2016. The VERITAS near-nightly monitoring of 1ES 2344+514 during the 2015-2016 and 2021-2022 seasons provides good coverage of the pre- and post-flare flux as well as the rise/fall time of the flares. We present the multiwavelength light curves of each flare as well as the very high-energy spectra in the two flare states and the two pre-flare states.
1 Introduction
The blazar 1ES 2344+514 is highly variable and has been classified as an extreme high-frequency-peaked blazar (EHBL). It is located at a redshift of [1] with coordinates RA: 23h 47’ 04.836715" and Dec: +51d 42’ 17.88123" (J2000) [2]. The low redshift and the inverse-Compton peak at very-high energy (VHE) contribute to its observed brightness by imaging atmospheric Cherenkov telescopes (IACT). The Whipple collaboration published its discovery in 1998 [3]. This was the 3rd blazar detected at energies above 300 GeV, after Markarian 421 and Markarian 501.
Flares from 1ES 2344+514 have been frequently detected at VHE. Whipple observed a flare on December 20, 1995 with an integral flux of (E > 350 GeV) 63% of the Crab Nebula flux [3]. VERITAS observed a flare on December 7, 2007 with an integral flux of (E > 300 GeV) 48% of the Crab Nebula flux [4]. MAGIC observed a flare on August 11, 2016 with an integral flux of (E > 300 GeV) 55% of the Crab Nebula flux [5]. Due to its brightness and activity, 1ES 2344+514 is an ideal laboratory to observe high energy radiation and test multiwavelength models.
VERITAS observed 1ES 2344+514 regularly between 2007 and the present. The observations between 2007-2015 showed significant variability of yearly average fluxes [6]. In this proceeding we report two flaring periods, one from December 17 to 18, 2015 (57373-57374 MJD) with a peak flux of of the Crab and another from November 28 to December 3, 2021 (59546-59551 MJD) with a peak flux of of the Crab. Extensive monitoring of the source provides good coverage of the pre- and post-flare flux as well as the rise/fall time of the flares. We present the analysis of the light curves and spectra of each flare.
2 VERITAS Observations
The Very Energetic Radiation Imaging Telescope Array System (VERITAS) is a ground-based instrument at the Fred Lawrence Whipple Observatory (FLWO) in Arizona, USA. The array uses four 12-m imaging Cherenkov telescopes each mounted with a 499 photomultiplier tube camera. VERITAS is sensitive to VHE (100 GeV - 10 TeV) particle showers in the atmosphere. Its energy resolution is approximately , and its angular resolution is approximately at 1 TeV [7, 8].
VERITAS observed 1ES 2344+514 for a total of 11 hours during the 2015-16 season (7283-57375 MJD). Observations totaled 17 hours during the 2021-22 season (59486-59581 MJD). This data was taken under the VERITAS blazar monitoring campaign with the intent to record long-term quality baseline spectra as well as detect flares, should they occur.
The air showers were reconstructed using the Image-Template Method [8] followed by a gamma-ray event selection. The selection criteria were optimized on the Crab Nebula scaled to 1% of its nominal strength. Source event candidates were selected in a circular "on" region of radius . Average background events were determined from multiple reflected "off" regions chosen with the same offset from the center of the camera as the on-region [9]. The background events in the on-region were estimated using the ratio of the "on" and "off" angular areas, . We found 635 "on" events and 1670 "off" events with an of 0.06035, resulting in a peak significance of during the 2015-16 season. During the 2021-22 season, we found 342 "on" events and 2092 "off" events with an of 0.05969, resulting in a peak significance of .
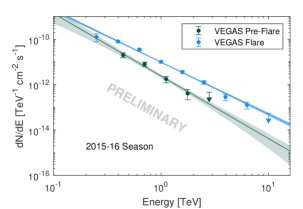
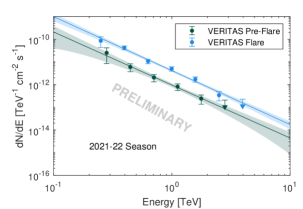
Time-averaged spectra are shown in Figure 1. Two spectra are shown for each season, split into pre-flare and flare data (57373-57374 MJD and 59546-59551 MJD). They are well modeled by a power-law. Table 1 lists the fitted parameter values. The analysis was performed in two custom VERITAS packages to confirm results and excellent agreement was found between them.
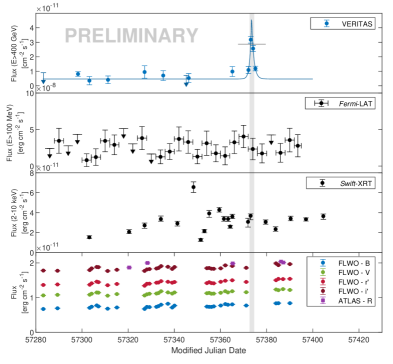
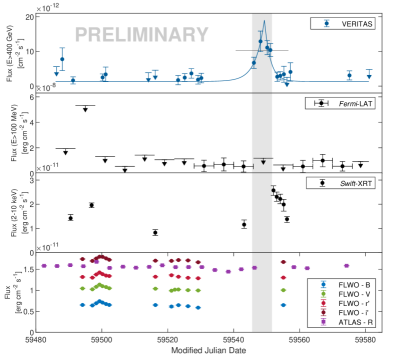
The daily integrated fluxes are shown as light curves for each season in Figure 2 and Figure 3. The VERITAS light curves show clear evidence of flaring above the energy threshold of 400 GeV. In each case, the light curves have good quality baselines prior to flares and extended observations during flaring periods. The 2015-16 season has a pre-flare significance of and a significance during the flare. The 2021-22 season has a pre-flare significance of and a significance during the flare.
| [TeV-1 cm-2 s-1] | DOF | |||
|---|---|---|---|---|
| 2015 Pre-Flare | 0.7 | 2 | ||
| 2015 Flare | 1.9 | 6 | ||
| 2021 Pre-Flare | 0.1 | 3 | ||
| 2021 Flare | 0.8 | 4 |
3 Multiwavelength Observation
3.1 Fermi-LAT Observations
NASA’s Fermi Large Area Telescope (Fermi-LAT) is a space telescope that is sensitive to gamma rays at energies over MeV. Contemporaneous Fermi-LAT data (57284-57395 MJD and 59487-59581 MJD) were reduced using fermipy (v1.1.6, and ScienceTools v2.2.0) with the Pass-8 (P8R3_SOURCE_V3) instrument response functions [10]. The data was filtered as follows. Events from the “Source” class (evclass=128) and from both the front and back (evtype=3) between 100 MeV and 1 TeV within a 15 degree radius of the source location were selected. The data was also then split into PSF event types of which there are 4, representing quartiles that are determined by the quality of the reconstructed photon direction. A zenith cut of was applied to remove contamination from the Earth’s limb. Another cut was applied to remove times when the Sun was within of the source. A binned likelihood analysis was performed on the events passing these criteria. The normalization of the sources within of the source were freed. All parameters of sources with test statistic (TS) above 10 were freed. The isotropic and Galactic diffuse components were freed. Fixed parameters were frozen to their 4FGL-DR3 (gll_psc_v28.xml) catalog values [11]. Each bin of the light curve has one free parameter — the normalization of the source. The light curves for each season are shown in Figures 2 and 3. No evidence of flaring is observed during either VERITAS flare.
3.2 Swift-XRT Observations
The Neil Gehrels Swift Observatory (Swift) [12] is a space-based observatory, with an X-ray Telescope (Swift-XRT [13]) sensitive to X-rays in the 0.3-10 keV range. Contemporaneous observations taken by Swift-XRT (57303-57397 MJD and 59490-59556 MJD) were reprocessed using the HEAsoft (v6.31.1) software package. The XRT observations were cleaned and calibrated using xrtpipeline ([14], v0.13.7).
Observations were taken in the window timing (WT) and photon counting (PC) modes and corrected for pile-up using the methods described in [15]. A circular "on" region centered on 1ES 2344+514 with a radius of 20 pixels (), corresponding to 90% containment of the point spread function of a 1.5 keV photon, was used. For PC mode observations, an annular background region with a and inner and outer radius, respectively, centered on 1ES 2344+514 was used. For WT mode an annular background with 80 pixel and 100 pixel inner and outer radius was used to ensure a background size of 20 pixel. The BACKSCAL parameter was appropriately adjusted using the grppha command.
Data were grouped using the grppha command such that bad channels were excluded, events outside of the 0.3-10 keV range were excluded and changes were grouped together to ensure a minimum of 20 counts per bin to allow for -based fitting. Ancillary response files were generated using the xrtmkarf protocol.
Each observation was fit with a deabsorbed power law model (phabs * power-law), with the neutral hydrogen column density (NH1) frozen to the value measured by the HI 4 Pi survey [16] of . This fit was performed using the PyXSpec interface to the XSpec package (v12.13.0.c). The integral flux in the 2-10 keV band for each season are shown in Figures 2 and 3. Variability is generally observed throughout the light curves. The tail of the flare is observed in Figure 3 because the VERITAS veritas flare triggered Swift observations.
3.3 Optical Observations
Optical observations were collected by the FLWO 1.2-m telescope [17] and the Asteroid Terrestrial-impact Last Alert System (ATLAS) project [18, 19]. ATLAS is a high-cadence all-sky survey system of four telescopes located in Hawaii, Chile, and South Africa. Contemporanteous FLWO observations (57283-57390 MJD and 59494-59555 MJD) were taken in Harris B, Harris V, SDSS r′, SDSS i′ filters. The contemporanteous ATLAS observations were taken through an R-filter (57320-57387 MJD and 59482-59574 MJD). In both cases an automated pipeline was run to reduce the data using aperture photometry and nearby stars were used to estimate the systematic uncertainty in the magnitudes. The daily integrated fluxes are shown in Figures 2 and 3.
4 Results and Discussion
Our light curves for each season are shown in Figures 2 and 3. The VERITAS light curves show clear evidence of flaring above the energy threshold of 400 GeV. Interestingly, there is no evidence of simultaneous flaring in the Fermi-LAT or optical light energy bands. Because of the VERITAS flare in 2021-22, Swift-XRT observations were scheduled, and they show the relaxation of a flare within the energy range 2-10 keV. The Swift-XRT observation of the 2015-16 flare is early in the flare and does not show evidence of flaring. We note, however, that Swift-XRT generally shows variability throughout both seasons.
For both seasons, the VERITAS light curves were modeled by a time-dependent flux defined by
| (1) |
where is the peak flux, identifies the time of the flare, characterizes the duration of heating and cooling periods, and is the baseline non-flaring flux. The fitted parameters are presented in Table 2. The average measured flux was 6.1 and 7.6 times higher than that of the fitted baseline flux in 2015-16 and 2021-22, respectively. The baseline flux of 2015-16 is 4 times larger than that of 2021-22, showing significant variability between seasons.
| DOF | |||||||
|---|---|---|---|---|---|---|---|
| MJD | cm-2s | [day] | [day] | cm-2s | |||
| 2.0 | 8 | ||||||
| 1.5 | 18 |
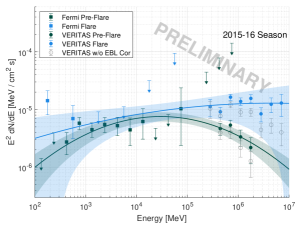
Our combined spectral energy distribution (SED) for 2015-16 is shown in Figure 4 for the pre-flare and flare time periods. All VERITAS data are corrected for attenuation by the extragalactic background light (EBL) [20]. For reference, the uncorrected spectral measurements are also included in the plot. Both pre-flare and flare fluxes are fit with a log-parabola model defined by , where is the flux at the normalization energy , is the spectral index, and is the parameter of curvature. The values of these fitted model parameters are given in Table 3. Interestingly, the flare and pre-flare butterflies overlap in the Fermi-LAT energy range. This implies that there was no flare at these energies, in agreement with the Fermi-LAT light curve shown in Figure 2.
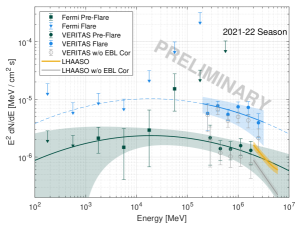
Our combined SED for 2021-22 is shown in Figure 4 for the pre-flare and flare time periods. VERITAS fluxes and the LHAASO [21] power-law spectrum are corrected for EBL attenuation [20]. As before, pre-flare spectral measurements of VERITAS and Fermi-LAT were fit to a log-parabola model and the fitted parameters are reported in Table 3. The 2021-22 LHASSO measurement is in good agreement with the pre-flare fit in Table 3. Due to low statistics at Fermi-LAT energies, the pre-flare parameters were re-normalized to the flaring VERITAS fluxes. The shows good agreement with the VERITAS fluxes. Fermi-LAT did not see flaring during this period, so the most likely model during the flare should fall between these two fits.
| DOF | |||||
| MeV-1 cm-2 s-1 | |||||
| 2015 Pre-Flare | 0.95 | 11 | |||
| 2015 Flare | 2.1 | 7 | |||
| 2021 Pre-Flare | 0.4 | 6 | |||
| 2021 Flare | 0.8 | 5 |
5 Summary
VERITAS observations of 1ES 2344+514 in the 2015-16 and 2021-22 seasons show strong evidence of flaring behavior at very high energies. Swift-XRT observations caught the end of the 2021-22 flare. Interestingly, Fermi-LAT does not show flaring, potentially limited by short timescale sensitivity. A full study of the synchrotron self-Compton modeling for 1ES 2344+514 will be discussed in a future VERITAS publication.
6 Acknowledgements
This research is supported by grants from the U.S. Department of Energy Office of Science, the U.S. National Science Foundation and the Smithsonian Institution, by NSERC in Canada, and by the Helmholtz Association in Germany. This research used resources provided by the Open Science Grid, which is supported by the National Science Foundation and the U.S. Department of Energy’s Office of Science, and resources of the National Energy Research Scientific Computing Center (NERSC), a U.S. Department of Energy Office of Science User Facility operated under Contract No. DE-AC02-05CH11231. We acknowledge the excellent work of the technical support staff at the Fred Lawrence Whipple Observatory and at the collaborating institutions in the construction and operation of the instrument.
C. Poggemann is generously supported by the William and Linda Frost Fund through the Bailey College of Science and Mathematics at the California Polytechnic State University, San Luis Obispo.
References
- [1] E. S. Perlman, et al., ApJS, 104, 251 (1996).
- [2] L. Petrov et al., AJ, 136(2), 580 (2008).
- [3] M. Catanese et al., ApJ, 501(2), 616 (1998).
- [4] V. A. Acciari, et al. (VERITAS Collaboration), ApJ, 738(2), 169 (2011).
- [5] V. A. Acciari, et al. (MAGIC Collaboration), MNRAS, 496(3), 3912 (2020).
- [6] C. Allen, et al. (VERITAS Collaboration), MNRAS, 471(2), 2117 (2017).
- [7] J. Holder, et al., Astroparticle Physics, 25, 391 (2006).
- [8] J. Christiansen for the VERITAS Collaboration. ICRC2017 proceedings, 301, 789 (2017).
- [9] D. Berge, S. Funk, & J. Hinton, A&A, 466, 1219 (2007).
- [10] P. Bruel, et al., arXiv e-prints, arXiv:1810.11394 (2018).
- [11] S. Abdollahi, et al., ApJS, 247(1), 33 (2020).
- [12] N. Gehrels, et al., ApJ, 611(2), 1005 (2004).
- [13] D. N. Burrows, et al., SSR, 120(3-4), 165 (2005).
-
[14]
M. Capalbi, et al., 2005. Hosted by NASA at
https://swift.gsfc.nasa.gov/analysis/xrt_swguide_v1_2.pdf. - [15] A. Moretti, et al., SPIE Conference Series, 5165, 232 (2004).
- [16] N. B. Bekhti, et al. (HI4PI Collaboration), AAP, 594, A116 (2016).
- [17] A. H. Szentgyorgyi, et al., AAS Meeting, 207, 110.10 (2005).
- [18] J. L. Tonry, et al., PASP, 130(988), 064505 (2018).
- [19] A. N. Heinze, et al., AJ, 156(5), 241 (2018).
- [20] A. Saldana-Lopez, et al., MNRAS, 507(4), 5144 (2021).
- [21] Z. Cao, et al., arXiv e-prints, arXiv:2305.17030 (2023).
Full Author List: VERITAS Collaboration
A. Acharyya1,
C. B. Adams2,
A. Archer3,
P. Bangale4,
J. T. Bartkoske5,
P. Batista6,
W. Benbow7,
J. L. Christiansen8,
A. J. Chromey7,
A. Duerr5,
M. Errando9,
Q. Feng7,
G. M. Foote4,
L. Fortson10,
A. Furniss11,12,
W. Hanlon7,
O. Hervet12,
C. E. Hinrichs7,13,
J. Hoang12,
J. Holder4,
Z. Hughes9,
T. B. Humensky14,15,
W. Jin1,
M. N. Johnson12,
M. Kertzman3,
M. Kherlakian6,
D. Kieda5,
T. K. Kleiner6,
N. Korzoun4,
S. Kumar14,
M. J. Lang16,
M. Lundy17,
G. Maier6,
C. E McGrath18,
M. J. Millard19,
C. L. Mooney4,
P. Moriarty16,
R. Mukherjee20,
S. O’Brien17,21,
R. A. Ong22,
N. Park23,
C. Poggemann8,
M. Pohl24,6,
E. Pueschel6,
J. Quinn18,
P. L. Rabinowitz9,
K. Ragan17,
P. T. Reynolds25,
D. Ribeiro10,
E. Roache7,
J. L. Ryan22,
I. Sadeh6,
L. Saha7,
M. Santander1,
G. H. Sembroski26,
R. Shang20,
M. Splettstoesser12,
A. K. Talluri10,
J. V. Tucci27,
V. V. Vassiliev22,
A. Weinstein28,
D. A. Williams12,
S. L. Wong17,
and
J. Woo29
1Department of Physics and Astronomy, University of Alabama, Tuscaloosa, AL 35487, USA
2Physics Department, Columbia University, New York, NY 10027, USA
3Department of Physics and Astronomy, DePauw University, Greencastle, IN 46135-0037, USA
4Department of Physics and Astronomy and the Bartol Research Institute, University of Delaware, Newark, DE 19716, USA
5Department of Physics and Astronomy, University of Utah, Salt Lake City, UT 84112, USA
6DESY, Platanenallee 6, 15738 Zeuthen, Germany
7Center for Astrophysics Harvard & Smithsonian, Cambridge, MA 02138, USA
8Physics Department, California Polytechnic State University, San Luis Obispo, CA 94307, USA
9Department of Physics, Washington University, St. Louis, MO 63130, USA
10School of Physics and Astronomy, University of Minnesota, Minneapolis, MN 55455, USA
11Department of Physics, California State University - East Bay, Hayward, CA 94542, USA
12Santa Cruz Institute for Particle Physics and Department of Physics, University of California, Santa Cruz, CA 95064, USA
13Department of Physics and Astronomy, Dartmouth College, 6127 Wilder Laboratory, Hanover, NH 03755 USA
14Department of Physics, University of Maryland, College Park, MD, USA
15NASA GSFC, Greenbelt, MD 20771, USA
16School of Natural Sciences, University of Galway, University Road, Galway, H91 TK33, Ireland
17Physics Department, McGill University, Montreal, QC H3A 2T8, Canada
18School of Physics, University College Dublin, Belfield, Dublin 4, Ireland
19Department of Physics and Astronomy, University of Iowa, Van Allen Hall, Iowa City, IA 52242, USA
20Department of Physics and Astronomy, Barnard College, Columbia University, NY 10027, USA
21 Arthur B. McDonald Canadian Astroparticle Physics Research Institute, 64 Bader Lane, Queen’s University, Kingston, ON Canada, K7L 3N6
22Department of Physics and Astronomy, University of California, Los Angeles, CA 90095, USA
23Department of Physics, Engineering Physics and Astronomy, Queen’s University, Kingston, ON K7L 3N6, Canada
24Institute of Physics and Astronomy, University of Potsdam, 14476 Potsdam-Golm, Germany
25Department of Physical Sciences, Munster Technological University, Bishopstown, Cork, T12 P928, Ireland
26Department of Physics and Astronomy, Purdue University, West Lafayette, IN 47907, USA
27Department of Physics, Indiana University-Purdue University Indianapolis, Indianapolis, IN 46202, USA
28Department of Physics and Astronomy, Iowa State University, Ames, IA 50011, USA
29Columbia Astrophysics Laboratory, Columbia University, New York, NY 10027, USA