How Do Analysts Understand and Verify AI-Assisted Data Analyses?
Abstract.
Data analysis is challenging as it requires synthesizing domain knowledge, statistical expertise, and programming skills. Assistants powered by large language models (LLMs), such as ChatGPT, can assist analysts by translating natural language instructions into code. However, AI-assistant responses and analysis code can be misaligned with the analyst’s intent or be seemingly correct but lead to incorrect conclusions Therefore, validating AI assistance is crucial and challenging. Here, we explore how analysts across a range of backgrounds and expertise understand and verify the correctness of AI-generated analyses. We develop a design probe that allows analysts to pursue diverse verification workflows using natural language explanations, code, visualizations, inspecting data tables, and performing common data operations. Through a qualitative user study (n=22) using this probe, we uncover common patterns of verification workflows influenced by analysts’ programming, analysis, and AI backgrounds. Additionally, we highlight open challenges and opportunities for improving future AI analysis assistant experiences.
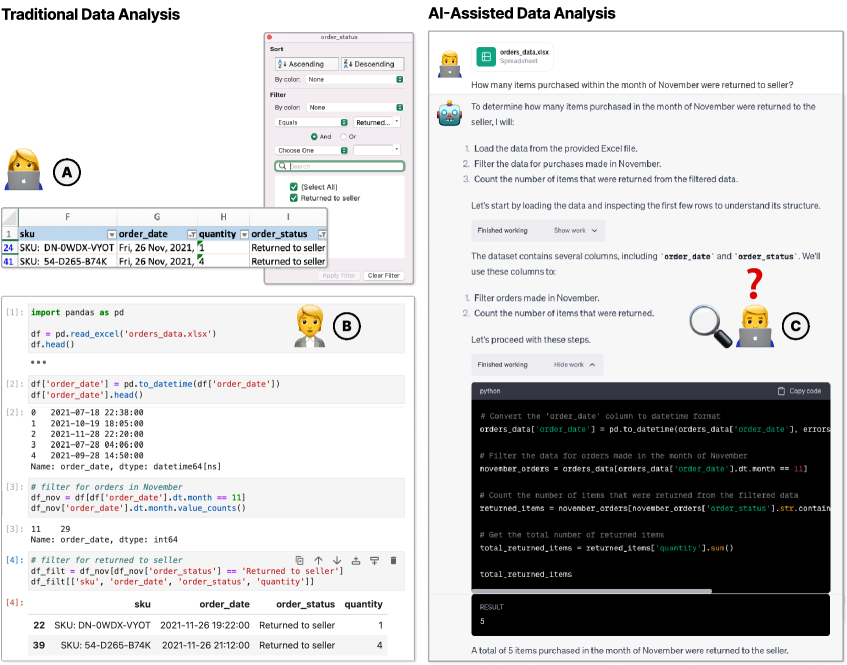
Three images labelled A, B, and C show the screenshots of the the data analysis tools with one title Traditional Data Analysis on the left and another title AI-Assisted Data Analysis on the right. Image A shows the partial interface of working with spreadsheets. Image B shows the partial interface of jupyter notebook with the data analysis process. Image C shows the chatbot interface between a user and an AI assistant where the user asks a question and the AI produces the data analysis output. All three images are labelled with emojis of different people.
1. Introduction
Data analysis is challenging as practitioners must synthesize domain knowledge with computational expertise to draw reliable conclusions. For practitioners, computational challenges may act as a barrier to exploring alternative and valid analysis decisions, and therefore conducting robust analyses (Liu et al., 2020, 2019).
Improved capabilities of Large Language Models (LLMs) for general (Chen et al., 2021; Bubeck et al., 2023; Chowdhery et al., 2022), data science (Lai et al., 2022; Yin et al., 2022; Chandel et al., 2022), and visualization (Dibia, 2023) programming tasks suggest LLM-based analysis assistants as a promising solution, enabling data analysts to execute and automate their analyses. Given the widespread deployment of assistants such as OpenAI’s Code Interpreter (OpenAI, 2023a), there is an emerging paradigm in how analysts perform analyses. Rather than formulate the exact transformations and operations in an analysis, analysts specify their analysis question through a natural language intent (Fig. 1 right) (Liu et al., 2023b). The AI assistant then performs the analysis task, writes code to understand the data, makes the necessary data transformations, and interprets the results. Since many analysis tasks are time-consuming (Chattopadhyay et al., 2020; Kandogan et al., 2014; Kandel et al., 2012; Liu et al., 2020), even for analysts well-versed in programming, natural language interactions can be more efficient especially when abstraction of the intent is possible. Furthermore, this natural language communication can broaden the usability of AI analysis tools, making them accessible even for analysts who are non-expert programmers (Ragavan et al., 2022).
Yet, a significant challenge remains. AI-based assistants, while powerful, can misinterpret user intentions (see Fig. 1) (Liang et al., 2023; Xu et al., 2021; Jiang et al., 2022) or make seemingly correct erroneous outputs (Bender et al., 2021; Ji et al., 2022). Since misinterpretations is inherent in the flexibility of natural language communication (Liu et al., 2023b; Ragavan et al., 2022; Setlur and Tory, 2022), errors from existing AI-based assistants are likely to persist no matter what the underlying LLM is. Moreover, because conclusions from data analyses often inform high-impact decisions in science (Baker, 2016; Aarts et al., 2015), business (Kandel et al., 2012; Kim et al., 2018, 2016), and government (Hardy and Maurushat, 2017; Ubaldi, 2013), it is important for users of AI-based analysis assistants to critically reflect on the assistant’s outputs (Ragavan et al., 2022). In this new paradigm, analysts’ focus now shifts from writing and validating their own analyses to understanding and evaluating the analyses generated by AI assistants (Liang et al., 2023). This can be challenging as existing AI assistants lack verification support (Ragavan et al., 2022; Sarkar et al., 2022) and even experts can be susceptible to automation bias and overreliance (Wickens et al., 2015; Parasuraman and Manzey, 2010).
Recent work in the HCI community explored ways to provide the user with a better understanding of LLM-generated outputs, including those from AI-based code assistants (Sun et al., 2022; Vasconcelos et al., 2023). However, these studies focus only on programmers and not the specific domain of data analysis, missing a significant portion of data analysts (Crisan et al., 2020; Liu et al., 2020). Since data analysis involves iteratively making sense of the underlying data (Koesten et al., 2019; Pirolli, 2007; Klein et al., 2007), analysts must juggle their mental model of the data in addition to their understanding of the AI’s procedure. There is limited insight into how analysts with different programming skills and computational reasoning abilities go about this process. Current code assistants such as Open AI’s Code Interpreter (OpenAI, 2023a) present these steps in natural language, Python code, code comments, and code execution outputs. It is unclear to what extent these interface affordances are helpful and how analysts use these different sources of information for accessing the correctness of AI-generated analyses.
In this work, we build on the perspective of recent works in Human-Centered Explainable AI (HCXAI) (Ehsan and Riedl, 2021; Liao et al., 2020, 2021; Kim et al., 2022) in that users’ needs to understand AI-generated outputs are dependent on their backgrounds, social, and organizational contexts; we focus on data analysts as they perform AI-assisted analyses. We study the verification processes of analysts, how different backgrounds can impact analysts’ approaches, and opportunities for tool designers to improve this process. We aim to guide the design of AI assistants that empower analysts to critically reflect on AI-generated outputs.
To explore analysts’ behaviors and design opportunities, we developed a prototype interface that not only included the AI’s code, code comments, and natural language explanation but also additional interactive data tables and summary visualizations (Sec. 4). This design accommodated a broad spectrum of potential artifacts that analysts may employ during verification, facilitating the observation of naturally emerging workflows. Analysts could access intermediary data tables that let them filter, search, and sort for values to explore the data and verify the AI-generated output. Using this tool as a probe, we conducted a qualitative study with 22 professional analysts (Sec. 5). We asked participants to verify AI-generated analyses to analysis queries written by data scientists on a diverse set of real-world datasets (Yin et al., 2022).
We find analysts followed two prevailing workflows: one that is procedure-oriented (answering “what did the AI do?”), and another that is data-oriented (answering “does the data make sense?”). Notably, we observed analysts frequently oscillated between workflows and shifted their behavioral patterns when they noticed issues in the AI-generated output (Table 4). Likewise, data artifacts (i.e., the data tables and summary visualizations) were often vital as secondary support in procedure-oriented workflows, and vice versa for procedure artifacts (i.e., the natural language explanation and code/code comments) (Fig. 5).
Based on these findings (Sec. 6), we make recommendations to end-user analysts interacting with AI-based analysis assistants (Sec. 7.1). Additionally, we outline three design implications for system designers to improve the verification experience (Sec. 7.2): encourage both procedure-oriented and data-oriented workflows, provide multiple ways to communicate data operations, and explicitly list the AI-generated analyses’ assumptions and interpretations.
This paper contributes the following:
-
(1)
Findings from a user study using our design probe that uncover common workflow patterns in the verification process of AI-generated analyses,
-
(2)
A set of implications for end-user analysts interested in AI-assisted data analysis, paired with design implications for tool builders to improve the verification process.
2. Motivating Example
To illustrate the potential errors and workflows in AI-assisted analyses, we compare three hypothetical analysts working on the same analysis question (Fig. 1). This scenario highlights the workflow differences between traditional and AI-assisted data analysis. Jane, Kate, and Alex are data analysts at a company that sells products on a popular e-commerce platform. They want to assess how many products may have quality control issues as the year drawes to a close. Specifically, they want to find out how many distinct products bought in November were later returned. To perform this analysis, they have a dataset of product orders where each row is a unique order for a product and its associated order status. The dataset contains the following key columns:
-
•
order_date: the date which the order was placed
-
•
sku: a unique identified for the product
-
•
quantity: the number of units of the product ordered
-
•
order_status: indicating whether the order was Delivered to Buyer or Returned to Seller
Traditional Data Analysis. Jane uses a spreadsheet for her analysis (Fig. 1A). She explores the dataset in her spreadsheet tool. After grasping its structure, she zeros in on the task. She uses the speadsheet’s interface to filter the order_date column for the month of November and the order_status column for Delivered to Buyer. She sees that there are two rows left, indicating two unique products were ordered in November and returned to the seller.
In contrast, Kate opts to use computational notebooks for data analysis, employing Python code to investigate the analysis question (Fig. 1B). She writes code to read the dataset and to understand the data. She then writes code to filter the order_date column for the month of November and the order_status column for Delivered to Buyer. In this workflow, she validates her operations by writing code to get a quick sense of the intermediate data produced. Like Jane, Kate arrives at the same conclusion.
Throughout this process, Jane and Kate are actively engaged in the data and operations, giving them confidence in the correctness of their conclusion.
AI-Assisted Data Analysis. Alex, meanwhile, decides to leverage an AI analysis assistant for help. He uploads the dataset and writes a natural language prompt: How many items purchased within the month of November were returned to seller?
The AI assistant writes and executes code to read the dataset. Next, it performs the analysis task, writing and running code before arriving at a final answer of 5. During this, the AI assistant also explains its steps in natural language. Because Alex was not directly involved in the analysis, he needs to validate its answer by inspecting the AI-generated output (Fig. 1C). He reads over the AI’s natural language explanation of its procedure and skims the code briefly. Without fully understanding the code, he deems the answer to be correct.
However, upon comparing his answer with Jane’s and Kate’s, Alex realizes the AI made a mistake. Looking through the intermediate data in Kate’s work, Alex realizes the AI assistant calculated the number of units returned rather than the number of unique products returned.
The errors in AI-assisted data analysis are subtle and require the analyst to carefully scrutinize the AI’s procedure and associated data involved. Additionally, current AI assistants do not facilitate the exploration of data along with the AI’s code and natural language explanation, thereby constricting analysts’ verification workflows. Further, it is unclear how analysts go about the verification process. Therefore, this paper seeks to understand analysts’ workflows and identify opportunities to improve the verification process.
3. Background and Related Work
3.1. AI-Based Tools for Data Science Execution
AI-based code assistants can enable analysts to conduct analyses as end-user programmers (Liu et al., 2023b; Ko et al., 2011). With tools such as Github Copilot and ChatGPT, analysts’ intent specified through natural language can be more expressive and approachable than those conveyed in domain-specific programming languages (DeLine, 2021; Gulwani and Marron, 2014). Given the excitement around the potential of AI-supported natural language programming, there is a growing body of research in the usability of these tools (Sarkar et al., 2022; Liang et al., 2023; Vaithilingam et al., 2022; Baker, 2016). These works focus on programmer experiences with AI-based code assistants and find common challenges in comprehending and verifying the AI-generated code (Liang et al., 2023; Vaithilingam et al., 2022; Sarkar et al., 2022).
Here, we build on prior work and study the verification challenges for data analysts as end-user programmers (Ko et al., 2011). Compared to software engineering, data analysis is more exploratory and iterative (Kery and Myers, 2017; Pirolli, 2007; Liu et al., 2019; Rule et al., 2018) as code is not the deliverable but the outcome of the analysis (Epperson et al., 2022; Kandel et al., 2012). Importantly, making sense of the data is an integral part of data analysis (Pirolli, 2007; Russell et al., 1993; Grolemund and Wickham, 2014; Koesten et al., 2019). Our work observes how analysts’ data sensemaking behaviors interplay with their verification of AI-generated analyses.
AI-based analysis assistants have also received great attention. Prior work explored the design of analytical chatbots (Zhi and Metoyer, 2020; Kassel and Rohs, 2018; Hoon et al., 2019) such as what should the responses be from such an assistant (Setlur and Tory, 2022) and how analysts can request, specify, and refine assistance (Mcnutt et al., 2023). Given the attention and promise, these assistants have been integrated into popular analysis environments such as computational notebooks (Perry and Mallick, 2023) and spreadsheets (Stallbaumer, 2023), and released as standalone systems (Dibia, 2023; Unknown, 2023). In contrast, we examine these tools from the perspective of supporting analysts’ understanding and verification of AI-generated analyses. In particular, we contribute the first user study towards understanding the workflows and challenges associated in the verification process.
3.2. Understanding and Verifying Processes in Data Analysis
Prior work found data scientists often compare conclusions with prior analyses and existing data (Kim et al., 2016; Liu et al., 2019). In this validation process, data scientists often need help managing, tracking, and comparing the iterative and messy nature of their computations (Kery et al., 2019, 2018; Head et al., 2019).
To support this, prior work helped analysts track changes in their code and executed outputs (Kery et al., 2019, 2017). Additionally, tools such as DITL (Wang et al., 2019), Datamations (Pu et al., 2021), and SOMNUS (Xiong et al., 2022) enabled analysts to see how their data changes throughout various data operations.
While existing research focuses on verifying human-written analyses, this paper explores the verification process for AI-generated analyses. As people form varying perceptions and trust of AI systems (Khadpe et al., 2020; Jung et al., 2022; Devito et al., 2018), there can be different behaviors when examining the work of AI-generated analyses. Understanding precisely analysts’ verification processes is important given the widespread deployment of such tools. Inspired by the designs in common data science tools, we build a design probe that provides analysts with a reasonable variety of artifacts and interactions to verify AI-generated outputs. Using our probe in a user study, we mimic a realistic verification experience, observe naturally occurring workflows, and elicit responses for preferred interactions.
3.3. Understanding and Verifying AI Outputs
Prior work on AI explainability centered around decision-support scenarios, where the AI’s prediction is limited to categorical variables (Adadi and Berrada, 2018; Guidotti et al., 2018; Linardatos et al., 2020). However, less is understood for generative AI, in which there can be multiple correct answers and each generation involves hundreds of individual token outputs (Vasconcelos et al., 2023).
More recently, the rise of generative LLMs motivated researchers to explore ways to make these models’ outputs and processes more interpretable (Sun et al., 2022). One way the HCI community explored this is by providing end-users with interactions to guide the input or output generation process (Louie et al., 2020; Ross et al., 2021; Zhang and Banovic, 2021). However, these methods largely focus on the AI’s internal representations which can be opaque, especially for non-technical users. In this paper, we align with prevailing viewpoints within the field of Human-Centered Explainable AI, emphasizing that the goal of understanding AI revolves around empowering individuals to fulfill their objectives (Ehsan and Riedl, 2021; Liao et al., 2020, 2021; Kim et al., 2022). It is important to design AI explainability with the target users and use cases in mind; in this work, we focus on data analysts performing AI-assisted data analyses. Through this lens, we view providing additional data artifacts such as intermediate data tables and summary visualizations as pivotal in enabling analysts’ understanding and verification processes.
Existing work in explainability for AI-based code assistants proposed different explainable AI (XAI) features to guide the programmer’s understanding of the model (Sun et al., 2022; Vasconcelos et al., 2023). In contrast, our work focuses on XAI features for data analysts. As data sensemaking is inherent in data analysis (Grolemund and Wickham, 2014; Koesten et al., 2019), we explore features that are less about understanding the inner workings of the AI’s algorithm (i.e., AI uncertainty and model attention) and more about following the AI’s data operations (e.g., via the natural language explanation and associated data tables).
We note that the process of understanding AI-generated outputs can involve additional follow-up and rewriting of prompt to the AI assistant (Liu et al., 2023b; Lakkaraju et al., 2022). In this work, we focus on the verification process and disentangle it from prompt writing. Since every new prompt elicits another response from the AI assistant, continuous interpretation and verification of AI-generated outputs is inevitable. Here, we zoom in on one turn of the verification process. A thorough grasp of the AI-generated output can enable analysts to address errors in immediate interactions and craft more effective prompts in future engagements. Processes such as abstraction matching (Liu et al., 2023b), prompt writing (Zamfirescu-Pereira et al., 2023), and repair of AI-generated programs (Olausson et al., 2023; Ashktorab et al., 2019) are related but distinct.
4. Method: Design Probe
In this work, we aim to study how analysts verify AI-generated analyses. In addition, we want to understand what types of design interventions may support their verification process. As a design probe (Boehner et al., 2007), we built a chatbot interface for data analysis similar to that of existing assistants. We chose to purpose-build our interface because existing assistants (e.g., Code Interpreter (OpenAI, 2023a)) focus on natural language, code, and execution outputs but less so on artifacts that help explain and explore the data operations in the AI-generated output. Our interface aims to provide additional features based on the potential needs of data analysts and elicit realistic workflows from data analysts of varying backgrounds.
Based this objective, we identify two design goals.
-
(1)
DG 1 - Interactions should support data sensemaking activities. Data analysts need to inspect the data (i.e., the data quality, format, columns, values etc.) and engage with the data (e.g., understanding relationships between columns, looking for outliers etc.) as part of data sensemaking activities (Koesten et al., 2019). Therefore, the tool should provide an interface and interactions that support these activities.
-
(2)
DG 2 - Approachable to analysts from different tool backgrounds. The main goal of our probe is to understand analysts’ processes. Because we are interested in analysts of various backgrounds, we want the tool to be approachable to a large audience. While certain features may benefit certain analysts, incorporating all features from existing data science tools could make the tool more complex and impede the actual verification process. With this in mind, the tool should include a range of artifacts commonly familiar to analysts, fostering natural verification workflows without a steep learning curve.
These design goals inform our decisions around the user interface and associated interactions. We take abstractions of modalities found in popular data science tools: the code, code comments, natural language explanations, data tables, and visualizations (jup, 2023; tab, 2023; rst, 2023; Drosos et al., 2020; Kery et al., 2020; Diamond-Reivich, 2020; Wu et al., 2020).
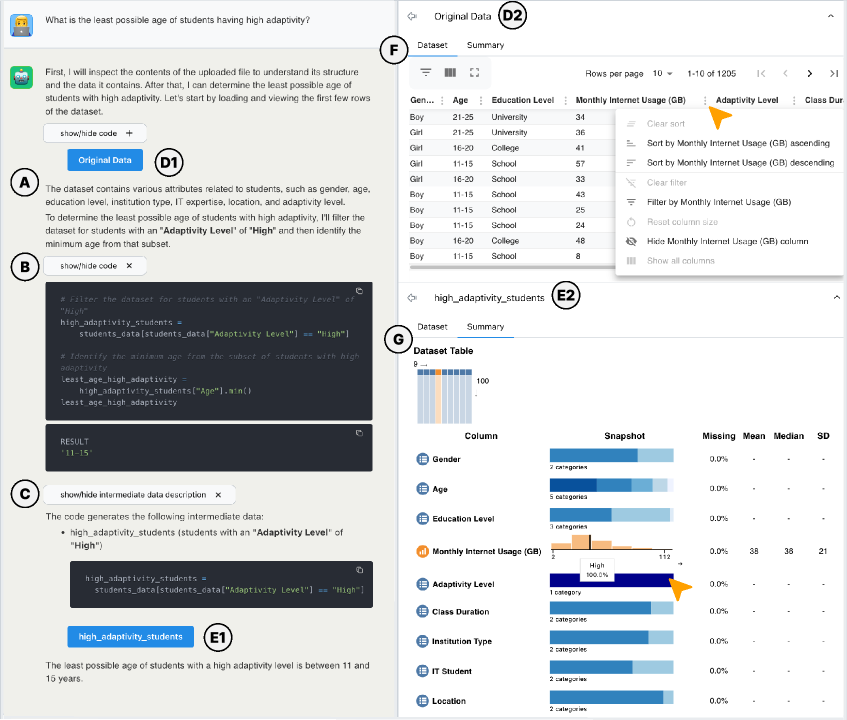
The screenshot of the Probe Interface web page with double column design. The page consists of two large main content areas with the chatbot interface on the left and the data tables displayed on the right. The screenshot is labeled with letters A to G that are used to describe the different features in the figure caption.
4.1. User Interface
We design our interface to follow a multi-panel design. The main panel shows the chat interface between the user and the assistant (Fig. 2 left). The user’s prompt and subsequent response from the assistant are shown. In the assistant’s response, following Code Interpreter (OpenAI, 2023a) and explanation practices recommended and found favorable in prior work (Lakkaraju et al., 2022; Sun et al., 2022; Drosos et al., 2020), we show the assistant’s natural language explanation of its procedure, associated code, code comments, and execution outputs (Fig. 2A and B). We interleave these together such that all artifacts are available at any time. In addition, because understanding the process of data manipulations is vital to understanding the output (Pu et al., 2021; Xiong et al., 2022), we include descriptions of any intermediate data computed as a result of an atomic data wrangling operation (Fig. 2C) (Xiong et al., 2022; Kasica et al., 2020).
We include a side data panel (Fig. 2 right) that allows analysts to view all relevant data in the AI-generated analysis. Having this as a side panel is helpful as it suggests the information is of global scope (Mcnutt et al., 2023). Additionally, by keeping the data separate from the AI-generated analysis, we minimize any interference to analysts following the AI’s procedure in the main panel.
In the side panel, each intermediate data table (i.e., results of intermediate calculations) that is part of the AI’s procedure is shown as a collapsible panel. Each collapsible panel includes the raw data table and a summary visualization of the table from (ObservableHQ, 2023). The summary visualization offers a quick visual summary of the overall table, the values and distribution of each column, and basic descriptive statistics.
4.2. User Interactions
In the main panel, we design interactions to to prioritize easy access to the full/high level abstraction of the procedure conveyed through the AI’s natural language explanation. Because code and tables can obstruct and interrupt this view, we make the code and intermediate data descriptions in the main panel initially hidden which users can reveal via a show/hidden button. Analysts can also access the side data panels within the flow of the AI’s explanation via in-context buttons which open and close the corresponding panel (Fig. 2E1 and E2).
In the side panel, analysts can perform basic operations on each table such as sorting columns and filtering rows based on specific values in the column(s). To support easy navigation between the data tables and the main panel, clicking on a data table scrolled the main panel to the corresponding context of that data table.
5. User Study
Using our probe, we conducted a lab study to more tangibly understand analysts’ verification processes of AI-generated analyses. Our goal was not to evaluate our specific interface but rather to understand workflows that emerge when verification artifacts are available.
Three research questions guide our study design and analysis.
-
•
RQ1 - Workflows: What workflows do analysts follow when analyzing data?
-
•
RQ2 - Artifacts: What artifacts and interactions do analysts use and need to support their workflows?
-
•
RQ3 - Effects of Background: How do the backgrounds of analysts impact their workflow and artifact usage?
A central study design decision was to prepare examples of errors and AI outputs a priori as opposed to having analysts interact directly with an AI assistant. This was motivated by a couple of reasons. First, by removing the variability of generative AI, we controlled for a consistent experience across participants, ensuring they all faced the same AI-generated mistakes. Second, we disentangled the process of crafting prompts for the AI (both initial and follow-up) from the process of comprehending the AI-generated outputs. Our design probe aimed to equip analysts with the essential tools such that their main focus remained on the verification of AI-generated analyses and not on prompt design.
| PID | Role | Exp. | Primary Analysis Tools | Analysis Frequency | Coding Comfort | Tasks Shown |
|---|---|---|---|---|---|---|
| P01 | Data Scientist | 6 Y | Code/Computational Notebooks | Daily | Very Comfortable | [T1, T2, T3] |
| P02 | Software Engineer | 4 Y | Data Visualization Tools | Daily | Very Comfortable | [T2, T3, T4] |
| P03 | Consultant | 26 Y | Spreadsheets | Daily | Somewhat Comfortable | [T7] |
| P04 | Data Analyst | 10 Y | Data Visualization Tools | Weekly | Somewhat Comfortable | [T5, T6, T7] |
| P05 | Software Engineer | 10 Y | Code/Computational Notebooks | Weekly | Very Comfortable | [T2, T3, T8] |
| P06 | Program Manager | 12 Y | Spreadsheets | Weekly | Very Comfortable | [T4, T7, T9] |
| P07 | Program Manager | 6 Y | Spreadsheets | Monthly | Neutral | [T1, T8, T10] |
| P08 | Software Engineer | 7 Y | Code/Computational Notebook | Weekly | Very Comfortable | [T5, T6, T7] |
| P09 | Program Manager | 3 Y | Spreadsheets | Daily | Neutral | [T9] |
| P10 | Tech. Strategist | 15 Y | Spreadsheets | Monthly | Neutral | [T4, T5, T6, T9] |
| P11 | Program Manager | 11 Y | Data Visualization Tools | Daily | Somewhat Comfortable | [T8, T9] |
| P12 | Program Manager | 5 Y | Spreadsheets | Daily | Neutral | [T2, T3, T7] |
| P13 | Cloud Architect | 5 Y | Spreadsheets | Daily | Somewhat Comfortable | [T9, T10] |
| P14 | Program Manager | 0.5 Y | Code/Computational Notebook | Weekly | Very Comfortable | [T5, T6] |
| P15 | Program Manager | 10 Y | Spreadsheets | Daily | Somewhat Comfortable | [T1, T4] |
| P16 | Program Manager | 15 Y | Spreadsheets | ¡ Monthly | Never Coded Before | [T7] |
| P17 | Software Engineer | 15 Y | Code/Computational Notebook | Weekly | Very Comfortable | [T5, T6] |
| P18 | Program Manager | 7 Y | Data Visualization Tools | Daily | Somewhat Comfortable | [T9] |
| P19 | Finance Manager | 13 Y | Spreadsheets | Daily | Neutral | [T8, T9] |
| P20 | Program Manager | 3 Y | Data Visualization Tools | Daily | Somewhat Comfortable | [T1, T6, T10] |
| P21 | Customer Manager | 8 Y | Spreadsheets | Daily | Very Comfortable | [T4, T9] |
| P22 | Architect | 5 Y | Code/Computational Notebook | Weekly | Very Comfortable | [T3, T8, T10] |
Participants. We recruited participants from a large data-driven software company and advertised an opportunity to work with AI-generated analyses. Participants were recruited via email based on data analysis interest groups and organization mailing lists. We selected participants with data analysis experience and a diversity of backgrounds, including how often they performed data analysis, the types of tools they used for analysis, and their self-reported comfort with programming (Table 1). Participants were compensated with a $30 USD Amex gift certificate.
| TID | Task Name | Natural Language Prompt | Issues With Respect to Analysis Query | PIDs |
|---|---|---|---|---|
| T0 (Suzan and Samrin, 2022) | Tutorial | What is the least possible age of students having high adaptivity? | AI misinterpreted the semantic meaning of age ranges and took the minimum by alphanumeric order. | Everyone |
| T1 (Bose, 2022) | Amazon Orders | How many items purchased within the month of November were returned to seller? | AI counted the quantity of products returned, instead of the number of unique products. | P1, P7, P15, P20 |
| T2 (Jha, 2022) | Big Basket1 | Show a list of the top five rated Nivea products. | AI missed ”Nivea Men” products in the data. | P1, P2, P5, P12 |
| T3 (Jha, 2022) | Big Basket2 | How expensive are gourmet products compared to beverage products in average? Show the value as a percentage of beverage products. | Correct | P1, P2, P5, P12, P22 |
| T4 (Rana, 2022) | Bollywood | Show the top 5 movies with the highest percentage return on investment. | AI mentioned but did not ignore rows with bad budget values. The intern did not filter for only Bollywood movies. | P2, P6, P10, P15, P21 |
| T5 (Bathwal, 2022) | Flights1 | What is the city that has the highest number of incoming flights? How many incoming flights does each airline have for that city with one week left until departure? Show the city name, airline and number of incoming flights. | AI performed the wrong order of filtering. It also incorrectly counted incoming flights based on booking rows rather than by unique flight codes. | P4, P8, P10, P14, P17 |
| T6 (Bathwal, 2022) | Flights2 | What is the least expensive time of the day to depart to Chennai in Economy class across all airlines? Show the time of the day and the fare price for each airline. | For each airline, the AI calculated the minimum price of all flights during a time of day rather than the minimum of the average price of flights during a time of day. | P4, P8, P10, P14, P17, P20 |
| T7 (Navarro, 2022) | Hotels | Which hotels had a worse ranking this year than in 2021? Show the hotel name, location and the difference in ranking from last year. | AI misinterpreted a ”2021” flag column as representing the rank in 2021. | P3, P4, P6, P8, P12, P16 |
| T8 (Khan, 2022) | Movie Content | What is the number of shows viewed in distinct languages within each genre as a percentage of the total number of shows within each genre? Show the genres as an index and languages as columns | Inverted the percentage calculation. Summing across genres for a given language should add up to 100 but the AI’s calculation resulted in summing across languages for a genre adding up to 100. | P5, P7, P11, P19, P22 |
| T9 (Soeiro, 2022) | Netflix | Who is the actor who worked with the same director the most? | Correct | P6, P9, P10, P11, P13, P18, P19, P21 |
| T10 (Azam, 2022) | TV | What are the top 5 most selling television frequencies? Show the frequencies with their counts | The AI cleaned dirty frequency data but it neglected correct data that existed in other columns. | P7, P13, P20, P22 |
Materials. In preparation for our study, we wanted to find realistic analysis verification tasks and AI-written errors representative of those made by state-of-the-art AI assistants. To do so, we used the ARCADE benchmark dataset from Yin et al. (Yin et al., 2022) which features multiple rounds of natural language intent to code problems (i.e. a natural language query, dataset, and code solution) in computational notebooks written by data scientist annotators. These notebooks used datasets uploaded to Kaggle111https://www.kaggle.com, a popular online community for data scientists, and encompass data wrangling and EDA tasks. To avoid datasets overlapping with the training data of LLMs (OpenAI, 2023b; Brown et al., 2020), we chose natural language queries associated with datasets uploaded to Kaggle after February 2022. This included 660 queries from 70 distinct datasets.
We selected a subset of analysis queries that were incorrectly answered by current state-of-the-art LLMs (GPT-4 and Code Interpreter). First, we tested the 660 queries against GPT-4 (OpenAI, 2023b) using its API (temperature=0.7, n=3). For this, GPT-4 was provided a dataset summary (example in the Appendix) similar to that of other LLM-based analysis tools (Dibia, 2023), a scaffold to write code in, and the natural language query. Next, we sampled a set of 50 queries that resulted in incorrect outputs from GPT-4, specifically selecting more complex queries with a high number of Pandas API calls in the solution. These queries (and corresponding datasets) were then presented to Code Interpreter. Code Interpreter executed the code for the analysis, and detailed its steps in natural language.
After manually inspecting the 50 queries GPT-4 struggled with, we identified 22 that were also incorrectly answered by Code Interpreter. These errors included bad calculations, semantic misinterpretations of the prompt, and misunderstandings of the data. We then chose a subset of these 22 queries that cover a variety of error types (i.e., misunderstanding column semantics, bad calculations, or misunderstanding the query) and involve datasets and domains that were approachable to general audiences. Using this subset, we constructed the tutorial and primary tasks of our study. Sometimes, Code Interpreter encountered ambiguities and sought clarification from the user. For these cases, we included a follow-up prompt and integrated the multi-turn interaction into our study tasks. In total, we prepared one tutorial task and 10 main tasks, 2 of which did not contain any errors, spanning 9 unique datasets (Table 2).
For each task in our study, we prepared intermediate data tables and table summary visualizations for each code snippet in Code Interpreter’s analysis. To provide analysts with sufficient information, we prepared additional intermediate data tables for all major transformations, often breaking up chained function calls in the code. We then verified with multiple expert data scientists that these intermediate data tables were sufficient for the task. To ease dataset understanding and help participants focus on the verification process, we reduced the number of columns for excessively complex datasets. We made sure to leave enough extra columns irrelevant to the immediate analysis query such that the task remains non-trivial. In addition, we provided a clear ground truth motivation and a more detailed description of the analysis query. In the rest of the paper, to differentiate the two, we refer to the detailed description of the analysis query as the analysis goal. Finally, we provided a description of the dataset and what each column in the dataset represented.
To summarize, we compiled the following primary materials for each task: the natural language query from ARCADE (Yin et al., 2022), the code, code comments, and natural language explanation response from Code Interpreter (OpenAI, 2023a), the data tables and visualizations we prepared (Fig. 2 right), and a detailed description of the motivation, analysis goal, and dataset.
Study Procedure. We conducted our study remotely with participants sharing their screens over a video conferencing tool. Because our design probe was built as a web application, participants loaded the interface on their computer with their choice of browser.
The study was structured into three parts lasting approximately 60 minutes total: a tutorial phase (10 min), an activity phase (40 minutes) in which participants worked through the prepared tasks, and an semi-structured interview phase (10 minutes). In the tutorial phase, we presented participants with the following scenario: Imagine having an intern who is provided with a dataset to address an analysis problem. The enthusiastic intern decides to use an AI assistant to complete the problem, correctly uploading the relevant dataset and crafting a prompt that is their interpretation of the original analysis problem. The AI assistant produces an output but the intern is unsure that it is correct.
We clarify that the input to the AI assistant is only the intern’s prompt and the uploaded dataset. In particular, we directed analysts not to focus on the quality of the prompt, but on the AI-generated output in response to the prompt. We mention that although the code executes, there might be issues with the information the AI uses or how it interprets the intern’s prompt. With this scenario in mind, we presented the participants with the intern’s prompt and the assistant’s response in our interface (Fig. 2). We asked participants to determine if the AI assistant’s answer correctly addressed the initial problem, and if not, point to reasons why they think there was a mistake.
To eliminate the challenge of participants having to craft their own prompts—a task that presents its own set of difficulties (Zamfirescu-Pereira et al., 2023)—we chose to assign the responsibility of prompt authoring to the intern. In addition, this choice dissociates participants’ personal preferences for how they would write prompts which is not the core focus of our study.
After introducing the analysis scenario, we gave participants a brief walk-through of the interface (Fig. 2). We then had participants complete a fixed trial task to familiarize themselves with the interface (Task 0 in Table 2). The task intentionally contained an error in which the AI assistant misinterpreted the values of a column and poorly sorted the answer. This strategy aimed to make participants cognizant of potential assistant errors and to encourage vigilance in subsequent tasks.
Next, in the activity phase, participants read the analysis goal and reviewed the work of the assistant and intern. We assigned tasks to participants to ensure that, collectively, all tasks were covered by the participants (Table 2). For all tasks in the study, the motivation, analysis goal, and description of the dataset were always available in a left side panel (see appendix for an example). To make sure the participants fully understood the analysis goal, we discussed any areas they found unclear. We also clarified any questions about the dataset or analysis goal while participants were working through the task. To reduce time pressure and encourage a realistic process, we emphasized the exploratory nature of our study, allowing participants to work at their own pace until they were satisfied with their conclusion. After completing each task, participants were asked to complete a brief survey that asked for a confirmation as to whether the AI’s generation was erroneousand their reasoning process.
While participants were completing the tasks, we encouraged them to think aloud and describe their reasons for interacting with different components of the interface. If they remained relatively silent, participants were regularly prompted to speak about their process. We provided minimal help beyond clarifying the analysis goal or semantics of the data.
Finally, in the semi-structured interview phase, we asked open-ended questions to understand participants’ backgrounds and prior experiences, overall verification processes, and rationales behind their behaviors.
Transcript and Workflow Analysis. To identify recurring themes, two authors engaged in several rounds of open coding and had multiple meetings to refine their observations. The themes we observed highlighted variations in participants’ workflows and the artifacts they used. In the analysis and results, we distinguish between data artifacts (those in Fig. 2 right) and procedure artifacts (those in Fig. 2 left). Data artifacts pertain to the original, intermediate, and result data (i.e., the data table and summary visualization). Conversely, procedure artifacts encompass the natural language explanation, code/comments, and the AI’s explanation and interpretation of the result.
Additionally, to systematically understand participant’s verification processes, we delineated these into sequences of primary observations. Informed by the themes from open coding, the two authors who developed the themes drafted an initial set of observation labels (e.g., read data table or raising a consideration). Both authors annotated a few analysts’ processes independently before meeting to resolve ambiguities and unclear interpretations. These discussions facilitated a refinement of the observation labels by broadening their scope. Using the final refined set of labels (Table 3), they annotated all end-to-end verification processes in the study (see Fig. 3 for examples), including observations of the artifacts being used. The end-to-end verification process starts when participants begin verifying the AI-generated analysis (after understanding the task and data) and ends when they confirm or reject that an error exists. We list all participants’ verification processes in the appendix.
| Label | Definition |
|---|---|
| Start | Start of a verification process |
| Data Only | Using data artifacts only |
| Data + Procedure | Mainly focusing on the data and using procedure artifacts as secondary support |
| Procedure Only | Using procedure artifacts only |
| Procedure + Data | Mainly focusing on the procedure and using data artifacts as secondary support |
| Notice | Noticing an issue that may affect the correctness of the AI-generated result |
| Confirm | Confirming or rejecting that the AI-generated analysis has an error |
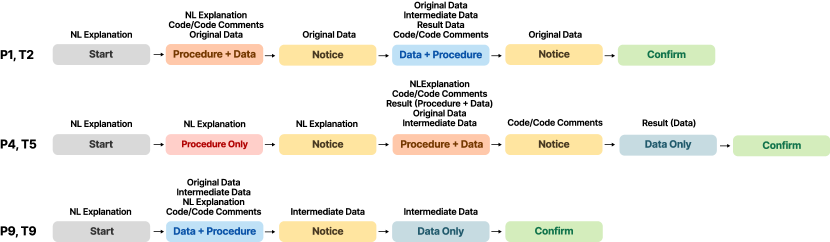
Three linear flowcharts from left to right connected by actions in blocks and flow links with the use of different artifacts on top of each block. The start states are all ’Start’, and the end states are all ’Confirm’.
6. Results
Participants engaged in a variety of different steps to identify potential issues and ultimately confirm or reject the AI’s analysis. Our user study uncovered two common high-level workflows analysts used within their verification processes: procedure-oriented workflows and data-oriented workflows (Fig. 4) (RQ1).
Within a verification process, participants adopting a procedure-oriented workflow were primarily focused on validating the AI’s procedure, possibly drawing upon data artifacts to aid their understanding. In contrast, participants following a data-oriented workflow gave precedence to scrutinizing the data involved in the analysis, relegating the AI’s procedure to a supplementary role. The distinction between these workflows lies in the participants’ intention. Participants following procedure-oriented workflows were concerned with what does the AI do? Meanwhile participants following data-oriented workflows focused on does the data make sense? This was clear from observing their interaction patterns and verbal comments. For example, while some participants engaged extensively with intermediate datasets, their main goal in those moments was to confirm the correctness of the AI’s procedure; these behavioral patterns were labeled as procedure-oriented workflows with the use of data artifacts as secondary support (i.e., Procedure + Data).
Furthermore, participants frequently shifted workflows before and after they noticed an issue in the AI’s analysis (see Fig. 3 for examples). Participants usually followed a procedure-oriented workflow initially during their verification process. Upon identifying a concern, their strategies diversified, delving deeper to explore and validate the perceived issue (Table 4). In undertaking these workflows, analysts leveraged both data and procedural artifacts, not only as central elements in their primary workflow but also as supporting artifacts to both reinforce their comprehension and validation of the primary workflow (Fig. 5) (RQ2). From our post-task interviews, we observed how analysts’ backgrounds influenced them towards data-oriented workflows or procedure-oriented workflows and how a familiarity with data operations and basic programming helped them understand the AI’s procedure (RQ3).
In this section, we describe procedure-oriented (Sec. 6.1) and data-oriented (Sec. 6.2) workflows; the focal points within these workflows, the artifacts used (both as the main focus and secondary support) and how these workflows led analysts to identify issues. Subsequently, we outline observations related to analysts’ backgrounds and how this informed their verification processes (Sec. 6.3).
6.1. Procedure-Oriented Workflows
We observed most participants (18/22) followed all or parts of the AI’s procedure at some point during their verification processes (44/52). Participants focused on different aspects of the procedure and often leveraged data to support their understanding and validation of information from the procedure.
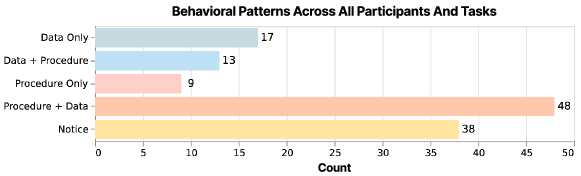
Horizontal bar chart of the counts of different behavioral patterns. ’Data Only’ has a count of 17, ’Data + Procedure’ has a count of 13, ’Procedure Only’ has a count of 9, ’Procedure + Data’ has a count of 48, and ’Notice’ has a count of 38.
| Behavioral Patterns | Count | Occurrences in Observed Verification Processes |
|---|---|---|
| PD — N — D | 9 | T1 [P1], T2 [P5, P12], T4 [P2], T5 [P4], T6 [P14], T8 [P22], T9 [P6], T10 [P22] |
| PD — N — PD | 6 | T3 [P5, P12], T6 [P4, P14], T7 [P12], T10 [P20] |
| PD — N — C | 5 | T1 [P7], T2 [P2], T4 [P6], T5 [P10, P14] |
| PD — N — DP | 3 | T2 [P1], T4 [P21], T10 [P13] |
| P — N — PD | 3 | T5 [P4, P8], T8 [P11] |
| DP — N — D | 3 | T4 [P15], T7 [P16], T9 [P9] |
| DP — N — C | 2 | T2 [P1], T10 [P13] |
| P — N — P | 2 | T7 [P4, P6] |
6.1.1. Focal Points in Procedure-Oriented Workflows
In procedure-oriented workflows, participants focused on different facets of the AI’s analytical procedure utilizing all procedure artifacts in support. Some participants looked over the AI’s procedure to get a high-level understanding of its analysis steps (P1, P2, P4, P8, P11, P17, P18, P20). For instance, in T9, P18 wanted to understand how the AI arrived at a particular actor-director pair in the result: “I’m trying to read the code and I’m trying to understand … like how is it generating that pair and if there is any error in that process.” In some cases, participants gained confidence in the AI’s correctness from this high-level understanding (P1, P2, P11, P20). For example, P1 confirmed their understanding after reading the AI’s procedure one last time:“seems reasonable to me.” P11 was reassured by the AI’s overall procedure matching their own: “the steps it described is exactly what I would have done but in SQL.” In other cases, participants’ focus on the procedure helped them notice and subsequently confirm a particular step the AI did wrong (P4, P8). For example, P4 and P8 both noticed from the NL explanation that the AI’s order of analysis steps were incorrect [T5]. In T6, similar to P11, P4 broke down the general steps on their own and realized the AI missed calculating the average after inspecting the AI’s procedure.
In addition, participants focused on lower-level details involved in the AI’s data operations (P2, P7, P8, P9, P10, P11, P13, P15, P17, P22). Participants checked functions used in the code, logic around the data operations, and specific result values. P13 was especially vigilant making sure that “the spelling was correct” in the data columns mentioned in the code, and that “syntactically … (they) appear to be correct.” P19 was also following the AI’s data operations to see how it handled unusual values in the dataset the AI had identified earlier in its procedure. Focusing on low-level details was one way participants gained confidence in the AI or noticed issues (P7, P8, P10, P11). For instance, in T9, P10 focused on the AI’s data operations in the code which they attributed to helping them conclude the AI had indeed found the highest count. P11, while not the most comfortable with Python, used code comments to translate the AI’s procedure into familiar data operations, noticing the AI’s procedure was inconsistent with the analysis goal description [T8].
Moreover, participants focused on the AI’s Natural Language (NL) explanation of its result and found discrepancies by comparing this against their common knowledge. For example, P10 felt that “2800 flights felt like a lot” for a day [T5], leading them to investigate the AI’s procedure. Similarly, from inspecting the AI’s explanation of the result, P6 noticed “Jurassic World is not a Bollywood movie” [T4]. These discrepancies prompted them to question the AI’s data operations and understanding of the dataset .
Within procedure-oriented workflows participants were also keen on verifying the consistency in the AI’s procedure, that the NL explanation outlining its high-level analysis steps matched the code detailing the specific data operations (P5, P11, P17, P22). Finally, participants used the AI’s procedure to verify its interpretation of the prompt and original dataset (P4, P12). For instance, for T7, both P4 and P12 noticed discrepancies in the AI’s understanding of the data from its NL explanation stating an incorrect interpretation of a column.
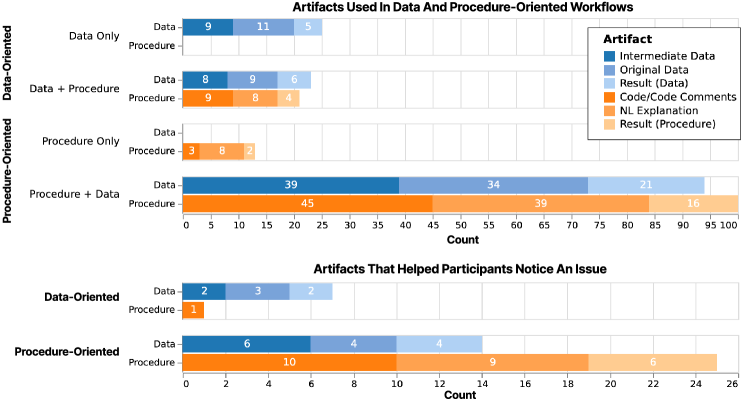
Two horizontal bar charts of counts of artifacts used in data and procedure-oriented workflows. The top one shows the total counts used in the different workflows, and the bottom one shows the counts used in different workflows that helped people notice an issue.
6.1.2. Data Artifacts in Support of Validating the Procedure
We found data artifacts were often indispensable during participants’ procedure-oriented workflows (17/22 participants and 41/52 verification processes).
Some participants glanced at the data artifacts to check things they noticed in the AI’s procedure (P6, P8, P22). For instance, P22 noticed that the AI’s calculation for the average price of gourmet food was not a number, prompting them to check the original data table and discovering that the AI used the wrong column name [T2]. Similarly, participants used data artifacts to conduct data sanity checks to verify the procedure (P1, P3, P4, P19, P21, P22). For instance, P19 wanted to see if percentages in a column added up to 100: “If the percentages tied to 100%, I would feel confident just at a glance that you know everything and action was allocated to one of those languages” [T8].
In other cases, participants tried to replicate the AI’s data operations using the supported functionalities in the data tables to compare with the result in the AI’s procedure and verify what the AI did (P2, P9, P12, P14, P22). Consequently, participants often noticed discrepancies between the AI-generated outputs and their calculated results. As an illustrative example, in T6, P14 used the data tables throughout their verification process to manually follow the AI’s procedure and confirm that the AI made a mistake when the result did not align with their manual calculations [T6]. In an another example, P22 filtered on the frequency column following the AI’s steps to see how many rows were filtered out [T10]. From these observations, we observed participants both relied on simple checks and detailed calculations on the data artifacts to verify the procedure.
6.2. Data-Oriented Workflows
Data-oriented workflows primarily focused on validating and understanding the data, occasionally using the AI’s procedure to make sense of things noticed in the data. This workflow was commonly observed in participants after they had identified a potential issue, a trigger that spurred them to investigate the data (Table 4). Overall, we observed 18/22 participants in 25/52 verification processes adopting data-oriented workflows. Likewise, 15 participants in 17 verification processes included data-oriented workflows in response to noticing an issue.
6.2.1. Focal Points in Data-Oriented Workflows
Participants in data-oriented workflows focused on the data in a variety of ways. Some participants (P3, P7, P15, P19) were keen on understanding the data (original and intermediate) and the specific columns relationships that were pertinent to the analysis goal. For instance, P7 adopted a data-oriented workflow using only data tables at the beginning of their process, identifying a data quality issue in the frequency column while exploring the column of interest in the analysis goal [T10]. Meanwhile, for P9, a prototypical data-oriented participant, their data-oriented workflow involved comparing all data tables [T9]. Specifically, they delved into the directors and actors intermediate data tables to gather an expectation of what they would expect in the subsequent merged data table (Fig. 4 third row). After, they checked if specific actors in the result data existed in the merged data. In the process, they spent significant time forming an expectation of the result data, transitioning back and forth between all data tables. Upon perceiving a discrepancy between the number of rows in the merged data table and their expectations of the count from a quick mental calculation, they became skeptical of the AI-generated output. In contrast, P17 simply used the intermediate data tables to quickly compute the data operations for the analysis goal on their own: “intermediate code is less useful … I would go here (intermediate data table) and then do a sort on it myself.” While this might have been doable in the context of the datasets and tasks in our study, it might not be as easy with more AI-generated analyses involving complex operations or large datasets.
Through closely examining the data tables, participants were able to identify issues with the AI-generated analyses (P1, P3, P7, P9, P13, P15, P16). For instance, from the original data table, P1 noticed that there were also the Nivea Men brand in the dataset which the AI missed (Fig. 3 first row), ultimately leading them to confirm that the AI-generated analysis contained an error. In other cases, participants went into data-oriented workflows after noticing an issue. Participants often went into the data tables for further verification on the exact data. While some participants (P2, P15, P16, P20, P22) identified the source of the issue through eyeballing different data tables, others followed a data-oriented workflow to check more closely the potential source of an issue (P4, P5). In T2, P5 correctly noticed that there was no consideration for Nivea Men. To explore this further, they focused on the original data table, filtering for rows in which the brand was Nivea and applying additional filters to spot check specific products [T2]. Similarly, to affirm their suspicions of an error, P4 investigated the final result table after noticing the AI may not have grouped rows by flight code (Fig. 3 second row) [T5].
6.2.2. Procedure Artifacts in Support of Validating the Data
Within data-oriented workflows, we observed participants (10/22) using procedure artifacts to support their data verification processes (13/52). Procedure artifacts enabled better comprehension of the data and even helped surface issues with the AI-generated analyses.
Many participants used the NL explanation and code to help them understand the data and explain the relationships and values observed in the data tables (P1, P3, P13, P15, P16). P1 in T2 is a typical example (Fig. 4 first row). P1 started out in a procedure-oriented workflow but upon perceiving an issue in the original data table where more than 5 items had a rating of 5, transitioned into a data-oriented workflow. They scrutinized the original data table but became confused when the result data table displayed values less than 5. This contradicted their initial observation where more than five products had a 5 rating in the original data. To resolve this, they turned to the intermediate data and the AI’s procedure, tracing the steps in the code that derived the result table. P3, meanwhile, first meticulously examined the original, intermediate, and result data to gain a comprehensive understanding of the AI-generated analysis. Upon noticing duplicates in the rank difference, in reference to the procedure artifacts, they remarked, “I’ll need to look into what it did.”
Participants also noticed issues when using procedure artifacts to support their understanding of the data (P1, P9, P13, P15, P16, P17, P21). For instance, P17 wanted to explore why the intermediate data table contained all kinds of departure time. They checked the code to see where it did the filtering on the Departure Time and realized the AI missed taking into account the time of the day when calculating the minimum of prices [T6]. In a few cases, participants became overconfident around the AI’s correctness and subsequently formed an incorrect conclusion due to their reliance on verifying the data artifacts with the AI’s procedure (P15, P17). In T5, P17 was initially skeptical of the result table due to insufficient information presented, yet gained confidence that the result “looked more or less correct” after exploring and manipulating the data while cross referencing the AI’s NL explanation and code. P15 manually reviewed the original data and formed expectations based on the AI’s NL explanation and code. They confirmed that the AI is correct when the result data table matched their expected output [T1].
6.3. Background Impact on Workflows and Artifacts Used
In the post-task interviews, we explored participants’ prior experiences with data analysis, coding, and existing analysis tools. We observed a range of experiences that influenced participants’ approaches, workflows, and interactions with different artifacts to verify AI-generated data analyses.
6.3.1. Prior Experience With Data
Participants sometimes attributed their focus around data-oriented workflows to their prior experience working with data (P6, P9, P11, P16, P17, P18, P22). For instance, P15, who had previous experience working with large datasets, expressed comfort with directly manipulating the datasets, stating, “I’m used to working with hundreds of thousands of rows, so the size of the spreadsheet wouldn’t have been a problem.” In both tasks P15 did, they only followed data-oriented workflows. These prior analysis experiences also led analysts to be vigilant about the data (P6, P9, P11, P22). P6, who self-identified as a “data guy”, was inclined to dive directly into the data and scrutinize the tables and numbers. P11, an electrical engineer by training, also favored a data-oriented approach. They compared the study tasks to their past experiences designing systems, explaining how they always “went straight to the data” and asked “hey, can I trust that it’s quality data?” P9, with a background in finance and accounting, was accustomed to handling datasets that were “routinely between 100 and 500,000 rows.” In the study, P9 focused on validating the data, underscoring the importance of ensuring data integrity and rational calculations. Similarly, P22 cited their prior work experiences as informing their analysis verification approach: “we were maniacal about not drawing the wrong conclusion.” During their verification process, they demonstrated a methodical approach to problem-solving, routinely considering “lots of caveats and checks.”
Moreover, we noticed participants’ prior experiences forming conclusions and insights from data shaped their behavior in the study tasks. Participants started the verification processes by proactively devising their own analysis plan. A few participants participants (P1, P6, P9, P19, P22) mentioning being accustomed to formulating error hypotheses, setting expectations, and actively identifying problems in the data. For example, P19 commented how in their own data analysis workflow they were always on the lookout for “weird stuffs” like data classes, data types, and anomalies. This was reflected in their systematic verification process when faced with our study tasks.
6.3.2. Prior Experience With Code
While participants’ experiences working with data sometimes led them to being more data-oriented, a couple participants’ coding comfort made them inclined to follow procedure-oriented workflows specifically through the code (P5, P8). For instance, P8, a software engineer, naturally tried to verify the correctness of the code: “as a developer, just let me look at the code.” Similarly, P5, compared the tasks to doing a “code review.”
Interestingly, participants who were not familiar or comfortable with Python but had a familiarly of data operations and/or data-oriented programming languages (e.g., SQL and Visual Basics for Applications) managed to leverage their knowledge to understand the AI’s procedure on the data (P10, P15, P19, P20, P21). For example, P4 looked for key words in the code to understand the the AI’s operations. For P10 in T9, despite having no prior experience with Python, they were able to devise the analysis steps in SQL and cross-check them against the AI’s explanation and code comments:
“If I were to do this in SQL Server with the table that you gave me, I would have created … select unique ID where director and popped the table out … So basically, I’m translating Python into the technologies I know to see if the AI is doing what I need them to do.”
However, while able to parse key words or main points from the code, a lack of understanding of the code hindered some participants’ confidence in their verification process (P2, P12, P14, P18, P20, P21). For example, P20 found T5 “difficult because (they didn’t) fully understand the code.” For P18, an incomplete comprehension in T9 led them to focus more on the original data as opposed to the intermediate data since they were unsure how the intermediate data was generated: “in the intermediate steps, I am not confident if the slicing and the dicing is being done the way it should be.” To bridge this gap, a couple participants mentioned liking code documentation or being able to easily translate the code to a more familiar languages (P11, P21).
6.3.3. Prior Experience With Existing Analysis Tools
Our study aimed to include participants with a diverse usage of existing analysis tools (Table 1). While there were ways to verify the AI-generated output using our design probe (Fig. 2), some participants expressed a preference for functionality they were familiar with from existing tools that were unsupported by our interface (P12, P13, P15, P18, P21). For example, P12 mentioned wanting to use conditional sorting on the columns, and P17 wanted support for comparison operators in data filtering. Several participants also expressed a desire to have pivot tables (P11, P17, P18, P21), making it easier to understand the data. Moreover, while many participants expressed appreciation for the visual summaries of the data tables (P5, P7, P13, P17, P20), P21 expressed low trust in the artifact because they were unsure how the artifacts were created in the first place. They felt more comfortable with using more familiar tools:
“The (visualization) summary tab was kind of useless to me… I didn’t really trust it and and it was unclear to me how the the data was being summarized.”
7. Discussion
In this work, we examined how data analysts understand and verify AI-generated analyses. We developed a design probe, prepared realistic analysis queries and AI-generated analyses, and conducted a user study observing analysts’ verification processes and common workflow patterns. In this section, we synthesize the results from our user study and share implications for data analysts using AI-based analysis tools (Sec. 7.1) and system designers building these tools (Sec. 7.2).
7.1. Implications for Data Analysts
7.1.1. The Role of Data Literacy in Analysis Verification
Our findings suggest that while a lack of familiarity with one particular programming language (in this case Python) is not a barrier for verifying AI-generated analysis, prior experience with data operations in other languages (e.g., SQL or Visual Basics for Applications) can aid in understanding the AI’s procedure (Sec. 6.3.2). Likewise, knowledge and experience in data analysis are often indispensable for grasping AI-generated analyses. This mirrors the requirement for computational thinking skills when working with AI-based code assistants (Sarkar et al., 2022). Here, we highlight two recommendations for analysts to be more effective in verifying AI-generated analyses.
Know Common Data Operations. In the verification process, we observed participants closely examined the AI’s data operations and sometimes performed these operations on the datasets directly to compare with AI’s result (Sec. 6.1.2 and Sec. 6.2). This involved understanding common operations such as filtering, sorting, and merging the data. Similarly, understanding aggregation operations, such as sum, average, count, were also essential to verify how the AI grouped data and performed calculations on those groups. Therefore, analysts should understand the data operations essential in both data-oriented and process-oriented workflows.
Develop Strategies for Quick Data Validations. Our observations revealed analysts often employed quick sanity checks on the data (e.g., eyeballing values, manual summation of rows, using visualizations to check the value distributions, spot checking result values against original data table, and comparing things against common knowledge) as a strategy to assess the AI-generated outputs (Sec. 6.1.2 and Sec. 6.2.1). These were effective for analysts to either build confidence in the results or identify unexpected patterns. The sanity checks often involved forming expectations around the result and then comparing them with the AI-generated output. Any discrepancies signaled potential issues that demanded further inspection. Given the effectiveness, analysts should use quick sanity checks in their verification process. However, as there may be data issues hidden by seemingly reasonable patterns (Correll et al., 2018), analysts should employ a variety of different sanity checks.
7.1.2. The Role of AI Assistants in Data Analysis
Participants’ varied experiences working with data and analysis tools (Sec. 6.3) combined with their observations of AI analysis assistants’ strengths and shortcomings in our study, led to a wide range of comments about their preferred use of general AI-based analysis assistants. Here, we discuss how AI assistants could be used in data analysis.
Some participants commented how AI-assistance would be helpful for getting them a partial answer that might guide them in their analysis process (P1, P6, P7, P14, P20, P21). For instance, P6 mentioned how the AI can help them consider alternative steps: “It’ll help me say ‘oh maybe didn’t think of this way of solving this and I can now go down that path.’” AI assistants can help inspire ideas for analysis steps similar to when programmers follow an exploration mode in AI-assisted programming (Barke et al., 2022). Presenting alternative approaches is especially critical in analysis assistance as analysts can often be limited in their consideration of analysis approaches (Liu et al., 2019, 2020), thereby affecting the robustness of their subsequent analysis conclusions (Silberzahn et al., 2018; Breznau et al., 2022; Schweinsberg et al., 2021). Thus, AI analysis assistance can improve analysis quality by broadening the analysis decision space analysts consider (Liu et al., 2019; Gu et al., 2022).
Similarly, participants noted that assistants can expedite their analysis process (P1, P13, P20), corroborating the findings from prior research on AI-code assistants (Vaithilingam et al., 2022; Ziegler et al., 2022). However, to ensure the robustness of the analysis conclusions, it is crucial to balance the acceleration of analysis with measures that surface potential errors, underlying data assumptions, and alternative approaches.
Finally, some participants expressed a preference to reserve AI assistance for peripheral tasks such as error-checking or report generation, rather than the central analysis process. Utilizing AI assistance in crafting reports (Zheng et al., 2022; Wang et al., 2023) and similar subsidiary activities offers a low stakes environment for analysts to evaluate the quality of AI-generated outputs within data analysis workflows. This approach can also facilitate a deeper understanding of the assistant’s capabilities and limitations.
7.1.3. Understand the Bounds of the AI and the Tool
Participants (P4, P18, P21) sometimes expressed doubt on the intermediate data and even the summary visualizations as it was unclear what artifacts had the potential to be a result of AI “hallucinations” (Ji et al., 2022) and which were consistent with regards to the data and procedure (Sec. 6.2.2). As the boundary blurs between AI-generated artifacts and tool-generated artifacts, analysts should clearly distinguish what is and what is not produced by AI.
Tool artifacts compiled from code is deterministic (i.e., the same summary visualization will be produced given the same code and input data) (Sarkar et al., 2022). The AI-generated outputs and their associated errors are stochastic in nature, varying each time the AI is prompted to conduct the analyis. Knowing the provenance of artifacts used to support verification—what is tool-generated (e.g., the visual summary of data) and AI-generated (e.g., the intermediate data feeding into the visualization)—is important to assess the reliability of the information associated with these artifacts. Additionally, understanding the strengths and limitations of the AI (Ragavan et al., 2022; Sun et al., 2022) is crucial to knowing what types of AI-assistant mistakes to look for.
7.2. Implications for System Designers
Informed by our study findings of verification workflows and noted challenges, we highlight three design implications for designers of AI-based analysis assistants.
7.2.1. Tools should support both data-oriented and procedure-oriented workflows
Our study on analysts’ verification processes revealed that analysts often followed both data-oriented and procedure-oriented workflows. Data artifacts were often leveraged to support analysts’ understanding of the procedure (Sec. 6.1.2) and procedure artifacts were used to support analysts’ verification of the data (Sec. 6.2.2). The use of data-oriented and procedure-oriented artifacts were often intimately tied to each other, requiring analyst to switch between the two (e.g., intermediate data table and the code snippet that generated this data). Therefore, to support analysts’ behavioral patterns, tools should support both data-oriented and procedure-oriented workflows and enable seamless transition between data and procedure artifacts. Pointing to a specific step in the procedure should present the associated data artifact and vice versa.
As participants in our study often sought familiar operations in their verification process (Sec. 6.3.3), these considerations can be integrated into existing tools considering their current capabilities and shortcomings. For example, tools like Code Interpreter (OpenAI, 2023a) and AI Coding in Google Colab (Perry and Mallick, 2023) are primarily centered around procedure-oriented verification workflows. Enhancing them with features that allow for easy reference and manipulation of data artifacts, like intermediate data tables or simple data visualizations, could be beneficial. Nevertheless, integrating these features may be challenging for all data workflows. It may not be easy to manipulate or visualize large datasets (i.e., with millions of rows) (Chattopadhyay et al., 2020).
On the other hand, platforms that are more data-centric, such as spreadsheet environments, should provide interface elements that articulate the underlying procedure. While some, like the Copilot AI assistant in Microsoft Excel, do communicate the procedural steps in natural language, there is scope for including different ways to communicate more clearly to analysts (discussed more in Sec. 7.2.2).
Based on our discussion, designing new AI-driven systems should also consider how to encourage users’ adaptation to the procedure-oriented and data-oriented workflows. As new tools present a learning curve and unfamiliar elements, it is important to help analysts build comfort and confidence in various artifacts around different workflows.
7.2.2. Tools should support multiple ways to communicate the semantics of data operations
We observed AI-generated code to be a common part of analysts’ verification processes in procedure-oriented and data-oriented workflows (Sec. 6.1 and Sec. 6.2). However, a lack of comprehension of the code and the exact data operations impacted analysts’ confidence in their verification findings and even pushed them to alternative workflows (Sec. 6.3.2). However, participants who were able to translate the AI’s code into familiar data operations were able to understand the procedure and not be significantly impacted in their verification confidence and process. Therefore, consistent with implications from prior work in XAI (Kim et al., 2022), tools should provide multiple methods to communicate the operations in the AI’s procedure.
One example, mentioned by participants in our study is to translate the Python code into programming languages they were comfortable with. This can be achieved with neural code translators (Lachaux et al., 2020) or existing AI-code assistants (OpenAI, 2022; GitHub, 2022) at the code snippet level. If translated at the operation level, it is important that the translation is faithful to the original operator.
Besides communicating in different programming languages, Liu et al. (Liu et al., 2023b) explored translating Python code into a systematic natural language utterance and found this approach improved users’ understanding of the code-generating model. However, this work only considered a limited set of operations and small data problems, and future work could explore how translating a larger set of operations could benefit analysts in real-world analysis tasks.
Tools can also leverage artifacts beyond code and natural language. Visualizations of data operations such as those in Datamations (Pu et al., 2021), and SOMNUS (Xiong et al., 2022) can communicate operations visually to analysts. Likewise, tools can show differences in intermediate data between calculations to further enhance analysts’ understanding of the operations (Wang et al., 2022).
7.2.3. Tools should ask the AI to consistently communicate its assumptions and interpretations of the data
We observed participants often noticed errors faster in tasks where the AI clearly stated its assumptions about the data (e.g., the data column semantics, assumed data types, and relationships between data columns etc.) and its interpretation of the prompt (P6, P10, P12, P22). For example, in T7, the AI clearly stated its interpretation of what the data in key columns represented: “2021: (Assuming) Rank of the hotel in 2021” and “Past_rank: Past rank (unclear for which year).” However, we noticed similar assumptions were not always stated between different analysis tasks.
Therefore, tools should consistently communicate the assumptions and interpretations of the dataset and analysis, a well-regarded best practice for data analysis (Field et al., 2012). This implication narrows down a broader recommendation for AI-based code assistants to articulate the generated code within the context of a programmer’s specific task and environment (Sarkar et al., 2022). One strategy to facilitate this could be to prompt the AI system to enumerate its assumptions explicitly. Another avenue, as exemplified by LLMs such as GPT-4 being good evaluators for tasks like natural language summarization and visualization (Dibia, 2023; Lin et al., 2022; Liu et al., 2023a), can involve employing a separate agent to evaluate the assistant-generated analysis, thereby listing any assumptions, interpretations, or discrepancies.
7.3. Limitations and Future Work
We note several limitations in our study of verification processes and discuss opportunities for future work. First, the analysis task queries involved in our study tasks primarily involved sequences of data transformations. Other aspects of data analysis (e.g., data visualization, statistical modeling, machine learning, etc.) were not explored. However, our study still provided insight into analysis queries in common analysis workflows, as participants (P9, P22) mentioned the issues they encountered in the study tasks were ones they commonly faced in their own data analyses. Our study is a first step to uncovering verification processes of AI-generated outputs where data and manipulations on data are centrally involved. Future work should explore analysts’ verification processes in data visualization, statistical analysis, and machine learning workflows (Crisan et al., 2020).
Second, since our study contained a small number of verification tasks while using real responses generated by state-of-the-art nondeterministic models, components of the AI’s explanation (e.g., listing its assumptions of the data and columns) and specific data operations involved in the data analysis task (i.e., filtering for data or merging data) were not controlled for across tasks. Future work could experiment with how varying components of the AI’s explanation or analysis task impact analysts’ verification processes.
Third, participants were not the one’s exploring the data and coming up with the analysis goal and instead had this given to them. As a result, prior to them verifying the AI-generated analyses, they first spent time understanding the data and analysis goal, a process that may not be as pertinent in conducting their own data analysis with AI assistants. However, to simulate realistic workflows, all tasks used in the study involved real-world datasets with analysis prompts written by data scientists (Sec. 5). In addition, we quickly clarified any questions regarding the analysis goal to facilitate the verification process. Future work could explore verification processes when analysts work with their own analysis tasks with the help of AI assistants.
Finally, study participants were not responsible for creating the AI prompts. While more elaborate prompts may be argued for reducing the errors presented in our study, writing these prompts is challenging (Zamfirescu-Pereira et al., 2023; Mishra and Nouri, 2022). Brevity of the prompt can be in tension with a precise one that reflects all aspects of the analysis (Yin et al., 2022). Therefore, given that the misalignment between the analyst’s intent and AI’s actions is inherent in natural language communication (Liu et al., 2023b; Luger and Sellen, 2016; Özcan et al., 2020), subtle AI-generated analysis errors (at least those due to this misalignment) and the need for verification processes persist. Moreover, as our study focuses on analysts’ verification processes, we did not want LLM prompting expertise to impact and potentially bias the results. Recognizing errors remains a crucial aspect of Human-AI interaction, helping to enhance the quality of subsequent prompts for repair (Ashktorab et al., 2019) and future interactions. In a few cases, our participants (P6, P10, P22) noticed issues directly from language ambiguities in the intern’s prompt. As a logical next step, future research should study how expertise in prompt creation influence analysts’ interactions with AI assistants and how these analysts integrate prompts into their verification and repair strategies.
8. Conclusion
In this paper, we explore the behavioral patterns exhibited by analysts during the verification process of AI-generated analyses. To this end, we employed a design probe that enabled participants to engage with natural language explanations, code snippets, visual data summaries, and data table operations. In a user study with the probe, we identified two common workflows— procedure-oriented and data-oriented—that analysts followed to either uncover issues or build confidence in the AI-generated output. Our findings highlight ways that AI assistants can support the verification processes of analysts. We emphasize the critical role of data literacy in this verification process, recommending that analysts familiarize themselves with common data operations and develop rapid data validation strategies for effective verification. In addition, to foster trustworthy and effective AI-assisted data analysis, AI analysis assistants should facilitate both data-oriented and procedure-oriented workflows. Moreover, these systems should afford a smooth transition between the two workflows, offer multiple avenues for communicating the semantics of data operations, and clearly convey the AI’s assumptions and interpretations for both the analysis goal and dataset.
References
- (1)
- jup (2023) 2023. JupyterLab. https://jupyterlab.readthedocs.io/en/stable/ Accessed: 2023-09-02.
- rst (2023) 2023. RStudio: Integrated Development for R. https://www.rstudio.com/ Accessed: 2023-09-02.
- tab (2023) 2023. Tableau Software. https://www.tableau.com/ Accessed: 2023-09-02.
- Aarts et al. (2015) Alexander A. Aarts, Joanna E. Anderson, Christopher J. Anderson, Peter Raymond Attridge, Angela S. Attwood, et al. 2015. Estimating the reproducibility of psychological science. Science 349 (2015). https://api.semanticscholar.org/CorpusID:218065162
- Adadi and Berrada (2018) Amina Adadi and Mohammed Berrada. 2018. Peeking Inside the Black-Box: A Survey on Explainable Artificial Intelligence (XAI). IEEE Access 6 (2018), 52138–52160. https://api.semanticscholar.org/CorpusID:52965836
- Ashktorab et al. (2019) Zahra Ashktorab, Mohit Jain, Qingzi Vera Liao, and Justin D. Weisz. 2019. Resilient Chatbots: Repair Strategy Preferences for Conversational Breakdowns. Proceedings of the 2019 CHI Conference on Human Factors in Computing Systems (2019). https://api.semanticscholar.org/CorpusID:85503944
- Azam (2022) Md Waquar Azam. 2022. TELEVISION DATASET 2022. Kaggle. https://www.kaggle.com/datasets/mdwaquarazam/
- Baker (2016) Monya Baker. 2016. 1,500 scientists lift the lid on reproducibility. Nature 533 (2016), 452–454.
- Barke et al. (2022) Shraddha Barke, Michael B. James, and Nadia Polikarpova. 2022. Grounded Copilot: How Programmers Interact with Code-Generating Models. Proceedings of the ACM on Programming Languages 7 (2022), 85 – 111.
- Bathwal (2022) Shubham Bathwal. 2022. Flight Price Prediction. Kaggle. https://www.kaggle.com/datasets/shubhambathwal/flight-price-prediction
- Bender et al. (2021) Emily M. Bender, Timnit Gebru, Angelina McMillan-Major, and Shmargaret Shmitchell. 2021. On the Dangers of Stochastic Parrots: Can Language Models Be Too Big? Proceedings of the 2021 ACM Conference on Fairness, Accountability, and Transparency (2021). https://api.semanticscholar.org/CorpusID:232040593
- Boehner et al. (2007) Kirsten Boehner, Janet Vertesi, Phoebe Sengers, and Paul Dourish. 2007. How HCI interprets the probes. In Proceedings of the SIGCHI conference on Human factors in computing systems. 1077–1086.
- Bose (2022) Pranali Bose. 2022. Amazon Seller - Order Status Prediction. Kaggle. https://www.kaggle.com/datasets/pranalibose/amazon-seller-order-status-prediction
- Breznau et al. (2022) Nate Breznau, Eike Mark Rinke, Alexander Wuttke, Muna Adem, Jule Adriaans, et al. 2022. Observing many researchers using the same data and hypothesis reveals a hidden universe of uncertainty. Proceedings of the National Academy of Sciences of the United States of America 119 (2022).
- Brown et al. (2020) Tom B. Brown, Benjamin Mann, Nick Ryder, Melanie Subbiah, Jared Kaplan, et al. 2020. Language Models are Few-Shot Learners. ArXiv abs/2005.14165 (2020). https://api.semanticscholar.org/CorpusID:218971783
- Bubeck et al. (2023) Sébastien Bubeck, Varun Chandrasekaran, Ronen Eldan, John A. Gehrke, Eric Horvitz, et al. 2023. Sparks of Artificial General Intelligence: Early experiments with GPT-4. ArXiv abs/2303.12712 (2023).
- Chandel et al. (2022) Shubham Chandel, Colin B. Clement, Guillermo Serrato, and Neel Sundaresan. 2022. Training and Evaluating a Jupyter Notebook Data Science Assistant. ArXiv abs/2201.12901 (2022). https://api.semanticscholar.org/CorpusID:246430316
- Chattopadhyay et al. (2020) Souti Chattopadhyay, I. V. R. K. V. Prasad, Austin Z. Henley, Anita Sarma, and Titus Barik. 2020. What’s Wrong with Computational Notebooks? Pain Points, Needs, and Design Opportunities. Proceedings of the 2020 CHI Conference on Human Factors in Computing Systems (2020). https://api.semanticscholar.org/CorpusID:210927488
- Chen et al. (2021) Mark Chen, Jerry Tworek, Heewoo Jun, Qiming Yuan, Henrique Ponde, et al. 2021. Evaluating Large Language Models Trained on Code. ArXiv abs/2107.03374 (2021).
- Chowdhery et al. (2022) Aakanksha Chowdhery, Sharan Narang, Jacob Devlin, Maarten Bosma, Gaurav Mishra, et al. 2022. PaLM: Scaling Language Modeling with Pathways. ArXiv abs/2204.02311 (2022).
- Correll et al. (2018) Michael Correll, Mingwei Li, Gordon Kindlmann, and Carlos Scheidegger. 2018. Looks good to me: Visualizations as sanity checks. IEEE transactions on visualization and computer graphics 25, 1 (2018), 830–839.
- Crisan et al. (2020) Anamaria Crisan, Brittany Fiore-Gartland, and Melanie K. Tory. 2020. Passing the Data Baton : A Retrospective Analysis on Data Science Work and Workers. IEEE Transactions on Visualization and Computer Graphics 27 (2020), 1860–1870. https://api.semanticscholar.org/CorpusID:222351819
- DeLine (2021) Robert DeLine. 2021. Glinda: Supporting Data Science with Live Programming, GUIs and a Domain-specific Language. Proceedings of the 2021 CHI Conference on Human Factors in Computing Systems (2021). https://api.semanticscholar.org/CorpusID:233987681
- Devito et al. (2018) Michael Ann Devito, Jeremy P. Birnholtz, Jeffrey T. Hancock, Megan French, and Sunny Xun Liu. 2018. How People Form Folk Theories of Social Media Feeds and What it Means for How We Study Self-Presentation. Proceedings of the 2018 CHI Conference on Human Factors in Computing Systems (2018). https://api.semanticscholar.org/CorpusID:5048366
- Diamond-Reivich (2020) Jacob Diamond-Reivich. 2020. Mito: Edit a Spreadsheet. Generate Production Ready Python.. In LIVE: Workshop on Live Programming.
- Dibia (2023) Victor C. Dibia. 2023. LIDA: A Tool for Automatic Generation of Grammar-Agnostic Visualizations and Infographics using Large Language Models. ArXiv abs/2303.02927 (2023).
- Drosos et al. (2020) Ian Drosos, Titus Barik, Philip J. Guo, Robert DeLine, and Sumit Gulwani. 2020. Wrex: A Unified Programming-by-Example Interaction for Synthesizing Readable Code for Data Scientists. Proceedings of the 2020 CHI Conference on Human Factors in Computing Systems (2020). https://api.semanticscholar.org/CorpusID:212684638
- Ehsan and Riedl (2021) Upol Ehsan and Mark O. Riedl. 2021. Explainability Pitfalls: Beyond Dark Patterns in Explainable AI. ArXiv abs/2109.12480 (2021). https://api.semanticscholar.org/CorpusID:237940863
- Epperson et al. (2022) Will Epperson, Yi Wang, Robert DeLine, and Steven Mark Drucker. 2022. Strategies for Reuse and Sharing among Data Scientists in Software Teams. 2022 IEEE/ACM 44th International Conference on Software Engineering: Software Engineering in Practice (ICSE-SEIP) (2022), 243–252. https://api.semanticscholar.org/CorpusID:248726301
- Field et al. (2012) Andy P. Field, Jeremy Miles, and Zoë Field. 2012. Discovering statistics using R, 1st Edition. https://api.semanticscholar.org/CorpusID:45575760
- GitHub (2022) GitHub. 2022. GitHub Copilot. .https://github.com/features/copilot. Accessed: Sept 12, 2023.
- Grolemund and Wickham (2014) Garrett Grolemund and Hadley Wickham. 2014. A Cognitive Interpretation of Data Analysis. International Statistical Review 82 (2014). https://api.semanticscholar.org/CorpusID:53622653
- Gu et al. (2022) Ken Gu, Eunice Jun, and Tim Althoff. 2022. Understanding and Supporting Debugging Workflows in Multiverse Analysis. Proceedings of the 2023 CHI Conference on Human Factors in Computing Systems (2022). https://api.semanticscholar.org/CorpusID:252780673
- Guidotti et al. (2018) Riccardo Guidotti, Anna Monreale, Franco Turini, Dino Pedreschi, and Fosca Giannotti. 2018. A Survey of Methods for Explaining Black Box Models. ACM Computing Surveys (CSUR) 51 (2018), 1 – 42. https://api.semanticscholar.org/CorpusID:3342225
- Gulwani and Marron (2014) Sumit Gulwani and Mark Marron. 2014. NLyze: interactive programming by natural language for spreadsheet data analysis and manipulation. Proceedings of the 2014 ACM SIGMOD International Conference on Management of Data (2014). https://api.semanticscholar.org/CorpusID:13004424
- Hardy and Maurushat (2017) Keiran Hardy and Alana Maurushat. 2017. Opening up government data for Big Data analysis and public benefit. Comput. Law Secur. Rev. 33 (2017), 30–37. https://api.semanticscholar.org/CorpusID:63875487
- Head et al. (2019) Andrew Head, Fred Hohman, Titus Barik, Steven Mark Drucker, and Robert DeLine. 2019. Managing Messes in Computational Notebooks. Proceedings of the 2019 CHI Conference on Human Factors in Computing Systems (2019).
- Hoon et al. (2019) Gan Keng Hoon, Loo Ji Yong, and Goh Kau Yang. 2019. Interfacing Chatbot with Data Retrieval and Analytics Queries for Decision Making. Lecture Notes in Mechanical Engineering (2019). https://api.semanticscholar.org/CorpusID:198329911
- Jha (2022) Suraj Jha. 2022. BigBasket Entire Product List ( 28K datapoints). Kaggle. https://www.kaggle.com/datasets/surajjha101/bigbasket-entire-product-list-28k-datapoints
- Ji et al. (2022) Ziwei Ji, Nayeon Lee, Rita Frieske, Tiezheng Yu, Dan Su, et al. 2022. Survey of Hallucination in Natural Language Generation. Comput. Surveys 55 (2022), 1 – 38. https://api.semanticscholar.org/CorpusID:246652372
- Jiang et al. (2022) Ellen Jiang, Edwin Toh, Alejandra Molina, Kristen Olson, Claire Kayacik, et al. 2022. Discovering the Syntax and Strategies of Natural Language Programming with Generative Language Models. Proceedings of the 2022 CHI Conference on Human Factors in Computing Systems (2022). https://api.semanticscholar.org/CorpusID:248419806
- Jung et al. (2022) Jiyun Jung, Sihang Qiu, Alessandro Bozzon, and Ujwal Gadiraju. 2022. Great Chain of Agents: The Role of Metaphorical Representation of Agents in Conversational Crowdsourcing. Proceedings of the 2022 CHI Conference on Human Factors in Computing Systems (2022). https://api.semanticscholar.org/CorpusID:248419779
- Kandel et al. (2012) Sean Kandel, Andreas Paepcke, Joseph M. Hellerstein, and Jeffrey Heer. 2012. Enterprise Data Analysis and Visualization: An Interview Study. IEEE Transactions on Visualization and Computer Graphics 18 (2012), 2917–2926.
- Kandogan et al. (2014) Eser Kandogan, Aruna D. Balakrishnan, Eben M. Haber, and Jeffrey S. Pierce. 2014. From Data to Insight: Work Practices of Analysts in the Enterprise. IEEE Computer Graphics and Applications 34 (2014), 42–50. https://api.semanticscholar.org/CorpusID:6438612
- Kasica et al. (2020) Stephen Kasica, Charles Berret, and Tamara Munzner. 2020. Table Scraps: An Actionable Framework for Multi-Table Data Wrangling From An Artifact Study of Computational Journalism. IEEE Transactions on Visualization and Computer Graphics 27 (2020), 957–966. https://api.semanticscholar.org/CorpusID:221516111
- Kassel and Rohs (2018) Jan-Frederik Kassel and Michael Rohs. 2018. Valletto: A Multimodal Interface for Ubiquitous Visual Analytics. Extended Abstracts of the 2018 CHI Conference on Human Factors in Computing Systems (2018). https://api.semanticscholar.org/CorpusID:5083557
- Kery et al. (2017) Mary Beth Kery, Amber Horvath, and Brad A. Myers. 2017. Variolite: Supporting Exploratory Programming by Data Scientists. Proceedings of the 2017 CHI Conference on Human Factors in Computing Systems (2017). https://api.semanticscholar.org/CorpusID:2174858
- Kery et al. (2019) Mary Beth Kery, Bonnie E. John, Patrick O’Flaherty, Amber Horvath, and Brad A. Myers. 2019. Towards Effective Foraging by Data Scientists to Find Past Analysis Choices. Proceedings of the 2019 CHI Conference on Human Factors in Computing Systems (2019). https://api.semanticscholar.org/CorpusID:140210955
- Kery and Myers (2017) Mary Beth Kery and Brad A. Myers. 2017. Exploring exploratory programming. 2017 IEEE Symposium on Visual Languages and Human-Centric Computing (VL/HCC) (2017), 25–29. https://api.semanticscholar.org/CorpusID:21574188
- Kery et al. (2018) Mary Beth Kery, Marissa Radensky, Mahima Arya, Bonnie E. John, and Brad A. Myers. 2018. The Story in the Notebook: Exploratory Data Science using a Literate Programming Tool. Proceedings of the 2018 CHI Conference on Human Factors in Computing Systems (2018). https://api.semanticscholar.org/CorpusID:5060661
- Kery et al. (2020) Mary Beth Kery, Donghao Ren, Fred Hohman, Dominik Moritz, Kanit Wongsuphasawat, et al. 2020. mage: Fluid Moves Between Code and Graphical Work in Computational Notebooks. Proceedings of the 33rd Annual ACM Symposium on User Interface Software and Technology (2020). https://api.semanticscholar.org/CorpusID:221836345
- Khadpe et al. (2020) Pranav Khadpe, Ranjay Krishna, Fei-Fei Li, Jeffrey T. Hancock, and Michael S. Bernstein. 2020. Conceptual Metaphors Impact Perceptions of Human-AI Collaboration. Proceedings of the ACM on Human-Computer Interaction 4 (2020), 1 – 26. https://api.semanticscholar.org/CorpusID:221005643
- Khan (2022) Owais Khan. 2022. R.I.S.E. – Research. Innovate. Solve. copilot. Kaggle. https://www.kaggle.com/datasets/owaiskhan9654/rise-research-innovate-solve-copilot
- Kim et al. (2016) Miryung Kim, Thomas Zimmermann, Robert DeLine, and Andrew Begel. 2016. The Emerging Role of Data Scientists on Software Development Teams. 2016 IEEE/ACM 38th International Conference on Software Engineering (ICSE) (2016), 96–107. https://api.semanticscholar.org/CorpusID:7977224
- Kim et al. (2018) Miryung Kim, Thomas Zimmermann, Robert DeLine, and Andrew Begel. 2018. Data Scientists in Software Teams: State of the Art and Challenges. IEEE Transactions on Software Engineering 44 (2018), 1024–1038. https://api.semanticscholar.org/CorpusID:53280229
- Kim et al. (2022) Sunnie S. Y. Kim, Elizabeth Anne Watkins, Olga Russakovsky, Ruth C. Fong, and A. Monroy-Hernández. 2022. ”Help Me Help the AI”: Understanding How Explainability Can Support Human-AI Interaction. Proceedings of the 2023 CHI Conference on Human Factors in Computing Systems (2022). https://api.semanticscholar.org/CorpusID:252780815
- Klein et al. (2007) Gary Klein, Jennifer K. Phillips, Erica Rall, and Deborah A. Peluso. 2007. A Data–Frame Theory of Sensemaking.
- Ko et al. (2011) Amy J. Ko, Robin Abraham, Laura Beckwith, Alan F. Blackwell, Margaret M. Burnett, et al. 2011. The state of the art in end-user software engineering. ACM Computing Surveys (CSUR) 43 (2011), 1 – 44. https://api.semanticscholar.org/CorpusID:9435548
- Koesten et al. (2019) Laura M. Koesten, Kathleen Gregory, Paul T. Groth, and Elena Paslaru Bontas Simperl. 2019. Talking datasets: Understanding data sensemaking behaviours. Int. J. Hum. Comput. Stud. 146 (2019), 102562. https://api.semanticscholar.org/CorpusID:208176144
- Lachaux et al. (2020) Marie-Anne Lachaux, Baptiste Rozière, Lowik Chanussot, and Guillaume Lample. 2020. Unsupervised Translation of Programming Languages. ArXiv abs/2006.03511 (2020). https://api.semanticscholar.org/CorpusID:219401607
- Lai et al. (2022) Yuhang Lai, Chengxi Li, Yiming Wang, Tianyi Zhang, Ruiqi Zhong, et al. 2022. DS-1000: A Natural and Reliable Benchmark for Data Science Code Generation. ArXiv abs/2211.11501 (2022).
- Lakkaraju et al. (2022) Himabindu Lakkaraju, Dylan Slack, Yuxin Chen, Chenhao Tan, and Sameer Singh. 2022. Rethinking Explainability as a Dialogue: A Practitioner’s Perspective. ArXiv abs/2202.01875 (2022). https://api.semanticscholar.org/CorpusID:246607834
- Liang et al. (2023) Jenny Liang, Chenyang Yang, and Brad A. Myers. 2023. Understanding the Usability of AI Programming Assistants. ArXiv abs/2303.17125 (2023). https://api.semanticscholar.org/CorpusID:257833548
- Liao et al. (2020) Qingzi Vera Liao, Dan Gruen, and Sarah Miller. 2020. Questioning the AI: Informing Design Practices for Explainable AI User Experiences. Proceedings of the 2020 CHI Conference on Human Factors in Computing Systems (2020). https://api.semanticscholar.org/CorpusID:210064344
- Liao et al. (2021) Qingzi Vera Liao, Microsoft Research, Canada Kush, Richa Varshney, and Kush R. Varshney. 2021. Human-Centered Explainable AI (XAI): From Algorithms to User Experiences. ArXiv abs/2110.10790 (2021). https://api.semanticscholar.org/CorpusID:239050385
- Lin et al. (2022) Stephanie C. Lin, Jacob Hilton, and Owain Evans. 2022. Teaching Models to Express Their Uncertainty in Words. Trans. Mach. Learn. Res. 2022 (2022). https://api.semanticscholar.org/CorpusID:249191391
- Linardatos et al. (2020) Pantelis Linardatos, Vasilis Papastefanopoulos, and Sotiris B. Kotsiantis. 2020. Explainable AI: A Review of Machine Learning Interpretability Methods. Entropy 23 (2020). https://api.semanticscholar.org/CorpusID:229722844
- Liu et al. (2020) Jiali Liu, Nadia Boukhelifa, and James R. Eagan. 2020. Understanding the Role of Alternatives in Data Analysis Practices. IEEE Transactions on Visualization and Computer Graphics 26 (2020), 66–76.
- Liu et al. (2023b) Michael Xieyang Liu, Advait Sarkar, Carina Negreanu, Benjamin G. Zorn, J. Williams, et al. 2023b. “What It Wants Me To Say”: Bridging the Abstraction Gap Between End-User Programmers and Code-Generating Large Language Models. Proceedings of the 2023 CHI Conference on Human Factors in Computing Systems (2023). https://api.semanticscholar.org/CorpusID:258107840
- Liu et al. (2019) Yang Liu, Tim Althoff, and Jeffrey Heer. 2019. Paths Explored, Paths Omitted, Paths Obscured: Decision Points & Selective Reporting in End-to-End Data Analysis. Proceedings of the 2020 CHI Conference on Human Factors in Computing Systems (2019).
- Liu et al. (2023a) Yang Liu, Dan Iter, Yichong Xu, Shuo Wang, Ruochen Xu, et al. 2023a. G-Eval: NLG Evaluation using GPT-4 with Better Human Alignment. ArXiv abs/2303.16634 (2023). https://api.semanticscholar.org/CorpusID:257804696
- Louie et al. (2020) Ryan Louie, Andy Coenen, Cheng-Zhi Anna Huang, Michael Terry, and Carrie J. Cai. 2020. Novice-AI Music Co-Creation via AI-Steering Tools for Deep Generative Models. Proceedings of the 2020 CHI Conference on Human Factors in Computing Systems (2020). https://api.semanticscholar.org/CorpusID:218482503
- Luger and Sellen (2016) Ewa Luger and Abigail Sellen. 2016. ”Like Having a Really Bad PA”: The Gulf between User Expectation and Experience of Conversational Agents. Proceedings of the 2016 CHI Conference on Human Factors in Computing Systems (2016). https://api.semanticscholar.org/CorpusID:1036498
- Mcnutt et al. (2023) Andrew M Mcnutt, Chenglong Wang, Robert DeLine, and Steven Mark Drucker. 2023. On the Design of AI-powered Code Assistants for Notebooks. Proceedings of the 2023 CHI Conference on Human Factors in Computing Systems (2023). https://api.semanticscholar.org/CorpusID:256274637
- Mishra and Nouri (2022) Swaroop Mishra and Elnaz Nouri. 2022. HELP ME THINK: A Simple Prompting Strategy for Non-experts to Create Customized Content with Models. ArXiv abs/2208.08232 (2022).
- Navarro (2022) Chadner Navarro. 2022. Travel+Leisure World’s Best Hotels 2022. Kaggle. https://www.kaggle.com/datasets/narmelan/travelleisure-worlds-best-hotels-2022
- ObservableHQ (2023) ObservableHQ. 2023. Summary Table. https://observablehq.com/@observablehq/summary-table Accessed: July 30, 2023.
- Olausson et al. (2023) Theo X. Olausson, Jeevana Priya Inala, Chenglong Wang, Jianfeng Gao, and Armando Solar-Lezama. 2023. Demystifying GPT Self-Repair for Code Generation. ArXiv abs/2306.09896 (2023). https://api.semanticscholar.org/CorpusID:259187989
- OpenAI (2022) OpenAI. 2022. ChatGPT: Conversational AI Language Model. https://chat.openai.com. Accessed on June 1, 2023.
- OpenAI (2023a) OpenAI. 2023a. Chat with GPT-4 Code Interpreter. https://chat.openai.com/?model=gpt-4-code-interpreter. Accessed August 26, 2023.
- OpenAI (2023b) OpenAI. 2023b. GPT-4 Technical Report. ArXiv abs/2303.08774 (2023).
- Özcan et al. (2020) Fatma Özcan, Abdul Quamar, Jaydeep Sen, Chuan Lei, and Vasilis Efthymiou. 2020. State of the Art and Open Challenges in Natural Language Interfaces to Data. Proceedings of the 2020 ACM SIGMOD International Conference on Management of Data (2020). https://api.semanticscholar.org/CorpusID:218881987
- Parasuraman and Manzey (2010) Raja Parasuraman and Dietrich Manzey. 2010. Complacency and Bias in Human Use of Automation: An Attentional Integration. Human Factors: The Journal of Human Factors and Ergonomics Society 52 (2010), 381 – 410. https://api.semanticscholar.org/CorpusID:2279803
- Perry and Mallick (2023) Chris Perry and Shrestha Basu Mallick. 2023. AI-powered coding, free of charge with Colab. https://blog.google/technology/developers/google-colab-ai-coding-features/
- Pirolli (2007) Peter Pirolli. 2007. The Sensemaking Process and Leverage Points for Analyst Technology as Identified Through Cognitive Task Analysis.
- Pu et al. (2021) Xiaoying Pu, Sean Kross, Jake M. Hofman, and Daniel G. Goldstein. 2021. Datamations: Animated Explanations of Data Analysis Pipelines. Proceedings of the 2021 CHI Conference on Human Factors in Computing Systems (2021). https://api.semanticscholar.org/CorpusID:233987105
- Ragavan et al. (2022) Sruti Srinivasa Srinivasa Ragavan, Zhitao Hou, Yun Wang, Andrew D. Gordon, Haidong Zhang, et al. 2022. GridBook: Natural Language Formulas for the Spreadsheet Grid. 27th International Conference on Intelligent User Interfaces (2022). https://api.semanticscholar.org/CorpusID:247585151
- Rana (2022) Shivani Rana. 2022. Bollywood Movies Box-Office Collection 2022. Kaggle. https://www.kaggle.com/datasets/shivanirana63/bollywood-movies-boxoffice-collection-2022
- Ross et al. (2021) Andrew Slavin Ross, Nina Chen, Elisa Zhao Hang, Elena L. Glassman, and Finale Doshi-Velez. 2021. Evaluating the Interpretability of Generative Models by Interactive Reconstruction. Proceedings of the 2021 CHI Conference on Human Factors in Computing Systems (2021). https://api.semanticscholar.org/CorpusID:231749921
- Rule et al. (2018) Adam Rule, Aurélien Tabard, and James D. Hollan. 2018. Exploration and Explanation in Computational Notebooks. Proceedings of the 2018 CHI Conference on Human Factors in Computing Systems (2018). https://api.semanticscholar.org/CorpusID:5048947
- Russell et al. (1993) Daniel M. Russell, Mark Stefik, Peter Pirolli, and Stuart K. Card. 1993. The cost structure of sensemaking. Proceedings of the INTERACT ’93 and CHI ’93 Conference on Human Factors in Computing Systems (1993). https://api.semanticscholar.org/CorpusID:207177544
- Sarkar et al. (2022) Advait Sarkar, Andrew D. Gordon, Carina Negreanu, Christian Poelitz, Sruti Srinivasa Ragavan, et al. 2022. What is it like to program with artificial intelligence?. In Annual Workshop of the Psychology of Programming Interest Group. https://api.semanticscholar.org/CorpusID:251554706
- Schweinsberg et al. (2021) Martin Schweinsberg, Michael Feldman, Nicola Staub, Olmo van den Akker, Robbie C. M. Aert, et al. 2021. Same data, different conclusions: Radical dispersion in empirical results when independent analysts operationalize and test the same hypothesis. Organizational Behavior and Human Decision Processes (2021).
- Setlur and Tory (2022) Vidya Setlur and Melanie K. Tory. 2022. How do you Converse with an Analytical Chatbot? Revisiting Gricean Maxims for Designing Analytical Conversational Behavior. Proceedings of the 2022 CHI Conference on Human Factors in Computing Systems (2022). https://api.semanticscholar.org/CorpusID:247054720
- Silberzahn et al. (2018) Raphael Silberzahn, Eric Luis Uhlmann, Daniel P. Martin, Pasquale Anselmi, Frederik Aust, et al. 2018. Many Analysts, One Data Set: Making Transparent How Variations in Analytic Choices Affect Results. Advances in Methods and Practices in Psychological Science 1 (2018), 337 – 356.
- Soeiro (2022) Victor Soeiro. 2022. Netflix TV Shows and Movies. Kaggle. https://www.kaggle.com/datasets/victorsoeiro/netflix-tv-shows-and-movies
- Stallbaumer (2023) Colette Stallbaumer. 2023. Introducing Microsoft 365 Copilot—A whole new way to work. https://www.microsoft.com/en-us/microsoft-365/blog/2023/03/16/introducing-microsoft-365-copilot-a-whole-new-way-to-work/
- Sun et al. (2022) Jiao Sun, Qingzi Vera Liao, Michael J. Muller, Mayank Agarwal, Stephanie Houde, et al. 2022. Investigating Explainability of Generative AI for Code through Scenario-based Design. 27th International Conference on Intelligent User Interfaces (2022). https://api.semanticscholar.org/CorpusID:246705915
- Suzan and Samrin (2022) Md Mahmudul Hasan Suzan and Nishat Ahmed Samrin. 2022. Students Adaptability Level in Online Education. Kaggle. https://www.kaggle.com/datasets/mdmahmudulhasansuzan/students-adaptability-level-in-online-education
- Ubaldi (2013) Barbara Ubaldi. 2013. Open Government Data: Towards Empirical Analysis of Open Government Data Initiatives. https://api.semanticscholar.org/CorpusID:260737241
- Unknown (2023) Unknown. 2023. Create Models and Automate Data Workflows with AI. https://www.datagran.io
- Vaithilingam et al. (2022) Priyan Vaithilingam, Tianyi Zhang, and Elena L. Glassman. 2022. Expectation vs. Experience: Evaluating the Usability of Code Generation Tools Powered by Large Language Models. CHI Conference on Human Factors in Computing Systems Extended Abstracts (2022). https://api.semanticscholar.org/CorpusID:247255943
- Vasconcelos et al. (2023) Helena Vasconcelos, Gagan Bansal, Adam Fourney, Qingzi Vera Liao, and Jennifer Wortman Vaughan. 2023. Generation Probabilities Are Not Enough: Exploring the Effectiveness of Uncertainty Highlighting in AI-Powered Code Completions. ArXiv abs/2302.07248 (2023). https://api.semanticscholar.org/CorpusID:256846746
- Wang et al. (2022) April Yi Wang, Will Epperson, Robert DeLine, and Steven Mark Drucker. 2022. Diff in the Loop: Supporting Data Comparison in Exploratory Data Analysis. Proceedings of the 2022 CHI Conference on Human Factors in Computing Systems (2022). https://api.semanticscholar.org/CorpusID:248419893
- Wang et al. (2019) April Yi Wang, Anant Mittal, Christopher A. Brooks, and Steve Oney. 2019. How Data Scientists Use Computational Notebooks for Real-Time Collaboration. Proceedings of the ACM on Human-Computer Interaction 3 (2019), 1 – 30. https://api.semanticscholar.org/CorpusID:207946488
- Wang et al. (2023) Fengjie Wang, Xuye Liu, Oujing Liu, Ali Neshati, Tengfei Ma, et al. 2023. Slide4N: Creating Presentation Slides from Computational Notebooks with Human-AI Collaboration. Proceedings of the 2023 CHI Conference on Human Factors in Computing Systems (2023). https://api.semanticscholar.org/CorpusID:258216753
- Wickens et al. (2015) Christopher D. Wickens, Benjamin A. Clegg, Alex Z. Vieane, and Angelia Sebok. 2015. Complacency and Automation Bias in the Use of Imperfect Automation. Human Factors: The Journal of Human Factors and Ergonomics Society 57 (2015), 728 – 739. https://api.semanticscholar.org/CorpusID:12243641
- Wu et al. (2020) Yifan Wu, Joseph M. Hellerstein, and Arvind Satyanarayan. 2020. B2: Bridging Code and Interactive Visualization in Computational Notebooks. Proceedings of the 33rd Annual ACM Symposium on User Interface Software and Technology (2020). https://api.semanticscholar.org/CorpusID:221492874
- Xiong et al. (2022) Kai Xiong, Siwei Fu, Guoming Ding, Zhongsu Luo, Rong Yu, et al. 2022. Visualizing the Scripts of Data Wrangling with SOMNUS. IEEE Transactions on Visualization and Computer Graphics PP (2022), 1–1. https://api.semanticscholar.org/CorpusID:246287020
- Xu et al. (2021) Frank F. Xu, Bogdan Vasilescu, and Graham Neubig. 2021. In-IDE Code Generation from Natural Language: Promise and Challenges. ACM Transactions on Software Engineering and Methodology (TOSEM) 31 (2021), 1 – 47. https://api.semanticscholar.org/CorpusID:231718679
- Yin et al. (2022) Pengcheng Yin, Wen-Ding Li, Kefan Xiao, A. Eashaan Rao, Yeming Wen, et al. 2022. Natural Language to Code Generation in Interactive Data Science Notebooks. ArXiv abs/2212.09248 (2022). https://api.semanticscholar.org/CorpusID:254854112
- Zamfirescu-Pereira et al. (2023) J.D. Zamfirescu-Pereira, Richmond Y. Wong, Bjoern Hartmann, and Qiang Yang. 2023. Why Johnny Can’t Prompt: How Non-AI Experts Try (and Fail) to Design LLM Prompts. Proceedings of the 2023 CHI Conference on Human Factors in Computing Systems (2023). https://api.semanticscholar.org/CorpusID:258217984
- Zhang and Banovic (2021) Enhao Zhang and Nikola Banovic. 2021. Method for Exploring Generative Adversarial Networks (GANs) via Automatically Generated Image Galleries. Proceedings of the 2021 CHI Conference on Human Factors in Computing Systems (2021). https://api.semanticscholar.org/CorpusID:233987602
- Zheng et al. (2022) Chengbo Zheng, Dakuo Wang, April Yi Wang, and Xiaojuan Ma. 2022. Telling Stories from Computational Notebooks: AI-Assisted Presentation Slides Creation for Presenting Data Science Work. Proceedings of the 2022 CHI Conference on Human Factors in Computing Systems (2022). https://api.semanticscholar.org/CorpusID:247594488
- Zhi and Metoyer (2020) Qiyu Zhi and Ronald A. Metoyer. 2020. GameBot: A Visualization-augmented Chatbot for Sports Game. Extended Abstracts of the 2020 CHI Conference on Human Factors in Computing Systems (2020). https://api.semanticscholar.org/CorpusID:216611752
- Ziegler et al. (2022) Albert Ziegler, Eirini Kalliamvakou, Shawn Simister, Ganesh Sittampalam, Alice Li, et al. 2022. Productivity assessment of neural code completion. Proceedings of the 6th ACM SIGPLAN International Symposium on Machine Programming (2022). https://api.semanticscholar.org/CorpusID:248798468
Appendix A Example of Dataset Summary used for GPT-4 Prompt
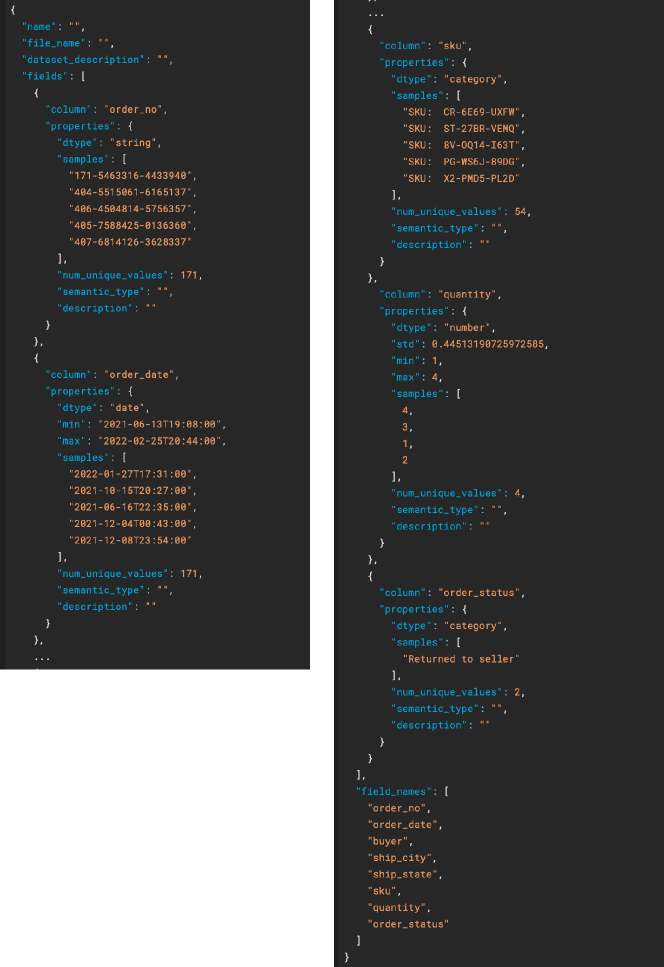
Appendix B Example Interface In The User Study
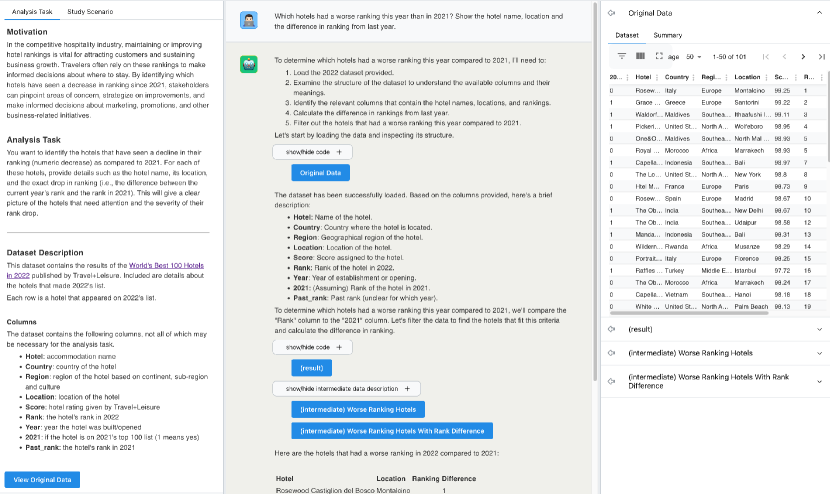
Appendix C Participants’ Verification Processes
| Verification Processes | Count | Occurrences |
|---|---|---|
| S — PD — C | 11 | T4 [P10], T6 [P10, P20, P8], T9 [P10, P11, P21], T3 [P2, P22], T8 [P7], T7 [P8] |
| S — PD — N — D — C | 7 | T1 [P1], T2 [P12, P5], T4 [P2], T8 [P22], T10 [P22], T9 [P6] |
| S — PD — N — C | 5 | T5 [P10, P14], T2 [P2], T4 [P6], T1 [P7] |
| S — PD — N — PD — C | 5 | T3 [P12, P5], T7 [P12], T10 [P20], T6 [P4] |
| S — DP — N — D — C | 3 | T4 [P15], T7 [P16], T9 [P9] |
| S — PD — N — DP — N — C | 2 | T2 [P1], T10 [P13] |
| S — P — N — PD — C | 2 | T8 [P11], T5 [P8] |
| S — DP — C | 2 | T5 [P17], T1 [P20] |
| S — P — N — P — C | 2 | T7 [P4, P6] |
| S — DP — N — PD — C | 1 | T3 [P1] |
| S — PD — D — C | 1 | T9 [P13] |
| S — PD — N — PD — N — D — C | 1 | T6 [P14] |
| S — D — DP — C | 1 | T1 [P15] |
| S — P — N — DP — C | 1 | T6 [P17] |
| S — PD — R | 1 | T9 [P18] |
| S — D — C | 1 | T8 [P19] |
| S — DP — PD — N — P — PD — C | 1 | T9 [P19] |
| S — PD — N — DP — C | 1 | T4 [P21] |
| S — D — N — DP — R | 1 | T7 [P3] |
| S — P — N — PD — N — D — C | 1 | T5 [P4] |
| S — PD — R | 1 | T8 [P5] |
| S — D — N — PD — C | 1 | T10 [P7] |