Impact of M-dwarf Stellar Wind and Photoevaporation on the Atmospheric Evolution of Small Planets
Abstract
The evolution of a planet’s atmosphere depends strongly on its host star’s properties. When their host stars are younger, planets can experience stronger winds and EUV emissions. This is particularly true for planets orbiting M-dwarfs due to their close proximity to the host star. To determine if these planets retain an atmosphere, we consider the impacts from stellar wind and EUV fluxes in driving atmospheric escape throughout the planet’s lifetime. For this, we determined the atmospheric mass loss due to stellar wind and photoevaporation on 4 planets in close orbit and 34 in their star’s habitable zone (HZ). The M-dwarf host stars’ wind velocity, density, and EUV flux were calculated through rotation period and X-ray flux scaling over time. The mass loss rate due to stellar wind and photoevaporation was then computed as a function of time and accumulated throughout the planet’s age to determine the total atmospheric mass loss of the planet’s initial H/He envelope. We find that for HZ planets at orbits 0.1 AU, stellar wind can only remove of the H/He envelope, while photoevaporation is essential for completely removing the H/He envelope of most targets. Moreover, due to either mechanism, most planets orbiting at 0.1 AU do not have their primordial envelope stripped. Overall, out of the 38 planets studied, 13 were predicted to have lost the primordial envelope due to photoevaporation, while 2 planets lost the envelope due to both stellar wind and photoevaporation.
keywords:
planets and satellites: atmospheres – planetary systems – stars: winds, outflows1 Introduction
Most of the recent attention in the exoplanet community has been focused on planets around M dwarfs, the most common type of star within the Milky Way. M dwarf stars are excellent targets for detecting small planets because the photometric transit depths are larger due to the smaller star-to-planet mass and size ratios, respectively (Shields et al., 2016). This imply that a transit signal of a small planet orbiting a M dwarf is relatively more significant than Sun-like stars. The Kepler mission has shown that these cool stars typically have terrestrial planets orbiting them, with the planetary radius ranging from 0.5-3R⊕. Also, most of the planets detected in the Habitable Zone (HZ) are orbiting M dwarfs (Shields et al., 2016) in which HZ is defined as the circumstellar region in which a terrestrial planet can sustain liquid water on its surface (Hart, 1978; Kasting et al., 1993; Kopparapu et al., 2013).
However, being inside the HZ does not necessarily mean that the planets are conducive to life formation. Planets around M dwarfs are in much closer orbit and will experience more effects from the stellar winds and Extreme Ultraviolet Radiation (EUV or XUV) fluxes. This can significantly impact the retention of an atmosphere on the planet, which is one of the prerequisites for habitability (Lammer et al., 2009). The star’s evolution is therefore crucial in defining the outcome of the planetary atmosphere and, consequently, its capability to develop life (Davis & Wheatley, 2009).
At the beginning of a planetesimal’s lifetime, while a gas disk is still present, the rocky core can accumulate hydrogen and helium, forming a thick primordial atmosphere. More massive cores will accrete larger envelopes (Stökl et al., 2016), resulting in pressures and temperatures incompatible with liquid water. However, this envelope can be removed by interaction with the planet’s host star. Removing a primordial envelope can leave a bare core, requiring other processes such as volcanic or mantle out-gassing to establish a secondary atmosphere (Kite & Barnett, 2020; Swain et al., 2021). If an envelope is not entirely removed but is reduced to a mass fraction of , pressures potentially compatible with liquid water could exist (Pierrehumbert & Gaidos, 2011). Observational evidence of the host star’s influence in shaping the planet’s atmosphere can be seen in the planetary size distribution of small planets. This distribution exhibits an “evaporation valley" (Fulton et al., 2017), which could be caused by the photoevaporation of the planetary atmosphere due to high stellar EUV fluxes in the first million years of the planetary lifetime, when the star is more active (Owen & Wu, 2013; Jin et al., 2014; Lopez & Fortney, 2013a; Howe et al., 2014a; Howe & Burrows, 2015a; Rogers, 2015a; Owen & Wu, 2017a; Van Eylen et al., 2018a)or by core-powered mass loss (Gupta & Schlichting, 2020).
Atmospheric erosion can also be induced by stellar wind, a stream of charged particles released from the host star’s upper atmosphere (corona). In our Solar System, empirical evidence suggests that the solar wind constituted one of the dominant atmospheric loss mechanisms in early Earth, Mars, and Venus (Catling & Kasting, 2017). Stellar winds can also vary in density, temperature, and speed over time. Assessing the possible atmospheric effects of the stellar wind over long timescales requires knowledge of the stellar activity evolution. At younger ages, stars typically lose more mass, creating intense stellar winds that could significantly impact the planet’s conditions early on (Ribas et al., 2005; Grießmeier et al., 2009). However, as the star loses angular momentum over time, the rotation period will increase, and the X-ray flux will decay, decreasing the stellar mass loss (Irwin et al., 2007).
Other studies such as Cohen et al. (2015), Tanaka et al. (2014), Trammell et al. (2014), and Erkaev et al. (2017) have utilized 3D MHD models to compute the atmospheric loss of planets. However, because these more complex models are time-intensive, here we used a simple 1D analytical model to build a comprehensive population study of M-dwarf HZ planets. Previous works have used 1D models to study the effects of stellar winds (e.g. Zendejas et al., 2010) on planetary atmospheres through time. In this study, we use a similar approach by scaling the stellar rotation period with the X-ray flux. However, the evolution of planetary mass and radius are also considered. Further, by conducting a population analysis, we shed light on the transition from primordial to secondary atmospheres by analyzing whether close-in and HZ planets could have lost a primordial envelope during their lifetime.
Given the importance of the stellar wind and photoevaporation in defining the possible outcome of the planetary atmosphere, we analyze the influence of these mechanisms in driving atmospheric mass loss of the initial atmospheric content on small planets around M-dwarf stars. Here we assume time-dependent and un-magnetized planetary escape models due to stellar wind and photoevaporation, reflecting the system’s evolution with age. The stellar wind and photoevaporation atmospheric escape models are described in Section 2. Our results from the modeling are illustrated in Section 3. In Section 4, we discuss the model and results further. In Section 5, we present the conclusions.
2 Methods
2.1 Planet and stellar population in study
Since the presence of an atmosphere is essential for habitability, in this work, we have analyzed 34 planets in the HZ of their M dwarf host star. Additionally, we included 4 planets (GJ 1132 b, GJ 1214 b, Kepler-138d, and K2-3c) that are in close-in orbits. From the combined sample, 8 of the planets currently have observations with the Hubble Space Telescope (HST) using the transmission spectroscopy technique (GJ-1132b, LHS 1140b, K2-18b, GJ 1214 b, and Trappist-1 (d-g)). Understanding the processes that shape these planets’ atmosphere evolution is crucial to contextualize the current observations. Based on their density, mass, and radius, these planets can be classified as terrestrial, sub-Neptunes, or in the transition region between terrestrials and sub-Neptunes. The parameters of the planets and their host stars are shown in Tables 1 and 2, respectively. All observational parameters (mass, radius, orbital distance) of each planet were taken from the “Planetary systems composite” data of the NASA Exoplanet Archive. It is important to note that the data drawn from the NASA exoplanet archive planetary systems composite data may not be self-consistent if the parameters were drawn from multiple sources. The data in this archive combines parameters obtained from different sources, and when there is no mass or radius available, it calculates these values with a mass-radius relationship. We indicate in Table 1 the targets in our sample that had their parameters (mass or radius) estimated using a mass-radius relationship.
| Planet name |
|
|
|
|
|||||||||
|---|---|---|---|---|---|---|---|---|---|---|---|---|---|
| GJ 1061 c | 1.74 0.23 | 1.18* | 0.0350.001 | 30410.10 | |||||||||
| GJ 1061 d | 1.64 0.23 | 1.16* | 0.0540.001 | 2458.13 | |||||||||
| GJ 1132 b | 1.66 0.23 | 1.300.05 | 0.01530.0005 | 5299 | |||||||||
| GJ 1214 b | 8.170.43 | 2.740.05 | 0.014900.00026 | 59619 | |||||||||
| GJ 163 c | 6.800.9 | 2.50* | 0.12540.0001 | 3048.7 | |||||||||
| GJ 180 c | 6.403.7 | 2.41* | 0.1290.017 | 2898.5 | |||||||||
| GJ 229 A c | 7.270.67 | 2.60* | 0.38420.0051 | 2447.9 | |||||||||
| GJ 273 b | 2.890.27 | 1.51* | 0.911010.000019 | 2924.2 | |||||||||
| GJ 3293 d | 7.601.05 | 2.67* | 0.193940.000017 | 2513.4 | |||||||||
| GJ 357 d | 6.101.0 | 2.34* | 0.2040.015 | 2266 | |||||||||
| GJ 667 C c | 3.801.5 | 1.77* | 0.1250.012 | 2783.9 | |||||||||
| GJ 667 C e | 2.701.6 | 1.45* | 0.2130.019 | 2133 | |||||||||
| GJ 667 C f | 2.701.4 | 1.45* | 0.1560.017 | 2493.5 | |||||||||
| GJ 682 b | 4.403.7 | 1.93* | 0.0800.014 | 2154.66 | |||||||||
| GJ 832 c | 5.401.0 | 2.18* | 0.1610.017 | 2867.92 | |||||||||
| K2-18 b | 8.921.7 | 2.370.22 | 0.14290.0065 | 30315 | |||||||||
| K2-288 B b | 4.27* | 1.900.3 | 0.1640.030 | 23422 | |||||||||
| K2-3 c | 3.101.08 | 1.770.10 | 0.13450.0016 | 3747 | |||||||||
| K2-3 d | 2.80* | 1.530.11 | 0.20970.0070 | 28224 | |||||||||
| K2-72 e | 2.21* | 1.290.14 | 0.1060.013 | 3077.4 | |||||||||
| K2-9 b | 5.69* | 2.250.96 | 0.0910.016 | 31667 | |||||||||
| Kepler-1229 b | 2.54* | 1.400.13 | 0.30060.0091 | 21719 | |||||||||
| Kepler-186 f | 1.71* | 1.170.08 | 0.4320.171 | 1984.76 | |||||||||
| Kepler-138 d | 0.640.67 | 1.210.08 | 0.127810.00456 | 3434.38 | |||||||||
| Kepler-1649 c | 1.20* | 1.060.15 | 0.0649* | 30320 | |||||||||
| Kepler-1652 b | 3.19* | 1.600.18 | 0.16540.0042 | 27627 | |||||||||
| Kepler-296 e | 2.96* | 1.530.27 | 0.1690.029 | 28218 | |||||||||
| Kepler-296 f | 3.89* | 1.800.31 | 0.2550.043 | 22915 | |||||||||
| Kepler-705 b | 5.10* | 2.110.10 | 0.23200.0037 | 26921 | |||||||||
| LHS 1140 b | 6.380.46 | 1.640.05 | 0.09570.0019 | 2224 | |||||||||
| Proxima Cen b | 1.270.19 | 1.08* | 0.04850.0051 | 2576 | |||||||||
| Ross 128 b | 1.400.21 | 1.11* | 0.04960.0017 | 3095.81 | |||||||||
| TOI-700 d | 1.57* | 1.140.06 | 0.16330.0026 | 2788 | |||||||||
| TRAPPIST-1 d | 0.390.01 | 0.790.01 | 0.022270.00019 | 2966 | |||||||||
| TRAPPIST-1 e | 0.690.02 | 0.920.01 | 0.029250.00250 | 2585 | |||||||||
| TRAPPIST-1 f | 1.040.03 | 1.050.01 | 0.038490.00033 | 2254 | |||||||||
| TRAPPIST-1 g | 1.320.04 | 1.130.02 | 0.046830.00040 | 2044 | |||||||||
| Wolf 1061 c | 3.410.43 | 1.66* | 0.08900.0031 | 3064.4 |
| Host star name | Spectral type |
|
|
||||
|---|---|---|---|---|---|---|---|
| GJ 1061 | M5.5V | 0.16 | 0.12 | ||||
| GJ 1132 | M3.5V | 0.21 | 0.18 | ||||
| GJ 1214 | M4.5V | 0.22 | 0.15 | ||||
| GJ 163 | M5.5V | 0.41 | 0.4 | ||||
| GJ 180 | M2 V | 0.41 | 0.43 | ||||
| GJ 229 A | M1.5V | 0.46 | 0.58 | ||||
| GJ 273 | M3.5V | 0.29 | 0.29 | ||||
| GJ 3293 | M2.5V | 0.4 | 0.42 | ||||
| GJ 357 | M2.5V | 0.34 | 0.34 | ||||
| GJ 667 C | M1.5V | 0.42 | 0.33 | ||||
| GJ 682 | M3.5V | 0.3 | 0.27 | ||||
| GJ 832 | M1.5V | 0.44 | 0.45 | ||||
| K2-18 | M2.5V | 0.41 | 0.36 | ||||
| K2-288 B | M3V | 0.32 | 0.33 | ||||
| K2-3 | M0V | 0.56 | 0.6 | ||||
| K2-72 | M2.5V | 0.33 | 0.27 | ||||
| K2-9 | M2.5V | 0.31 | 0.3 | ||||
| Kepler-1229 | M0V | 0.51 | 0.54 | ||||
| Kepler-186 | M1V | 0.52 | 0.54 | ||||
| Kepler-138 | M1V | 0.44 | 0.52 | ||||
| Kepler-1649 | M5V | 0.23 | 0.2 | ||||
| Kepler-1652 | M2V | 0.38 | 0.4 | ||||
| Kepler-296 | M2V | 0.48 | 0.5 | ||||
| Kepler-705 | M2V | 0.51 | 0.53 | ||||
| LHS 1140 | M4.5V | 0.21 | 0.19 | ||||
| Proxima Cen | M5.5V | 0.14 | 0.12 | ||||
| Ross 128 | M4V | 0.2 | 0.17 | ||||
| TOI-700 | M2V | 0.42 | 0.41 | ||||
| TRAPPIST-1 | M8V | 0.12 | 0.09 | ||||
| Wolf 1061 | M3.5V | 0.31 | 0.29 |
2.2 Time-dependent atmospheric escape
We have carried out the time-dependent atmospheric erosion considering two escape processes: stellar wind and photoevaporation. These models are detailed in the subsections below. For both processes, we compute the cumulative atmospheric mass loss backward in time (Section 2.2.5), together with the evolution of the planetary mass and radius. To determine if the planet could have lost its envelope, we determine a threshold which is given by an estimated primordial envelope (Section 2.2.6).
2.2.1 Stellar wind velocity
The stellar wind velocity was determined from the extrapolation of the “Parker wind” applied to the cool dwarfs (Parker, 1958). The hydrodynamic equation of a wind assuming a steady flow is given by:
| (1) |
For a steadily expanding wind, the momentum equation that describes the acceleration of the gas due to a pressure gradient and gravity:
| (2) |
where is velocity, is orbital radius, is the gravitational constant, is mass, is density, and P is pressure. We are assuming a perfect gas, P = RT/ where R is the gas constant and is the mean atomic weight.
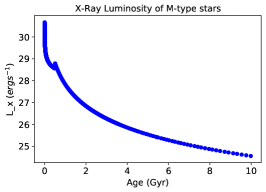
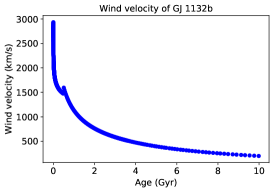
There are several solutions for the momentum equation, however, the only physical one is the sub-sonic, which passes through the critical point r=rc at the sonic radius , and increases for larger distances. The terminal velocity of the wind (vw) is equal to the constant sound speed , in which is the coronal temperature. In this solution, the wind is spherically symmetric and isothermal and thus has a nearly constant temperature through the inner regions of the corona. To compute the coronal temperature of the stars, we use a relationship between the coronal temperature and the X-ray flux (Fx) of the star given by T = 0.11 F (Johnstone & Güdel, 2015), where is in MK and in erg s-1 cm-2. The stellar X-ray flux (Fx) is calculated through time using the X-rays luminosity (Lx) from Engle & Guinan (2018) based on observations of M dwarfs stars, as shown in Figure 1. The relationship between Fx and Lx is given by .
The following relationships based on data from Engle & Guinan (2018) were used to scale X-ray luminosity with time, where is the age of the star:
| (3) | |||
| (4) |
By rearranging and integrating the momentum equation results in:
| (5) |
where is the constant of the integration and is equal to -3 in the transonic solution. For large (), we have , whereas for small (), . An example of scaling the X-ray fluxes and wind velocity overtime for GJ 1132 b is shown in Fig. 1.
2.2.2 Stellar wind density
Wind densities of stars other than our Sun have not been observationally constrained yet. As an approximation, the electron density derived from observations of the Sun by Leblanc et al. (1998) is used to model the solar wind throughout interplanetary space. The density in terms of the radial distance (r) from the Sun is given by:
| (6) |
This equation was adapted so that data near Earth and estimates of the coronal density, , matched better:
| (7) |
where cm-3.
To estimate the wind density over time for other stars, Eq. 7 was scaled with the rotation period of the star, as a proxy for the stellar age (Vidotto & Cleary, 2020):
| (8) |
Stars lose their angular momentum with time, resulting in the lengthening of their rotation periods with age. Therefore, to provide a more accurate analysis of atmospheric escape through time, it is crucial to consider the evolution of the rotation period. We use the rotation period-age relationship from Engle & Guinan (2018) according to each M dwarf type, where is the age of the star:
| (9) |
| (10) |
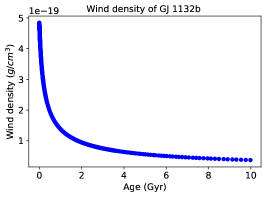
These relationships are less precise for younger ages ( 0.8 Gyrs) because there is a wide scatter in the range of rotation period rates for early ages, which prevents the establishment of a clear trend in the rotation period-age plane (Popinchalk et al., 2021). This leads to unrealistic values of rotation period at ages 0.2 Gyrs using Eq. 10, and therefore we perform our calculations for M0V stars starting at 0.2 Gyr. Stars that do not fall into the spectral ranges in Eqs. 9 & 10 were grouped into the closest category. For stars with spectral type M6V, we kept the rotation period constant, as they likely do not experience the same decay. These stars appear to show rapid rotations through intermediate and advanced ages (Mohanty & Basri, 2003; Reiners & Basri, 2010). For example, Trappist-1 (an active M8-type star) has a rotation period of 1.400.05 days (Gillon et al., 2016) and an age of 7.6 ±2.2 Gyr (Burgasser & Mamajek, 2017). An example of scaling wind density over time is shown in Fig. 1 for the star GJ 1132. The stellar mass loss over time due to the stripping of the stellar envelope by the winds are also considered. To model this effect, we compute the mass loss of the star at the current age and add the mass back in time to the stellar mass at intervals of Gyr.
2.2.3 Atmospheric mass loss due to stellar wind
Once the wind density and velocity have been estimated, the rate of the planetary atmospheric mass loss due to the stellar wind is calculated by (Zendejas et al., 2010):
| (11) |
where is an entrainment coefficient with a value ranging from 0.01 to 0.3, Rp is the planet radius, vw, and are the wind velocity (km s-1) and density (g cm-3), respectively. The highest value of was adopted to determine maximum mass loss. This same value of entrainment, 0.3, was estimated for Venus by Bauer & Lammer (2013).
It is worth noting that this model assumes an isothermal stellar wind; however, stellar winds are not, in fact, perfectly isothermal. Other studies have used more complex models that consider the magnetohydrodynamic of the Alfvén waves to derive a detailed structure of the wind energetics (Mesquita & Vidotto, 2020). Their MHD numerical simulation of stellar winds yields that the winds reach isothermal temperatures very quickly. Comparison made by the authors with the Parker wind models resulted in good agreement for the high-beta regime.
2.2.4 Atmospheric mass loss due to photoevaporation
To better evaluate atmospheric erosion in our sample, we compare the results of the stellar wind model to the energy-limited photoevaporation model. Photoevaporation probably played a crucial role in shaping the atmospheric evolution of terrestrial planets in the first 100 Myrs of their lifetime (Owen & Wu, 2013; Lopez & Fortney, 2013b; Howe et al., 2014b; Howe & Burrows, 2015b; Rogers, 2015b; Owen & Wu, 2017b; Van Eylen et al., 2018b). In a H/He atmosphere, high energy radiation from the host star can heat the atmospheric gas, affecting the atmospheric stability. This is particularly true for close-in planets such as those orbiting M-dwarf stars. XUV radiation below 91.2 nm can be directly absorbed by atomic hydrogen because this is the limit that the photon has enough energy () to ionize an H atom. The mass loss rate due to XUV radiation can be estimated using the approach from Kubyshkina et al. (2020):
| (12) |
where is the heating efficiency which was taken to be 0.1, a value shown to be appropriate for terrestrial and sub-Neptune planets (Owen & Jackson, 2012; Owen & Wu, 2017b; Lopez et al., 2012; Chen & Rogers, 2016), is the XUV flux received by the planet, and is the effective absorption radius for XUV photons. The term accounts for the fact that atmospheric material only escapes out to the Roche-lobe height and represents the fractional gravitational potential energy difference between the planetary surface and the Roche-lobe height. The factor is calculated using the equation from Erkaev et al. (2007):
| (13) |
where is the planet mass, is the stellar mass, is the semi-major axis, and is the planet radius. The effective absorption radius for XUV photons, RXUV, was calculated using the formalism from Kubyshkina et al. (2020).
| (14) |
where is the atmospheric scale height, is the surface pressure, and is the pressure at the XUV absorption level. The atmospheric scale height is given by H = where is the Boltzmann constant, is the mean molecular weight of an atmosphere in solar composition ( = 2.3 amu), is the surface gravity, and is the calculated equilibrium temperature. The pressure, in , was estimated using the following equation:
| (15) |
where G is the gravitational constant in units of , mH is the mass of hydrogen in kg, respectively, and is the absorption cross-section. is in units of kg and is in units of m. The effective radius, the radius of the planet where XUV flux is absorbed, is calculated by scaling the planetary radius () with time, as described in Section 2.2.5. FEUV was calculated using the power law relation with Fx, from Chadney et al. (2015):
| (16) |
2.2.5 Evolution of planetary mass and radius
To account for the changes in planetary mass and radius caused by the stripping of the H/He envelope, we consider both photoevaporation and stellar wind loss mechanisms backward in time by following these steps:
-
1.
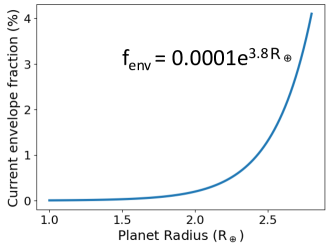
First, we determine the initial envelope fraction, fenv, of the planet, by using the current envelope fraction as our starting point since our calculations are backward in time. This value is estimated by performing an exponential fit to the relationship between the envelope fraction (%) and planet radius, using the observational sample from Figure 8 of Lopez & Fortney (2014). Our fit is presented in Figure 2. It is worth noting that even a relatively small amount of H/He has a significant impact on the planetary radius (Lopez & Fortney, 2014).
-
2.
Next, we calculate the mass loss of the planet at its current age using Equation 11 for stellar wind or Equation 12 for photoevaporation. We then add this estimated mass loss to the current planet mass (Mp) yielding the mass of the planet at a previous age (Mbf):
(17) -
3.
We then re-estimate the radius of the planet at the previous ages and recalculate the mass loss. The radius of the planet at the previous ages (Rbf) is obtained by first estimating the envelope radius (Renv) associated with its envelope fraction which is given by the mass added back (estimated envelope lost) and then adding it to the core radius:
(18) For this estimation, we use the Renv relation from Lopez & Fortney (2014) (where ) for an enhanced opacity and assuming that the planets have cores with Earth-like composition, which is given by:
(19) where is the planet envelope fraction and is the insolation the planet receives, and is the planet mass. These parameters are all scaled with time. The insolation, , is estimated using the relation from Weiss & Marcy (2014):
(20) where and evolve with time using evolutionary models from Baraffe et al. (2015).
-
4.
Finally, the total mass lost from the planet’s atmosphere was computed by integrating the mass loss accumulated over time.
2.2.6 Primordial envelope threshold
Once the total atmospheric mass lost due to stellar wind and photoevaporation has been computed, to determine if the planet has lost its envelope, we define a threshold set by an estimated primordial envelope mass. Based on our assumptions, the planet will have lost its envelope if the accumulated mass lost in 5 Gyr is than the primordial envelope mass threshold. We estimate the primordial envelope by using a relationship from Lee (2019) that gives the amount of gas mass accreted given the core mass of the planet:
| (21) |
where is the nebular mass surface density and is the timescale to accrete the gas. In the case of super-Earths and mini-Neptunes, they emerge during the late stage when the nebula is gas-poor, and the timescale to accrete gas would take approximately 5.7 Myrs (Lee, 2019). We adopted a value of 13 g cm-2 for . was estimated by subtracting the mass of the current envelope from the planet current mass, where the current envelope is estimated using the relationship from Lopez & Fortney (2014) as shown in Fig. 2. The estimated primordial envelopes are indicated in Table 3.
| Planet name | Current envelope (%) | Primordial envelope (%) |
|---|---|---|
| GJ 1061 c | 0.01* | 0.51 |
| GJ 1061 d | 0.01* | 0.46 |
| GJ 1132 b | 0.47 | |
| GJ 1214 b | 5.49 | |
| GJ 163 c | 1.31* | 6.99 |
| GJ 180 c | 0.93* | 6.37 |
| GJ 229 A c | 1.92* | 7.70 |
| GJ 273 b | 0.03* | 1.69 |
| GJ 3293 d | 2.51* | 8.17 |
| GJ 357 d | 0.72* | 5.91 |
| GJ 667 C c | 0.08* | 2.69 |
| GJ 667 C e | 0.02* | 1.51 |
| GJ 667 C f | 0.02* | 1.51 |
| GJ 682 b | 0.15* | 3.44 |
| GJ 832 c | 0.39* | 4.85 |
| K2-18 b | 11.25 | |
| K2-288 B b | 3.27 | |
| K2-3 c | 0.08* | 1.90 |
| K2-3 d | 1.60 | |
| K2-72 e | 1.07 | |
| K2-9 b | 5.28 | |
| Kepler-1229 b | 1.36 | |
| Kepler-186 f | 0.50 | |
| Kepler-138 d | 0.09 | |
| Kepler-1649 c | 0.27 | |
| Kepler-1652 b | 2.00 | |
| Kepler-296 e | 1.76 | |
| Kepler-296 f | 2.80 | |
| Kepler-705 b | 4.41 | |
| LHS 1140 b | 6.49 | |
| Proxima Cen b | 0.01* | 0.30 |
| Ross 128 b | 0.01* | 0.35 |
| TOI-700 d | 0.43 | |
| TRAPPIST-1 d | 0.04 | |
| TRAPPIST-1 e | 0.11 | |
| TRAPPIST-1 f | 0.21 | |
| TRAPPIST-1 g | 0.32 | |
| Wolf 1061 c | 0.05* | 2.24 |
3 Results
We estimated the evolution of the density and velocity of the stellar wind for 30 M-type stars hosting planets. For the M0-1V stars, at 5 Gyr, we find an average of 400 km s-1 and g cm-3 for the wind velocity and density. While for stars of spectral type M2V, these values at 5 Gyr are 490 km s-1 an g cm-3, respectively. The measured wind velocity and density of the solar wind near Earth orbit today are around 450 km s-1 and g cm-3.
Once the stellar properties were estimated, the planetary atmospheric mass loss rate due to stellar wind was computed as a function of time. Moreover, we also computed the atmospheric mass loss rate due to photoevaporation. Since there is a significant increase in stellar activity at younger ages, the mass loss rate for both mechanisms significantly drops off after 0.1 Gyr. This decrease at later ages indicates that photoevaporation and stellar wind loss mechanisms are more efficient in the first 100 Myr of the stellar lifetime. The results for the evolution of the stellar properties at time-points of Gyr and 5 Gyr are shown in Table 4.
| age | 0.1 Gyr (M2-8 V) or 0.2 Gyr (M0-M1.5 V) | 5 Gyr | ||||||||
|---|---|---|---|---|---|---|---|---|---|---|
| parameter | ||||||||||
| unit | (km s-1) | (g cm-3) | (MK) | (days) | (erg s-1 cm-3) | (km s-1) | (g cm-3) | (MK) | (days) | (erg s-1 cm-2) |
| GJ 1061 c | 2444.91 | 12.22 | 3.83 | 628.06 | 1.50 | 81.49 | ||||
| GJ 1061 d | 1973.87 | 12.22 | 3.83 | 643.75 | 1.50 | 81.49 | ||||
| GJ 1132 b | 1735.85 | 10.45 | 3.83 | 394.29 | 1.28 | 81.49 | ||||
| GJ 1214 b | 1733.53 | 10.32 | 3.83 | 408.32 | 1.27 | 81.49 | ||||
| GJ 163 c | 1461.33 | 7.40 | 3.83 | 372.35 | 0.91 | 81.49 | ||||
| GJ 180 c | 918.30 | 7.40 | 3.83 | 369.65 | 0.91 | 81.49 | ||||
| GJ 229 A c | 1506.62 | 6.97 | 0.71 | 402.95 | 0.86 | 43.64 | ||||
| GJ 273 b | 1627.67 | 8.81 | 3.83 | 422.14 | 1.08 | 81.49 | ||||
| GJ 3293 d | 1532.09 | 7.46 | 3.83 | 404.66 | 0.92 | 81.49 | ||||
| GJ 357 d | 1662.90 | 8.19 | 3.83 | 450.28 | 1.01 | 81.49 | ||||
| GJ 667 C c | 1478.18 | 7.27 | 0.71 | 418.41 | 1.01 | 43.64 | ||||
| GJ 667 C e | 1560.72 | 7.27 | 0.71 | 458.28 | 1.01 | 43.64 | ||||
| GJ 667 C f | 1512.96 | 7.27 | 0.71 | 435.39 | 1.01 | 43.64 | ||||
| GJ 682 b | 1742.66 | 8.74 | 3.83 | 475.20 | 1.07 | 81.49 | ||||
| GJ 832 c | 1317.47 | 6.26 | 0.71 | 362.49 | 0.88 | 43.64 | ||||
| K2-18 b | 1498.74 | 7.38 | 3.83 | 391.28 | 0.91 | 81.49 | ||||
| K2-288 B b | 1660.77 | 8.42 | 3.83 | 443.88 | 1.03 | 81.49 | ||||
| K2-3 c | 1314.41 | 6.29 | 3.83 | 372.48 | 0.77 | 43.64 | ||||
| K2-3 d | 1267.51 | 6.29 | 3.83 | 339.02 | 0.77 | 43.64 | ||||
| K2-72 e | 1558.21 | 8.28 | 3.83 | 398.87 | 1.01 | 81.49 | ||||
| K2-9 b | 1591.59 | 8.56 | 3.83 | 408.87 | 1.05 | 81.49 | ||||
| Kepler-1229 b | 1337.05 | 5.80 | 0.71 | 381.99 | 0.81 | 43.64 | ||||
| Kepler-186 f | 1380.29 | 5.72 | 0.71 | 404.52 | 0.80 | 43.64 | ||||
| Kepler-138 d | 1313.27 | 7.10 | 0.71 | 342.79 | 0.87 | 43.64 | ||||
| Kepler-1649 c | 1771.28 | 9.96 | 3.83 | 550.81 | 1.22 | 81.49 | ||||
| Kepler-1652 b | 1540.51 | 7.68 | 3.83 | 402.85 | 0.94 | 81.49 | ||||
| Kepler-296 e | 1404.28 | 6.82 | 3.83 | 357.15 | 0.83 | 81.49 | ||||
| Kepler-296 f | 1467.60 | 6.82 | 3.83 | 387.03 | 0.83 | 81.49 | ||||
| Kepler-705 b | 1414.37 | 6.59 | 3.83 | 368.70 | 0.81 | 81.49 | ||||
| LHS 1140 b | 1890.78 | 10.38 | 3.83 | 516.09 | 1.28 | 81.49 | ||||
| Proxima Cen b | 2021.67 | 12.88 | 3.83 | 648.33 | 1.58 | 81.49 | ||||
| Ross 128 b | 1846.15 | 10.83 | 3.83 | 574.28 | 1.33 | 81.49 | ||||
| TOI-700 d | 1482.71 | 7.26 | 3.83 | 385.80 | 0.89 | 81.49 | ||||
| TRAPPIST-1 d | 2107.91 | 14.07 | 1.40 | 662.06 | 1.72 | 1.40 | ||||
| TRAPPIST-1 e | 2113.93 | 14.07 | 1.40 | 677.67 | 1.72 | 1.40 | ||||
| TRAPPIST-1 f | 2214.40 | 14.07 | 1.40 | 604.87 | 1.72 | 1.40 | ||||
| TRAPPIST-1 g | 2254.34 | 14.07 | 1.40 | 622.67 | 1.72 | 1.40 | ||||
| Wolf 1061c | 1588.33 | 8.60 | 3.83 | 406.81 | 1.05 | 81.49 | ||||
The results showing the comparison of the evolution of planet properties (mass, radius, total mass lost) at 0.1 Gyr and 5 Gyr due to stellar wind and photoevaporation are shown in Tables 5 and 6, respectively. Furthermore, the mass loss of the atmospheres leveled off at 2 Gyr in the system lifetime. This suggests that if an atmosphere of a planet has not been stripped before 2 Gyr, it is unlikely that it will be in the future. Also, it means that any later secondary outgassed atmosphere will not be caused by stellar wind stripping because of the decreased stellar activity.
| age | 0.1 or 0.2 Gyr | 5 Gyr | ||||||||||||
|---|---|---|---|---|---|---|---|---|---|---|---|---|---|---|
| parameter | mass lost |
|
mass lost |
|
||||||||||
| unit | (g/s) | (M⊕) | (R⊕) | (M⊕) | (%) | (g/s) | (M⊕) | (R⊕) | (M⊕) | (%) | ||||
| GJ 1061 c | 1.74 | 1.24 | 1.74 | 1.18 | ||||||||||
| GJ 1061 d | 1.64 | 1.22 | 1.64 | 1.16 | ||||||||||
| GJ 1132 b | 1.66 | 1.28 | 1.66 | 1.14 | ||||||||||
| GJ 1214 b | 8.14 | 4.19 | 8.14 | 2.60 | ||||||||||
| GJ 163 c | 6.80 | 3.17 | 6.80 | 2.52 | ||||||||||
| GJ 180 c | 6.40 | 2.95 | 6.40 | 2.41 | ||||||||||
| GJ 229 A c | 7.27 | 2.95 | 7.27 | 2.17 | ||||||||||
| GJ 273 b | 2.89 | 1.60 | 2.89 | 1.51 | ||||||||||
| GJ 3293 d | 7.60 | 3.57 | 7.60 | 2.67 | ||||||||||
| GJ 357 d | 6.10 | 2.79 | 6.10 | 2.34 | ||||||||||
| GJ 667 C c | 3.80 | 1.92 | 3.80 | 1.77 | ||||||||||
| GJ 667 C e | 2.70 | 1.52 | 2.70 | 1.45 | ||||||||||
| GJ 667 C f | 2.70 | 1.52 | 2.70 | 1.45 | ||||||||||
| GJ 682 b | 4.40 | 2.12 | 4.40 | 1.93 | ||||||||||
| GJ 832 c | 5.40 | 2.56 | 5.40 | 2.21 | ||||||||||
| K2-18 b | 8.92 | 2.82 | 8.92 | 2.37 | ||||||||||
| K2-288 B b | 4.27 | 2.08 | 4.27 | 1.90 | ||||||||||
| K2-3 c | 3.10 | 1.93 | 3.10 | 1.77 | ||||||||||
| K2-3 d | 3.10 | 1.74 | 3.10 | 1.65 | ||||||||||
| K2-72 e | 2.21 | 1.34 | 2.21 | 1.29 | 3.54 | |||||||||
| K2-9 b | 5.69 | 2.83 | 5.69 | 2.25 | ||||||||||
| Kepler-1229 b | 2.54 | 1.46 | 2.54 | 1.40 | ||||||||||
| Kepler-186 f | 1.71 | 1.21 | 1.71 | 1.17 | ||||||||||
| Kepler-138 d | 1.33 | 1.21 | ||||||||||||
| Kepler-1649 c | 1.20 | 1.12 | 1.20 | 1.06 | ||||||||||
| Kepler-1652 b | 3.19 | 1.70 | 3.19 | 1.60 | ||||||||||
| Kepler-296 e | 2.96 | 1.61 | 2.96 | 1.53 | ||||||||||
| Kepler-296 f | 3.89 | 1.94 | 3.89 | 1.80 | ||||||||||
| Kepler-705 b | 5.10 | 2.38 | 5.10 | 2.10 | ||||||||||
| LHS 1140 b | 6.98 | 1.81 | 6.98 | 1.72 | ||||||||||
| Proxima Cen b | 1.27 | 1.14 | 1.27 | 1.08 | ||||||||||
| Ross 128 b | 1.40 | 1.17 | 1.40 | 1.11 | ||||||||||
| TOI-700 d | 1.57 | 1.19 | 1.57 | 1.14 | ||||||||||
| TRAPPIST-1 d | 1.66 | |||||||||||||
| TRAPPIST-1 e | 1.26 | |||||||||||||
| TRAPPIST-1 f | 1.04 | 1.20 | 1.04 | 1.06 | ||||||||||
| TRAPPIST-1 g | 1.32 | 1.24 | 1.32 | 1.14 | ||||||||||
| Wolf 1061 c | 3.41 | 1.83 | 3.41 | 1.66 | ||||||||||
| age | 0.1 Gyr | 5 Gyr | ||||||||||||||
| parameter | mass lost |
|
mass lost |
|
||||||||||||
| unit | (g ) | () | () | () | () | () | (g ) | () | () | () | () | () | ||||
| GJ 1061 c | 9.98 | 1.74 | 1.18 | 1.75 | ||||||||||||
| GJ 1061 d | 4.72 | 1.64 | 1.16 | 1.80 | ||||||||||||
| GJ 1132 b | 1.66 | 1.13 | 1.70 | |||||||||||||
| GJ 1214 b | 6.26 | 2.85 | 3.29 | |||||||||||||
| GJ 163 c | 6.81 | 3.23 | 4.18 | 6.80 | 2.50 | 3.11 | ||||||||||
| GJ 180 c | 6.41 | 3.00 | 3.83 | 6.40 | 2.42 | 2.95 | ||||||||||
| GJ 229 A c | 7.27 | 2.95 | 3.50 | 7.27 | 2.60 | 2.99 | ||||||||||
| GJ 273 b | 2.90 | 2.00 | 2.77 | 2.89 | 1.51 | 2.00 | ||||||||||
| GJ 3293 d | 7.60 | 3.58 | 4.43 | 7.60 | 2.67 | 3.14 | ||||||||||
| GJ 357 d | 6.10 | 2.81 | 3.37 | 6.10 | 2.34 | 2.74 | ||||||||||
| GJ 667 C c | 3.80 | 2.05 | 2.59 | 3.80 | 1.78 | 2.19 | ||||||||||
| GJ 667 C e | 2.70 | 1.59 | 1.93 | 2.70 | 1.46 | 1.74 | ||||||||||
| GJ 667 C f | 2.70 | 1.67 | 2.11 | 2.70 | 1.47 | 1.80 | ||||||||||
| GJ 682 b | 4.40 | 2.17 | 2.74 | 4.40 | 1.94 | 2.39 | ||||||||||
| GJ 832 c | 5.40 | 2.63 | 3.32 | 5.40 | 2.18 | 2.71 | ||||||||||
| K2-18 b | 8.93 | 2.83 | 3.35 | 8.92 | 2.37 | 2.73 | ||||||||||
| K2-288 B b | 4.27 | 2.13 | 2.59 | 4.27 | 1.91 | 2.27 | ||||||||||
| K2-3 c | 3.11 | 2.37 | 3.67 | 3.10 | 1.77 | 2.55 | ||||||||||
| K2-3 d | 2.80 | 1.75 | 2.32 | 2.80 | 1.53 | 1.95 | ||||||||||
| K2-72 e | 2.22 | 2.30 | 3.63 | 2.21 | 1.29 | 1.83 | ||||||||||
| K2-9 b | 5.70 | 3.00 | 4.01 | 5.69 | 2.26 | 2.84 | ||||||||||
| Kepler-1229 b | 2.54 | 1.52 | 1.87 | 2.54 | 1.40 | 1.69 | ||||||||||
| Kepler-186 f | 1.71 | 1.26 | 1.55 | 1.71 | 1.17 | 1.42 | ||||||||||
| Kepler-138 d | 8.88 | 0.64 | 1.21 | 1.92 | ||||||||||||
| Kepler-1649 c | 8.00 | 1.20 | 1.06 | 1.94 | ||||||||||||
| Kepler-1652 b | 3.19 | 1.82 | 2.34 | 1.61 | 2.01 | |||||||||||
| Kepler-296 e | 2.96 | 1.81 | 2.50 | 2.96 | 1.55 | 2.04 | ||||||||||
| Kepler-296 f | 3.89 | 1.99 | 2.50 | 3.89 | 1.80 | 2.22 | ||||||||||
| Kepler-705 b | 5.10 | 2.41 | 2.99 | 5.10 | 2.10 | 2.54 | ||||||||||
| LHS 1140 b | 6.98 | 1.85 | 2.21 | 6.38 | 1.64 | 2.02 | ||||||||||
| Proxima Cen b | 9.72 | 1.28 | 1.08 | 2.23 | ||||||||||||
| Ross 128 b | 1.40 | 1.11 | 2.34 | |||||||||||||
| TOI-700 d | 1.57 | 1.66 | 2.55 | 1.57 | 1.14 | 1.63 | ||||||||||
| TRAPPIST-1 d | 0.39 | 0.79 | 1.10 | |||||||||||||
| TRAPPIST-1 e | 0.69 | 0.92 | 1.39 | |||||||||||||
| TRAPPIST-1 f | 9.72 | 1.05 | 1.05 | 1.58 | ||||||||||||
| TRAPPIST-1 g | 7.10 | 1.32 | 1.13 | 1.78 | ||||||||||||
| Wolf 1061 c | 3.41 | 1.90 | 2.51 | 3.41 | 1.67 | 2.13 | ||||||||||
3.1 Close-in orbiting exoplanets
Based on our estimations, the stellar wind did not drive significant atmosphere loss in the close-in planets Kepler-138d, K2-3c, GJ 1132 b, and GJ 1214 b. Due to uncertainties in the rotation period at younger ages of these stars, we have also computed upper and lower limits to the mass loss for all planets based on the upper and lower errors of the rotation period.
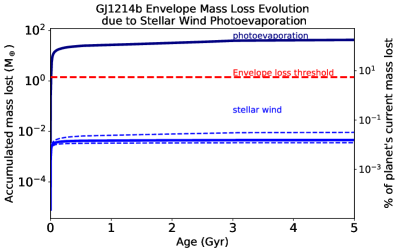
Even with the upper limit, <10% of the primordial envelope was lost for all 4 planets due to stellar wind. However, photoevaporation would drive the loss of 100% of the atmosphere of GJ 1132 b, GJ 1214 b, and Kepler-138d. A comparison of the mass lost due to stellar wind and photoevaporation for GJ 1214 b is shown in Figure 3.
3.2 HZ exoplanets
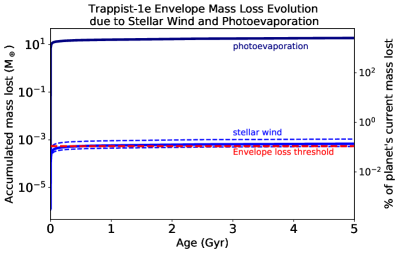
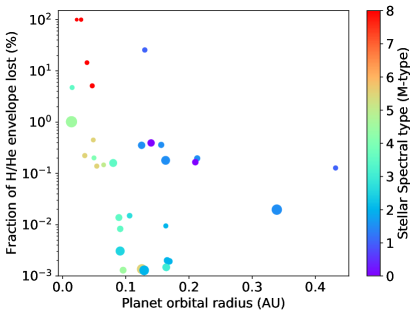
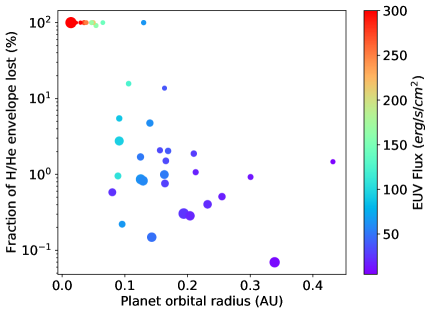
For the HZ planets orbiting early-type M dwarfs at 0.1 AU, photoevaporation was the only mechanism that could significantly strip the estimated primordial envelope. This suggests that planets in the outer HZ of an early-type M-dwarf are unlikely to lose an atmosphere due to stellar wind. For the planets around late-type M dwarfs, orbiting at closer orbit within the HZ, between 0.01-0.03 AU from their host star, both stellar wind and photoevaporation played a non-negligible role in atmospheric stripping, with photoevaporation still being more effective. This is demonstrated in Figure 4 where only the planets around M-dwarfs of higher spectral type and in close orbit lost their primordial envelope due to stellar wind. An example of this is the Trappist-1 system, which experienced significant atmospheric stripping due to both photoevaporation and stellar wind due to the close orbit of the planets. Overall, photoevaporation played a significant role in atmospheric escape for HZ planets. Particularly those in the inner HZ, as shown in Fig. 5, where the median fraction of envelope loss for planets orbiting <0.1 AU was 100%. The results for the atmospheric mass loss due to photoevaporation and stellar wind at 5 Gyr in the planet’s lifetime are shown in Table 7.
| planet |
|
|
||||
|---|---|---|---|---|---|---|
| GJ 1061 c | 100.00 | 0.22 | ||||
| GJ 1061 d | 100.00 | 0.14 | ||||
| GJ 1132 b | 100.00 | 4.74 | ||||
| GJ 1214 b | 100.00 | 1.02 | ||||
| GJ 163 c | 1.79 | 0.00 | ||||
| GJ 180 c | 1.64 | 0.00 | ||||
| GJ 229 A c | 0.11 | 0.02 | ||||
| GJ 273 b | 15.90 | 0.01 | ||||
| GJ 3293 d | 0.55 | 0.00 | ||||
| GJ 357 d | 0.48 | 0.00 | ||||
| GJ 667 C c | 3.45 | 0.35 | ||||
| GJ 667 C e | 1.90 | 0.20 | ||||
| GJ 667 C f | 4.26 | 0.36 | ||||
| GJ 682 b | 1.15 | 0.16 | ||||
| GJ 832 c | 1.95 | 0.18 | ||||
| K2-18 b | 0.24 | 0.00 | ||||
| K2-288 B b | 1.34 | 0.00 | ||||
| K2-3 c | 19.3 | 0.39 | ||||
| K2-3 d | 4.31 | 0.17 | ||||
| K2-72 e | 100.00 | 0.01 | ||||
| K2-9 b | 6.48 | 0.00 | ||||
| Kepler-1229 b | 1.71 | 0.00 | ||||
| Kepler-186 f | 2.72 | 0.13 | ||||
| Kepler-138 d | 100.00 | 25.64 | ||||
| Kepler-1649 c | 100.00 | 0.15 | ||||
| Kepler-1652 b | 3.19 | 0.00 | ||||
| Kepler-296 e | 5.49 | 0.00 | ||||
| Kepler-296 f | 1.00 | 0.00 | ||||
| Kepler-705 b | 0.75 | 0.00 | ||||
| LHS 1140 b | 0.37 | 0.00 | ||||
| Proxima Cen b | 100.00 | 0.45 | ||||
| Ross 128 b | 100.00 | 0.20 | ||||
| TOI-700 d | 60.11 | 0.01 | ||||
| TRAPPIST-1 d | 100.00 | 100.00 | ||||
| TRAPPIST-1 e | 100.00 | 100.00 | ||||
| TRAPPIST-1 f | 100.00 | 14.47 | ||||
| TRAPPIST-1 g | 100.00 | 5.12 | ||||
| Wolf 1061 c | 2.14 | 0.01 |
4 Discussion
The main result of the preceding analysis is that considering the maximum entrainment of 0.3, stellar wind alone of M-type stars that experience significant decay in time is not sufficient to strip the atmospheres of HZ planets completely. Therefore, processes such as photoevaporation could play a key role in leading to a significant amount of H/He escaping in the first Myrs of the planet’s lifetime. Planets at 0.1 AU, generally in the inner HZ region, and with H/He envelope fractions of 0.1% of the planet’s total mass are more susceptible to complete atmospheric loss. We reach similar findings as Owen & Mohanty (2016), which report that at the outer edge of the HZ, evaporation cannot remove a H/He envelope, assuming all planets started with an envelope fraction of 1 percent. Although this paper only focuses on escape due to stellar wind or photoevaporation, many studies have noted that other factors, such as CMEs, can induce ion pickup and enhance atmospheric erosion (Lammer et al., 2007; Cherenkov et al., 2017). It is expected that CME rates in M-dwarfs are high (Güdel, 2007).
Another important factor not incorporated into this study that can enhance atmospheric escape is core-powered mass loss which has been shown to explain the bimodal radius distribution of small close-in exoplanets (Ginzburg et al., 2018; Gupta & Schlichting, 2019, 2020). Outflow due to core-powered mass loss is especially significant for low-mass planets which accrete lighter envelopes (). For these planets, which comprise a large percent of our sample, core-powered mass loss can dominate over photoevaporation at the early stages of evolution.
It has also been suggested that the presence of a magnetosphere can shield the planet from the charged particles of the stellar wind and prevent erosion (See et al., 2014). Here we have not considered the role of the presence of a planet’s magnetosphere in the atmospheric escape. The planets studied in this research orbit closely to their host star, indicating that they are more likely to have a weak or non-existent magnetic field due to tidal locking (Griemeier et al., 2005). Also, observations of Solar System planets show that the mass escape rate of Earth is similar to the unmagnetized planets Venus and Mars (Gunell et al., 2018), bringing into question the role of magnetospheres in atmospheric escape. Further, as shown by Gunell et al. (2018), ion escape rates may be higher for magnetized planets through the polar caps and cusps. Therefore, more investigation is needed to determine the magnetosphere’s influence on atmospheric escape, and should be addressed in future works.
In the following subsections, we detail the implications of our results for the 8 planets that have observations of their transmission spectra taken with HST: GJ-1132b, LHS 1140b, K2-18b, GJ 1214 b, and Trappist-1d-g.
4.1 GJ-1132b
For this planet, we estimated a H/He mass loss rate due to stellar wind of g s-1 for ages of 0.1 Gyr. The mass loss rates from the stellar wind suggest a scenario in which the initial H/He envelope of GJ 1132 b was not completely stripped over the planet’s lifetime. However, the mass loss rate due to photoevaporation of g s-1 at 0.1 Gyr implies that the planet will be stripped of its primordial envelope in 100 Myr. Observational work by Swain et al. (2021) found spectral signatures of aerosol scattering, HCN, and CH4 which suggests that this planet re-established a secondary atmosphere that could be due to planetary outgassing. Our results for photoevaporation are compatible with Estrela et al. (2020), which also indicates that GJ 1132 b would have its envelope completely stripped within 100 Myrs.
4.2 LHS 1140b
At 0.1 Gyr, the mass loss rate of LHS 1140b due to stellar wind and photoevaporation are and g s-1, respectively, resulting in low escape due to both mechanisms. Previous studies calculated large surface gravities on the planet, indicating a greater chance for atmospheric retention (Luger & Barnes, 2015). Current observations indicate the presence of water vapor in its atmosphere (Edwards et al., 2020). Because a significant amount of mass was not lost, it is suggestive that pressures on the planet’s surface are incompatible with liquid water to exist, only vapor.
4.3 K2-18b
The calculated mass loss rate due to stellar wind is g s-1 for this planet at 0.1 Gyr. Thus, this low mass loss rate at early ages was not sufficient to strip the calculated primordial envelope, indicating that K2-18b is currently shrouded by a H/He envelope. Dos Santos et al. (2020) reported a mass loss rate of g s-1 due to EUV photoevaporation, comparable to our value of g s-1 at 5 Gyr, also suggesting that the planet would retain its volatile-rich atmosphere. Further results from retrieval modeling from other authors show that the data is best matched with an H-dominated atmosphere today with traces of H2O vapor (Benneke et al., 2019).
4.4 GJ 1214 b
The mass loss rate of this planet due to stellar wind computed in this study at 0.1 Gyr is high at g s-1, with values at 5 Gyr lowering to g s-1. These values are lower by 4 orders of magnitudes than that of photoevaporation with a mass loss rate of g s-1 at 0.1 Gyr, significantly lowering to g s-1 at 5 Gyr. Due to the large initial envelope fraction (), GJ 1214 b did not lose a H/He envelope due to stellar wind but was predicted to have its atmosphere completely stripped in the first 0.1 Gyr by photoevaporation. Kasper et al. (2020) reported a non-detection of He absorption in the atmosphere of GJ 1214; however, the recent study of Orell-Miquel et al. (2022) reported a tentative detection of He I.
4.5 Trappist-1 system (planets d, e, f, and g)
With the stellar wind and photoevaporation models, planets d and e lost 100% of their primordial envelope. Planets f and g lost 14% and 5% of their primordial envelope due to stellar wind, respectively, and 100% due to photoevaporation. These results are supported by other photoevaporative models, which predict that all planets would lose their primordial envelope due to photoevaporation (Hori & Ogihara, 2020; Turbet et al., 2020). Current spectroscopic observations rule out cloud-free hydrogen-dominated atmospheres for TRAPPIST-1 d, e, and f, with the significance of 8, 6, and 4, respectively. However, an H-dominated atmosphere could not be ruled out in planet g (De Wit et al., 2018).
5 Conclusion
The wind velocity and density for thirty-eight M-dwarf host stars were calculated with the evolution of the stellar properties taken into account. Rotation period and X-ray flux scaling over time were utilized to estimate the evolution of stellar activity properly and, therefore, of the stellar wind. The X-ray flux was also scaled to determine the mass loss rate due to photoevaporation. These values were computed over a timescale of 5 Gyr. The mass loss rate was computed as a function of time and then accumulated until 5 Gyr to determine the total atmospheric mass loss of the planet’s primordial, H/He-dominated atmosphere. Like photoevaporation, our model indicates that stripping due to stellar winds is most effective over the first 0.1 Gyr when the host star is expected to be most active.
We find that close-in orbiting planets, GJ 1132 b, GJ 1214 b, and Kepler-138 d, and the planets within the HZ, GJ 1061 c, d, K2-72 e, Kepler-1649 c, Proxima Cen b, Ross 128 b, and TRAPPIST-1 d-g could completely lose the estimated primordial envelope. Further, our model results, in conjunction with HST data, indicate that the observed current atmospheres on TRAPPIST-1d-f and GJ 1132 b could be a wispy secondary atmosphere. The lower density of the planet GJ 1214 ( ) suggests that the planet could still have a hydrogen envelope that could be explained by outgassing from rocky material (Rogers & Seager, 2010) if, as according to our photoevaporation model, the planet did not manage to retain its primordial envelope.
Our results show that planets orbiting earlier type M-dwarf stars at a distance of >0.1 AU are more likely to preserve their atmosphere with median envelope fractions lost of 0.0% and 1.7% for stellar wind and photoevaporation, respectively. The rotation period decay for later type M-dwarfs (>M6) has not been determined; however, it is likely that they do not follow the same trends as earlier spectral type stars and remain highly active for longer periods of time, making orbiting planets more susceptible to mass loss due to stellar wind as seen with our reported results for the Trappist-1 planets.
More observations are needed to better constrain the evolution of M-dwarf stars’ activity (e.g., age-rotation period relationship) and EUV emissions. These properties of the star are crucial for improving the accuracy in the estimation of planetary atmospheric mass loss. Space missions such as the James Webb Space Telescope will improve our understanding of the atmospheres of these planets. The detection of any spectral features in small planets, like the ones in our sample, would be evidence of a low molecular weight atmosphere. These observations will constrain our modeling predictions and pave the path toward searching for life on cooler, habitable zone exoplanets.
Acknowledgments
This research made use of data published on the NASA Exoplanet Archive operated by the California Institute of Technology, under contract with the National Aeronautics and Space Administration under the Exoplanet Exploration Program. Part of the research was carried out at the Jet Propulsion Laboratory, California Institute of Technology, under a contract with the National Aeronautics and Space Administration (80NM0018D0004).
Data Availability
The data supporting this study’s findings are available from the corresponding author, Ashini Modi, upon reasonable request.
References
- Baraffe et al. (2015) Baraffe I., Homeier D., Allard F., Chabrier G., 2015, Astronomy & Astrophysics, 577, A42
- Bauer & Lammer (2013) Bauer S., Lammer H., 2013, Planetary aeronomy: atmosphere environments in planetary systems. Springer Science & Business Media
- Benneke et al. (2019) Benneke B., et al., 2019, The Astrophysical Journal Letters, 887, L14
- Burgasser & Mamajek (2017) Burgasser A. J., Mamajek E. E., 2017, The Astrophysical Journal, 845, 110
- Catling & Kasting (2017) Catling D. C., Kasting J. F., 2017, Atmospheric evolution on inhabited and lifeless worlds. Cambridge University Press
- Chadney et al. (2015) Chadney J., Galand M., Unruh Y., Koskinen T., Sanz-Forcada J., 2015, Icarus, 250, 357
- Chen & Rogers (2016) Chen H., Rogers L. A., 2016, The Astrophysical Journal, 831, 180
- Cherenkov et al. (2017) Cherenkov A., Bisikalo D., Fossati L., Möstl C., 2017, The Astrophysical Journal, 846, 31
- Cohen et al. (2015) Cohen O., Ma Y., Drake J. J., Glocer A., Garraffo C., Bell J., Gombosi T. I., 2015, The Astrophysical Journal, 806, 41
- Davis & Wheatley (2009) Davis T. A., Wheatley P. J., 2009, Monthly Notices of the Royal Astronomical Society, 396, 1012
- De Wit et al. (2018) De Wit J., et al., 2018, Nature Astronomy, 2, 214
- Dos Santos et al. (2020) Dos Santos L. A., et al., 2020, Astronomy & Astrophysics, 634, L4
- Edwards et al. (2020) Edwards B., et al., 2020, The Astronomical Journal, 161, 44
- Engle & Guinan (2018) Engle S. G., Guinan E. F., 2018, Research Notes of the AAS, 2, 34
- Erkaev et al. (2007) Erkaev N., Kulikov Y. N., Lammer H., Selsis F., Langmayr D., Jaritz G., Biernat H., 2007, Astronomy & Astrophysics, 472, 329
- Erkaev et al. (2017) Erkaev N., et al., 2017, Monthly Notices of the Royal Astronomical Society, 470, 4330
- Estrela et al. (2020) Estrela R., Swain M. R., Gupta A., Sotin C., Valio A., 2020, The Astrophysical Journal, 898, 104
- Fulton et al. (2017) Fulton B. J., et al., 2017, The Astronomical Journal, 154, 109
- Gillon et al. (2016) Gillon M., et al., 2016, Nature, 533, 221
- Ginzburg et al. (2018) Ginzburg S., Schlichting H. E., Sari R., 2018, Monthly Notices of the Royal Astronomical Society, 476, 759
- Griemeier et al. (2005) Griemeier J.-M., Stadelmann A., Motschmann U., Belisheva N., Lammer H., Biernat H., 2005, Astrobiology, 5, 587
- Grießmeier et al. (2009) Grießmeier J.-M., Khodachenko M., Lammer H., Grenfell J., Stadelmann A., Motschmann U., 2009, Proceedings of the International Astronomical Union, 5, 385
- Güdel (2007) Güdel M., 2007, Living Reviews in Solar Physics, 4, 1
- Gunell et al. (2018) Gunell H., Maggiolo R., Nilsson H., Wieser G. S., Slapak R., Lindkvist J., Hamrin M., De Keyser J., 2018, Astronomy & Astrophysics, 614, L3
- Gupta & Schlichting (2019) Gupta A., Schlichting H. E., 2019, Monthly Notices of the Royal Astronomical Society, 487, 24
- Gupta & Schlichting (2020) Gupta A., Schlichting H. E., 2020, Monthly Notices of the Royal Astronomical Society, 493, 792
- Hart (1978) Hart M. H., 1978, Icarus, 33, 23
- Hori & Ogihara (2020) Hori Y., Ogihara M., 2020, The Astrophysical Journal, 889, 77
- Howe & Burrows (2015a) Howe A. R., Burrows A., 2015a, ApJ, 808, 150
- Howe & Burrows (2015b) Howe A. R., Burrows A., 2015b, The Astrophysical Journal, 808, 150
- Howe et al. (2014a) Howe A. R., Burrows A., Verne W., 2014a, ApJ, 787, 173
- Howe et al. (2014b) Howe A. R., Burrows A., Verne W., 2014b, The Astrophysical Journal, 787, 173
- Irwin et al. (2007) Irwin J., Hodgkin S., Aigrain S., Hebb L., Bouvier J., Clarke C., Moraux E., Bramich D., 2007, Monthly Notices of the Royal Astronomical Society, 377, 741
- Jin et al. (2014) Jin S., Mordasini C., Parmentier V., van Boekel R., Henning T., Ji J., 2014, ApJ, 795, 65
- Johnstone & Güdel (2015) Johnstone C. P., Güdel M., 2015, Astronomy & Astrophysics, 578, A129
- Kasper et al. (2020) Kasper D., Bean J. L., Oklopčić A., Malsky I., Kempton E. M.-R., Désert J.-M., Rogers L. A., Mansfield M., 2020, The Astronomical Journal, 160, 258
- Kasting et al. (1993) Kasting J. F., Whitmire D. P., Reynolds R. T., 1993, Icarus, 101, 108
- Kite & Barnett (2020) Kite E. S., Barnett M. N., 2020, Proceedings of the National Academy of Science, 117, 18264
- Kopparapu et al. (2013) Kopparapu R. K., et al., 2013, ApJ, 765, 131
- Kubyshkina et al. (2020) Kubyshkina D., Vidotto A. A., Fossati L., Farrell E., 2020, Monthly Notices of the Royal Astronomical Society, 499, 77
- Lammer et al. (2007) Lammer H., et al., 2007, Astrobiology, 7, 185
- Lammer et al. (2009) Lammer H., et al., 2009, The Astronomy and Astrophysics Review, 17, 181
- Leblanc et al. (1998) Leblanc Y., Dulk G. A., Bougeret J.-L., 1998, Sol. Phys., 183, 165
- Lee (2019) Lee E. J., 2019, ApJ, 878, 36
- Lopez & Fortney (2013b) Lopez E. D., Fortney J. J., 2013b, The Astrophysical Journal, 776, 2
- Lopez & Fortney (2013a) Lopez E. D., Fortney J. J., 2013a, ApJ, 776, 2
- Lopez & Fortney (2014) Lopez E. D., Fortney J. J., 2014, The Astrophysical Journal, 792, 1
- Lopez et al. (2012) Lopez E. D., Fortney J. J., Miller N., 2012, The Astrophysical Journal, 761, 59
- Luger & Barnes (2015) Luger R., Barnes R., 2015, Astrobiology, 15, 119
- Méndez & Rivera-Valentín (2017) Méndez A., Rivera-Valentín E. G., 2017, The Astrophysical Journal Letters, 837, L1
- Mesquita & Vidotto (2020) Mesquita A., Vidotto A., 2020, Monthly Notices of the Royal Astronomical Society, 494, 1297
- Mohanty & Basri (2003) Mohanty S., Basri G., 2003, The Astrophysical Journal, 583, 451
- Orell-Miquel et al. (2022) Orell-Miquel J., et al., 2022, arXiv preprint arXiv:2201.11120
- Owen & Jackson (2012) Owen J. E., Jackson A. P., 2012, Monthly Notices of the Royal Astronomical Society, 425, 2931
- Owen & Mohanty (2016) Owen J. E., Mohanty S., 2016, Monthly Notices of the Royal Astronomical Society, 459, 4088
- Owen & Wu (2013) Owen J. E., Wu Y., 2013, The Astrophysical Journal, 775, 105
- Owen & Wu (2017b) Owen J. E., Wu Y., 2017b, The Astrophysical Journal, 847, 29
- Owen & Wu (2017a) Owen J. E., Wu Y., 2017a, ApJ, 847, 29
- Parker (1958) Parker E. N., 1958, The Astrophysical Journal, 128, 664
- Pierrehumbert & Gaidos (2011) Pierrehumbert R., Gaidos E., 2011, The Astrophysical Journal Letters, 734, L13
- Popinchalk et al. (2021) Popinchalk M., Faherty J. K., Kiman R., Gagné J., Curtis J. L., Angus R., Cruz K. L., Rice E. L., 2021, The Astrophysical Journal, 916, 77
- Reiners & Basri (2010) Reiners A., Basri G., 2010, The Astrophysical Journal, 710, 924
- Ribas et al. (2005) Ribas I., Guinan E. F., Güdel M., Audard M., 2005, The Astrophysical Journal, 622, 680
- Rogers (2015a) Rogers L. A., 2015a, ApJ, 801, 41
- Rogers (2015b) Rogers L. A., 2015b, The Astrophysical Journal, 801, 41
- Rogers & Seager (2010) Rogers L., Seager S., 2010, The Astrophysical Journal, 716, 1208
- See et al. (2014) See V., Jardine M., Vidotto A. A., Petit P., Marsden S. C., Jeffers S. V., do Nascimento J., 2014, Astronomy & Astrophysics, 570, A99
- Shields et al. (2016) Shields A. L., Ballard S., Johnson J. A., 2016, Physics Reports, 663, 1
- Stökl et al. (2016) Stökl A., Dorfi E. A., Johnstone C. P., Lammer H., 2016, The Astrophysical Journal, 825, 86
- Swain et al. (2021) Swain M. R., et al., 2021, The Astronomical Journal, 161, 213
- Tanaka et al. (2014) Tanaka Y. A., Suzuki T. K., Inutsuka S.-i., 2014, The Astrophysical Journal, 792, 18
- Trammell et al. (2014) Trammell G. B., Li Z.-Y., Arras P., 2014, The Astrophysical Journal, 788, 161
- Turbet et al. (2020) Turbet M., Bolmont E., Bourrier V., Demory B.-O., Leconte J., Owen J., Wolf E. T., 2020, Space science reviews, 216, 1
- Van Eylen et al. (2018a) Van Eylen V., Agentoft C., Lundkvist M. S., Kjeldsen H., Owen J. E., Fulton B. J., Petigura E., Snellen I., 2018a, MNRAS, 479, 4786
- Van Eylen et al. (2018b) Van Eylen V., Agentoft C., Lundkvist M., Kjeldsen H., Owen J. E., Fulton B. J., Petigura E., Snellen I., 2018b, Monthly Notices of the Royal Astronomical Society, 479, 4786
- Vidotto & Cleary (2020) Vidotto A. A., Cleary A., 2020, MNRAS, 494, 2417
- Weiss & Marcy (2014) Weiss L. M., Marcy G. W., 2014, The Astrophysical Journal Letters, 783, L6
- Zendejas et al. (2010) Zendejas J., Segura A., Raga A., 2010, Icarus, 210, 539