AGILE gamma-ray detection of the exceptional GRB 221009A
Abstract
Gamma-ray emission in the MeV–GeV range from explosive cosmic events is of invaluable relevance to understanding physical processes related to the formation of neutron stars and black holes. Here we report on the detection by the AGILE satellite in the MeV–GeV energy range of the remarkable long-duration gamma-ray burst GRB 221009A. The AGILE onboard detectors have good exposure to GRB 221009A during its initial crucial phases. Hard X-ray/MeV emission in the prompt phase lasted hundreds of seconds, with the brightest radiation being emitted between 200 and 300 seconds after the initial trigger. Very intense GeV gamma-ray emission is detected by AGILE in the prompt and early afterglow phase up to 10,000 seconds. Time-resolved spectral analysis shows time-variable MeV-peaked emission simultaneous with intense power-law GeV radiation that persists in the afterglow phase. The coexistence during the prompt phase of very intense MeV emission together with highly nonthermal and hardening GeV radiation is a remarkable feature of GRB 221009A. During the prompt phase, the event shows spectrally different MeV and GeV emissions that are most likely generated by physical mechanisms occurring in different locations. AGILE observations provide crucial flux and spectral gamma-ray information regarding the early phases of GRB 221009A during which emission in the TeV range was reported.
Introduction
The AGILE satellite is an Italian Space Agency mission launched in 2007 and dedicated to gamma-ray astrophysics (Tavani et al., 2009; Pittori & The Agile-SSDC Team, 2019). AGILE is made of four detectors that are sensitive in different energy ranges ranging from hard X-rays (18–60 keV, SuperAGILE detector), MeV energies (0.35–100 MeV, MCAL detector), and gamma-ray GeV energies (0.03–50 GeV, GRID detector). An anticoincidence (AC) system covers the instrument and is capable of detecting hard X-rays in the range 50–200 keV (see Appendix A). The AGILE-GRID field of view covers about 2.5 sr at any time with very good angular resolution. Since the satellite spins around the satellite–Sun direction, the GRID detector covers about 10 sr for each spinning revolution (7 minutes). Any source within the accessible sky region may be exposed by the GRID for time windows of duration of about 150 s for each revolution, with varying off-axis angles with respect to the normal incidence of the AGILE instrument. The MCAL and AC units are omnidirectional detectors with a sensitivity depending on incidence angles. Earth occultations of sky regions may also play an important role in transient source detection. These features of the AGILE measurements are important elements for the detection of gamma-ray bursts (GRBs).
1 GRB 220910A
On 2022 October 9, AGILE detected very intense hard X-ray and gamma-ray emission lasting hundreds of seconds from a new transient source (Ursi et al., 2022a; Piano et al., 2022), initially classified as an X-ray transient (Swift J1913.1+1946, Dichiara et al., 2022), and subsequently identified as GRB 221009A (Veres et al., 2022). The event was recorded by several satellites during the prompt phase (Dichiara et al., 2022; Negoro et al., 2022; Veres et al., 2022), and afterglow emission was detected and monitored in the following days (Brivio et al., 2022; Kumar et al., 2022). Very-high-energy emission in the TeV energy range was reported during the initial phases of the GRB (Huang et al., 2022). An overview of observations of GRB 221009A was reported by several X-ray/hard X-ray instruments including Fermi Gamma-ray Burst Monitor (GBM; Lesage et al. 2023), Konus-Wind (Frederiks et al., 2023), and subsequently Swift in the afterglow phase (Williams et al., 2023). The redshift of the optical transient is (Malesani et al., 2023; de Ugarte Postigo et al., 2022) which corresponds to a distance of 750 Mpc. In this Letter we adopt the Fermi-GBM trigger time in the hard X-ray band on 2022 October 9, 13:16:59.99 UT (Lesage et al., 2022).
2 AGILE Observations
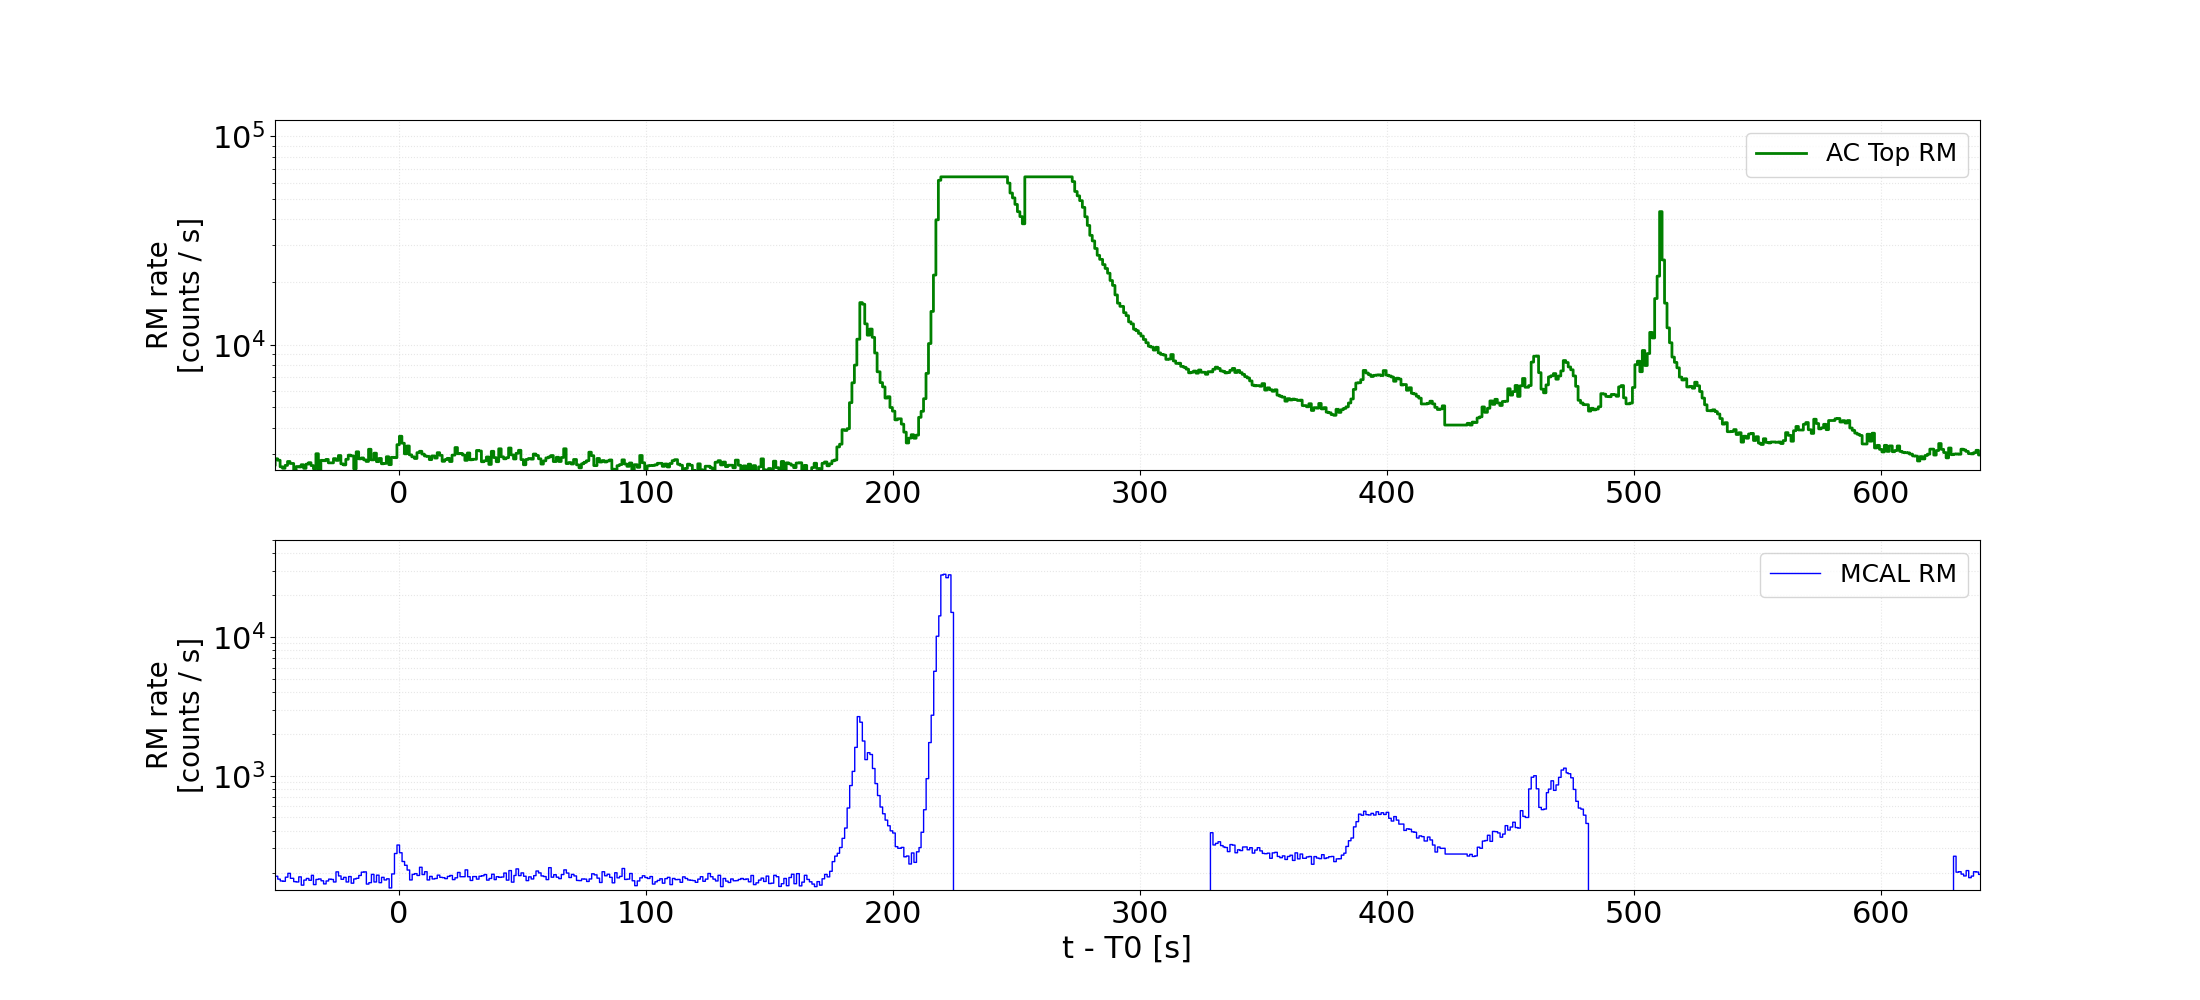
The GRB 221009A emission is quite complex: the initial triggering event at turns out to be a weak precursor to the brightest part of the GRB that occurred between + 200 s and + 300 s. The event was recorded by all AGILE detectors active at that time. Figure 1 shows the lightcurves of the AC, MCAL and GRID detectors spanning an extended time window of about 2000 s. A detailed view of the first 600 s of the event in the hard X-ray range, as obtained by the AC and MCAL ratemeters (RMs), is reported in Appendix B (Figure 7). AGILE detectors recorded the most intense part of the GRB 221109A source activity with no Earth occultations. Data were gathered with a time modulation of the signal depending on source exposure.
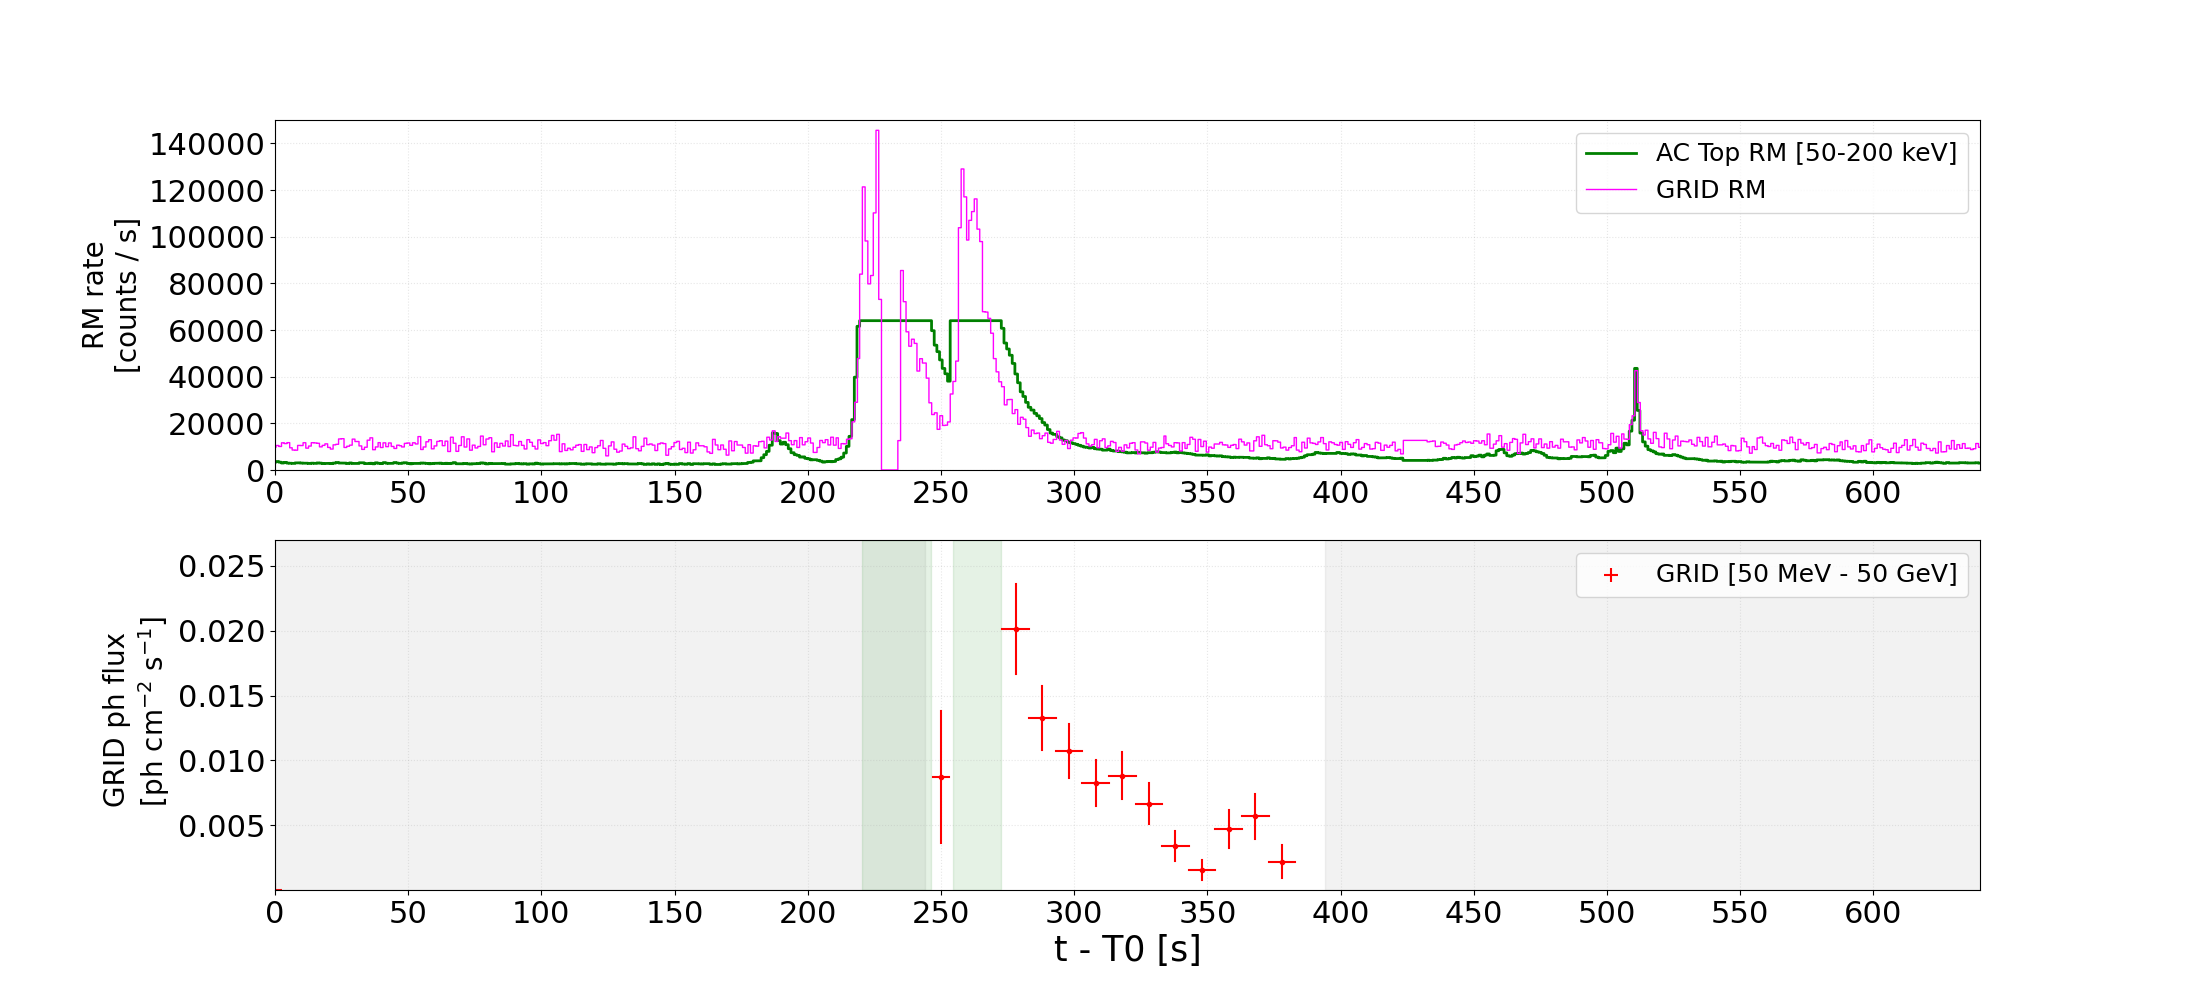
The hard X-ray emission of the entire prompt phase of GRB 221009A lasted about 500 s and was recorded by the AC, MCAL, and GRID RMs. As shown in Figure 1, this emission was so intense to occasionally saturate the AC, MCAL and GRID ratemeter counters and detectors during the most prominent phase of the emission for 220 s 270 s (hereafter, time is measured from ). The early detection in the hard X-ray range was followed by a remarkably intense gamma-ray emission above 50 MeV revealed by the GRID detector as the GRB 221009A source position entered the GRID field of view (FoV) with an off-axis angle lower than 60∘. Figure 2 (top panel) shows the AC and GRID RM lightcurves in the hard X-rays. Figure 2 (bottom panel) shows the gamma-ray emission above 50 MeV as recorded by the GRID detector. Because of a very intense hard X-ray flux, the AC RMs were saturated at the level of making it difficult to properly correct the observed fluxes recorded by the GRID during saturated intervals (the AC is used as charged particle veto in the gamma-ray GRID trigger algorithm; see Appendix B.1). Because of the AC ratemeter saturation, we excluded from the GRID data set the time intervals [220.4, 246.4 s] and [254.4, 272.6 s], marked with green bands in Figure 2 (bottom panel). However, very bright gamma-ray emission is detected in the first available time bin unaffected by AC saturation (centered at = 250 s) and, after AC saturation, in the 10 s time interval centered at = 278 s.
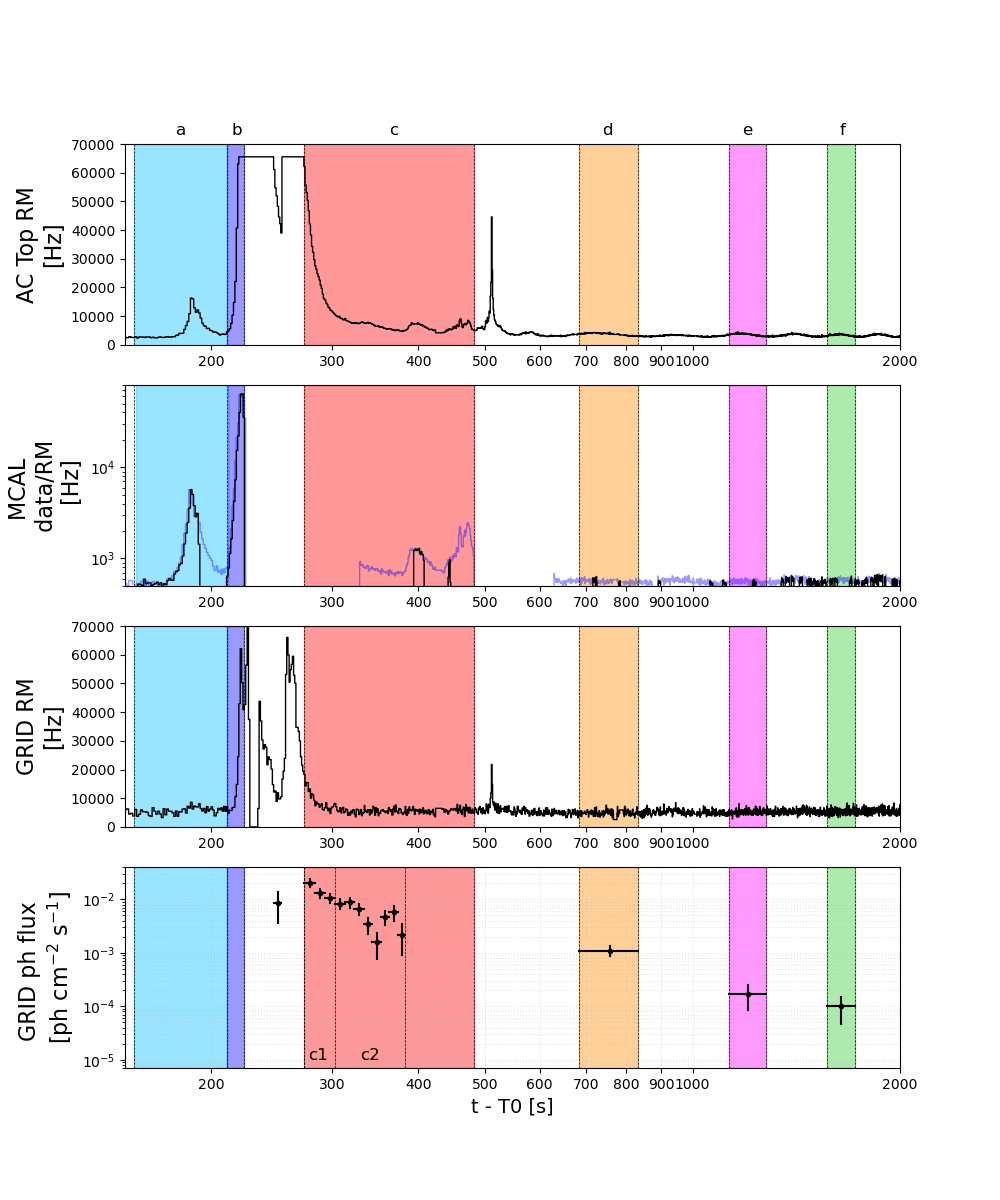
It is convenient to define the following time windows in Figure 1.
-
•
Interval (a): 155 s 211 s, covers a first phase of the intense hard X-ray emission peaking near 180 s. Detection by the AC and MCAL RMs. No imaging gamma-ray GRID exposure and no detection by GRID RMs.
-
•
Interval (b): 211 s 223 s, covers about 10 s of the rapid flux increase to extremely large values that eventually saturated both the AC and MCAL RMs. It is detected by AC, MCAL, and GRID ratemeters with MCAL triggers and spectral information.
-
•
Interval (c): 273 s 482 s, follows the first very intense hard X-ray episode, and it is monitored by the AC and GRID RMs. Starting at = 273 s very intense gamma-ray emission is detected as the GRID exposure becomes optimal. Figure 2 shows the detail of the gamma-ray emission above 50 MeV with time bins of 10 s. The MCAL detector is saturated during the first part of interval (c), and this detector has additional triggers and spectral information around = 400 s.
-
•
Interval (d): 684 s 834 s, covers a time interval corresponding to the next GRID exposure. The source is detected in gamma-rays in what appears to be the early afterglow phase.
-
•
Interval (e): 1129 s 1279 s, covers the time window corresponding to the third GRID exposure since . The source is detected in gamma-rays in the afterglow phase.
-
•
Interval (f): 1569 s 1719 s, covers the time window corresponding to the fourth GRID exposure. The source is detected in gamma-rays in the afterglow phase.
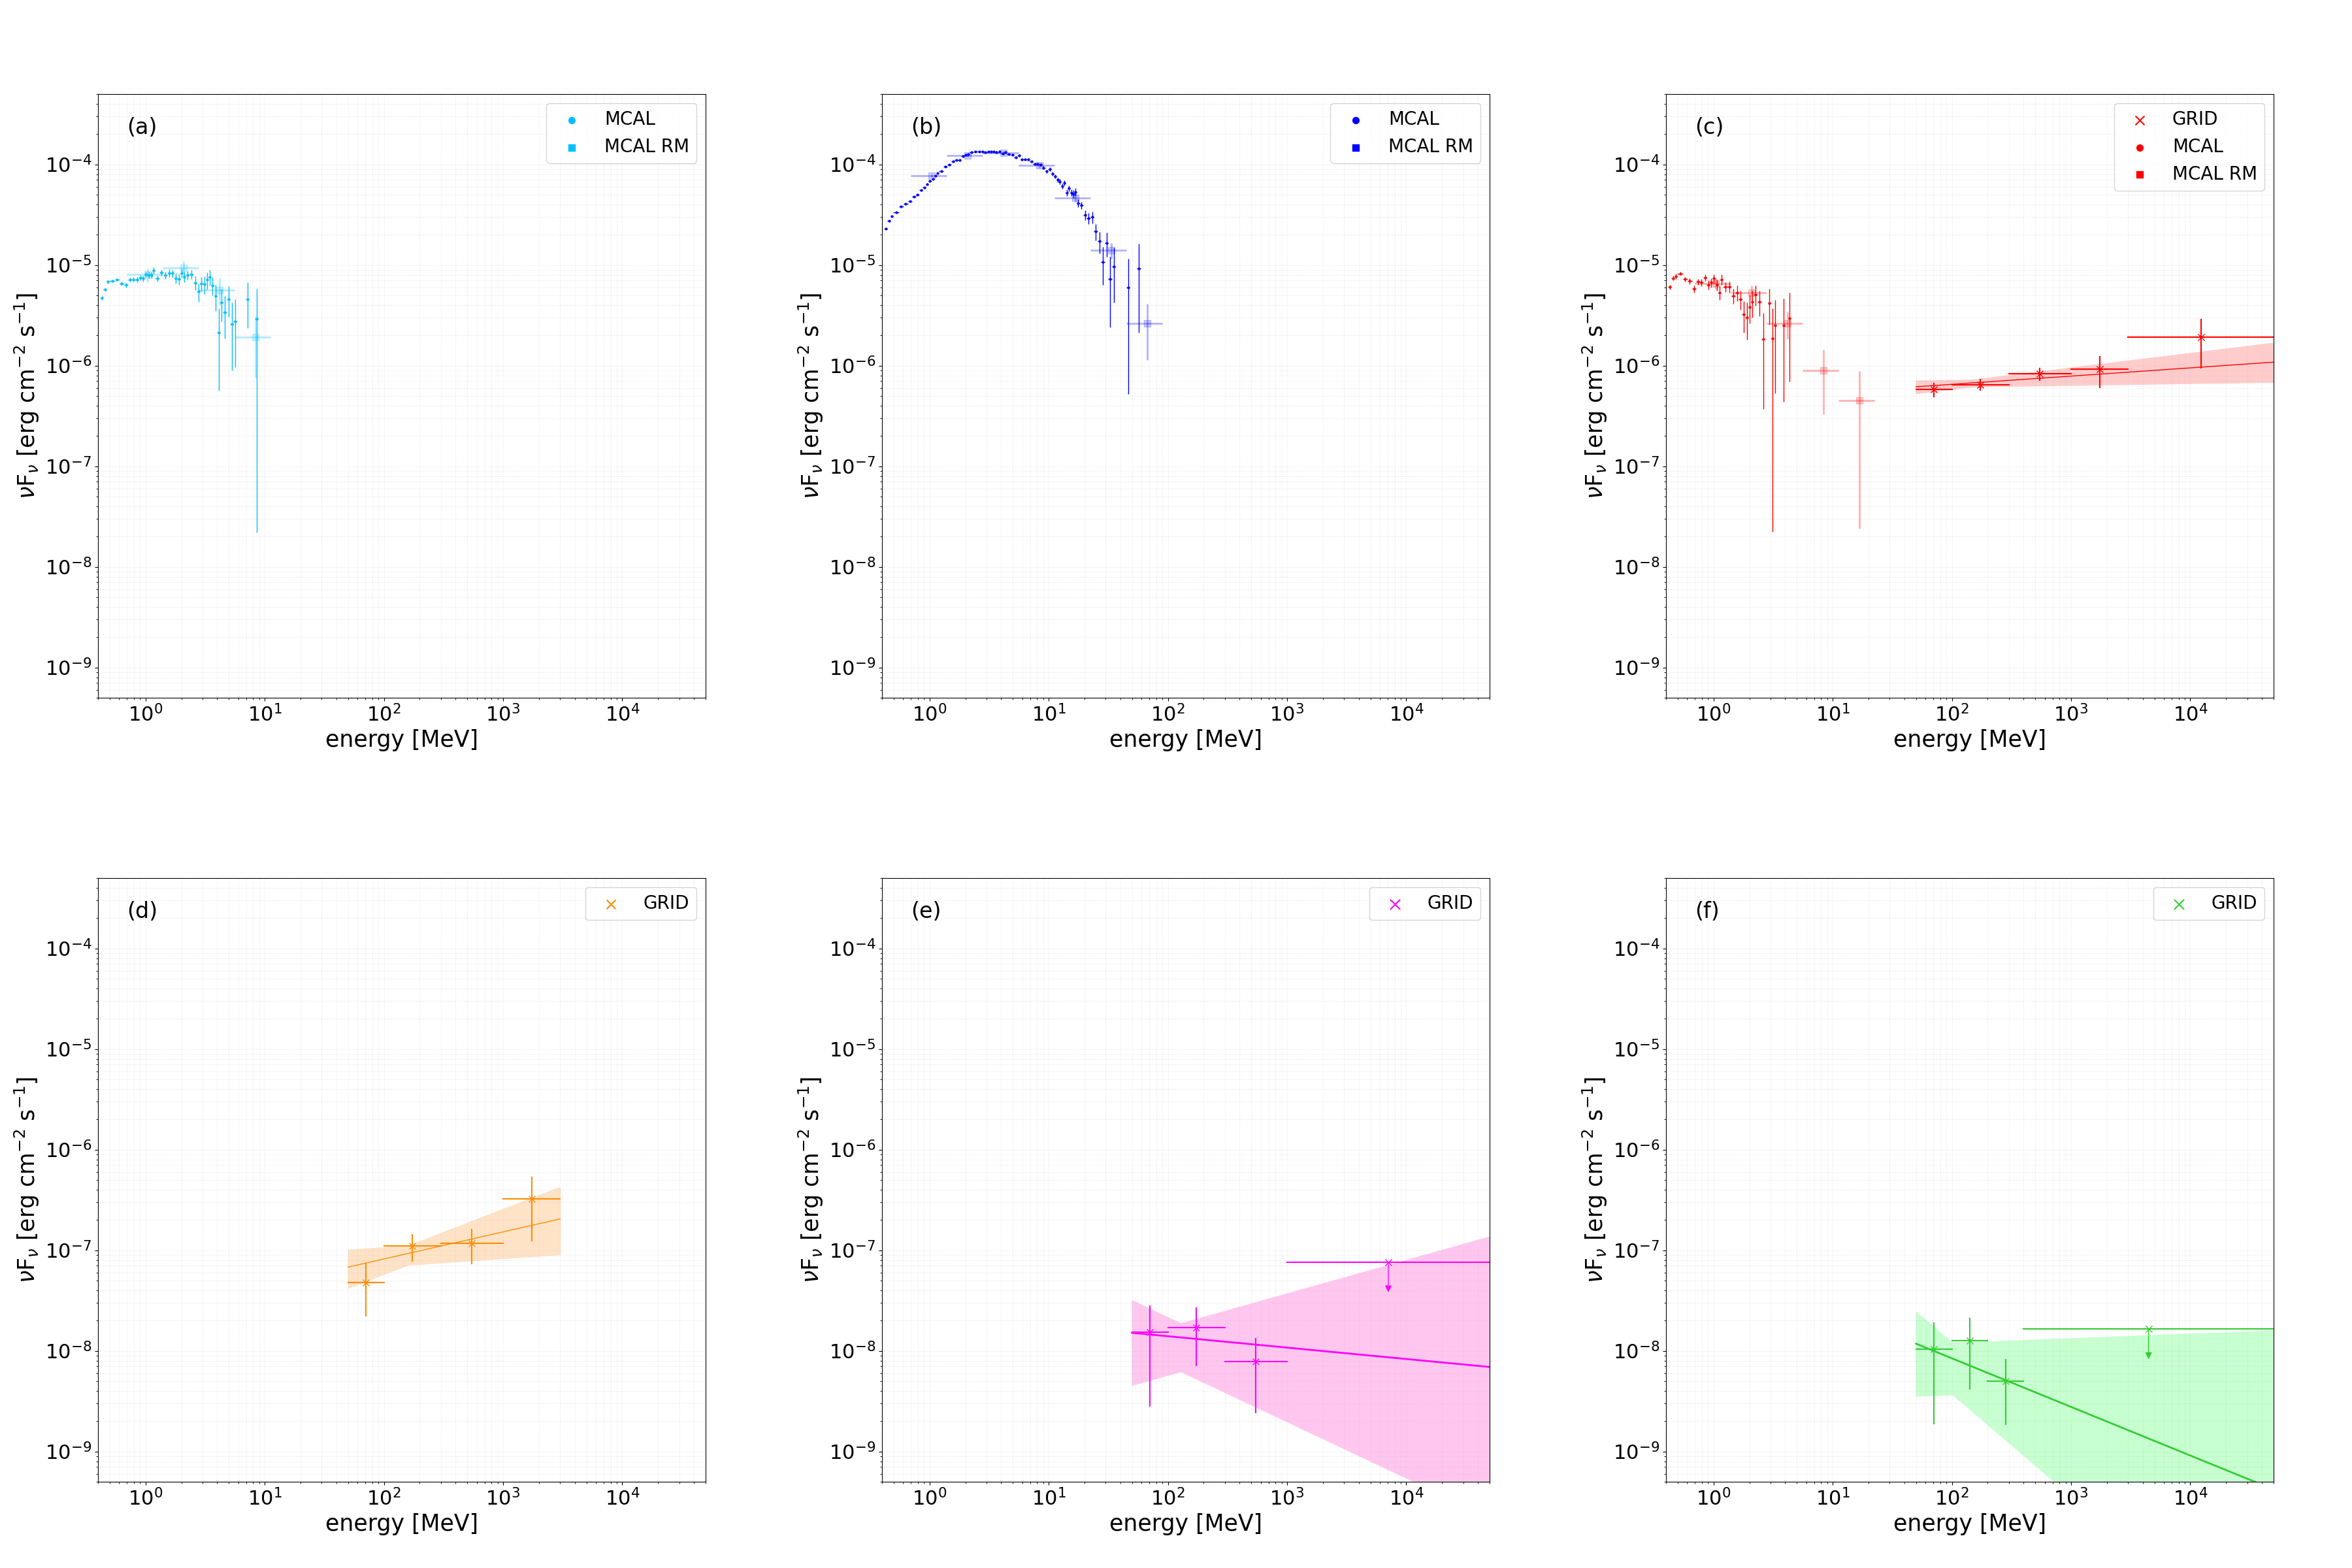
Table 1 provides a summary of GRID and MCAL observations selected for this study (in all other cases, the GRID times are rounded to integer values for the sake of simplicity). Several spectral features are worth noticing as summarized in Figure 3. A high-flux MCAL spectrum in interval (b) is obtained during the very bright rising phase of the prompt emission episode near 220 s, showing the brightest spectrum ever detected by AGILE from any previous GRBs. No simultaneous GRID data were available at that time (see Table 1). Nevertheless, a GRID gamma-ray detection with a significance of 5 is found during the time interval [247, 253 s], just between the two AC saturated windows, with a flux ph cm-2 s-1 (photon energy between 50 MeV and 50 GeV) and a photon index = 2.3 0.6.
Following the second AC saturation interval, very intense gamma-ray emission is detected by the GRID up to = 383 s with a decreasing flux and average spectral photon index = 1.92 0.06 (see Table 3 in Appendix B.1). Spectral information in the MeV range from MCAL could be obtained near = 400 s. The coexistence of the MeV and GeV components is shown in the integrated spectrum of interval , which can be considered the beginning of the GRB afterglow (see Figure 3). Interval (d) shows a hardening of the GeV component and an overall decrease of the gamma-ray flux. Spectra of intervals (e) and (f) are suggestive of spectral softening at long timescales as the gamma-ray flux further decreases during the afterglow phase.
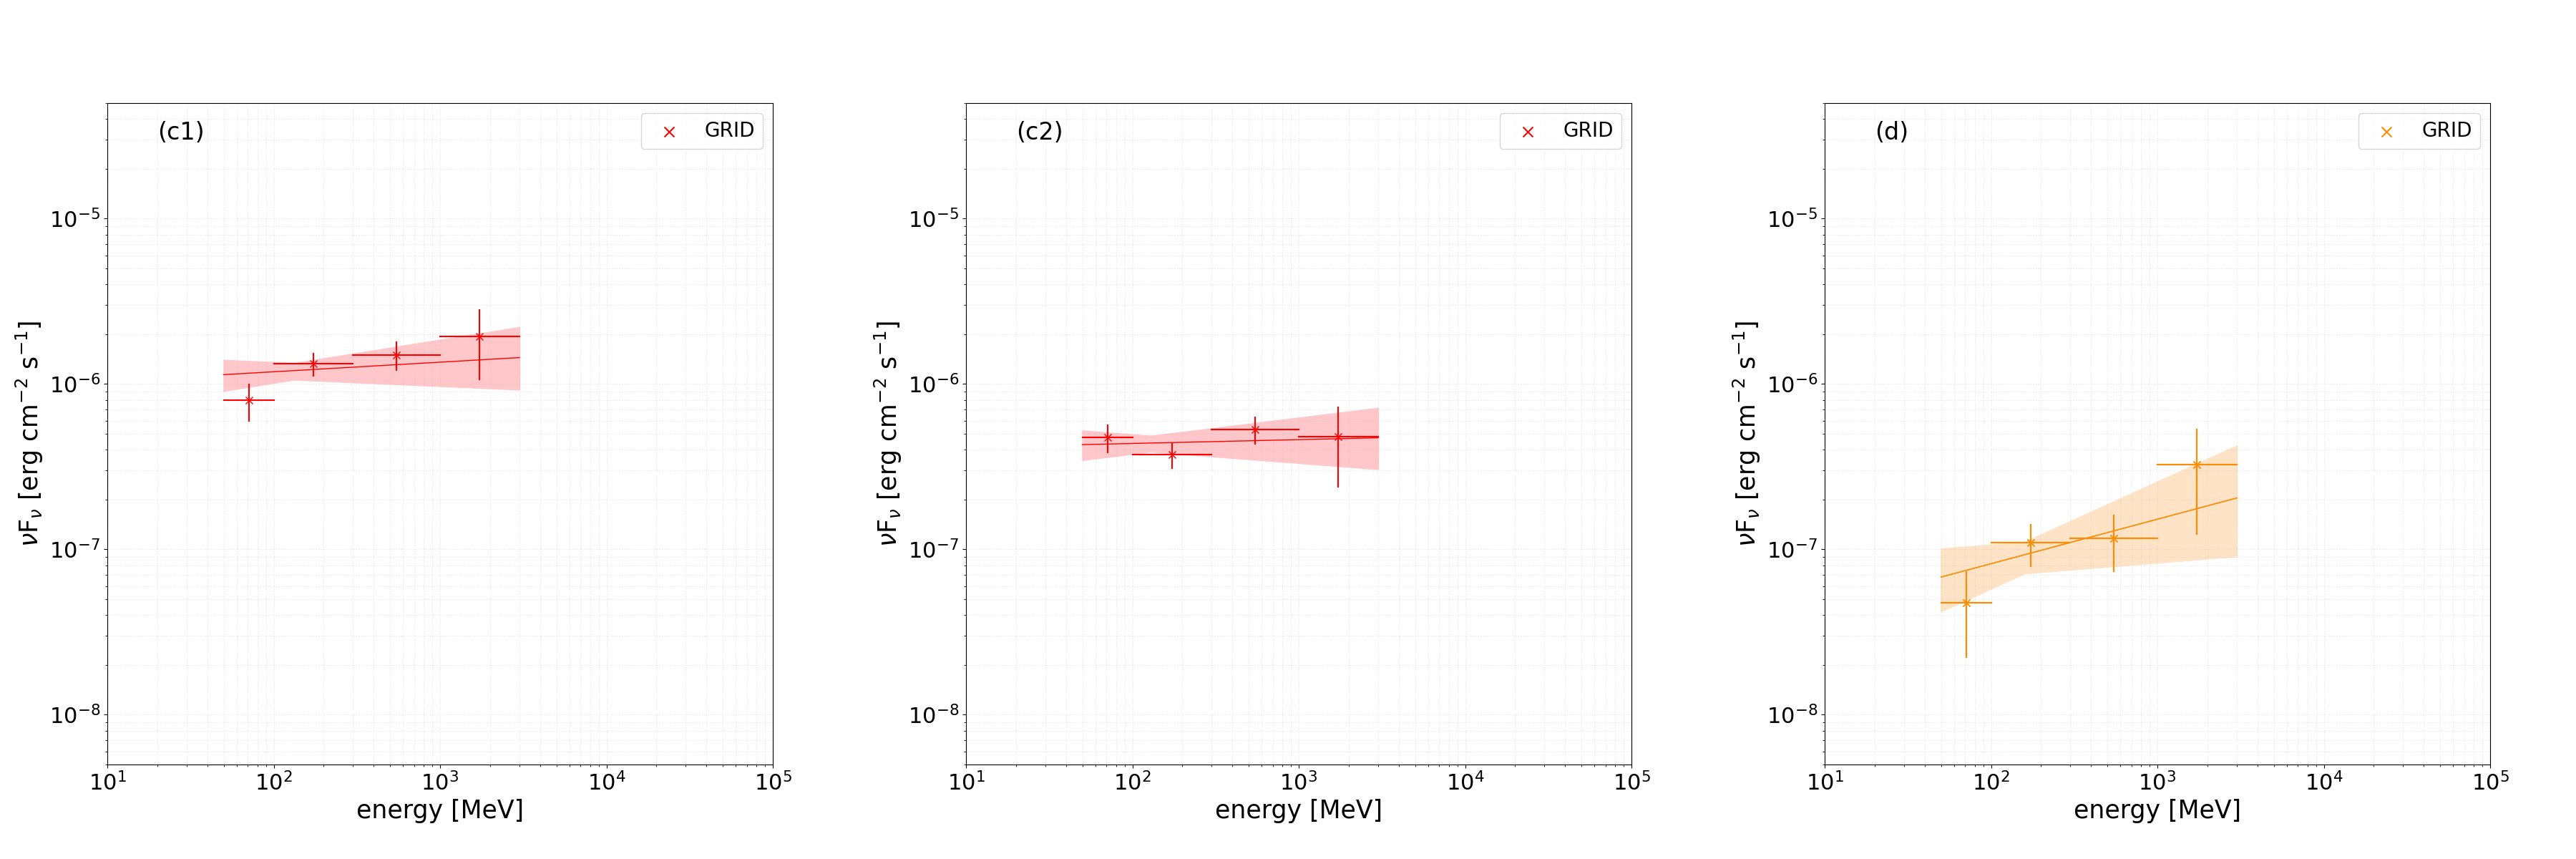
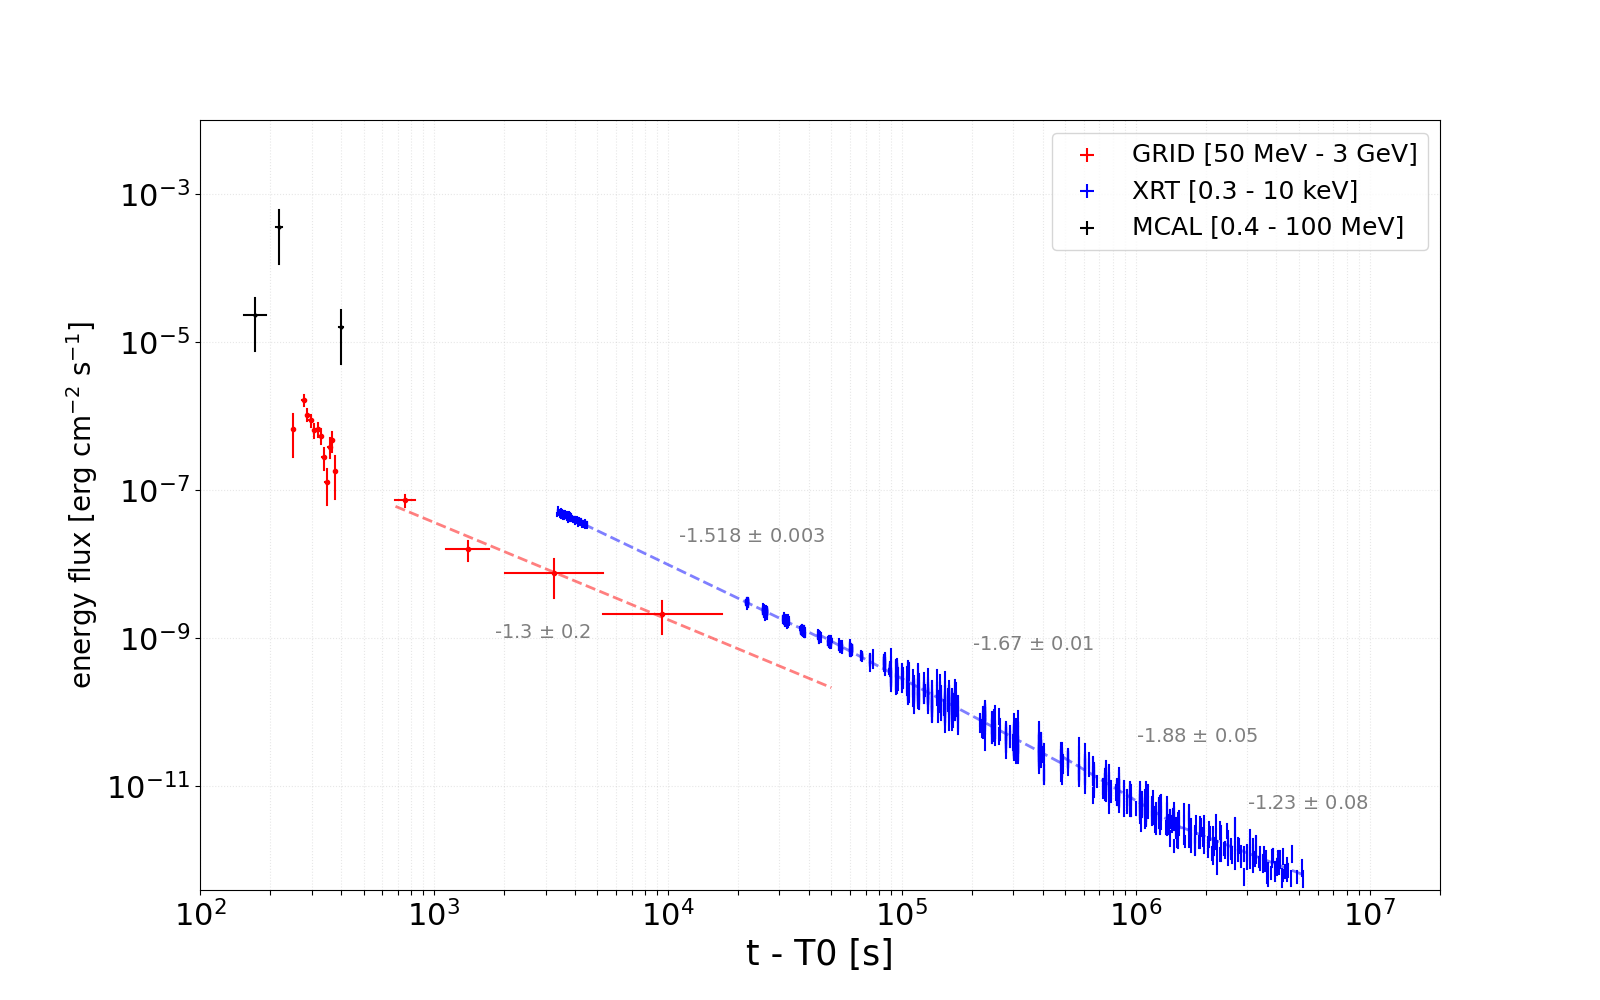
Spectral hardening in the GeV range as the overall flux decreases in the early phases of the afterglow is made clear in Figure 4, which shows GRID spectra for interval (c), split in two parts, and interval (d). The gamma-ray spectral evolution, as reported by the GRID at the GeV energy range, is suggestive of emission possibly to even larger energies, as indeed reported in Williams et al. (2023). It is peculiar to GRB 221009A that the timing of this GeV spectral hardening possibly up to hundreds of GeV energies or beyond occurs in the interval 700–800 s after trigger. It is worth noticing that GRB 190114C, the first GRB ever announced to have a very-high-energy afterglow in the TeV range (MAGIC Collaboration et al., 2019), showed the hardening additional GeV spectral component on a timescale of tens of seconds (Ursi et al., 2020) instead of hundreds of seconds as in the case of GRB 221009A. AGILE observations provide then crucial gamma-ray information for the early phases of GRB 221009A during which intense emission in the TeV energy range was reported (Huang et al., 2022). Starting at 680 s, the time evolution of the GRID gamma-ray flux F(50 MeV – 3 GeV) can be fit as a power law with . Figure 5 shows the gamma-ray flux evolution of GRB 221009A as detected by AGILE as compared to the X-ray afterglow as monitored by Swift X-Ray Telescope (XRT; Williams et al. 2023). The temporal power-law agreement between the X-ray and gamma-ray emissions is evident during the afterglow phase. This latter feature is an important point that relates the afterglow physics of GRB 221009A with other GRBs with prominent gamma-ray emissions (e.g., GRB 130427A, Ackermann et al. 2014; GRB 190114C, MAGIC Collaboration et al. 2019; GRB 220101A, Ursi et al. 2022b). Despite the very different timescales and MeV–GeV peak fluxes of the prompt emission, GRB 221009A shares the afterglow dynamics and radiative processes with other GRBs with intense gamma-ray afterglows (Ackermann et al., 2014; MAGIC Collaboration et al., 2019; Ursi et al., 2022b).
| Intervals | MCAL | MCAL | GRID | |||
|---|---|---|---|---|---|---|
| Data | RM | Data | ||||
| (s) | (s) | |||||
| a | 154.80 | 192.07 | yes | yes | no | |
| 192.07 | 210.85 | no | yes | no | ||
| b | 210.85 | 223.23 | yes | yes | no | |
| c | c1 | 273.01 | 303.01 | no | no | yes |
| c2 | 303.01 | 329.59 | no | no | yes | |
| 329.59 | 383.01 | no | yes | yes | ||
| 383.01 | 393.59 | no | yes | no | ||
| 393.59 | 407.55 | yes | yes | no | ||
| 407.55 | 441.99 | no | yes | no | ||
| 441.99 | 445.11 | yes | yes | no | ||
| 445.11 | 481.55 | no | yes | no | ||
| d | 684.01 | 834.01 | no | yes | yes | |
| e | 1129.01 | 1279.01 | no | yes | yes | |
| f | 1569.01 | 1719.01 | no | yes | yes | |
3 Theoretical modeling
The relativistic fireball model of the afterglow emission can be applied to an expansion in different environments. The gas density under different environmental conditions can be represented as , where we adopt the radial distance , a normalization constant , and the density profile index . Common astrophysical scenarios include an expansion taking place in a constant density medium (), or within a dense stellar environment (). As shown in the case of GRB 190114C (MAGIC Collaboration et al., 2019), a complete set of multifrequency information regarding the complex afterglow phase is essential for a comprehensive quantitative treatment of GRB 221009A. This is particularly important when distinguishing between the different possible astrophysical scenarios with or .
For this reason, we will limit our discussion only to verify that – in a reasonable scenario of GRB evolution in a constant density medium () – the AGILE data presented in this work play a crucial role in order to better define the physics of this extremely bright event. Remarkably, this event has been detected up to very-high-energy -rays by LHAASO (Cao et al., 2023). Thus, in this Letter we model the AGILE data together with the LHAASO data for a simultaneous observing time window. We find that the combined data sets effectively constrain the physical parameter space, being consistent with the one presented in Cao et al. (2023). This is especially significant in understanding the transition from synchrotron to synchrotron self-Compton (SSC) emission. However, since the parameter space is affected by degeneracy, the resulting model may result from a different parameter choice. A comprehensive exploration of the model fully applied to the data will be addressed in an upcoming publication (L. Foffano et al. 2023, in preparation).
For a physical interpretation of the AGILE data, we consider an external shock model describing the adiabatic expansion of a relativistic blast wave in a constant density medium (). This model describes the GRB afterglow emission as due to synchrotron and inverse Compton (IC) radiation produced by relativistic fireballs expanding in the surrounding medium (e.g., Sari et al., 1998; Sari & Esin, 2001). The evolution of the blast waves is described as a function of time after the initial event occurring at + 226 s (here we assume, for simplicity, the same reference time adopted in Cao et al., 2023). The temporal dependence of the radial distance in the observer’s frame is described by . The circumburst density of the surrounding medium is described by , assuming that it is distributed homogeneously over the radial distance. The shock front is expanding with bulk Lorentz factor , accelerating electrons and positrons over a power-law energy distribution above a minimum energy . A homogeneous magnetic field is assumed to be cospatial with the accelerating particles. Here we adopt as the Thomson cross section; and as the electron and proton mass, respectively; and as the electron and magnetic field efficiencies, respectively.
During the acceleration process, electrons with energy above the cooling Lorentz factor of the electrons lose an important portion of their energy via synchrotron cooling within a time . Particularly important is the relation between and , which correspond to two different physical regimes. When , the particles are in a slow-cooling regime, and only those with cool efficiently. Conversely, when , the particles are in a fast-cooling regime, and all of them are emitting efficiently. In our model, both regimes are considered depending on the evolution of and over time.
For the modeling of GRB 221009A, we use the following set of parameters. In a structured-jet GRB scenario (Sari et al., 1999; Dai & Cheng, 2001), we adopt an exceptional total GRB isotropic equivalent energy erg (larger than the upper limit of the distribution shown in Atteia et al., 2017, but consistent with the value reported in Cao et al., 2023), an initial shock bulk Lorentz factor , the power-law index of the particle distribution , electron energy efficiency , magnetic field efficiency , and constant particle density cm-3 (consistent with the values reported in MAGIC Collaboration et al., 2019 for GRB 190114C, and in Cao et al., 2023 for GRB 221009A). In this model, we adopt the Thompson cross section or the Klein-Nishina cross section (Klein & Nishina, 1929) depending on the physical conditions and the specific regime of the scattering. Additionally, internal absorption suppression is considered depending on the interacting photon energies and the radius of the internal shock. Absorption at gamma-rays by interaction with the extragalactic background light (EBL) is also shown adopting the model by Domínguez et al. (2011).
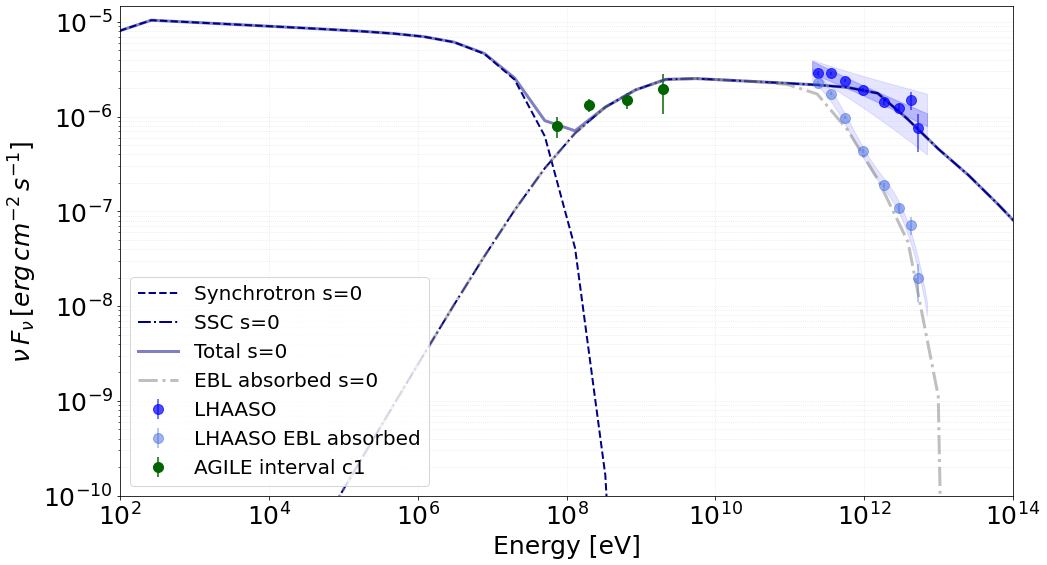
In Figure 6, we show the spectral energy distribution of the external shock model with the set of parameters described above between + 22 s and + 100 s (248 s and 326 s after , respectively). Data from the GRID detector of the AGILE instrument are reported. Additionally, we include also data from the LHAASO observatory detected within the aforementioned time window (Cao et al., 2023). It is interesting to note that the GRID data and LHAASO data are well described by IC emission of the afterglow of GRB 221009A in the considered time interval.
During that time interval, MCAL data are strongly influenced by prompt emission of the GRB, which is not described by the afterglow model. Additionally, there are no MCAL data strictly simultaneous with GRID and LHAASO observations together. Thus, MCAL data are not presented in the multifrequency spectral energy distribution in Figure 6.
4 Discussion and conclusions
The unusual intensity of the high-energy emission of GRB 221009A during the prompt phase can be the result of different factors, including a large (isotropically equivalent) energy available for the burst erg (Veres et al., 2022), a large radiative efficiency, a relatively small angle of the jet axis with respect to the line of sight (Bright et al., 2023; Laskar et al., 2023; Negro et al., 2023; Cao et al., 2023), and a relatively small source distance. On the other hand, the X-ray lightcurve of GRB 221009A of the prompt phase shows complex features and a duration that can be attributed to peculiar properties of the central source, or to the fireball expansion in an environment different from that of other similar GRBs. Prompt emission can originate from synchrotron radiation of relativistic electrons/positrons (Rees & Meszaros, 1994) or reprocessed radiation from an optically thick photosphere (Bošnjak et al., 2009). The MCAL spectrum of interval (b), shown in Figure 3, represents the emission during the very rapid rising portion of the hard X-ray lightcurve. The emission peaks at MeV and the low-energy spectral index is 1. Above the spectral intensity significantly decreases, as it is typical of other GRBs. The (isotropically equivalent) peak luminosity in the MeV band is erg s-1. There is no information from the AGILE-GRID during the interval (b) because of lack of exposure. As the GRID exposure allows it during interval (c), a very prominent and hard gamma-ray emission is produced with a spectrum quite different from the decaying part of the MeV component. As is evident in Figure 2, the prompt emission is supplemented by an additional GeV component that we attribute to IC emission of high-energy electrons and positrons in a bath of soft photons. Given the spectral features of interval (c), the SSC model can be most likely used in an afterglow-like expansion scenario rather than the physical conditions of the prompt phase (Bošnjak et al., 2009). The prompt MeV emission and the GeV SSC component are then manifestations of two different emitting regions (as modeled for GRB 190114C; see e.g., MAGIC Collaboration et al., 2019), the former being related to the inner (and probably optically thick region), and the latter being produced in an optically thin and relativistically expanding environment to avoid pair creation photon suppression at GeV as well as TeV energies. We notice that the GRID (isotropically equivalent) peak luminosity and total energy radiated in the GeV band during interval (c) are erg s-1 and erg, respectively.
GRB 221009A, with its remarkable features regarding the intensity, spectral, and duration properties, belongs to a class of GRBs showing the dramatic transition between prompt and afterglow emission with a phase of coexistence of MeV and GeV emissions of very different spectral properties. AGILE data provide crucial information during the most important phases of the GRB emission in terms of gamma-ray flux intensity and spectral evolution and contribute to the physical modeling that will be undertaken with the complete set of multifrequency data.
Appendix A The AGILE Mission
Astrorivelatore Gamma ad Immagini LEggero (AGILE; Tavani et al., 2009) is a space mission of the Italian Space Agency (ASI) devoted to X-ray and gamma-ray astrophysics, developed with scientific and programmatic participation by INAF, INFN, CIFS, several Italian universities and industrial contractors. The AGILE payload consists of the Gamma Ray Imager Detector (GRID) and a hard X-ray detector SuperAGILE for the simultaneous detection and imaging of photons in the 30 MeV–50 GeV and in the 18–60 keV energy ranges, respectively. The payload is completed by two all-sky nonimaging detectors: a mini-calorimeter (MCAL) sensitive in the energy range 350 keV – 100 MeV, and an anticoincidence (AC) system in the band 50–200 keV.
The AGILE satellite has been operating nominally since 2007 in a low Earth equatorial orbit, and in its spinning observation mode it performs a monitoring of about 80% of the entire sky with its imaging gamma-ray detector every 7 minutes.
The AGILE data are downlinked every 95 minutes to the ASI Malindi ground station in Kenya, transmitted first to the Telespazio Mission Control Center at Fucino, and then sent within 5 minutes after the end of each contact to the AGILE Data Center (ADC), which is part of the ASI multimission Space Science Data Center (SSDC, Pittori & The Agile-SSDC Team 2019). The ADC oversees all the scientific-oriented activities related to the analysis and archiving and distribution of the AGILE data. The AGILE ground segment alert system is distributed among ADC and the AGILE Team Institutes, and it combines the ADC quick look with the AGILE Science Alert System developed by the AGILE Team (Bulgarelli, 2019).
Appendix B AGILE observations of GRB 221009A
We analyzed the GRB by taking into account all the available data detected by the instruments on board the AGILE satellite: GRID and MCAL (SuperAGILE was not in observing mode in the considered time window), including the scientific RMs from the GRID, MCAL, and AC system. RMs are low-time-resolution lightcurves with an almost continuous coverage. In Figure 7, the AC-Top and MCAL RMs for the first 600 s following are displayed, revealing the complex time evolution of the hard X-ray component during the GRB’s early phase. Additionally, we chose to present in this work (e.g., in Figures 1 and 2) the “unvetoed” GRID RMs: they include the integrated signal recorded by the silicon strips in each Si-tracker plane, before the onboard trigger logic for photon acquisition is applied, taking into account the AC-induced veto signal (Tavani et al., 2009). This raw RM, preceding the preliminary onboard -ray event reconstruction and the first background rejection for -ray photon acquisition, is also influenced by the high level of incoming X-rays.
We performed an analysis of the whole data set, starting from = 2022-10-09 13:16:59.99 UT. Table 1 gives an overview of the AGILE data (MCAL and GRID photon acquisition) within the time interval [150, 1800 s]. Time is measured from .
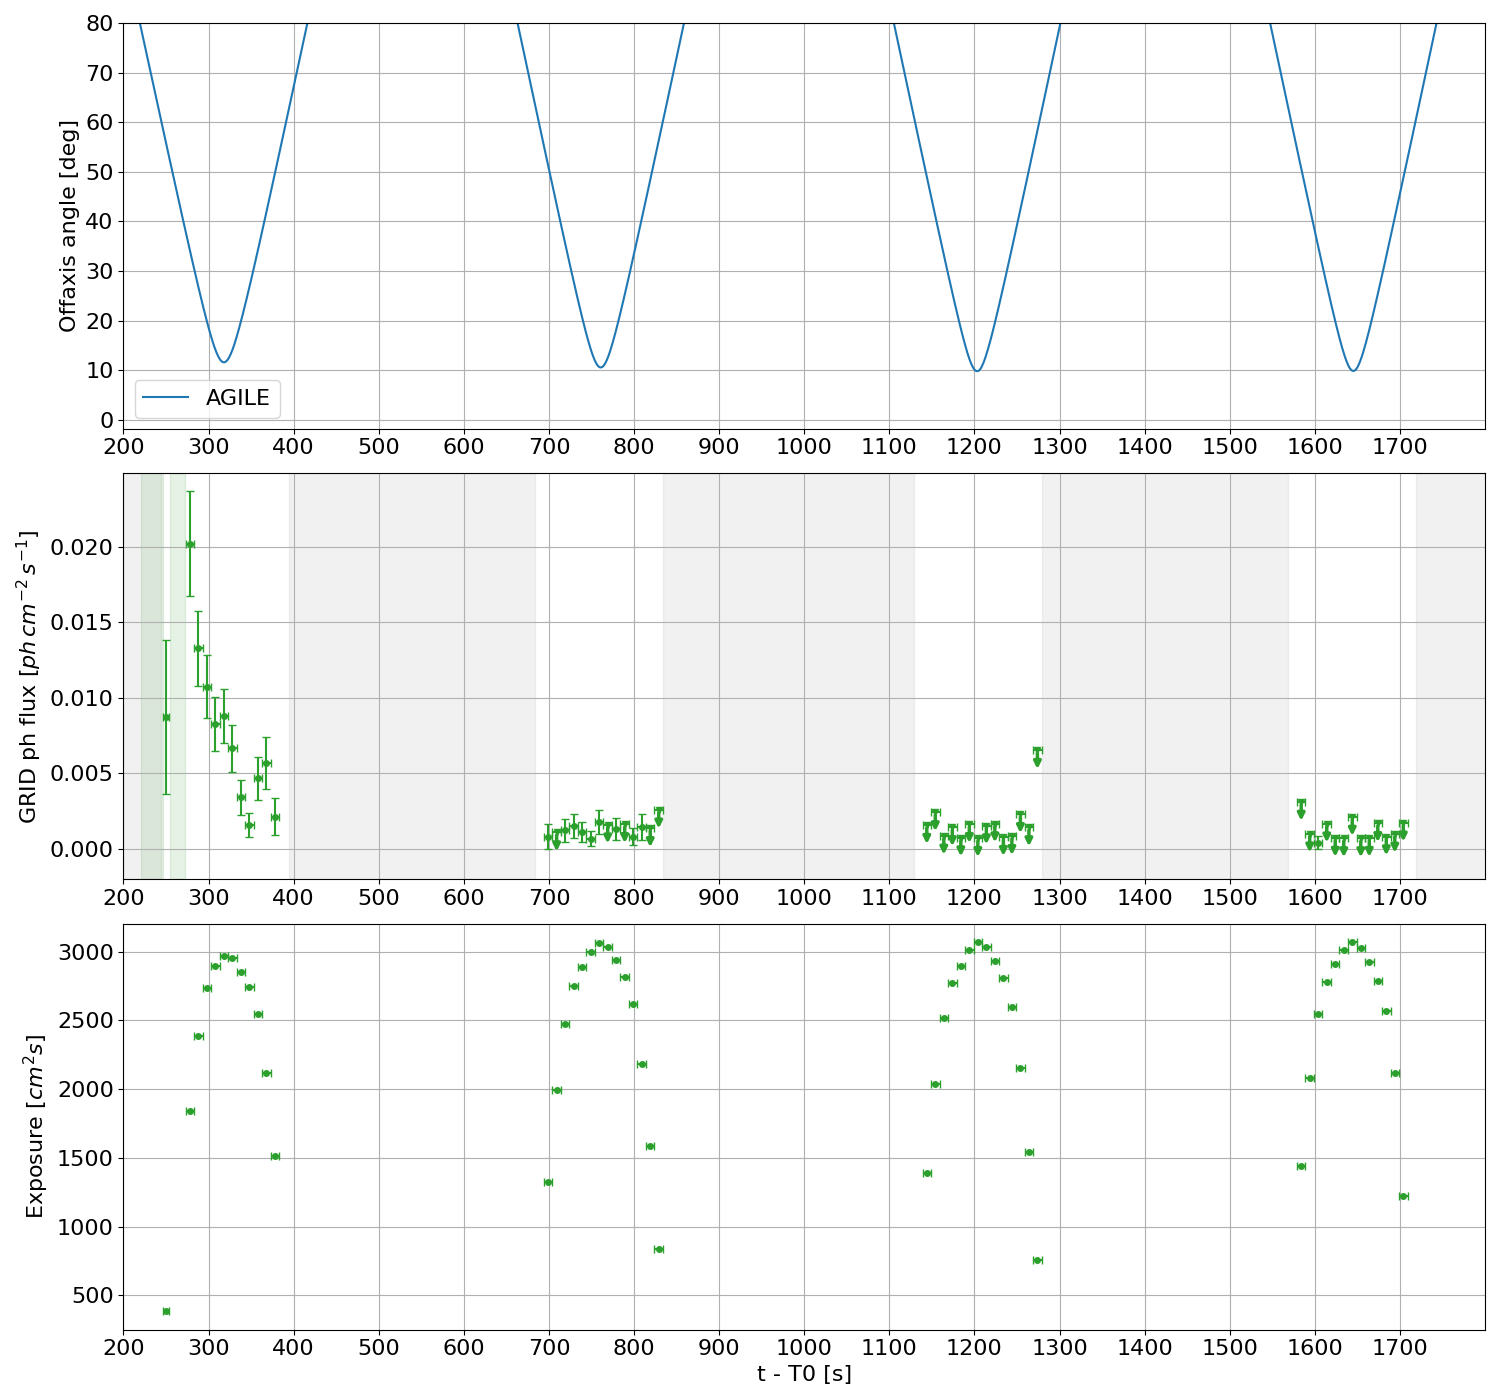
After , at 244 s, GRB 221009A entered for the first time in the GRID FoV (off-axis angle lower than 60∘). Due to the AGILE spinning mode, the GRID exposed the GRB discontinuously, with 150 s of source visibility (observation windows, OWs) and 290 s in which the source is outside the FoV (see Figure 8). The first four GRID OW time intervals are reported in Table 2.
| Observation Window | ||
|---|---|---|
| (OW) | (s) | (s) |
| OW1 | 244 | 394 |
| OW2 | 684 | 834 |
| OW3 | 1129 | 1279 |
| OW4 | 1569 | 1719 |
The AC-Top scintillator panel became saturated, after the beginning of the prompt phase, by the extraordinarily high incoming X-ray radiation. Due to the onboard veto logic, the AC-Top panel has a prominent role to inhibit the -ray event acquisition in the GRID detector: when the AC-Top scintillator produces a signal due to an incoming radiation (X-ray photon or charged particle), a veto is activated in the GRID onboard logic. This veto signal inhibits the -ray photon acquisition in the GRID detector for a time interval = 5.14 s.
In order to properly consider this additional dead time for this extremely bright event, we corrected the GRID livetime, by subtracting a -duration time interval for each corresponding AC-Top count. This correction reduces the effective GRID livetime and, consequently, the source exposure during the prompt phase of the GRB. In this study, we apply this correction to the GRID exposure time, by taking into account the AC-Top count rate only.
During the time intervals [220.4, 246.4 s] and [254.4, 272.6 s] the RM of the AC-Top panel is saturated (due to a telemetry limit) at a level of 65535 counts s-1 (see Figure 2). Thus, we cannot apply an accurate correction to the GRID livetime, since we do not know the exact count rate of the AC-Top panel. For this reason, in order to preserve a conservative analysis approach to this extraordinary event, we have currently excluded these two windows from our GRID analysis. Ongoing studies are in progress to properly quantify the gamma-ray emission detected by the GRID during these phases.
B.1 GRID Analysis
The GRID data have been analyzed with the last available AGILE-GRID software package (Build 25), FM3.119 calibrated filter, H0025 response matrices, and consolidated archive (ASDCSTDk) from the AGILE Data Center at SSDC. Standard data cuts have been applied: South Atlantic Anomaly event cut and 80∘ Earth albedo filtering have been applied, by taking into account only incoming events with an off-axis angle lower than 60∘. Event type “G”, for confirmed gamma-ray photon topology – the most discriminating event selection of the GRID data set – was used for our analysis. Flux measure and detection significance were calculated by using the AGILE multi-source likelihood analysis (MSLA) software (Bulgarelli et al., 2012) based on the test statistic (TS) method (Mattox et al., 1996). Given the extremely high gamma-ray flux of the GRB, we performed a single source analysis of the region. The GRB emission was modeled with a simple power law. Galactic and extragalactic diffuse emission parameters were calculated over 2 weeks before and kept fixed in the MSLA. We performed the analysis of the GRID data set for the first four OWs, singularly. We excluded the AC-Top saturations windows from OW1. We carried out a spectral analysis over 6 energy bins (0.05–0.10, 0.10–0.30, 0.30–1.00, 1.00–3.00, 3.00–10.00, 10.00–50.00 GeV), by taking into account the instrument response functions (IRFs), including the energy dispersion. For OW2 only, we limited the spectral analysis to a maximum energy of 3 GeV, due to low-statistics issues in the high-energy range. The results are reported in Table 3.
| Time Interval | Energy Range | Detection Significance | Photon Index | Flux | Associated Counts | |
|---|---|---|---|---|---|---|
| (s, s) | (MeV) | (ph cm-2 s-1) | ||||
| c1 + c2 | [273, 383] | 50 – 50000 | 46.1 | 1.92 0.06 | (8.4 0.6) | 206 16 |
| d | [684, 834] | 50 – 3000 | 14.4 | 1.7 0.2 | (1.1 0.2) | 53 4 |
| e | [1129, 1279] | 50 – 50000 | 5.5 | 2.1 0.4 | (1.7 0.8) | 7 3 |
| f | [1569, 1719] | 50 – 50000 | 4.5 | 2.5 0.5 | (1.0 0.5) | 6 3 |
In order to properly monitor the high-energy spectral evolution of the GRB, during the brightest gamma-ray prompt phase, we further divided OW1 into two subintervals: c1 [273, 303 s] and c2 [303, 383 s]. The resulting spectra are reported in Table 4.
| Subinterval | Energy Range | Detection Significance | Photon Index | Flux | Associated Counts | |
|---|---|---|---|---|---|---|
| (s, s) | (MeV) | (ph cm-2 s-1) | ||||
| c1 | [273, 303] | 50 – 3000 | 32.7 | 1.9 0.1 | (1.5 0.2) | 96 11 |
| c2 | [303, 383] | 50 – 3000 | 32.2 | 2.0 0.1 | (5.4 0.6) | 107 12 |
Moreover, a 10 s time binning lightcurve was generated for the time interval c (OW1 without the AC-Top saturation windows), in the range 50 MeV – 50 GeV. In this analysis, the power-law photon index and the position of the source were kept fixed at the values found for the whole c time interval (see Table 3). The resulting curve is shown in the bottom panel of Figure 2. The last time bin of OW1 has been excluded in order to preserve conservative cuts on the GRID exposure of the source.
To investigate possible delayed gamma-ray emission from the GRB, after OW1, we produced a supplementary GRID lightcurve with time bins of different duration, selected to optimize the photon statistics. In this case, we adopt a standard photon index value of 2.0 for the GRB spectral power law. We computed the MSLA over a photon energy range 50 MeV – 3 GeV. The results of this analysis are reported in Table 5 and in Figure 5.
| Detection Significance | |||
|---|---|---|---|
| (s]) | (s) | (ph cm-2 s-1) | |
| 684 | 834 | 15.8 | (9.0 1.7) |
| 1129 | 1719 | 7.6 | (2.0 0.6) |
| 2014 | 5269 | 3.7 | (9.5 5.2) |
| 5273 | 16980 | 4.1 | (2.6 1.2) |
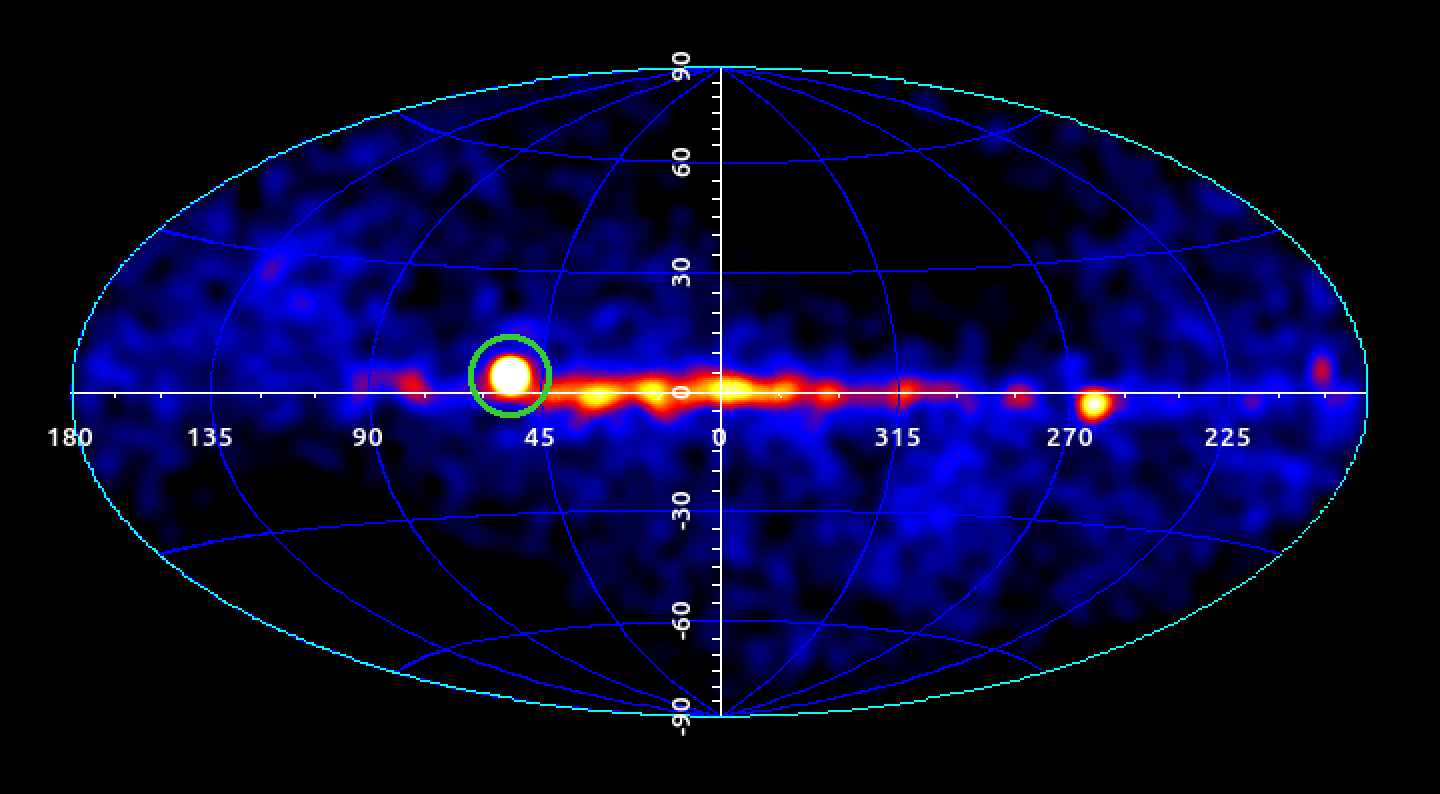
Integrating the data between 273 s and 383 s, the GRID was also able to locate the GRB at Galactic coordinates (l, b) = (53.0, 4.3) (stat.) (syst.) in agreement with the Fermi GBM position (Veres et al., 2022).
In Figure 9 we present the count map, integrated over 48 h, showing the exceptional luminosity of this event compared with the gamma-ray sky detected by the GRID.
B.2 MCAL Analysis
In the time interval between 150 s and 600 s, the AGILE–MCAL was triggered four times, providing partial high-time-resolution photon-by-photon data acquisitions, entirely covering about 66.71 s of the event. The start and end times of each trigger are reported in Table 6, together with their corresponding duration. On the other hand, the MCAL RM offer a continuous coverage for the whole burst evolution, although with a coarser fixed 1.024 s time resolution. Both MCAL triggered and RM data suffer a lack of data in the time interval between 223.25 s and 391.06 s, due to the extremely high energy release of the event that temporarily blinded the detector. This is particularly evident in Figure 1, where the MCAL lightcurve reaches a count rate above 60 kHz.
| MCAL Trigger | Trigger Duration | ||
|---|---|---|---|
| (s) | (s) | (s) | |
| 1 | 154.80 | 192.07 | 37.27 |
| 2 | 210.85 | 223.23 | 12.38 |
| 3 | 393.59 | 407.55 | 13.96 |
| 4 | 441.99 | 445.11 | 3.12 |
In order to investigate the evolution of GRB 221009A, we divided the burst in six time intervals (namely, a, b, c, d, e, and f), whose start and end times are reported in Table 1, together with the available data acquisition status of each AGILE detector.
We performed spectral analysis in the 400 keV - 50 GeV energy range, with the data acquired by the MCAL (both triggered and RM) and GRID detectors. The MCAL spectral analysis was carried out using the XSPEC software package (v 12.12.0; Arnaud 1996).
For what concerns the MCAL triggers, we evaluated the background rate exploiting a triggered onboard acquisition issued before the onset of the GRB (i.e., from -59.19 s to -44.53 s). The same time interval was adopted also to evaluate the background rate in the MCAL RM data, in order to calibrate and cross-check the obtained values. We divided the background-subtracted counts into the 97 spectral energy channels usually adopted for MCAL spectral analysis and adopted the most suitable response matrix to the attitude of the satellite during each of the six time intervals.
References
- Ackermann et al. (2014) Ackermann, M., Ajello, M., Asano, K., et al. 2014, Science, 343, 42, doi: 10.1126/science.1242353
- Arnaud (1996) Arnaud, K. A. 1996, in Astronomical Society of the Pacific Conference Series, Vol. 101, Astronomical Data Analysis Software and Systems V, ed. G. H. Jacoby & J. Barnes, 17
- Atteia et al. (2017) Atteia, J. L., Heussaff, V., Dezalay, J. P., et al. 2017, ApJ, 837, 119, doi: 10.3847/1538-4357/aa5ffa
- Bošnjak et al. (2009) Bošnjak, Ž., Daigne, F., & Dubus, G. 2009, A&A, 498, 677, doi: 10.1051/0004-6361/200811375
- Bright et al. (2023) Bright, J. S., Rhodes, L., Farah, W., et al. 2023, arXiv e-prints, arXiv:2303.13583, doi: 10.48550/arXiv.2303.13583
- Brivio et al. (2022) Brivio, R., Ferro, M., D’Avanzo, P., et al. 2022, GRB Coordinates Network, 32652, 1
- Bulgarelli (2019) Bulgarelli, A. 2019, Experimental Astronomy, 48, 199, doi: 10.1007/s10686-019-09644-w
- Bulgarelli et al. (2012) Bulgarelli, A., Chen, A. W., Tavani, M., et al. 2012, A&A, 540, A79, doi: 10.1051/0004-6361/201118023
- Cao et al. (2023) Cao, Z., Aharonian, F., LHAASO Collaboration, et al. 2023, Science, 380, 1390, doi: 10.1126/science.adg9328
- Dai & Cheng (2001) Dai, Z. G., & Cheng, K. S. 2001, ApJ, 558, L109, doi: 10.1086/323566
- de Ugarte Postigo et al. (2022) de Ugarte Postigo, A., Izzo, L., Pugliese, G., et al. 2022, GRB Coordinates Network, 32648, 1
- Dichiara et al. (2022) Dichiara, S., Gropp, J. D., Kennea, J. A., et al. 2022, GRB Coordinates Network, 32632, 1
- Domínguez et al. (2011) Domínguez, A., Primack, J. R., Rosario, D. J., et al. 2011, MNRAS, 410, 2556, doi: 10.1111/j.1365-2966.2010.17631.x
- Frederiks et al. (2023) Frederiks, D., et al. 2023, ApJ, 949, L7, doi: 10.3847/2041-8213/acd1eb
- Huang et al. (2022) Huang, Y., Hu, S., Chen, S., et al. 2022, GRB Coordinates Network, 32677, 1
- Klein & Nishina (1929) Klein, O., & Nishina, T. 1929, Zeitschrift fur Physik, 52, 853, doi: 10.1007/BF01366453
- Kumar et al. (2022) Kumar, H., Swain, V., Waratkar, G., et al. 2022, GRB Coordinates Network, 32662, 1
- Laskar et al. (2023) Laskar, T., Alexander, K. D., Margutti, R., et al. 2023, ApJ, 946, L23, doi: 10.3847/2041-8213/acbfad
- Lesage et al. (2022) Lesage, S., Veres, P., Roberts, O. J., et al. 2022, GRB Coordinates Network, 32642, 1
- Lesage et al. (2023) Lesage, S., Veres, P., Briggs, M. S., et al. 2023, ApJ, 952, L42, doi: 10.3847/2041-8213/ace5b4
- MAGIC Collaboration et al. (2019) MAGIC Collaboration, Acciari, V. A., Ansoldi, S., et al. 2019, Nature, 575, 455, doi: 10.1038/s41586-019-1750-x
- Malesani et al. (2023) Malesani, D. B., Levan, A. J., Izzo, L., et al. 2023, arXiv e-prints, arXiv:2302.07891, doi: 10.48550/arXiv.2302.07891
- Mattox et al. (1996) Mattox, J. R., Bertsch, D. L., Chiang, J., et al. 1996, ApJ, 461, 396, doi: 10.1086/177068
- Negoro et al. (2022) Negoro, H., Nakajima, M., Kobayashi, K., et al. 2022, ATel, 15651, 1
- Negro et al. (2023) Negro, M., Di Lalla, N., Omodei, N., et al. 2023, ApJ, 946, L21, doi: 10.3847/2041-8213/acba17
- Piano et al. (2022) Piano, G., Verrecchia, F., Bulgarelli, A., et al. 2022, ATel, 15662, 1
- Pittori & The Agile-SSDC Team (2019) Pittori, C., & The Agile-SSDC Team. 2019, Rendiconti Lincei. Scienze Fisiche e Naturali, 30, 217, doi: 10.1007/s12210-019-00857-x
- Rees & Meszaros (1994) Rees, M. J., & Meszaros, P. 1994, ApJ, 430, L93, doi: 10.1086/187446
- Sari & Esin (2001) Sari, R., & Esin, A. A. 2001, ApJ, 548, 787, doi: 10.1086/319003
- Sari et al. (1999) Sari, R., Piran, T., & Halpern, J. P. 1999, ApJ, 519, L17, doi: 10.1086/312109
- Sari et al. (1998) Sari, R., Piran, T., & Narayan, R. 1998, ApJ, 497, L17, doi: 10.1086/311269
- Tavani et al. (2009) Tavani, M., Barbiellini, G., Argan, A., et al. 2009, A&A, 502, 995, doi: 10.1051/0004-6361/200810527
- Ursi et al. (2020) Ursi, A., Tavani, M., Frederiks, D. D., et al. 2020, ApJ, 904, 133, doi: 10.3847/1538-4357/abc2d4
- Ursi et al. (2022a) Ursi, A., Panebianco, G., Pittori, C., et al. 2022a, GRB Coordinates Network, 32650, 1
- Ursi et al. (2022b) Ursi, A., Romani, M., Piano, G., et al. 2022b, ApJ, 933, 214, doi: 10.3847/1538-4357/ac746c
- Veres et al. (2022) Veres, P., Burns, E., Bissaldi, E., et al. 2022, GRB Coordinates Network, 32636, 1
- Williams et al. (2023) Williams, M. A., Kennea, J. A., Dichiara, S., et al. 2023, ApJ, 946, L24, doi: 10.3847/2041-8213/acbcd1