EMG Signal Classification for Neuromuscular Disorders with Attention-Enhanced CNN
Abstract
Amyotrophic Lateral Sclerosis (ALS) and Myopathy present considerable challenges in the realm of neuromuscular disorder diagnostics. In this study, we employ advanced deep-learning techniques to address the detection of ALS and Myopathy, two debilitating conditions. Our methodology begins with the extraction of informative features from raw electromyography (EMG) signals, leveraging the Log-spectrum, and Delta Log spectrum, which capture the frequency contents, and spectral and temporal characteristics of the signals. Subsequently, we applied a deep-learning model, SpectroEMG-Net, combined with Convolutional Neural Networks (CNNs) and Attention for the classification of three classes. The robustness of our approach is rigorously evaluated, demonstrating its remarkable performance in distinguishing among the classes: Myopathy, Normal, and ALS, with an outstanding overall accuracy of 92%. This study marks a contribution to addressing the diagnostic challenges posed by neuromuscular disorders through a data-driven, multi-class classification approach, providing valuable insights into the potential for early and accurate detection.
Index Terms:
Amyotrophic Lateral Sclerosis (ALS), Deep Learning, Delta Log-spectrogram(DLS), Electromyography (EMG), Log-spectrogram(LS)I Introduction
Amyotrophic lateral sclerosis (ALS) is a serious neurodegenerative disease characterized by the progressive loss of motor neurons in the brain and spinal cord, leading to muscle weakness, paralysis, and respiratory issues. A common symptom of ALS is pain, which has received limited research attention[1]. This gap in our understanding emphasizes the need for comprehensive studies and effective pain management strategies for ALS. Additionally, early diagnosis could not only alleviate symptoms but also improve the overall quality of life for ALS patients[2]. In parallel, it’s crucial to extend our research focus to include Myopathy, another challenging neuromuscular disorder, which requires robust diagnostic methods. Our study tackles these diagnostic challenges by utilizing innovative signal processing and deep learning techniques to achieve accurate and early detection for both ALS and Myopathy, offering the potential to significantly improve the lives of individuals affected by these conditions within the realm of neurodegenerative disorders.
Numerous techniques exist for the analysis of electromyography (EMG) signals, all playing a vital role in uncovering pertinent information and identifying neuromuscular disorders. These methods encompass a range of approaches, including time domain techniques like amplitude measurements and spike counting, as well as frequency domain analysis utilizing the power spectrum [3]. The investigation involves an examination of both time and frequency domain characteristics in EMG signals from both healthy individuals and those with ALS. These studies extract distinctive features such as auto-correlation, cross-correlation, zero-crossing rate, and Fourier transform, which prove valuable for ALS detection [4, 5]. Furthermore, studies like [6, 7] introduce discrete wavelet transform (DWT) domain features in conjunction with conventional time and frequency domain elements for enhanced EMG signal analysis. Another approach involves the extraction of features and the classification of both normal individuals and ALS patients using motor unit action potentials (MUAP) signals, with potential features derived from the mel-frequency cepstral coefficients (MFCCs) of these MUAP signals. This process entails extracting MUAPs from EMG data through template matching, selecting the one with the highest dynamic range, and subsequently extracting MFCCs [8, 9]. Additionally, a separate study focuses on extracting six specific features, including spectral attributes and signal properties, from intrinsic mode functions (IMFs) derived from decomposed EMG signals. These distinctive features play a crucial role in the detection of ALS in EMG signals [10]. Various classification techniques have been introduced for distinguishing ALS within EMG signals employing these characteristics. In works such as [4, 6, 8, 11], classification is executed through the deployment of classifiers like K-nearest neighbors (KNN) and Support Vector Machines (SVM). In the case of [10], a Least Squares Support Vector Machine (LS-SVM) is implemented for classification. Nevertheless, it’s important to note that these classifiers rely on features to perform effectively. Consequently, deep learning models emerge as an appealing alternative for such classification tasks. For instance, [12] integrates the Short Time Fourier Transform (STFT) for time-frequency representation and introduces Convolutional Neural Networks (CNN) for classification. Another approach from the same author observed in [13] presents the utilization of methods like Spectrogram, Continuous Wavelet Transform (CWT), and Smoothed Pseudo Wigner-Ville Distribution (SPWVD) for time-frequency (T-F) representation, coupled with CNNs for classification. These deep learning models leverage classification with raw data. This paper [14] introduces a one-dimensional CNN designed to directly identify ALS from raw EMG signals, bypassing the need for preprocessing or feature extraction. However, it’s important to note that these studies solely ventured into binary classification and did not explore the realm of three-class classification. Furthermore, the more demanding task of subject-independent classification remains unexplored. Consequently, the potential for crafting a lightweight architecture capable of addressing the complexities of subject-independent three-class classification remains a promising area for exploration.
In this study, we propose SpectroEMG-Net, a subject-independent deep-learning architecture capable of identifying ALS and Myopathy among three classes ( Myopathy, Normal, and ALS) utilizing the spectrogram features from raw EMG data. This paper focuses on distinguishing between normal, ALS, and Myopathy based on EMG signals, categorizing them into respective classes for accurate classification. The proposed architecture, SpectroEMG-Net, consists of several key components designed for the classification of EMG signals. The architecture includes Feature Blocks, which are responsible for capturing spectral patterns, enhancing the model’s ability to learn discriminative spectral features. Also, the network incorporates Attention Blocks, which introduce a mechanism for the model to focus on relevant spectral regions.
II Dataset Preprocessing
In our experiment, we utilized the clinical EMG signals from the N2001 EMGLAB open-access Dataset.[15] This dataset comprises three distinct groups: Normal, Myopathy, and ALS. The analysis of Motor Unit Action Potentials (MUAPs) involved the standardized recording of EMG signals under specific conditions. These recordings took place during mild voluntary muscle contractions, just above the minimum threshold, and were closely monitored using visual and auditory feedback to ensure signal quality. A standard concentric needle electrode was used for the recordings. EMG signals were captured from five different locations within the muscle, spanning depths that included deep, medium, and low regions. To facilitate the acquisition of pertinent data, the EMG amplifier was equipped with filters allowing signals with frequencies above 2 Hz and below 10 kHz to pass through, effectively preserving the integrity of the recorded information.
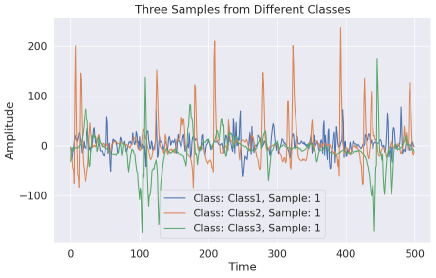
Each EMG signal was sampled at a frequency of 24 kHz and recorded for approximately 11 seconds. In the data preparation phase, our initial dataset was standardized to ensure uniformity. The original training data consisted of 294 samples, each containing 262124 data points, with a shape of (262124,1). To facilitate further analysis, we applied a windowing technique, segmenting the data into windows, each comprising 23437 data points. As a result, the initial training dataset was transformed into a new shape (3215, 23437, 1), while the initial validation dataset comprised 682 samples with the same windowed shape, (23437, 1). The initial test dataset also follows this windowing process, yielding a shape of (539, 23437, 1). To optimize computational efficiency and accommodate the requirements of our model, we subsequently downsampled the data to a rate of 2 KHz. This downsampling procedure reshaped our datasets, resulting in the following dimensions: the initial training data now had a shape of (3215, 2000, 1), the initial validation data was represented as (682, 2000, 1), and the initial test data took on the form of (539, 2000, 1). Figure 1 illustrates the visualization of three distinct classes.
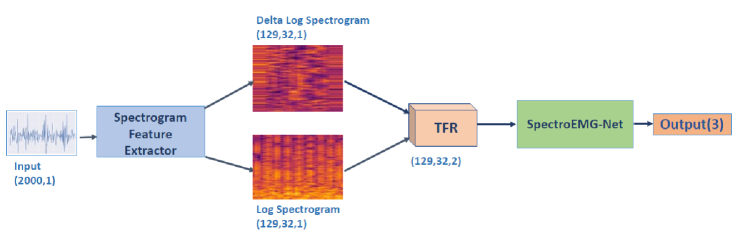
Now each data sample contains a shape of (2000,1). Inside the ’Spectrogram Feature Extractor’ block, it iterates through each sample in the input collection. For each sample, it computes the spectrogram using the Short-Time Fourier Transform (STFT) with specified parameters and converts the amplitude spectrogram to a log scale. Then, it calculates the first-order delta log spectrogram, which captures the rate of change in the log spectrogram over time. Finally, it stacks the log spectrogram and delta log spectrogram along the last axis, creating a two-channel spectrogram representation for each sample. These spectrograms are collected in a list and returned as a NumPy array, making them suitable for further processing or as input to model for EMG signal classification.
In our case, The window size parameter is set to 256, which stands for the number of points in the Fast Fourier Transform (FFT). In this case, it means that each segment of the signal is analyzed using 256 points in the frequency domain. The ”hop length” parameter is set to 64. It represents the number of samples between successive frames in the STFT. A smaller hop length leads to more frames and, consequently, a higher time resolution in the spectrogram. Conversely, a larger hop length results in fewer frames and a higher frequency resolution. Following the spectrogram feature extraction, the training dataset has been transformed into a new format, characterized by dimensions (3215, 129, 32, 2). Similarly, the validation dataset consists of 682 samples, each maintaining the same windowed shape of (129, 32, 2). The test dataset has undergone a similar windowing process, resulting in a shape of (539, 129, 32, 2).
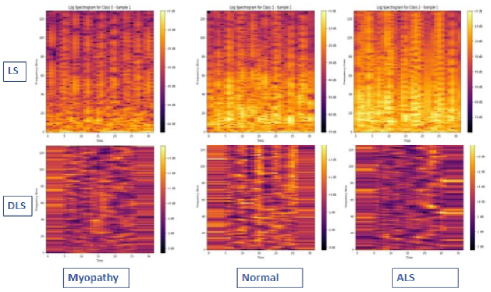
These transformations provided us with well-structured data ready for training, validation, and testing, with 3215 samples for training, 682 samples for validation, and 539 samples for testing, all uniformly shaped (2000, 1) for further analysis and model development. Figure 2 illustrates the visualization of Time-Frequency Representation (TFR) in three distinct classes.
III Proposed Architecture
Upon extracting the spectrogram features, our next step involves training the SpectroEMG-Net model using the training dataset. The overall schematic representation of this process is visualized in Figure 3. The proposed architecture of ”SpectroEMG-Net,” a deep learning model designed for the classification of EMG (Electromyography) signals using log spectrogram and delta log spectrogram features, is shown in Figure .4. This model incorporates several critical components to effectively process and classify these signals.
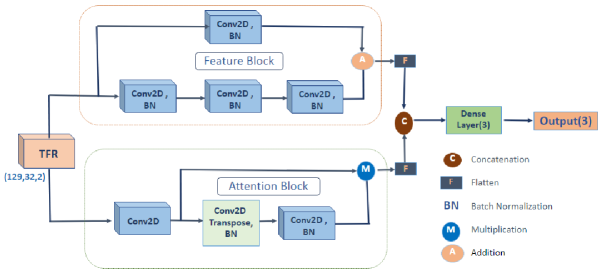
The ”FeatureBlock” is responsible for extracting spectral features, employing a series of convolutional layers, batch normalization, and ReLU activation functions. A notable inclusion is the residual connection, ensuring stable gradient flow during training. The ”AttentionBlock” introduces a spectral attention mechanism, allowing the model to focus on pertinent spectral patterns and adaptively weigh different frequency components.
The input layer expects data in the shape of (129, 32, 2), corresponding to the log spectrogram and delta log spectrogram features. An initial convolutional layer captures local patterns in the spectrogram data. The output of this layer is passed through the AttentionBlock and concatenated with the output of the FeatureBlock. The concatenated output is then flattened for further processing.
Finally, the model includes an output layer with softmax activation, providing class probabilities for three distinct classes. The SpectroEMG-Net architecture expertly combines convolutional layers for feature extraction and spectral attention mechanisms for nuanced consideration of frequency components, making it a promising choice for the accurate classification of EMG signals based on log spectrogram features.
IV Performance Matrices
In the process of assessing our model’s performance on the test data, we employ a set of key metrics to evaluate its results. These metrics encompass Sensitivity, Specificity, Precision, F1 score, and Overall Accuracy. Overall Accuracy, a pivotal metric, provides an overarching measure of our model’s correctness in predicting both true positives and true negatives. Sensitivity, also known as the true positive rate, evaluates the proportion of actual positives correctly classified by our model. Meanwhile, Specificity, referred to as the true negative rate, quantifies the proportion of actual negatives accurately identified by our model. Precision measures the model’s ability to make accurate positive predictions. Additionally, the F1 score combines both Precision and Sensitivity, offering a balanced evaluation of the model’s predictive performance. These metrics, along with Overall Accuracy, serve as essential tools for comprehensively evaluating our model’s efficacy in classification tasks.
| (1) |
| (2) |
| (3) |
| (4) |
| (5) |
TP, FP, TN, and FN are True Positive, False Positive, True Negative, and False Negative.
V Result and Discussion
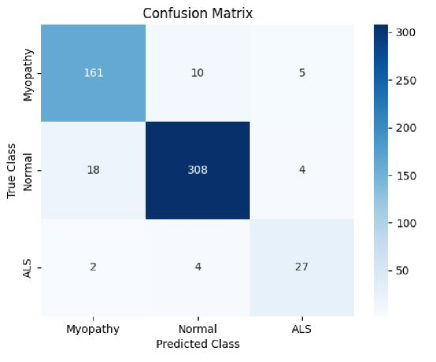
In our task of classifying into three groups, Myopathy, Normal, and ALS, we used the test set labeled as ’S.’ As explained in Section 1, each part ’s’ in this test set is analyzed by SpectroEMG-Net, producing a probability value denoted as P(s = 1), which indicates how likely the segment belongs to one of the three classes. To make the final decision, we select the class with the highest probability among the three. This approach allows us to effectively assign segments to one of the three classes by considering the highest probability as the deciding factor. This simplified process is crucial for evaluating how well our model can distinguish between Myopathy, Normal, and ALS EMG signals. It’s worth noting that SpectroEMG-Net achieved an impressive overall accuracy, accurately predicting 496 out of 539 EMG signal segments in the test set, with an accuracy of 92%, as shown in Figure 5’s confusion matrix. This analysis was performed with the following distribution: Myopathy (176 segments), Normal (330 segments), and ALS (33 segments).
Table 1 offers a detailed summary of our model’s performance assessment, illustrating its performance across three classes. Table 2 offers a comparative analysis, contrasting our proposed model’s performance with various existing approaches. Notably, the authors listed in this table predominantly focused on two-class classification tasks, primarily involving the Normal and ALS datasets, without venturing into the three-class classification problem[8, 6, 10, 13, 12, 14]. It’s worth mentioning that [16] made noteworthy contributions to two separate two-class classifications, specifically addressing Normal-ALS and Myopathy-ALS detection challenges. In our study, the proposed model, SpectroEMG-Net achieved an impressive overall accuracy of 92%, showing its proficiency in effectively distinguishing among three distinct classes: Myopathy, Normal, and ALS. Additionally, our model demonstrated a commendable mean sensitivity of 89%, signifying its capability to accurately identify positive instances across the three classes. Moreover, the model exhibited a mean specificity of 95%, indicating its adeptness in correctly discerning negative instances. While our model excels in the context of this three-class problem, it’s vital to recognize this study’s significant contribution in tackling the unique complexities associated with neuromuscular disorders through a three-class classification approach.
| Class | Sensitivity | Specificity | Precision | F1-score |
|---|---|---|---|---|
| Myopathy | 91.48 | 94.49 | 88.95 | 90.20 |
| Normal | 93.33 | 93.30 | 95.65 | 94.48 |
| ALS | 81.82 | 98.22 | 75.00 | 78.26 |
| Techniques | Overall Accuracy | Sensitivity | Specificity |
|---|---|---|---|
| Doulah[8] | 92.50 | 76.00 | 98.00 |
| Fattah[6] | 91.50 | 74.00 | 97.33 |
| Mishra[10] | 95.00 | 93.00 | 92.54 |
| Krishna[16] | 92.50 | 88.00 | 99.33 |
| Sengur[12] | 96.69 | 94.24 | 97.59 |
| Sengur[13] | 96.80 | 94.80 | 98.80 |
| Hassan[14] | 97.74 | 96.77 | 98.59 |
| Proposed Model | 92.02 | 88.88 | 95.34 |
VI Conclusion
In our research, we have introduced an innovative deep-learning approach aimed at effectively classifying two significant neuromuscular disorders: ALS and Myopathy, and normal signal. Our approach leverages raw EMG signals, transforming them into a two-channel spectrogram feature representation. The results of our study have demonstrated remarkable promise, particularly in terms of performance matrices. By achieving high levels of accuracy, our method has the potential to significantly impact the field of early neural disorder diagnosis. Early detection of conditions like ALS and Myopathy can be crucial in providing timely medical intervention and improving patients’ overall quality of life. Furthermore, our approach offers the advantage of reduced computational costs. This aspect is crucial for practical implementation, especially in the healthcare domain, where efficient and cost-effective diagnostic methods are highly desirable. The reduction in computational complexity makes our approach accessible and feasible for deployment in real-world clinical settings.
Acknowledgment
The authors would like to thank the organizers of EMGLAB[15] for their public dataset which was used to develop this research work.
References
- [1] C. R. Handy, C. R. Handy, C. Krudy, N. M. Boulis, and T. Federici, “Pain in Amyotrophic Lateral Sclerosis: A Neglected Aspect of Disease,” Neurology Research International, vol. 2011, no. 2011, pp. 1–8, May 2011, mAG ID: 2042897241 S2ID: 08c06f7dcf73ae4a3b1d9f1102c39b11335ace81.
- [2] M. Swash, “Early diagnosis of ALS/MND.” Journal of the Neurological Sciences, vol. 160, p. 6, Oct. 1998, mAG ID: 2067255333 S2ID: 11cc9b20c353750a44a1c4f4cfdcc6417db3ba06.
- [3] A. Fuglsang-Frederiksen, “The utility of interference pattern analysis,” Muscle & Nerve, vol. 23, no. 1, pp. 18–36, Jan. 2000, mAG ID: 1967128670.
- [4] A. Fattah, “Identifying the Motor Neuron Disease in EMG Signal Using Time and Frequency Domain Features with Comparison,” Signal & Image Processing : An International Journal, vol. 3, no. 2, pp. 99–114, Apr. 2012, mAG ID: 2334615532 S2ID: eaf6b58dfe2eba74fc1ba20c65f8f5465425c3e7.
- [5] R. Bose, K. Samanta, and S. Chatterjee, “Cross-correlation based feature extraction from emg signals for classification of neuro-muscular diseases,” in 2016 International Conference on Intelligent Control Power and Instrumentation (ICICPI). IEEE, 2016, pp. 241–245.
- [6] A. Fattah, A. B. M. Sayeed Ud Doulah, A. B. M. S. U. Doulah, A. B. M. S. U. Doulah, Asif Iqbal, A. Iqbal, C. Shahnaz, W.-P. Zhu, and M. O. Ahmad, “Identification of motor neuron disease using wavelet domain features extracted from EMG signal,” pp. 1308–1311, May 2013, mAG ID: 2110943775.
- [7] A. Subasi, E. Yaman, Y. Somaily, H. A. Alynabawi, F. Alobaidi, and S. Altheibani, “Automated emg signal classification for diagnosis of neuromuscular disorders using dwt and bagging,” Procedia Computer Science, vol. 140, pp. 230–237, 2018.
- [8] A. B. M. S. U. Doulah and A. Fattah, “Neuromuscular disease classification based on mel frequency cepstrum of motor unit action potential,” 2014 International Conference on Electrical Engineering and Information & Communication Technology, pp. 1–4, Apr. 2014, mAG ID: 2059054229 S2ID: 41782eb964be4f53889f726ee4c53f87a1aac82e.
- [9] M. Irfan, K. Ullah, F. Muhammad, S. Khan, F. Althobiani, M. Usman, M. Alshareef, S. Alghaffari, and S. Rahman, “Automatic detection of outliers in multi-channel emg signals using mfcc and svm,” INTELLIGENT AUTOMATION AND SOFT COMPUTING, vol. 36, no. 1, pp. 169–181, 2023.
- [10] V. K. Mishra, V. K. Mishra, V. Bajaj, A. Kumar, A. Kumar, and G. K. Singh, “Analysis of ALS and normal EMG signals based on empirical mode decomposition,” Iet Science Measurement & Technology, vol. 10, no. 8, pp. 963–971, Nov. 2016, mAG ID: 2504270968 S2ID: 5395aba197340d94d28e649f1e941e56fa739c9f.
- [11] H. Küçük and İ. Eminoğlu, “Classification of als disease using support vector machines,” in 2015 23nd Signal Processing and Communications Applications Conference (SIU). IEEE, 2015, pp. 1664–1667.
- [12] A. Sengur, M. Gedikpinar, Y. Akbulut, E. Deniz, V. Bajaj, A. S. Ashour, and Y. Guo, “DeepEMGNet: An Application for Efficient Discrimination of ALS and Normal EMG Signals,” pp. 619–625, Sep. 2017, mAG ID: 2746483198 S2ID: 7dab06c53116c188b518b37c28779ff317b59018.
- [13] A. Sengur, Y. Akbulut, A. S. Ashour, Y. Guo, and V. Bajaj, “Classification of amyotrophic lateral sclerosis disease based on convolutional neural network and reinforcement sample learning algorithm,” Health Information Science and Systems, vol. 5, no. 1, pp. 9–9, Oct. 2017, mAG ID: 2765859029 S2ID: ac0cb6535ed248690823a038555182c6a6581278.
- [14] K. M. Naimul Hassan, Md. Shamiul Alam Hridoy, Naima Tasnim, Atia Faria Chowdhury, Tanvir Alam Roni, Sheikh Tabrez, Arik Subhana, and Celia Shahnaz, “ALSNet: A Dilated 1-D CNN for Identifying ALS from Raw EMG Signal,” IEEE International Conference on Acoustics, Speech, and Signal Processing, May 2022, mAG ID: 4224933343 S2ID: 5dbf888a049fa9e00294c4581edeee781a63e95d.
- [15] M. Nikolic. Detailed analysis of clinical electromyography signals: Emg decomposition, findings and firing pattern analysis in controls and patients with myopathy and amytrophic lateral sclerosis, ph.d. dissertation, faculty of health science, university of copenhagen, copenhagen, denmark, 2001. [online].url = http://www.emglab.net. [Online]. Available: http://www.emglab.net
- [16] A. Krishna and Paul Thomas, “Classification of EMG Signals Using Spectral Features Extracted from Dominant Motor Unit Action Potential,” 2015, s2ID: b5fd05c7004c64cfda082d095e338ff3bfb08716.