11email: valda@sissa.it
An N-body hydrodynamical simulation study of the merging cluster El Gordo: A compelling case for self-interacting dark matter?
We used a large set N-body/hydrodynamical simulations to study the physical properties of the merging cluster El Gordo. We find that the observed X-ray structures, along with other data, can be matched fairly well by simulations with collision velocities and impact parameters . The mass of the primary is constrained to be between and , in accordance with recent lensing-based mass measurements. Moreover, a returning, post-apocenter, scenario is not supported by our head-on simulations.
We also considered merger models that incorporate dark matter self-interactions. The simulation results show that the observed spatial offsets between the different mass components are well reproduced in self-interacting dark matter models with an elastic cross-section in the range . In addition, the mean relative line-of-sight radial velocity between the two brightest cluster galaxies is found to be on the order of several hundred . We argue that these findings provide an unambiguous signature of a dark matter behavior that exhibits collisional properties in a very energetic high-redshift cluster collision. The range of allowed values we find for is, however, inconsistent with present upper limits. To resolve this tension, we suggest the possibility that the self-interacting dark matter model used here be considered as only a low-order approximation, and that the underlying physical processes that describe the interaction of dark matter in major cluster mergers are more complex than can be adequately represented by the commonly assumed approach based on the scattering of dark matter particles.
Key Words.:
— galaxies: clusters: intracluster medium — Hydrodynamics — methods: numerical — X-rays: galaxies: clusters — cosmology: theory – dark matter1 Introduction
Galaxy clusters are the largest virialized structures known in the Universe, and according to the hierarchical scenario, their formation proceeds from the bottom up, through the sequential accretion and merging of smaller structures. They have measured virial masses in the range . Observations show that about of their mass content consists of dark matter (DM), with the remaining in the form of baryons. The bulk of these baryons () resides in the form of an intracluster medium (ICM), with only a few per cent in the form of galaxies (Voit 2005).
During the process of cluster formation, high-velocity gas flows dissipate the infall kinetic energy and the gas is shock-heated to high temperatures. Because of the masses involved, at equilibrium these temperatures will be as high as K, and the ICM will be in the form of a hot diffuse plasma. Galaxy clusters are thus powerful X-ray emitters, and their X-ray emission can be used to study the physics of the ICM and in turn derive cluster properties with which to constrain the currently accepted Lambda cold dark matter (CDM) cosmological model (Voit 2005).
Moreover, observed X-ray maps show that a significant fraction of galaxy clusters exhibit a disturbed X-ray morphology and are in a dynamically unrelaxed state (Buote 2002), with two or more subclusters still in the process of accretion and merging. In this context, the merging of galaxy clusters is essential in a number of ways for probing ICM physics and the underlying cosmology (Sarazin 2002; Molnar 2016).
Mergers between galaxy clusters can be broadly classified into two categories, according to the mass ratio between the two main mass subcomponents. Mergers are considered major when the mass ratio of the primary to the secondary is close to unity, and minor whenever the mass of the secondary is of the primary mass. X-ray surface brightness maps of minor mergers reveal the existence of cold fronts and shocks (Markevitch & Vikhlinin 2007), which can be used to derive ICM transport properties (Markevitch & Vikhlinin 2007; ZuHone & Roediger 2016).
In this scenario, major mergers of massive galaxy clusters are among the most energetic events since the Big Bang, with collision energies in the range (Sarazin 2002). The energy involved in these collisions renders these objects unique laboratories for probing the collisional properties of their components, as well as the likelihood of such events within the CDM cosmological model (Lee & Komatsu 2010; Lage & Farrar 2015; Asencio et al. 2021).
An important effect that will occur during a major merger is the expected offset between the dissipative ICM and the collisionless components: galaxies and DM. Additionally, self-interacting dark matter (SIDM) will also exhibit a further offset from the galaxy component, which will depend on the strength of the cross-section. Observations of spatial offsets between different components can then be used to constrain these models (see Tulin & Yu 2018, for a review ).
In recent years, the existence of major mergers between galaxy clusters has been established by a growing number of observations: for example, the Bullet Cluster 1E0657-56 at redshift (Markevitch et al. 2002; Clowe et al. 2006), the first observed to show the existence of DM, by displaying a clear spatial offset between the collisionless DM component and the X-ray emitting ICM. Other examples of such systems are the cluster ACT-CL J0102-4915 (Menanteau et al. 2012; Jee et al. 2014; Zitrin et al. 2013), the Sausage Cluster CIZA J2242.8+5301 (Jee et al. 2015), ZwCl008.8+52 (Golovich et al. 2017), A1758N (Ragozzine et al. 2012), and A2146 (Russell et al. 2010).
Because of the nonlinearity of the merging process and the variety of the associated physical phenomena, N-body/hydrodynamical simulations have proved to be a very powerful tool for studying and interpreting mergers between galaxy clusters. In particular, idealized binary merger simulations are designed to follow, in a Newtonian frame, the collision evolution of two merging halos that are initially separated and at equilibrium. At variance with cosmological simulations, this approach allows a single merger to be studied under carefully controlled initial conditions and can be used to model a specific merging event (Molnar 2016).
Individual binary cluster merger simulations have been performed by many authors. These simulations have been aimed either at studying the effects of mergers in general (Roettiger et al. 1996; Ricker & Sarazin 2001; Ritchie & Thomas 2002; Poole et al. 2006; McCarthy et al. 2007; Poole et al. 2008; Mitchell et al. 2009; ZuHone et al. 2009) or investigating some specific property of the ICM. In particular, simulations of merging clusters have been used to study the origin of cold fronts and gas sloshing (Heinz et al. 2003; Ascasibar & Markevitch 2006; ZuHone et al. 2010; Roediger et al. 2012; ZuHone & Roediger 2016; Sheardown et al. 2018), the formation of cool cores (ZuHone 2011; Valdarnini & Sarazin 2021), the offset between X-ray and Sunyaev-Zel’dovich (SZ) map peaks (Molnar et al. 2012; Zhang et al. 2014), and ICM transport properties (Ruszkowski & Oh 2010; Roediger et al. 2013; ZuHone et al. 2013, 2015; Schmidt et al. 2017).
Moreover, this simulation approach allows simulations aimed at studying a particular merging system to be performed and therefore contrast the simulation results with a given observation. Some examples of such specifically designed simulations include those of the Bullet Cluster (Springel & Farrar 2007; Mastropietro & Burkert 2008; Lage & Farrar 2014), the cluster ACT-CL J0102-4915 (Donnert 2014; Molnar & Broadhurst 2015; Zhang et al. 2015, 2018), the Sausage Cluster (Donnert et al. 2017; Molnar & Broadhurst 2017), Cygnus A (Halbesma et al. 2019), A2146 (Canning et al. 2012; Chadayammuri et al. 2022), A3376 (Machado & Lima Neto 2013), A1758N (Machado et al. 2015), the cluster ZwCl008.8+52 (Molnar & Broadhurst 2018), and A2034 (Moura et al. 2021).
Among these examples of extreme collisions, the cluster ACT-CL J0102-4915 at , nicknamed El Gordo, It was originally detected as the cluster with the strongest SZ effect in the Atacama Cosmology Telescope (ACT) survey (Menanteau et al. 2010; Hasselfield et al. 2013). From optical and X-ray studies, Menanteau et al. (2012) obtained a total mass on the order of , with a galaxy velocity dispersion and an integrated temperature in the range keV. Similar mass estimates have also been obtained from weak lensing (WL; Jee et al. 2014) and strong lensing (SL) studies (Zitrin et al. 2013). This range of estimated masses indicates that El Gordo is a major merger cluster as well as the most massive cluster at ; however, it was soon realized that the existence of such a massive cluster at this redshift is extremely unlikely within the standard CDM model (Menanteau et al. 2012; Jee et al. 2014).
The cluster exhibits a binary mass structure (Jee et al. 2014), with its two subclusters denominated the northwestern (NW) and southeastern (SE), respectively (see, for example, Figure 1 of Ng et al. 2015) because of their positions. WL analysis (Jee et al. 2014) shows a projected separation between the mass centroids of the two components of approximately , with a mass ratio in the range . Dynamical estimates (Menanteau et al. 2012) suggest a high relative velocity for the merging infall, in the range to , with the uncertainties in the allowed range due to projection effects.
A significant effect expected in high-velocity merging clusters is the presence of large spatial offsets between the X-ray surface brightness peaks and the centroid of the surface mass densities (Molnar et al. 2012), as well as between the SZ and X-ray centroids. All of these features have been observed in the El Gordo cluster (Menanteau et al. 2012; Zitrin et al. 2013): the measured distance between the SZ and X-ray centroid is and the SZ centroid is offset by a distance of from the main mass centroid. Additionally, the peak of the X-ray emission is also offset from the position of the brightest cluster galaxy (BCG; Menanteau et al. 2012). It is located in the SE cluster component and is offset by with respect the SE X-ray peak.
Moreover, the X-ray morphology of El Gordo presents several interesting features. The total X-ray luminosity is in the keV band (Menanteau et al. 2012); the highest X-ray emission is in the SE region and is characterized by a single peak and two extended faint tails elongated beyond the peak. The X-ray emission in the NW region is significantly weaker and presents a wake-like feature, indicative of turbulent flows. This well-defined X-ray morphology suggests that the merging axis is quite close to the plane of the sky (Menanteau et al. 2012); this is also consistent with the observed presence of a double radio relic (Lindnet et al. 2014).
This set of multifrequency observations led to the conclusion that El Gordo is a cluster at high redshift that is experiencing a major merger of two massive clusters that collided at a high velocity (). In this context, the most likely physical interpretation of the ongoing merging (Menanteau et al. 2012; Jee et al. 2014) is a scenario in which the dense cool gas core of the secondary is moving from the NW to the SE, inducing a wake in the ICM of the primary and the two-tail cometary structure seen in the X-ray images. The original gas core of the primary is absent because it was destroyed during the collision with the high-velocity compact core of the secondary. The secondary is thus moving away from the primary, and the two clusters are seen after the first pericenter passage; this is the so-called outgoing scenario.
These observational features indicate that the El Gordo cluster can be considered an extreme merging event, like the Bullet Cluster but at a higher redshift. High-velocity collisions between massive clusters constitute a severe challenge to the commonly accepted CDM paradigm. For example, Asencio et al. (2021) argue that in a CDM context the detection of a cluster such as El Gordo can be ruled out with a high significance.
Another noteworthy feature of El Gordo is the peak location of the different mass components, as probed by various multifrequency observations (Menanteau et al. 2012; Jee et al. 2014; Zitrin et al. 2013; Diego et al. 2020; Kim et al. 2021). As expected, the X-ray peak position of the SE cluster is spatially offset from that of its mass centroid; however, the X-ray peak is not trailing the DM peak as in the Bullet Cluster but is instead leading the mass peak. This is clearly at variance with what is expected from dissipative arguments, but it can be explained in the so-called returning scenario, as proposed by Ng et al. (2015). According to those authors, the two clusters are not moving away from each other (unlike just after the pericenter passage); instead, the cluster is now in a post apocenter phase, with the two clusters moving towards each other.
Moreover, the BCG is not only trailing the X-ray peak but appears to also be spatially offset from the mass centroid. This behavior has been observed in other clusters (Hallman et al. 2004; Canning et al. 2012), and in an SIDM scenario it is expected to exist in major mergers, between the collisional DM and collisionless galaxies (Kim et al. 2017).
Because of its many unusual properties, El Gordo has been the subject of several N-body/hydrodynamical simulations aimed at reproducing the observed X-ray morphology (Donnert 2014; Molnar & Broadhurst 2015; Zhang et al. 2015, 2018). Simulations by Donnert (2014) were able to reproduce some of the cluster X-ray properties, such as the total X-ray luminosity and the offset between the X-ray peak and the SZ centroid, but failed to replicate the observed twin-tailed X-ray morphology. This could be due to a number of factors, including the numerical scheme used in the simulations. Donnert (2014) carried out the simulations by employing a smoothed particle hydrodynamics (SPH; Price 2012) scheme, which, in its standard formulation, it is known to suppress the growth of instabilities and, in turn, turbulent mixing (Agertz et al. 2007; Mitchell et al. 2009).
For this reason, in their simulations of the El Gordo cluster, Molnar & Broadhurst (2015) chose to use the Eulerian adaptative mesh refinement (AMR) code FLASH (Fryxell et al. 2000). By considering a range of initial merger parameters, they were able to reproduce the twin-tailed X-ray morphology, but with a projection angle between the plane of the sky and the merging axis that is higher () than that suggested by radio relic polarization arguments (Ng et al. 2015). Moreover, the total cluster X-ray luminosity and mean temperature extracted from the simulations were lower than the measured values, while the spatial offsets between the centroids were larger than those observed.
The most complete simulation study of El Gordo presented so far was computed by Zhang et al. (2015, hereafter ZYL15). By considering a wide range of initial merging parameter space, the authors constructed a large set of N-body/hydrodynamical binary merging simulations aimed at reproducing the observational aspects of El Gordo. They used both SPH and AMR-based codes.
From their simulation ensemble, the model that is best able to reproduce many of the observed properties of El Gordo is a merging cluster (“model B”) with total mass and a high mass ratio (). The initial merging configuration is that of an off-axis merger with impact parameter and a very high initial relative velocity (). The best match with measured offsets and X-ray images of El Gordo, as well as its temperature and luminosity, is obtained Gyr after it passes the pericenter and with a modest inclination angle () between the merging axis and the sky plane.
Model B of ZYL15 can match most of the observed features of the El Gordo cluster, but it is not entirely free of problems. Specifically, a final single X-ray peak is found if the gas core of the primary is destroyed during the collision, but this is obtained only if the initial gas fraction of the primary is low (). This in turn produces X-ray emission in the outer region of the merging cluster that is lower than observed. Finally, it is worth noting that the ZYL15 simulations can reproduce the total X-ray luminosity of El Gordo only for a primary cluster mass of . To date, the simulation set of ZYL15 constitutes the most exhaustive simulation study of the El Gordo cluster. However, the merging scenario investigated by ZYL15 might need to be revisited in light of recent works that suggest substantially lower masses for the El Gordo cluster than those previously measured.
By adopting a free-form lens model, Diego et al. (2020) estimate from their SL study a cluster total mass on the order of . This value is about a factor of 2 lower then previous SL studies (Zitrin et al. 2013). In a recent paper, Kim et al. (2021) present an improved WL analysis aimed at estimating the total mass of El Gordo and that of its components. The values they report for the NW and SE clusters are and , respectively. These values are significantly lower () than those dynamically inferred by Menanteau et al. (2012). They are also lower () than the WL values reported by Jee et al. (2014).
These updated mass estimates were obtained independently by both SL (Diego et al. 2020) and WL studies (Kim et al. 2021) based on improved lensing modeling; they both give consistently lower mass values than those estimated in previous works. This clearly has the advantage of easing the tension with the CDM model (Kim et al. 2021; but see Asencio et al. 2023 for a different view). Nonetheless, it remains to be tested whether this range of masses for the El Gordo cluster is consistent with its observed X-ray morphology.
Therefore, the aim of this paper is to perform a series of N-body/hydrodynamical simulations of a merging scenario that incorporates the recently revised El Gordo cluster masses. The simulations were performed for a variety of merging initial conditions: we did this in order to find the final merging configuration that can best reproduce various observations of El Gordo. The initial condition setup mirrors that implemented by ZYL15; this was purposely chosen to ease the comparison of our results with previous findings.
The structure of the paper is as follows. Section 2 briefly describes the hydrodynamic method we use, as well as the procedures employed to set up the merging initial conditions, illustrating how to construct particle realizations of cluster halos initially at equilibrium and the initial merging kinematics. The results are presented in Section 3, with Section 3.1 showing results from off-axis merger simulations aimed at reproducing the observed twin-tailed X-ray morphology. In Section 3.2 we analyze the consistency of a returning scenario according to the results extracted from head-on cluster collisions, while Section 3.3 is dedicated to merger simulations that incorporate a BCG stellar component and to the impact of SIDM on some merging models. Section 4 summarizes our main conclusions. Throughout this work we use a concordance CDM cosmology, with , and Hubble constant km s-1 Mpc-1.
2 Simulation setup
2.1 Simulations
Our code consists of an improved SPH numerical scheme for the hydro part, coupled with a standard treecode (Hernquist & Katz 1989) to solve the gravity problem. The Lagrangian SPH code employs an entropy conserving formulation, while in the momentum equations SPH gradients are estimated by evaluating integrals and performing a matrix inversion.
This tensor approach (García-Senz et al. 2012) has been tested in a variety of hydrodynamical test cases (Valdarnini 2016), showing that it outperforms standard SPH (Price 2012) by greatly reducing gradient errors and in terms of code performances can be considered competitive with results obtained from AMR codes (Valdarnini 2016). The code has previously been applied to the study of turbulence in galaxy clusters (Valdarnini 2019) and to that of cool-cores in merging clusters (Valdarnini & Sarazin 2021). In particular, we refer to this last study for a comparison with results extracted from merger simulations based on Eulerian AMR schemes and for a full description of the code. In the following we refer to the SPH scheme used here as integral SPH (ISPH).
For the sake of completeness, we introduce here the SPH gas density equation, to which we will later refer for further generalization. In SPH there are gas particles with mass , position , and velocity that represent the fluid.
The SPH gas density at the particle position
| (1) |
gives the particle gas density . The summation should be over all the set of particles, but because the adopted kernel has compact support it reduces to only the neighboring particles for which . We use here the kernel (Price 2012). The smoothing length is obtained by finding the root of
| (2) |
for which we set .
2.2 Initial conditions
To study the merging cluster El Gordo, we performed a series of N-body/hydrodynamical ISPH simulations. The merging system consists of a primary cluster with mass and a secondary with mass , and the mass ratio is .
The cluster mass is defined as the mass within the cluster radius . This is the radius within which the total mass is
| (3) |
and the mean density is times the cosmological critical density . The cluster radii are calculated by setting , the redshift of the El Gordo cluster.
The initial condition setup that we used for the two colliding clusters follows the same setting adopted by ZYL15. This was purposely chosen with the intent of validating our initial condition method by comparing results extracted from similar merging runs, and then comparing different merger simulations against a baseline merging model.
To construct the initial conditions for our merger simulations, we first performed a particle realization of two individual spherical halos, initially in hydrostatic equilibrium. Each halo consists of multiple mass components: DM, gas, and eventually star particles.
2.2.1 Dark matter
For the DM density profile we assumed an NFW profile
| (4) |
where and are the scaling parameters for density and radius, respectively. The scale radius is defined by , where is the concentration parameter. We set the value of using the relation of Duffy et al. (2008):
| (5) |
where . The DM cluster density profile is then specified once the mass and the concentration parameter are given.
At radii larger than the cumulative mass profile diverges as . We therefore introduce for an exponential cutoff up to a final radius :
| (6) |
where is the truncation radius, and the parameter is set by requiring the first derivative of the DM density profile to be continuous at . For the runs presented here, we set the truncation parameters to the values ; this choice was motivated due to stability considerations (see Valdarnini & Sarazin 2021, for a discussion about the optimum choice of these parameters).
To construct a particle realization of the DM density profile, we first computed the cumulative DM mass within the radius . We solved for the particle radius, by inverting , where is a uniform random number in the interval .
Particle speeds are determined according to Kazantzidis et al. (2004). For spherically symmetric systems the density of a given mass component is given by
| (7) |
where is the relative gravitational potential of the system , is the relative energy and the corresponding distribution function. Here the subscript denotes the mass (DM or stars) component under consideration.
Through the Abell integral transform (Binney & Tremaine 1987) it is possible to invert Equation (7) to obtain
| (8) |
where the second-order derivative can be evaluated analytically from and .
We constructed tables of by evaluating numerically the integral (8) over a range of energies. We then used an acceptance–rejection method to obtain the particle speed for a particle at position .
Finally, the directions of the particle position and velocity vectors are assigned by randomly orienting unit vectors.
| Model | gas profile | |||||||
|---|---|---|---|---|---|---|---|---|
| B_1 | 2.02 | 2.41 | 3.6 | 2500 | 800 | (0.05,0.1) | Burkert | |
| A_1 | 1.63 | 2.54 | 2.0 | 3000 | 300 | (0.1,0.1) | Burkert | |
| Bf | 1.74 | 2.5 | 2.32 | 2500 | 600 | (0.1,0.1) | -model | |
| Bg | 1.74 | 2.5 | 2.32 | 2000 | 600 | (0.1,0.1) | -model | |
| Bh | 1.74 | 2.5 | 2.32 | 1500 | 600 | (0.1,0.1) | -model | |
| Bk | 1.5 | 2.6 | 1.54 | 1500 | 600 | (0.1,0.1) | -model | |
| Bl | 1.5 | 2.6 | 1.54 | 2000 | 600 | (0.1,0.1) | -model |
Notes. a Columns from left to right: ID of the merging model, halo mass of the primary , cluster radius at which , halo concentration parameter of the primary as given by Equation (5), primary-to-secondary mass ratio , initial collision velocity, collision impact parameter, primary and secondary cluster gas mass fractions at , adopted model for the gas density profile of the primary. .
2.2.2 Baryonic matter
To construct the cluster gas initial conditions, we assumed spherical symmetry and hydrostatic equilibrium. Following ZYL15, for the gas density we adopted the Burkert (1995) density profile:
| (9) |
where is the gas core radius and the central gas density. At radii larger than the density profile is continued by assuming that it follows that of the DM (Zhang et al. 2014):
| (10) |
The choice of the core radii is observationally motivated by the X-ray morphology of El Gordo. In their paper, ZYL15 chose to set and for the primary and secondary cluster, respectively. These choices will be discussed later, here for the initial gas density profile of the primary we additionally considered the commonly employed non-isothermal -model (Cavaliere & Fusco-Femiano 1978):
| (11) |
For a given gas core radius, and slope parameter, , to completely specify the gas density profile, it is necessary to determine the central density . This is done by assigning the initial gas mass fraction of the cluster at and then finding the corresponding root value . The choice of the initial gas density profiles is a crucial issue in shaping the final X-ray morphology of the merging system. We provide a thorough discussion of the adopted profiles in Section 2.5.
Finally, under the assumption of hydrostatic equilibrium, the gas temperature at radius can now be derived (Mastropietro & Burkert 2008; Donnert 2014):
| (12) |
where is the total mass within the radius and we assume . The gas thermal energy in the SPH equations is obtained by setting for the ideal equation of state.
The initial gas particle positions were generated starting from a uniform glass distribution of points. The desired density profile was then obtained by applying a radial transformation to the particle coordinates such that the corresponding mass profile is now consistent with the initial gas mass profile. The initial gas velocities were set to zero.
2.2.3 Stellar component
For some of our merging runs, we also considered halos that contain a star matter component, in addition to the DM and gas. This is supposed to mimic the BCG mass distribution, which we initially placed at the center of the halo.
| (13) |
where is the effective radius and the stellar density at that radius, we set here . The BCG mass is derived according to the relation of Kravtsov et al. (2018, their Table 2):
| (14) |
For , which is appropriate for the range of halo masses considered here, the relation (14) gives . We can now obtain the density by solving for the ratio within , once is given.
If one adopts the relation of Shen et al. (2003, Equation 33), then for one obtains kpc. The smaller is the value of the effective radius, the higher must be the central density for a given . However, the mass resolution of the simulations sets a lower limit for the minimum spatial scale that can be resolved, so the value of should be considered simulation dependent. For example in their simulations ZuHone et al. (2019) set kpc, as a compromise we set here kpc. This value is a bit higher than the adopted gravitational softening length for the DM particles (see below). For a halo mass and , we obtain for the central value of the stellar mass density. For a given initial star density distribution, we then determined positions and velocities of the star particles according to the procedure described in Section 2.2.1.
Finally, we assigned the mass of DM and gas particles as in the merger simulations of Valdarnini & Sarazin (2021):
| (15) |
and , respectively. Here is the mass of the secondary and the cosmological mass gas fraction. With this mass resolution we have DM particles for an halo mass of , and gas particles for an halo gas mass of .
| Model: | merger simulation ID | |||||
|---|---|---|---|---|---|---|
| Bf: | Bfrc29 | Bfrc26 | Bfrc22 | Bfrc20 | Bfrc17 | Bfrc14 |
| () | 290 (2.4) | 260 (2.67) | 217 (3.2) | 200 (3.44) | 174 (4.) | 145 (4.81) |
| Bg: | Bgrc29 | Bgrc23 | Bgrc20 | Bgrc17 | Bgrc14 | |
| () | 290 (2.4) | 232 (3) | 200 (3.437) | 174 (4) | 145 (4.81) | |
| Bh: | Bhrc29 | Bhrc22 | Bhrc20 | Bhrc17 | Bhrc16 | Bhrc14 |
| () | 290 (2.4) | 217(3.2) | 200(3.44) | 174(4.) | 160(4.37) | 145(4.81) |
| Bk: | Bkrc19 | Bkrc18 | Bkrc17 | Bkrc15 | Bkrc14 | Bkrc12 |
| () | 191 (3.) | 179 (3.206) | 167 (3.43) | 155 (3.7) | 143 (4) | 119 (4.81) |
| Bl: | Blrc24 | Blrc21 | Blrc19 | Blrc18 | Blrc17 | Blrc14 |
| () | 240 (2.39) | 215 (2.67) | 191 (3.0) | 179 (3.207) | 167 (3.43) | 143 (4) |
Previous tests (Valdarnini 2019; Valdarnini & Sarazin 2021) showed that with these mass assignments the simulation numerical resolution is adequate to properly describe the development of hydrodynamic instabilities during the merging phase.
The gravitational softening parameters of the particles are set according to the scaling (Valdarnini & Sarazin 2021)
| (16) |
For merger simulations with a BCG, we decided to increase the number of star particles by a factor of . To obtain the mass of star particles, we then applied Equation (15), but with a coefficient scaled down by a factor of . This is to prevent any discreteness effects on the star particle distribution during the simulations. With this choice of parameters the lower limit (Power et al. 2003) to the gravitational softening length of the star particles is then consistent with the values given by Equation (16). We note, however, that this lower limit is derived by requiring discreteness effects to be negligible over a Hubble time, whereas here the timescale of the collisions is Gyr.
Particle positions and velocities are integrated using a standard hierarchical block timestep scheme (Hernquist & Katz 1989). According to several accuracy and stability requirements (Springel 2005), each particle, has its own optimal timestep, , which is chosen from a power-of-two hierarchy , where and Gyr is the largest allowed timestep. During the simulations, we recorded particle properties at simulation times , where is the simulation step.
2.2.4 Initial merger kinematics
To construct the orbits of our merger simulations, we chose a Cartesian system of coordinates , with the mergers taking place in the plane and the center of mass of the two clusters being centered at the origin.
As previously indicated, the initial separation and relative velocity vectors of the two clusters are set as in ZYL15. For a given mass ratio the initial separations are then and for the primary and secondary cluster, respectively. Here is the impact parameter of the collision and . Similarly, for the initial velocities we set for the primary and for the secondary, where is the initial collision velocity.
We then shifted the particle positions and velocities of the two halos according to the vectors ; the merger dynamical evolution was fully determined by the merging parameters . In terms of these parameters the energy of the system can be expressed as
| (17) |
where for the merging system we have assumed the absence of bulk motion and that the initial distance between the two clusters is greater than the sum of their radii .
2.3 Numerical implementation of self-interacting dark matter
The possibility that DM has collisional properties has been investigated by many authors and is observationally motivated by the well-known challenges faced by the standard CDM model over a wide range of scales. We refer to Tulin & Yu (2018) for a recent review on the subject. On cluster scales, SIDM offers a natural explanation for the apparent spatial offsets seen in merging clusters between the galactic and the DM component, though it must be emphasized that this effect is not present in every merging cluster.
Several approaches have been proposed to implement DM self-interactions in N-body simulations. A DM simulation particle is a “super” particle that represents a patch of DM phase-space that contains a large number of physical DM particles (Hockney & Eastwood 1988). The DM self-interactions are then modeled according to a standard Monte Carlo method, in which a scattering between two DM simulation particles takes place whenever a local scattering probability is smaller than a random number.
In the following, we restricted ourselves to the simplest case of isotropic and elastic scattering between DM particles; moreover, we further assumed a constant, velocity-independent DM cross-section . Although an SIDM model with a constant DM cross-section fails to satisfy a number of constraints over a wide range of mass scales (Kaplinghat et al. 2016), it can nonetheless be considered a useful first-order approximation as long as SIDM simulations are restricted to the range of cluster scales (ZuHone et al. 2019).
To determine the local scattering probability, different methods have been proposed. The approach that we followed here was introduced by Vogelsberger et al. (2012), and its implementation requires the definition of a local DM density.
For each DM particle, we defined a DM density according to the SPH formulation, and, as in Equation (1), we thus defined a DM smoothing length such that
| (18) |
where denotes the mass of the DM simulation particle and the summation is over DM neighboring particles. The DM smoothing length is evaluated whenever the particle is active and its timestep is synchronized with the current simulation time. For a DM particle that is not active (passive), its smoothing length is extrapolated to the current time from its last evaluation.
For each DM particle the local scattering probability with a neighboring DM particle , within the simulation timestep is then determined as (Vogelsberger et al. 2012)
| (19) |
where is the relative velocity between particles and , is the physical mass of the DM particle and the timestep of particle .
The total probability of particle scattering is , where the factor 2 accounts for the other member of the scattering pair. A collision of particle with one of its neighbors will occur if , where x is a uniform random number in the range . According to Vogelsberger et al. (2012) the scattering neighbor is selected by sorting the set of neighboring particles according to their distance from particle . The scattering neighbor is then the first particle that satisfies .
When the collision condition is satisfied, in the case of isotropic scattering the post-scattering velocities of the tagged pair are
| (20) |
where is the center-of-mass velocity, and is a unit vector randomly oriented. Note that in the simulations we set all the DM particles as having the same mass.
The scattering procedure described here is generically valid for a serial code; however, its implementation in a parallel code is not so straightforward to arrange; it is described in Appendix A. We also tested the scattering implementation by showing results from an isolated SIDM halo.
| Model | [kpc] () | ||||
|---|---|---|---|---|---|
| Bjarc14 | 1.54 | 1500 | 400 | 143 (4) | |
| Bjbrc14 | 1.54 | 2000 | 400 | 143 (4) | |
| Bjcrc12 | 1.54 | 1500 | 500 | 119 (4.81) |
Finally, in all of the merger simulations in which DM is self-interacting the DM halos are assumed to follow initially the same truncated NFW profiles of the simulations. We justified this assumption by assuming the impact of initially cored DM density profiles to be subdominant in the evolution of post-pericenter gas structures (ZuHone et al. 2019).
2.4 Observables and projection analyses
For each of our merger simulations, we saved particle properties at various output times. This was done to generate, for a given viewing direction and at the chosen epoch, images of the surface mass density, X-ray surface brightness, and SZ amplitude. To validate our merger models, these maps could then be compared against analogous images presented in previous works. In particular, to consistently compare the mock maps extracted from our simulations with those shown by ZYL15, we adopted for the observer the same coordinate system introduced by the authors to construct their projected maps.
In such a system the line of sight is along the direction and the coordinates refer to the cluster merger as seen in the plane of the sky. The observer frame is obtained from the simulation frame by applying two rotation matrices. The first performs a rotation around the -axis by an angle , the second rotates the tilted frame by an angle around the -axis. The angle between the axes and is thus the angle between the merging and sky plane. Our viewing direction is thus defined by the angles , we refer to ZYL15 for more details on the setup of the rotation angles.
For a given output time and viewing direction, we integrated along the line of sight to extract 2D maps of observational quantities from the simulation particles. Specifically, we defined the surface mass density as
To properly compare the observed Chandra X-ray images (Menanteau et al. 2012) with the mock X-ray maps extracted from their simulations, ZYL15 applied the MARX software package 111http://space.mit.edu/ASC/MARX to their input X-ray maps. Here we followed a simpler approach and, as in Molnar & Broadhurst (2015), we evaluated the X-ray surface brightness by integrating the X-ray emissivity along the line of sight and over the energy:
| (22) |
where is the gas temperature, the frequency, the metal abundance of the gas, and the effective area of the telescope. For this, we used the four-chip-averaged ACIS-I effective area (Zhao et al. 2004).
However, unlike in Molnar & Broadhurst (2015), here the X-ray emissivity is not calculated analytically but using cooling tables taken from the MAPPINGS III library (Allen et al. 2008). As in ZYL15, we set the gas metallicity to ; for reference, (Anders & Grevesse 1989) is the solar value.
Finally, to consistently compare our maps with observations and previous findings (ZYL15), we set the exposure time to for all the simulated maps. Our X-ray maps (22) will then be expressed in counts arc sec-2 and evaluated in the energy range keV, without taking into account the impact of the cosmic X-ray background.
We defined X-ray temperatures according to the adopted weighting scheme:
| (23) |
where is the weight function. We considered for the commonly employed gas density function (mass-weighted temperatures, ) and the weight function , which defines the corresponding spectroscopic-like temperature . This choice of the weight function has been shown (Mazzotta et al. 2004) to provide an accurate approximation of spectroscopic temperatures extracted from X-ray observations. As in previous integrals, projected X-ray temperature maps are obtained by integrating weighted temperatures along the line of sight.
The SZ surface brightness is calculated at frequency and including relativistic corrections (Itoh et al. 1998):
| (24) |
where , , , and are the electron mass, the Boltzmann constant, the Thomson cross section, the speed of light and the electron number density, respectively. The function is the nonrelativistic frequency function, where and is the temperature of the cosmic microwave background. The second term in the square brackets is a sum of relativistic corrections, with the coefficients given in Itoh et al. (1998) and . As in ZYL15 we set GHz and smooth the SZ maps with a Gaussian kernel with width kpc ( at ).
We evaluated maps of projected quantities on a 2D mesh of grid points with coordinates . Because of the Lagrangian nature of SPH, the value of a function at the grid point is the sum
| (25) |
over the subset of SPH particles that satisfy . To perform the integrals along the line of sight, we exploited the property of the splines (Price 2012), which approximate a Gaussian in the limit . For the kernel used here, the integrals along the line-of-sight were then performed analytically, and we calculated projected quantities at the grid point as
| (26) |
where , (Dehnen & Aly 2012) and is the 2D Gaussian,
| (27) |
To locate the centroid positions of the various maps that we produced to study the El Gordo cluster, we applied the shrinking circle method to the simulation particles. This a 2D version of the shrinking sphere method, which is commonly employed in simulations to locate DM density peaks (Power et al. 2003) or X-ray temperature peaks (Valdarnini 2006).
We describe the method in three dimensions, but the generalization to projected quantities is straightforward. We first introduce the concept of weighted mean position for a subset of simulation particles. This subset can consist of gas, DM, or star particles that were initially members of one of the two colliding clusters. We define a weighted mean position by calculating for the particle subset the averaged center , where the weights are chosen according to the centroid under consideration.
To locate the centroid position, we then started from an initially large radius that contains all of the particle subset, and we calculated the weighted mean position, . We then proceeded to iteratively calculate at each step the centroid position , based on the subset particles that are within a sphere of radius , located at . The last iteration is such that there must be at least a number of particles within . The cluster center is then defined as . We found that the results are robust for , but the choice of the shrinking factor, , is critical: it must be chosen sufficiently large () to prevent the algorithm from failing when there are multiple peaks.
The method is easily applied in 2D to the projected particle positions along the viewing direction. Therefore, for a given mock image, we calculated the position of the mass centroids, as well as the location of the X-ray emission and SZ peaks.
2.5 Merger models
As previously explained in the Introduction, the aim of this paper is to determine whether it is possible to construct merger models for the El Gordo cluster that can consistently reproduce the observed X-ray morphology, as well as many of its physical properties. However, for these models a fundamental constraint must be that of having cluster masses in line with recent WL studies, and not as high as those employed in previous simulations (Donnert 2014; Molnar & Broadhurst 2015; Zhang et al. 2015).
Our merger models will be validated by contrasting our simulation results against the corresponding ones presented by ZYL15 for their fiducial model B. As already outlined, this is the model that is able to match most of the observed El Gordo physical properties. For this reason we adopt here the same initial merging configuration, and extract X-ray maps from our merger simulations when the projected distance between the mass centroids is after the pericenter passage. In all of the considered models, the orientation angles of the merging plane are taken to be the same as in model B of ZYL15: .
To significantly simplify the collision parameter space of our merger models we assume for the secondary the same Burkert gas density profile (9) as in model B of ZYL15, with the gas core radius set to . We justify this assumption by noting from Figure 14 of Menanteau et al. (2012) that the map of the deprojected electron density exhibits a peak value of for the SE component. This value is very close to the core value found for the electron number density of the secondary in model B, at the post-pericenter epoch, that fits the observed projected distances between the mass centroids. We use then this finding to argue that the gas structure of the SE component is adequately described here by adopting the initial gas density profile of the secondary.
We then constructed our ensemble of off-axis mergers by considering different values of the primary mass and modifying the mass ratio such that the mass of the secondary stays close to the estimated value . From Equation (5) one obtains for the halo concentration parameter of the secondary. In accordance with recent mass estimates (Diego et al. 2020; Kim et al. 2021), we examined mergers with the following masses for the primary: and .
For a chosen value of the primary mass we consider mergers whose initial conditions differ in the choice of the initial collision velocity and impact parameter . Table 1 lists the different off-axis merger models that we analyze, together with the corresponding merging parameters ; models A_1 and B_1 are the fiducial models A and B of ZYL15. We will also be considering head-on mergers (models HO), but we defer until Section 3.2 our description of the initial conditions adopted for those models.
The adopted strategy for setting up the initial conditions of our merging runs is based on the following result, found by ZYL15. When the authors considered the possibility of a merger with initial conditions similar to those of model B, but with a smaller primary mass (, panel f in their Figure 5), they found a total X-ray luminosity much smaller than that given by model B. Then they use this finding to conclude that a massive merger () is required in order to obtain an X-ray luminosity as high as that observed in the El Gordo cluster.
We argue that a viable solution for obtaining consistency between the recently measured cluster masses and observed luminosities is to consider the possibility of an initial gas density profile for the primary that is different from the Burkert one (9) previously adopted. Specifically, we employed the well-known -model (11) to describe the initial radial gas density profile of the primary. For a given central density, , the radial behavior of the gas density can be modified by varying the gas scale radius, and the slope parameter, , with the aim of constructing the initial conditions for a merging system that can satisfy the observational constraints previously described.
We further simplified the parameter space of our merger models by setting , as already adopted in merger simulations for the Bullet Cluster (Mastropietro & Burkert 2008) and, in particular, by Donnert (2014) in his simulation study of the El Gordo cluster. For a given set of merging parameters , this choice leaves us with the gas core radius, of the primary as the only parameter needing to be set up for the initial conditions of our merger models.
We then constructed our ensemble of merger simulations by creating, for each of the off-axis merger models listed in Table 1, a subsample of merging clusters with different initial conditions. For a specified set of collision parameters we set up the initial conditions of our models by considering a range of values for the core radius, . Table 2 lists the merger models that we considered; the ID of each model is given by the ID of the corresponding model in Table 1, with a subscript referring to the chosen value of . This is given in terms of the dimensionless parameter . Hereafter, the initial gas core radius of the primary will be denoted as .
Finally, we also considered an additional list of merger models. The collision parameters of these models are given in Table 3.
3 Results
This section is dedicated to the presentation of our main results, which we divide into three subsections. In Section 3.1 we present results obtained by performing off-axis merging simulations of the El Gordo cluster, but with a mass of the primary in line with recent lensing estimates and lower than that considered in previous works. In Section 3.2 we investigate the possibility of a returning scenario to explain the observed X-ray morphology and spatial offsets between different centroids. Finally, in Section 3.3 some of the merging runs of Section 3.1 are revisited by performing the simulations with a BCG stellar component added to the initial halo configurations, and we also consider the possibility of merging simulations within an SIDM framework.
3.1 Search for the optimal merger models
3.1.1 Code validation and physical processes leading to the formation of the observed X-ray morphology
We first discuss simulation results obtained from the merging models A_1 and B_1 of Table 1; the initial conditions of these models are the same as those for the corresponding models of ZYL15. The purpose of these simulations is to provide a sanity check of the initial condition setup adopted here for our merging simulations, as well as for the analysis procedures presented in Section 2.4. The hydrodynamic performances of the ISPH code have already been tested in previous papers (Valdarnini 2016; Valdarnini & Sarazin 2021) against results extracted from Eulerian-based AMR codes.
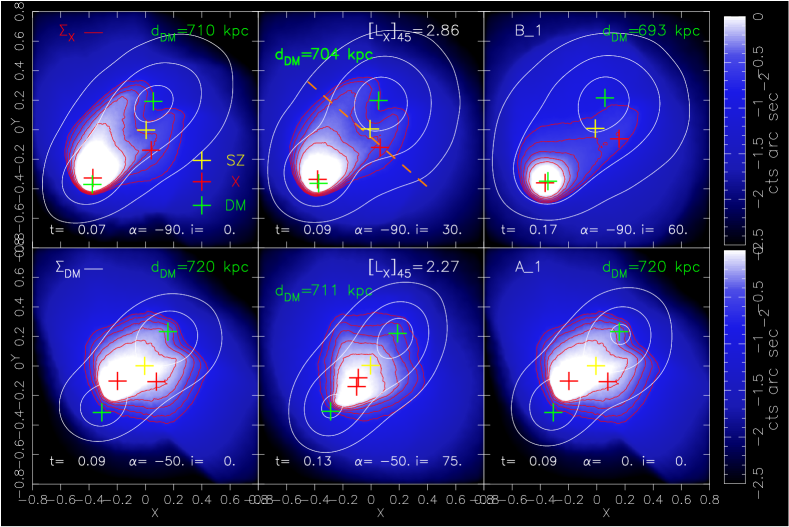
For these two models in Figure 1 we show, at different epochs, the projected surface mass density and X-ray surface brightness maps. The bottom panels are for model A_1 and top panels for model B_1, respectively. Each panel is for a different viewing direction of the merging plane, as in ZYL15. The bottom panels (model A_1) can then be compared directly with those in Figure 1 of ZYL15, while the top panels (model B_1) correspond to those of their Figure 3. Each panel refers to the post-pericenter epoch when the projected distance between the mass centroids is .
To ease comparison with the ZYL15 findings, in each panel we show contour levels of DM (white) and X-ray surface brightness (red) maps. Additionally, we also show the spatial location of the DM (green), X-ray (red) and SZ (yellow) centroids.
A visual inspection reveals that our test simulations are in substantial agreement with the corresponding ones presented in ZYL15, with the mock X-ray images of Figures 1, which exhibit the same morphological features seen in Figures 1 and 3 of ZYL15. In particular, for model A_1 the bottom-left () and bottom-right () panels show the same X-ray structures seen in Figures 1a and 1c of ZYL15: a strongly asymmetric tail (Figure 1a) and a small asymmetric wake-like feature (Figure 1c). The bottom-middle panel () of Figure 1 corresponds to the fiducial model A of ZYL15 (Figure 1b). The X-ray morphology is more symmetric here and very similar to that seen in Figure 1b, with a bullet-like shape.
Similarly, the top panels of Figure 1 can be compared with those displayed in Figure 3 of ZYL15 for their model B. The top-left () and top-right () panels show the existence of a wake structure trailing the secondary, which is asymmetric and oriented either to the left or to the right, respectively. This is the same behavior as seen in Figure 3a and 3c of ZYL15. The top mid panel of Figure 1 corresponds to Figure 3b of ZYL15 and to their fiducial model B. A comparison with this model is particularly significant, since this is the model that best matches the observations. In this panel () the X-ray morphology is clearly characterized by a well-defined twin-tailed structure, as seen in observations and in their Figure 3b.
The consistency between our model B_1, with viewing angles , and the fiducial model B of ZYL15 can be put in a more quantitative way by comparing the respective X-ray luminosities and spectral temperatures . The total X-ray luminosity in the keV band is evaluated by means of a standard SPH estimator, using the cooling tables implemented in our code. For the spectroscopic-like temperature we use Equation (23).
Additionally, a bow shock will form in front of the secondary as it reaches the pericenter and climbs its way toward the apocenter, this is because of the lower ICM sound speed due to the decrease in the gas temperature. The ICM gas will thus be compressed and shock-heated to higher temperatures, forming a leading edge oriented perpendicularly to the secondary’s direction of motion (Ricker 1998; Mastropietro & Burkert 2008; Machado & Lima Neto 2013; Molnar & Broadhurst 2015; Sheardown et al. 2019; Moura et al. 2021; Chadayammuri et al. 2022).
The values that we obtain for these quantities are given in Table 4 and are and , respectively. These values can be directly compared with the corresponding ones reported in Table 2 of ZYL15: and . From the same table one also has for the central SZ decrement, while from Table 4 . The largest relative difference is between the X-ray luminosities, which is naively expected given the proportionality of to the squared density and the associated uncertainties.
Given that these results have been obtained using two numerically different hydrodynamic schemes, and the uncertainties associated with the use of different estimators, we conclude that there is a fair agreement between the two simulations. We finally conclude that our merger model B_1 is in accordance with the corresponding fiducial model B of ZYL15. We therefore adopted model B_1, which we simply refer to as model B from here on, as the baseline model against which to validate the simulation results obtained from our merger models.
Before we discuss our findings from the merger models, it is useful to look first at the processes leading to the formation of the twin-tailed morphology seen in the X-ray structure of the merger model B of Figure 1. The main collision parameters that determine the X-ray structure of the colliding clusters are the relative collision velocity and the collision parameter , while keeping fixed the mass ratio and the viewing direction.
For a given set of collision parameters the merger will be characterized by an infall phase in which the secondary falls in the potential well of the primary, with a growing ram-pressure as the secondary approaches the pericenter and the relative velocity increases. This pressure will strip material from the secondary, leading to the formation of a downstream tail. Because the collision is off-center, during its motion through the ICM of the primary, the secondary will begin to deviate from its original trajectory and the tail will no longer be aligned with the direction of motion.
The gas morphology that is produced after the collision thus depends on the adopted set of merging parameters . If gets higher while the other collision parameters are kept fixed, there will be a significant weakening of the ram pressure during the collision. This in turn will produce a strong asymmetric one-tailed gas structure, which is not observed; moreover, the primary would not have been destroyed during the collision. Similarly, if approaches zero, the collision will become axisymmetric around the collision axis, in contrast to the observed twin-tailed X-ray morphology (see Section 3.1.2). The observed asymmetric two-tail X-ray structure is therefore expected to be produced for just a certain range of values of the impact parameter .
Lowering the infall velocity without modifying the other collision parameters decreases the amount of gas removed by ram pressure stripping, and the final result will be a single tail trailing the secondary. Similarly, if gets higher the interaction time between the two clusters will be strongly reduced and the resulting X-ray map will be strongly asymmetric (cf. Figure 5a and 5b of ZYL15).
We thus deduce that for a given set of merging parameters the post-collision gas structures are expected to be roughly reproduced if one reduces proportionally both and . The same reasoning applies if the mass of the primary is decreased. Finally, projection effects can hide the real X-ray morphology and produce overlapping structures along the line of sight.
3.1.2 Off-axis merger models with mass of the primary : Models Bf, Bg, and Bh
We next used our findings to investigate different merger models aimed at reproducing the observed El Gordo X-ray morphology in a revisited mass estimate framework. As can be seen from Table 1, we considered two families of off-axis merger models. The first family has the mass of the primary set to (models Bf, Bg and Bh), while for the second family (models Bk, Bl and Bj). This set of models will be presented in Section 3.1.3. All of the models have the gas fraction of the primary set to . In our merging runs the highest value that we use for the mass of the primary is . This is about higher than the mass estimate () reported by Kim et al. (2021) for the NW cluster, but still within observational uncertainties.
We present our simulation results following the top down ordering of Table 1, with merging initial conditions that progressively deviate from those of the reference model B. The first model that we consider is model Bf, with and , followed by models Bg () and Bh ().
Model Bf is nothing else than the merger model presented by ZYL15 in their Figure 5f. The authors rule out this model because it is unable to match the required total X-ray luminosity. Our goal here is to assess the extent to which a given merger model, with a specific set of merging initial conditions , can reproduce the observational features of the El Gordo cluster.
As introduced in Section 2.5, we adopt here the simulation strategy of performing a set of merging simulations with initial conditions that differ in the choice of the primary’s gas scale radius , while keeping fixed the other collision parameters of the chosen merger model. Table 2 reports the set of merging simulations specific to a given model, together with the corresponding gas core radii.
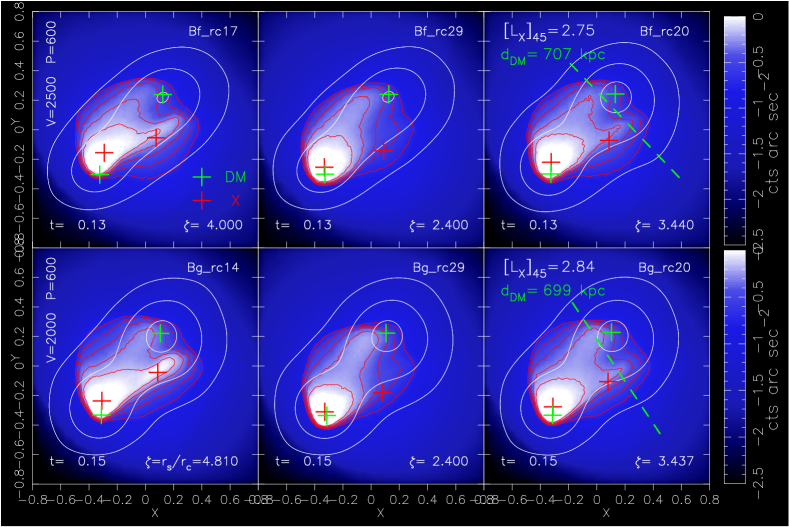
The top panels of Figure 2 show, from the left to the right, the mock X-ray images extracted from the runs of models Bf_rc17, Bf_rc29, and Bf_rc20. The current epoch is defined when the projected distance between the mass centroids is approximately , and as for the fiducial model B of Figure 1 the viewing angles are . Hereafter, the same projection direction will be used to extract X-ray surface brightness maps from the off-axis merging simulations presented here.
For the Bf models, the NFW scale radius, , of the primary takes the value , so the ranges from (: Bf_rc14) up to (: Bf_rc29). From the maps of Figure 2 it appears then that a change of , within a certain range of values and under certain conditions for the primary’s gas density profile, has the same impact on the final X-ray morphology of the merger as if one were modifying the initial impact parameter .
Specifically, model Bf_rc29 clearly illustrates the effect on the post-collision X-ray structure of the merging when the gas core radius is increased. At the observer epoch, the X-ray morphology clearly exhibits only one tail trailing the secondary (top mid panel of Figure 2). In accordance with the previous discussion about the dependence of the final X-ray morphology on the collision parameters, we argue that for model Bf_rc29 the final one-tail X-ray feature is a consequence of the reduced ram pressure experienced by the secondary during the collision. This is in turn due to the primary’s lower gas density because of the larger core radius.
If instead approaches small values, the opposite must hold. The amount of gas stripped by the secondary during its motion through the primary’s ICM will be much higher because of the increased ram pressure. As can be seen from model Bf_rc17 (top-left panel of Figure 2) the X-ray morphology at the observer epoch now exhibits a strongly asymmetric two-tailed structure, with one tail previously absent and now with a much stronger emission than the other.
It should also be stressed that such a dependence of the amount of stripped gas on takes place because the gas mass fraction is held fixed between the models. This in turn implies that the central gas density of the primary is anticorrelated with . For a central gas density kept constant, one expects the dependence of the amount of stripped material on to be reversed.
These findings suggest that for the collision parameters of the Bf family models, the characteristic twin-tailed X-ray structure seen in the El Gordo cluster can be reproduced with an appropriate choice of . Model Bf_rc20 (top-right panel of Figure 2) is the model whose X-ray image is best able to match the requested morphology: for this model and its twin-tailed morphology well reproduces that of fiducial model B in Figure 1. Hereafter, we denote the fiducial model for the Bf family of merger models as model Bf_rc20.
The same reasoning can be applied to the Bg models, for which the bottom panels of Figure 2 show the mock X-ray maps extracted from three runs with different values of the gas core radius of the primary, . For these models the initial collision velocity is lower () than in the Bf models, and model Bg_rc20 ( is now the fiducial model that produces the optimal X-ray morphology. We note that despite the initial velocity being lower than in model Bf_rc20, the gas core radius is the same, but the X-ray morphology is a bit more asymmetric.
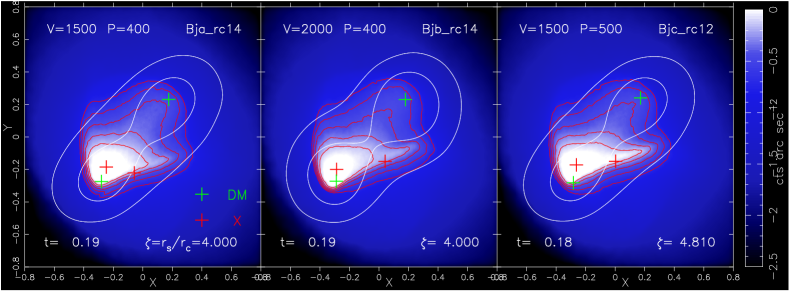
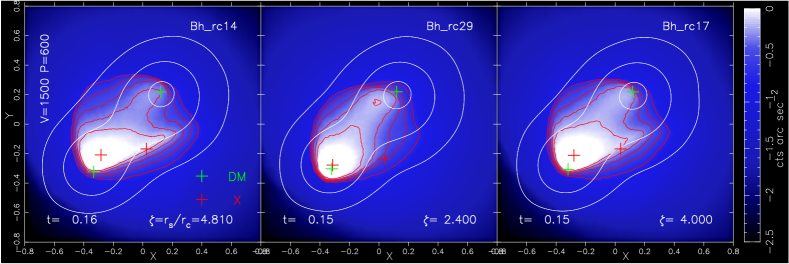
Figure 3 shows for the Bh models X-ray maps extracted from three merger simulations. For these models and it is interesting to note that all of the considered models, from (: Bh_rc29) down to (: Bh_rc14), produce strongly asymmetric X-ray structures that are in contrast with the observed X-ray morphology. This is clearly a consequence of the now much weaker ram pressure due to the relatively low initial velocity between the two clusters.
We use these findings to argue that merger models of the El Gordo cluster, with a primary mass of approximately , require collision velocities at least as high as in order to be able to reproduce the observed X-ray morphology.
3.1.3 Off-axis merger models with mass of the primary : Models Bk, Bl, and Bj
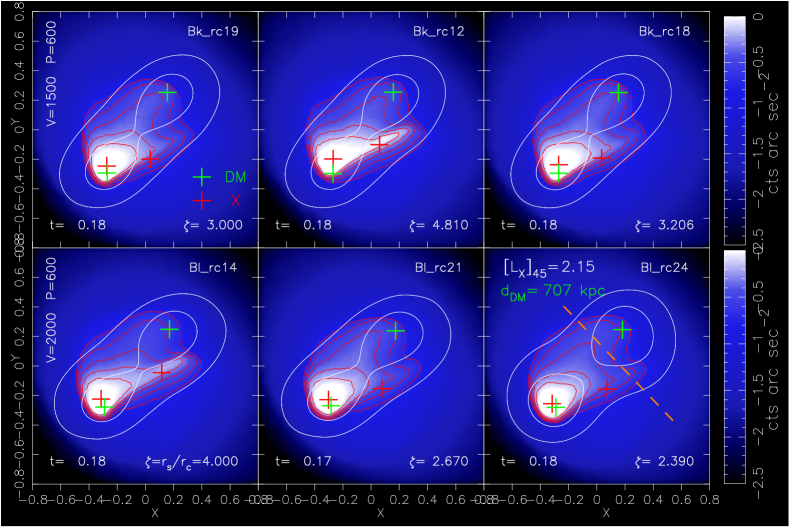
For the family of merger models with mass of the primary , we have model Bk ( and ) and Bl (), plus the additional models Bj of Table 3.
Figures 4 and 5 show the X-ray images constructed from simulation results of the merger models Bk, Bl and Bj. The top panels of Figure 4 demonstrate that the observed twin-tailed morphology cannot be reproduced by merger models with initial collision velocity as low as (Bk runs), regardless of the chosen value of the primary’s gas core radius. This behavior is similar to that of model Bh (Figure 3), but now the mass of the primary is lower.
For Bl models, the collision velocity is increased to . The bottom panels of Figure 4 show that this class of merger model can produce an X-ray image that compares well visually with those previously used to define the list of fiducial models. Model Bl_rc24 (bottom-left panel of Figure 4) is the merger model that is best able to match the observed X-ray morphology: for this model and is the corresponding value of its primary’s gas core radius. This model is added to our list of fiducial models.
So far we have essentially considered only merger models with initial impact parameter ; the exception is fiducial model B () because of the high value of its primary’s mass. In order to assess the viability of merger models with a smaller value of the impact parameter we ran an additional set of models (Bj), with now ranging from down to . For each set of collision parameters we performed merging simulations by considering different values of . We show here results extracted from the most significant merging runs, Table 3 lists the collision parameters of these models. For all of them the mass of the primary is set to .
Figure 5 shows the X-ray maps extracted from the merger models Bj of Table 3. From these maps it is possible to deduce that mergers with initial impact parameter as low as are unable to generate the requested X-ray morphology. The X-ray structure is strongly asymmetric, with only one tail present if (Bjb_rc14 run) and approaches that of a head-on collision when (Bja_rc14 run). The asymmetric one-tail structure is even more pronounced if one considers model Bjc_rc12 for which .
3.1.4 Comparison of the results with previous findings and observations
In order to better constrain the fiducial merger models that have been singled out by our set of simulations, for each of these models we now compare results and observations. Table 4 lists the measured values of several quantities, together with their observational estimates. These are taken from Table 2 of ZYL15.
The spectral X-ray temperatures given in Table 4 are obtained by using the estimator given by Equation (23). This approach is much simpler than that adopted by ZYL15, who estimated spectral temperatures by fitting mock X-ray spectra using the software package MARX; nonetheless, it has been employed by many authors (Mastropietro & Burkert 2008; Molnar et al. 2013; Zhang et al. 2018) and it provides a good approximation to cluster spectral fit temperatures, as demonstrated by Nagai et al. (2007).
The spectral temperature of model B () is smaller than that reported by ZYL15 for their fiducial model B () by a factor of . As previously discussed we do not consider this discrepancy particularly significant, given the use of different codes and estimators. The temperatures of models Bf_rc20 and Bg_rc20 () fare better than model B to approximate the observational estimate (). Model Bl_rc24 has the lowest temperature (), which is not surprising given that this is the model with the lowest collisional energy. Finally, for all of the models there is a remarkable agreement between the measured X-ray luminosities, as well as with the observational value, which is somewhat unexpected given the dependence of on the squared density.
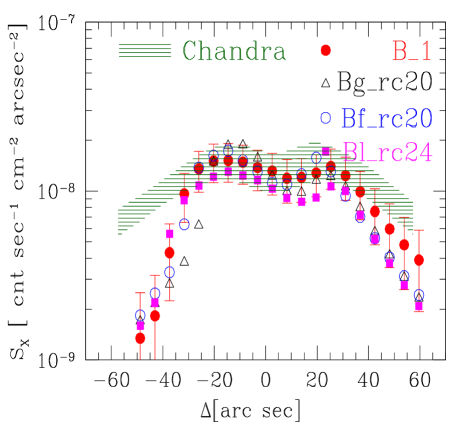
We now proceed to extract X-ray surface brightness profiles from our fiducial merger runs. We evaluate these profiles by cutting spatial regions across the wake behind the X-ray emission peak of the secondary. As in Molnar & Broadhurst (2015), we identified these regions by visual inspection, with their spatial location and orientation changed until the observed spectra best reproduce previous findings. These regions correspond to the dashed orange lines shown in the X-ray images of the fiducial models.
Figure 6 shows the measured profiles as a function of the distance across the wake; these can be compared with those depicted in Figure 8 of ZYL15 or Figure 4 of Molnar & Broadhurst (2015), after appropriate rescaling. All of the profiles agree quite well with each other, they share a minimum at and their two peaks are separated by about . The profiles are approximately symmetric around , but exhibit a weaker emission in the wings, with respect the ones presented by ZYL15 and Molnar & Broadhurst (2015). The origin of such a discrepancy is not clear, we suggest that could be due to possible differences in the procedures adopted to define the extraction region used to calculate the spectra.
| B_1 | Bf_rc20 | Bg_rc20 | Bl_rc24 | Observations a | |
| 704 | 707 | 699 | 707 | 700 | |
| 2.86 | 2.75 | 2.84 | 2.15 | 2.19 0.11 | |
| 11.8 | 13.2 | 13.5 | 10.9 | 14.5 1 | |
| 504 | 391 | 414 | 398 | 600 | |
| -915 | -959 | -997 | -662 | -1046 116 | |
| 1024 | 956 | 971 | 856 | 586 96 |
Notes. Rows from top to bottom: projected distance between the mass centroids, total X-ray luminosity in the band, X-ray spectral temperature of the SE cluster, offset between the SE X-ray peak and the SZ centroid, central SZ decrement, mean relative radial velocity between the SE and NW clusters. a: From Table 2 of ZYL15.
The separation between the two maxima and their emission level () are in accordance with those exhibited by model B of ZYL15. However, for their model the X-ray emission of the minimum is almost at peak levels, whereas here it is a factor of lower. This discrepancy is less pronounced in the spectra of Molnar & Broadhurst (2015), for which the emission level of the minimum is about of the maxima.
The SZ-X-ray offset ( ) is substantial in accordance with the corresponding value reported in their Table 2 by ZYL15 for their fiducial model B, and it is smaller than the value estimated by observations (). Following ZYL15 we argue that such a discrepancy is primarily due to the low angular resolution of the SZ measurements. For the other merger models the discrepancy becomes larger, as a consequence of the reduced collision velocity and of the primary’s mass.
The SZ central temperature decrement of fiducial model B is , in line with observational estimates and in accordance with the corresponding value reported by ZYL15 for their model B (). Models Bf_rc20 and Bg_rc20 have similar decrements, while for model Bl_rc24 the decrement is much smaller () and inconsistent with the measured value. We consider this discrepancy a clear consequence of the reduced collisional energy of this merging model.
Another observational feature that can be compared against simulation results is the relative radial velocity, , along the line of sight between the NW and SE clusters. From the redshift distribution of member galaxies, Menanteau et al. (2012) estimate for the SE cluster a relative radial velocity of , with respect to the NW component.
The merging runs presented in this section, as well as those of ZYL15, do not incorporate a stellar component in the initial condition setup. Therefore, in these simulations the observed galaxy velocity distribution can only be contrasted against simulation results if one assumes the velocity distribution of DM particles to be a proxy of that observed for galaxies. This is supposed to be a fair assumption as long as the DM is supposed to be collisionless. In Section 3.3 we investigate the the observational consequences when this assumption is no longer valid.
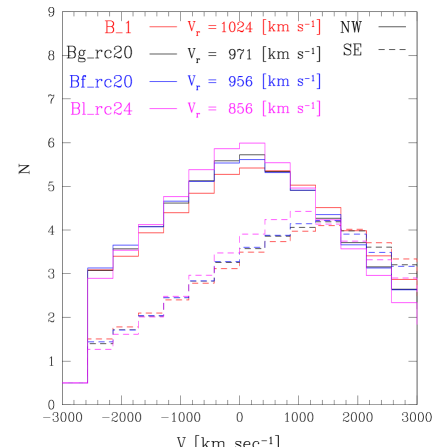
For the four fiducial merger models we show in Figure 7 histograms of the velocity distribution of DM particles, for both NE and SW clusters. The histograms are normalized to a total of 51 (36) members for the NW (SE) component, as in Figure 9 of of Menanteau et al. (2012). The Figure also reports the difference along the line of sight between the mean radial velocities of the NW and SE clusters. The mean projected velocities of each component are evaluated by averaging over all of the DM particles that, in the observer plane, are within a distance of from its mass centroid.
The velocities are in the range from (model B) to (model Bl_rc24) and are significantly higher than the measured value . This tendency has already been noted by ZYL15. The authors argue that contamination between the different mass components, which occurs during the collision between the two clusters, can significantly bias the measurement of radial velocities and cause underestimation of the relative real cluster velocity.
The two velocity histograms of fiducial model B can be directly compared with the corresponding ones shown in Figure 9 (bottom panel) of ZYL15, the construction procedure being the same. From the two Figures it appears that the velocity distributions extracted from the two simulations are in good agreement. In particular ZYL15 report for their model B.
To summarize, we use the results of this section to argue that the observed twin-tailed X-ray structure seen in the merging cluster El Gordo can be reproduced in off-axis merging simulations only for a narrow interval of values of the initial collision parameters. Specifically, the observational morphological constraints are satisfied for and . The mass of the primary is allowed to vary in the range , with the mass ratio adjusted to satisfy . The lower part of the mass interval is favored by the latest mass estimates.
The fiducial merger models that have been found here to agree with the observed X-ray structures also satisfy a number of observational constraints. In particular models Bf_rc20 and Bg_rc20, which have a primary mass of , show an overall better agreement with data.
3.2 A returning scenario?
One of the most challenging features to reproduce in the simulations of the El Gordo cluster is the observed offset between the X-ray emission and DM density peak of the SE component, with the latter being closer to the merging center of mass (see, for example, Figure 1 of Ng et al. 2015). This observational aspect is clearly at variance with what is expected in a outgoing, post-pericenter, scenario in which, after the collision, the X-ray emission peak is expected to trail the DM mass centroid.
To solve this inconsistency Ng et al. (2015) suggested that the El Gordo cluster is presently observed at a later stage of the merger, in a returning phase with the DM secondary having reached the apocenter and now falling back onto the primary. The authors conclude that a returning scenario is favored by comparing available data against a large set of Monte Carlo simulations with different input parameters. They construct different merger models by following the evolution of the two DM subclusters in a head-on scenario.
In this section we perform a suite of hydrodynamical simulations to investigate the viability of a returning scenario as a possible solution to the offset problem. To consistently compare our simulations with previous findings (Ng et al. 2015), we considered head-on collisions and accordingly set ; the procedures for setting up the initial conditions are those outlined in Section 2.
We construct our set of simulations by considering a range of collision parameters. Specifically, for the mass of the primary we chose , as in Table 1 of Ng et al. (2015). The mass of the secondary is set by those authors to , or . Here we instead consider the following values for the merging mass ratio: .
For a given value of we considered three different values of the collision velocity: and ; our set of simulations thus consists of nine head-on merger collisions. The IDs of the runs are given in Table 5, these are defined according to the mass ratio and the initial collision velocity . We explicitly decided to investigate a wide range of merging parameter space, in order to assess for which initial conditions head-on encounters are best able to reproduce the observed twin-tailed X-ray morphology.
As the collision parameter the asymmetries in the X-ray emissivity maps of the merging clusters tend to disappear and the collision becomes axially symmetric. Previous head-on merging simulations of the El Gordo cluster have been conducted by Donnert (2014) and ZYL15 (their model A). As can be seen from Table 1, these simulations were not perfectly head-on but were performed with an initially small impact parameter ().
The simulations of Donnert (2014) were able to satisfy a number of observational constraints but failed to reproduce the twin-tailed X-ray morphology, the X-ray peak being followed by only one tail elongated along the collision axis. Model A of ZYL15 is a highly energetic (), almost head-on collision. As discussed in the previous section, their fiducial model A corresponds to the bottom-middle panel of Figure 1, and the twin-tailed morphology is absent in the highly symmetric X-ray structure. A small asymmetric wake-like feature is instead present in the bottom-right panel of Figure 1 (Figure 1c of ZYL15), which the authors interpret as a consequence of a nonzero impact parameter.
In this case it is worth noting the different values found in the two simulations for the projected separation between the mass centroids. ZYL15 report , while we found here . We attribute this discrepancy to the very large value of the relative velocity () between the two clusters at the evolution time Gyr, when the maps are extracted, and the time resolution of our simulations, given by the timestep Gyr. The current epoch is identified at run time when , and the snapshot of Figure 1 (bottom right) corresponds to the simulation step . The previous output is saved at , when .
| 2 | 4 | 10 | ||
|---|---|---|---|---|
| R01V10 | R02V10 | R03V10 | ||
| R01V20 | R02V20 | R03V20 | ||
| R01V30 | R02V30 | R03V30 | ||
Notes. a: The meaning of the parameters and is the same as in Table 1. For all the simulations we set the mass of the primary to and the initial gas mass fraction to for both of the clusters.
To summarize, no twin-tailed X-ray structure has been reproduced so far in head-on merging simulations of the El Gordo cluster. We thus now discuss results extracted from our set of head-on merging simulations. For each of the merging runs of Table 5 we show in Figure 8 the corresponding X-ray emission maps in the outgoing scenario. The collisions are seen face-on and the secondary moves from right to left. The time displayed in each panel is when for the first time after the pericenter passage; here is when the simulations start.
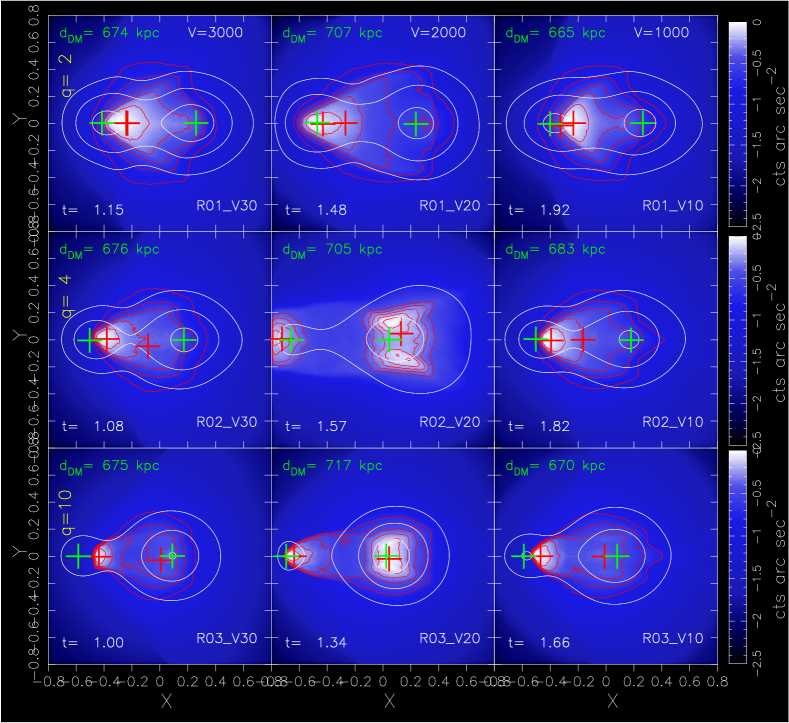
From Figure 8 it can be seen that all of the simulations shown are axisymmetric around the collision axis. Moreover, not unexpectedly, the X-ray emission peaks are always trailing the DM centroids. The only exception to this is the run R02V10, but its initial conditions are a bit peculiar (see below). Finally, in all of the cases, the core of the primary does not survive the encounter with the secondary, with the ICM behind the secondary being shaped by its motion through the main cluster. For the R01 runs (), the ICM morphology is arc-shaped around the secondary’s core, in accordance with previous findings (Ricker & Sarazin 2001), while for higher mass ratios the post-pericenter shape of the ICM depends on the initial velocity .
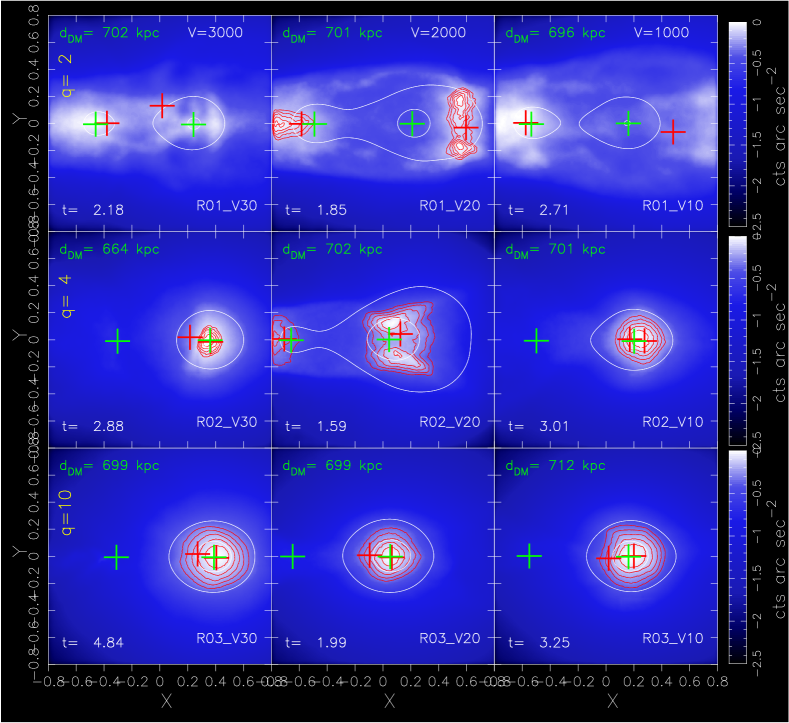
The only merging simulations that show X-ray structures whose shapes can be considered to exhibit some degree of similarity with the requested twin-tailed morphology are the R01 runs (). In fact, the initial conditions of the R01V30 run are very close to those of model A in Table 1, while those of Donnert (2014) can be considered intermediate between R01V30 and R01V20. In the other mergers with , the smaller is the mass of the secondary, the less is the impact on the ICM of the primary. A significant X-ray structure behind the secondary is still visible if the decrease in the mass of the secondary is accompanied by a corresponding reduction in the collision velocity (runs R02V10 and R03V10).
To assess the viability of the returning scenario, Figure 9 shows X-ray maps extracted from the same runs as in Figure 8, but now in a post-apocenter phase. The criterion to identify the observer epoch is still that of having , but this when the secondary has reached the apocenter and is now returning toward the primary.
The time difference between the epochs shown in Figure 9 and those in the corresponding panels of Figure 8 gives, for a specific model, the time spent by the secondary between the outgoing phase and the returning one. The time can assume a wide range of values: from (R02V10) up to Gyr (R03V30).
The time is a function of both and ; for a given , it can be seen that it increases as gets higher. Such behavior is clearly a consequence of the reduced exchange of energy between the two clusters during the collision. The merging run R02V10 has a very small value of because its initial velocity () is such that when the secondary reaches the orbit’s apocenter it is also when ; this is the reason why the X-ray emission and DM centroids of the secondary are so close in both of these two phases.
To compare our findings with the proposed model of Ng et al. (2015), we had to choose from Figure 9 the merging runs for which the value of the mass ratio is closer to the value they adopted (). These conditions are satisfied by the runs R01V10, R01V20, and R01V30, for which , and Gyr, respectively. R01V30 is, however, ruled out by the timescale Gyr favored by Ng et al. (2015). Their Monte Carlo simulations include neither dynamical friction nor tidal forces, so a comparison between their favored value of with the values we found here is not entirely consistent. Nonetheless, in a previous paper (see Table 2 of Valdarnini & Sarazin 2021) we demonstrated that the impact of dynamical friction and tidal forces becomes significant for off-axis mergers when the mass ratio gets higher (). We then use these findings to argue that the constraint on of Ng et al. (2015) can be used to rule out model R01V30.
| Model: | BCGs | IDs of the merger simulations | |
|---|---|---|---|
| Bfrc20: | 0 | DBfrc20 | |
| Blrc24: | 0 | DBlrc24 | |
| Bfrc20 | 1/2/5 | XDBfrc20 | |
| Blrc24 | 1/2/5 | XDBlrc24 |
Notes. a Columns from left to right: collision parameters of the mergers, cluster halos with initially a BCG mass component, value of the SIDM cross-section per unit mass, ID of the merger simulations. For the simulations with , the label X generically refers to merger runs with different values of .
This leaves us with models R01V20 and R01V10. We note that for model R01V20 the DM centroid of the secondary is now closer to the center of mass of the system than its X-ray emission peak; the distance between the two centroids is approximately . However, neither of these two merger models is able to reproduce the X-ray structure that we see in the El Gordo clusters.
In fact these models, as well as all of the others, are morphologically inconsistent with the observed twin-tailed X-ray morphology. We argue that this behavior can be interpreted as follows. The primary’s ICM undergoes a strong increase in temperature and luminosity as the two cluster cores approach the pericenter, when their relative separation has a minimum. Subsequently the two clusters move away from each other and the shock-heated gas, which is no longer in hydrostatic equilibrium, cools adiabatically and its temperature and density drop significantly. Because of the X-ray emissivity dependence on the squared density, this in turn implies a substantial reduction in the X-ray brightness of the gas structures created during the collision.
This behavior is in line with previous findings (Ricker & Sarazin 2001; Poole et al. 2006) and in particular with ZYL15, who argue that the two wings seen at after the pericenter passage in their model of Figure 1c are short-lived. In particular, for model R01V20 the X-ray map of Figure 9 can be compared with the maps presented by Donnert (2014, Figure 5 ) in his simulation study of El Gordo. To properly compare the two merger models, it is necessary to identify among the various panels of Figure 5 the post-apocenter epoch when the secondary is falling onto the primary, and the relative distance between the two clusters is approximately of . It is easily seen that this condition is satisfied at Gyr, and a comparison between the two panels reveals the presence of very similar X-ray structures.
The results presented here are valid for head-on collisions; nonetheless, it should be emphasized that off-axis mergers are also clearly inconsistent with a returning scenario. This can be clearly seen by realizing that for these merger models the time difference between the pre- and post-apocenter epochs, at which must be satisfied the constraint , are significantly higher than for mergers with orbits having zero angular momentum. For the fiducial models of Section 3.1 it is found Gyr, whereas we have seen that the post-collision X-ray structures are fast evolving and their lifetime lies in the range Gyr.
To summarize, the results of this section strongly support the outgoing scenario to explain the observed features of the merging cluster El Gordo. In the next section we investigate alternative possibilities to reproduce the observed offsets between the different mass components of the El Gordo cluster.
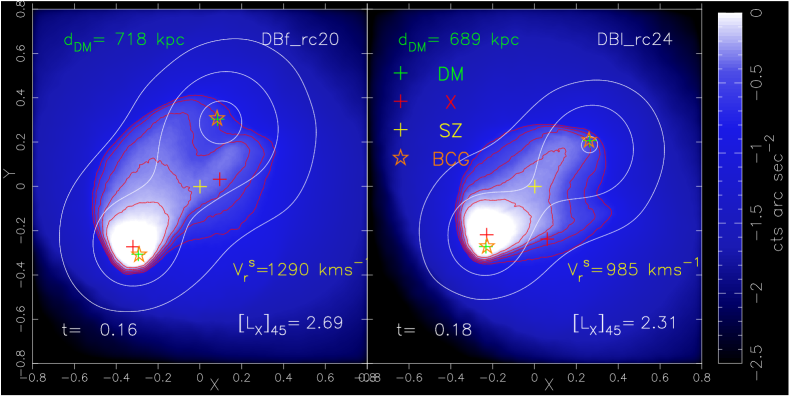
3.3 Mergers with BCGs and self-interacting DM
One of the most interesting aspects of the merging cluster El Gordo is the measured offset between the projected positions of the X-ray emission and DM centroid of the SE cluster (). As already said in the Introduction, the relative position of the X-ray peak with respect to the mass distribution is in contrast with what is expected from dissipative arguments. Moreover, nonzero offsets are also measured (Kim et al. 2021) between the BCG to DM centroid () and the BCG to X-ray peak () centroid.
According to the “central galaxy paradigm” (van den Bosch et al. 2005), BCGs are expected to reside at the center of the DM halo, thus tracing the bottom of the potential. In their simulation study, Martel et al. (2014) concluded that the paradigm is statistically satisfied, but that exceptions are common. From a large survey () Zitrin et al. (2012) found a relatively small mean offset () between the BCG and DM cluster centroids. More recently, Depropis et al. (2021) showed that a significant fraction of BCGs are offset from the X-ray centroid, but are still aligned with the mass distribution.
In order to investigate the impact of a massive merging cluster like El Gordo on the central galaxy paradigm (i.e., that the BCGs are located at the cluster centers), we re-simulated two of the fiducial models outlined in Section 3.1. We chose fiducial models Bf_rc20 and Bl_rc24, whose simulation results produced the best fitting to the data overall and which have a mass of the primary that brackets the observational range.
Our new models are designated DBf_rc20 and DBl_rc24. The initial condition setup is the same as that of their respective model in Section 3.1, but each cluster now has a stellar mass component added to its initial mass distribution. A numerical realization of the star density profiles that are supposed to represent the BCGs is described in Section 2.2.3. The stellar masses of the primary and secondary cluster that we obtain from Equation (14) are and , respectively. Table 6 lists the main merger parameters of the two models.
Figure 10 shows the mock X-ray images extracted from the two runs at the simulation time identified as the present epoch. It is easily seen that adding a BCG stellar component to the two clusters does not modify in any way the X-ray morphology of the mergers. The two X-ray maps are very similar to the corresponding maps shown in the Bf_rc20 and Bl_rc24 panels of Figure 2 and Figure 4, respectively.
About the dynamics of the BCGs two important results emerge from Figure 10. The first concerns the measured velocity offsets along the line of sight between the two BCGs of each merger model. As can be seen from Figure 7, these values are, relatively speaking, very close to the velocities extracted from the DM particle velocities of the corresponding model without a star component. This confirms that in a collisionless DM merging scenario the BCG star velocities can be assumed to be a fair proxy for the DM particle velocities.
The other important result is that the mass centroids of the BCGs appear to be strictly aligned with their corresponding DM mass centroids. This indicates that the off-center positions of the BCGs that we observe today were not generated by the merging process during the cluster collision. According to Martel et al. (2014) the spatial offset between the BCG mass centroid and that of its parent cluster is produced in major cluster mergers, as a result of the collisions. If at the cluster has reached an equilibrium configuration, the BCG will have settled at the bottom of the potential and its off-center location will be much reduced or even absent. We return to the likelihood of such a scenario for the merging cluster El Gordo in the conclusions.
An alternative scenario that could explain the observed spatial offsets between the different mass components involves SIDM that is self-interacting, these signatures being a characteristic of SIDM in major mergers. These expected properties have led many authors to investigate cluster collisions in an SIDM framework (Markevitch et al. 2004; Kahlhoefer et al. 2014; Kim et al. 2017; Robertson et al. 2017, 2019; ZuHone et al. 2019; Fisher et al. 2022).
We investigate here the possible outcomes of SIDM cluster mergers, using the implementation of the SIDM modeling described in Section 2.3. We performed SIDM merging simulations for each of the two merger models of Figure 10, and we generically refer to these models as XDBf_rc20 and XDBl_rc24, respectively. Three SIDM simulations were carried out for each model, with the SIDM cross-section assuming the following values: and , respectively. In Table 6, we list all models with their respective initial merger parameters.
The mock X-ray maps extracted from the SIDM runs are presented in Figure 11; the top panels are for model XDBf_rc20 and the bottom panels for model XDBl_rc24. We also considered SIDM simulations with , but the results are almost indistinguishable from the standard CDM mergers and are not shown here.
A first important conclusion to be drawn from the maps of Figure 11 concerns the behavior of the X-ray gas morphology. In an SIDM scenario the interaction of DM leads to an exchange of energy between the two clusters during the collision, which implies the development of shallower DM potential wells for the two DM halos (Kaplinghat et al. 2016; Kim et al. 2017; ZuHone et al. 2019). This can be easily seen by contrasting the contour levels of the projected mass density: those displayed in the map of Figure 11 from the run of model XDBf_rc20 appear much rounder than those exhibited in Figure 2 by their counterparts from the standard CDM merger Bf_rc20.
The presence of shallower DM potential wells leads in turn to a reduced resiliency of the post-pericenter gas structures, which can now more easily escape from the potential wells of the original halos. As can be seen from Figure 11, this effect is present in all of the runs, but increases as gets higher and when the mass of the primary gets lower. In fact, the bottom-right panel of Figure 11 shows that for model XDBl_rc24 has entirely lost its original X-ray morphology. A complementary role in the process causing the disappearance of the post-pericenter gas structures is played by the elapsed time between the pericenter passage and the observer epoch. This time is much larger ( Gyr) than in the collisionless DM runs, and thus the X-ray structures generated during the collision are much weaker when observed or even absent (see Section 3.2).
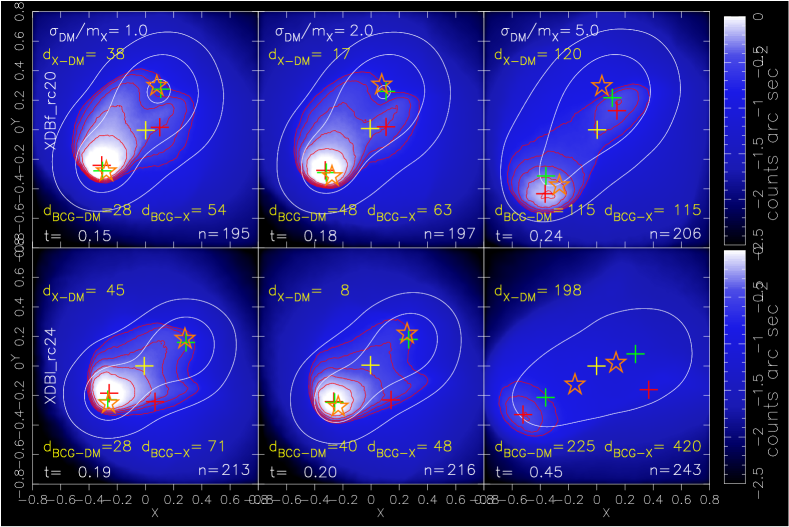
This effect can be clearly seen in the panels of Figure 11, where each panel reports the time since passing pericenter. For the XDBf_rc20 simulations (top panels) the DM scattering cross-section increases from up to , while the time has a corresponding increase from Gyr up to Gyr. For XDBl_rc24 the effect is even more pronounced, with now ranging from Gyr up to Gyr. To better illustrate the difference from the standard CDM runs of Figure 10, we also report in each panel the simulation step . From this one can recover the simulation time , at which the maps were extracted.
We attribute this increasing dependence of the elapsed time, on the DM scattering cross-section, to the mutual transfer of energy that occurs between the two DM halos during the collision. In the off-axis mergers DBf_rc20 and DBl_rc24 the DM halos remain almost unperturbed, but in the SIDM runs the exchange of energy can be significant when . As a consequence of these dissipative processes, the post-pericenter cluster bulk velocities are now strongly reduced with respect the standard CDM model. As shown below, this in turn will also impact on the BCG bulk velocities.
Another important feature that should be present when observing merging clusters in an SIDM scenario are the expected offsets between the different mass components. Because of the dissipative behavior of the DM, during the merger the collisionless galaxy component is expected to decouple from its parent DM halo (Kim et al. 2017). Moreover, the position of the X-ray peak in relation to that of the DM centroid is also expected to differ in a significant way from that found in the corresponding standard CDM merger (Tulin & Yu 2018).
In the mock X-ray maps of Figure 11, for each merging run we indicate in the corresponding panel the projected spatial positions of the different centroids. As in the X-ray maps of Figure 10, the red crosses indicate the positions of the X-ray peaks, while the green crosses are for the DM centroids. The orange stars refer to the centroids of the BCGs.
From the merging simulations of Figure 11, there are several noteworthy features that are clearly recognizable by looking at the relative positions of the different centroids. As expected, the positions of the BCG centroids are now decoupled from those of their parent DM halos. Moreover, for the SE cluster the position of the X-ray peak is highly significant. For the standard CDM mergers of Figure 10 the DM peak is located farther away from the barycentre than the X-ray centroid, and the relative offset is negative. For the SIDM merging simulations of Figure 11 the relative separation between the two peaks initially decreases as increases, and becomes positive for . For these runs the X-ray centroid is no longer lagging behind the mass centroid but is now clearly ahead of it.
| Model | ||||||||
|---|---|---|---|---|---|---|---|---|
| XDBf_sa | 9.5 | 406 | 1.7 | 5 | (0.12,0.12) | |||
| XDBf_sb | 9.5 | 290 | 2.4 | 4 | (0.12,0.14) |
Notes. a Columns from left to right: ID of the merging model, stellar mass of the BCG of the primary, the same mass but for the secondary, number of star particles for the primary, gravitational softening length of the star particles, gas core radius of the primary, dimensionless parameter , SIDM cross-section per unit mass, primary and secondary cluster gas mass fractions at . For the two SIDM merger models the collision parameters are those of model Bf in Table 1: .
For the same value of , the relative separations between the different centroids should be smaller in model XDBl_rc24 than in model XDBf_rc20, the collision velocity being smaller () in the former than in the latter (). Leaving aside the runs, for which this dependence is too weak to be detected, the two merging simulations with (middle panels of Figure 11) effectively reproduce this behavior.
However, for the merging runs with the separations between the centroids of model XDBl_rc24 are much larger that those of model XDBf_rc20. We argue that this discrepancy is due to an observational effect, with the elapsed time, being much larger in model XDBl_rc24 ( Gyr) than in model XDBf_rc20 ( Gyr).
The same time difference is responsible of another noteworthy feature of model XDBl_rc24 with . From the bottom-right panel of Figure 11 it can be seen that this run exhibits negative BCG-DM offsets, that is, the DM peaks are farther from the barycentre than the BCGs.
As the clusters collide, the DM particles will lose momentum through scatterings. The resultant drag force will lead to a deceleration of the DM halos and in turn to positive offsets between the DM and galaxy components (Markevitch et al. 2004; Kim et al. 2017; Robertson et al. 2017; Fisher et al. 2021, 2022). However, this description applies only in proximity of the first pericenter passage. At later times the gravitational pull of a DM halo will act on the corresponding galaxy component as a restoring force, which will thus decelerate and reduce its bulk motion (Harvey et al. 2014).
According to the relative strength of the DM cross-section and the elapsed time t, from initially positive the BCG-DM offsets can then become negative, as seen in the bottom-right panel of Figure 11 for model XDBl_rc24. These behaviors are in line with what is expected in a merging SIDM scenario, due to the general nonlinear dependence on of the relative distance between the DM centroid and that of the other mass components.
A significant conclusion that can be drawn from these findings is that model XDBf_rc20 with is the only merging simulation that is able produce relative separations within the observational range (). The validity of such a conclusion being clearly dependent on the statistical significance of the size of the observed offsets for the El Gordo cluster, we will come back later to this issue.
As a consequence of this conclusion, the SIDM model adopted here to simulate the merging cluster El Gordo has no free parameters. The only admitted values for the DM scattering cross-section are in the range . The reason for this limitation in SIDM merging simulations of the cluster El Gordo is that the relative separations between the centroids of the different mass components are locked to the distance between the DM mass centroids, which fixes the present epoch through the constraint .
This is made clear by the middle panels of Figure 11, where for both models exhibit a relative separation between the different centroids of about , at approximately the same epoch . However, for only model XDBf_rc20 is able to reproduce the requested observational range for the relative separations, while model XDBl_rc24 completely fails to match the data. This behavior as is due to the relative impact of DM collisions, which is much higher in model XDBl_rc24 than in XDBf_rc20. As previously explained, for model XDBl_rc24 this value in turn implies lower post-pericenter DM bulk velocities and a much higher elapsed time . We note that these conclusions also work in the other direction: for SIDM merging simulations of the El Gordo cluster, the best agreement with data is obtained only for a primary mass of about .
Motivated by these results, we now turn our attention to the SIDM merging simulation of model XDBf_rc20 with , which from the top-right panel of Figure 11 appears as the only viable candidate able to reproduce many observational properties of the cluster El Gordo. From the contour levels of the surface mass density (see the caption of Figure 1), we estimate for the SE cluster of this model a peak value of the projected DM mass surface density of about . The cluster’s scattering depth is then , which is marginally above the optically thick limit (Markevitch et al. 2004). However, this is a peak value. By using an average, one would obtain a lower value for .
As already outlined, for this merging run the DM potential wells of the two halos are strongly perturbed by the presence of SIDM. The top-right panels of Figure 11 demonstrate that with respect the standard CDM merging simulation DBf_rc20, the impact of SIDM on the post-pericenter X-ray structures is significant when .
We are then forced to reconsider the original initial condition parameters of the two baryonic halos of model Bf_rc20, in order to reproduce in a SIDM merging simulation the observed twin-tailed X-ray morphology of the El Gordo cluster. The initial collision parameters of this simulation are those of model Bf in Table 1: .
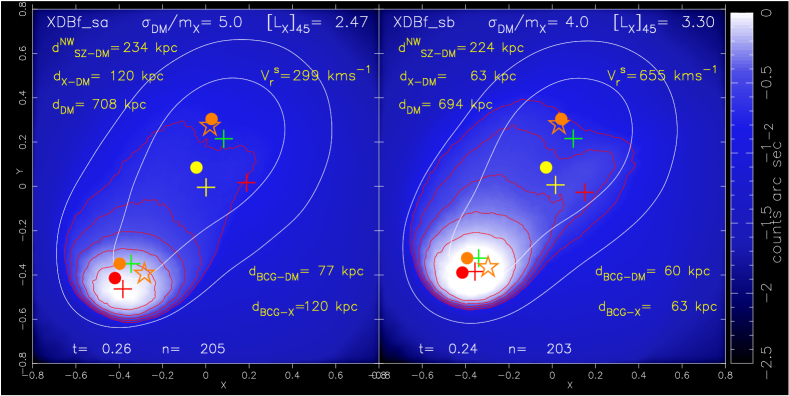
For this set of initial collision parameters we performed SIDM merger simulations for runs with both and . We found that in order to produce realistic X-ray morphologies with these simulations, initial conditions with larger cluster gas fractions and gas core radii of the primary are required than for standard CDM runs.
For the SIDM merging run it was found after some testing that the best results are obtained for and cluster gas fractions . We label this model as XDBf_sa. Similarly, for the simulation it was found that and are the optimal settings to match the observed X-ray morphology. We label this model as XDBf_sb. We report in Table 7 the most relevant initial merger parameters of the two models; in both cases the initial gas density profile of the secondary is the same as in the standard CDM runs. Figure 12 shows the mock X-ray maps extracted from these two SIDM merger simulations.
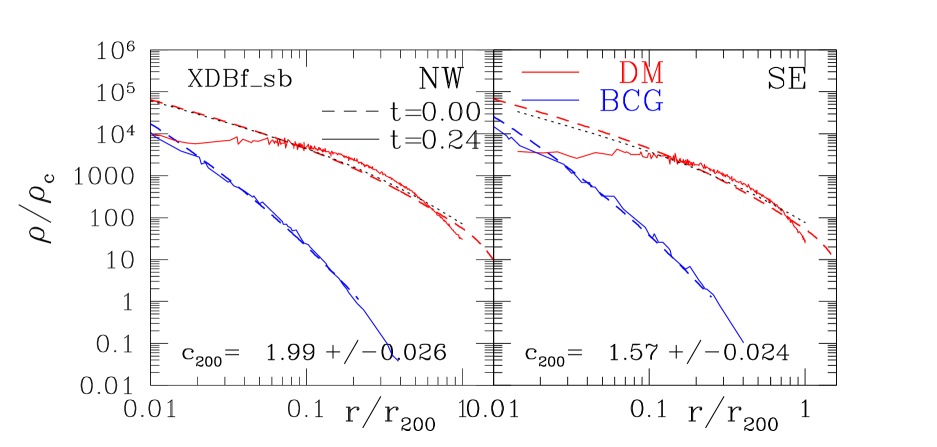
For the two merging clusters, a specific signature of SIDM is the expected offsets of their DM centroids from those of the other cluster mass components. For this reason, in each panel of Figure 12 we report for each simulation the relative distance between the different centroids.
Specifically, for the SE cluster we indicate the distance of the BCG to the DM centroid (), the BCG to the X-ray peak () and the DM to the X-ray peak (). For the NW cluster we report only the distance of the SZ to the DM centroid (), but not that of the DM to the X-ray peak because the gas structure of the primary was destroyed during the collision.
In order to assess how well the SIDM simulations can reproduce the observed offsets, we also show in Figure 12 the measured positions of the different centroids. Data points are extracted from the two panels of Figure 6 of Kim et al. (2021), the top (bottom) panel is for the NW (SE) cluster. For the sake of comparison we report here for the two clusters the relative location of several peaks, as measured with respect the positions of the cluster mass centroids. For the SE cluster the measured relative positions are : and ; while for the NW cluster: and .
The NW cluster does not possess a BCG, but its galaxy number density peak shows a large offset with respect the mass centroid position (Jee et al. 2014). With the notation we then indicate the relative position of the galaxy number peak as shown in the top panel of Figure 6 of Kim et al. (2021). The measured relative offsets are indicated in Figure 12 with filled circles, their positions are with respect that of the DM centroids and in accordance with the adopted cosmology we set the spatial conversion of angular coordinates to .
The absence of observational errors for the measured offsets is clearly a critical issue in order to set constraints on DM cross-sections as well as to rule out the null hypothesis of zero offsets. According to Kim et al. (2021), the statistical significance of the X-ray peak offset from the SE mass centroid is at level. Similarly, the galaxy number density peak is offset from the NW (SE) mass centroid at () level. The statistical significance of the SZ peak offset from the NW mass peak is at level, although Kim et al. (2021) caution that the interpretation of this offset is complicated by the low angular resolution of the beam size (). Overall, these thresholds allow us to exclude with high significance zero size offsets.
For the two SIDM merging simulations the X-ray maps of Figure 12 show the spatial locations of the different centroids, as extracted from the simulations. Their relative positions constitute one of the most interesting results of our study, and we suggest that these findings pose a severe challenge to the collisionless standard CDM model.
As already outlined, the most striking feature is the position for the SE cluster of the X-ray peak, which is now leading the DM mass centroid. Moreover, the relative distance between the two centroids varies from () up to (). The agreement of this range of values with the measured offset can be considered significant, given the observational uncertainties (see below).
The offset of the SZ peak is similarly affected in an SIDM merging scenario. For the standard CDM merging simulations of Figure 10, the distance of the SZ peak from the NW DM centroid is about . This value is similar to that found by ZYL15 for their model B and higher than the measured value of about (Jee et al. 2014). However, for the SIDM simulations of Figure 12 this distance is now reduced to , in better agreement with the data.
Another important result that follows from an SIDM scenario in major cluster mergers is the expected presence of BCG-DM offsets, with BCG centroids that exhibit miscentred positions with respect to the centers of their parent DM halos. Figure 12 shows that according to value of , the BCG-DM offsets for the SE cluster lie in the range , which agrees fairly well with the observed offset of about . We note that for the NW cluster, the position of the simulated BCG strictly coincides with that of the observed peak galaxy number density.
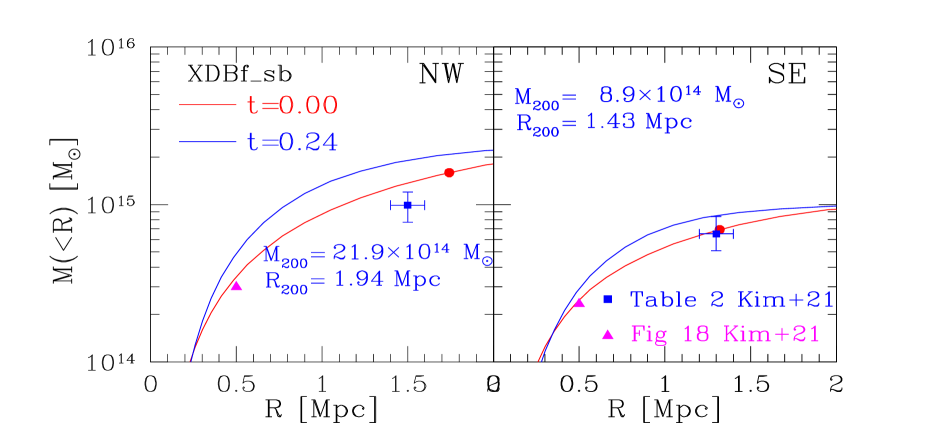
In SIDM mergers, positive BCG-DM offsets are expected after the first pericenter passage. This effect can be interpreted as a result of the deceleration of the DM component, this in turn is due to the exchange of energy between the DM halos that occurs during the cluster collision. As mentioned in the discussion of the results from the SIDM simulations of Figure 11, positive BCG-DM offsets are a transient phenomena. As a BCG starts to climb out of the cluster potential after the pericenter passage, it will experience a gravitational pull (Harvey et al. 2014) from the DM mass component that will reduce its forward momentum as well as the size of the offset.
This restoring force has the effect of reducing the BCG bulk velocities in the SIDM mergers of Figure 12, similarly reducing the relative mean radial velocity along the line of sight between the two SE and NW BCG components. As a result the BCG star velocities can no longer be considered a fair proxy for the DM particle velocities. This bias greatly helps reduce the discrepancy between the mean relative velocities , extracted from the DM particle velocities of the fiducial models of Section 3.1 (see Figure 7), and those estimated from galaxy-based spectroscopic measurements (Menanteau et al. 2012).
In Figure 12 the measured velocity offsets between the two BCGs are reported for the two merger models. The values of range from for up to when . These values can be contrasted with that given by Menanteau et al. (2012), who reported for the relative radial velocity of the SE cluster with respect the NW component. We therefore conclude that the SIDM merger models of the El Gordo cluster presented here, predict mean relative radial velocities between their stellar components in much better agreement with data than in the collisionless CDM cases.
Although the simulations of the two SIDM merger models are undoubtedly able to reproduce the observed offsets and the relative cluster peculiar velocity, the two X-ray maps of Figure 12 nonetheless exhibit a twin-tailed X-ray morphology much less defined than that displayed by the merger model Bf_rc20 in Figure 2. In fact, for model XDBf_sa the tails behind the secondary are almost absent.
Moreover, the X-ray emission in the outer regions behind the secondary is significantly less than in model Bf_rc20. This can be clearly seen by the location of the third contour level ( from the inside), which in the X-ray map of model Bf_rc20 (top-right panel of Figure 2) has a minimum along the line joining the two DM centroids at about from the X-ray peak of the secondary. For the merger simulation of model XDBf_sb this minimum is much less pronounced and at about from the centroid of the X-ray emission.
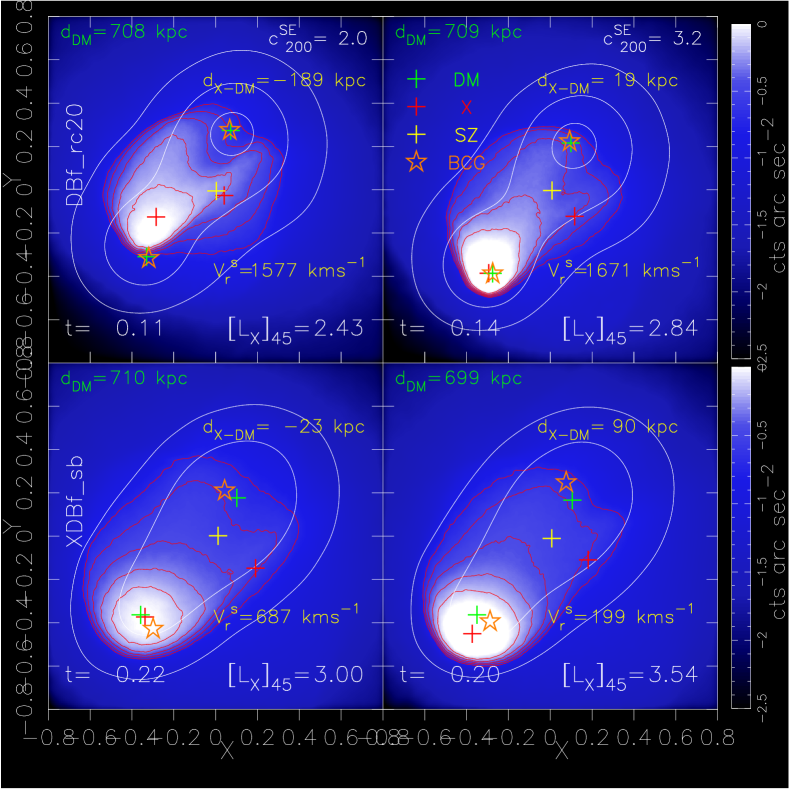
These shortcomings of the two SIDM merger models in reproducing the observed X-ray morphology are present even after the adoption of initially higher gas fractions and of larger gas scale radii for the primary. These initial condition parameters were purposely introduced to compensate for the much weaker resiliency of the gas structures seen in the SIDM merging runs of Figure 11.
We argue that this difficulty of SIDM merging simulations in matching the observed X-ray morphology is strictly related to the complex dynamical interplay that occurs during the cluster collision between baryons and SIDM. We suggest that in order to extract from SIDM simulations X-ray maps more in agreement with observations, it is necessary to explore a much wider parameter space for the initial gas density profiles of the two clusters. The results presented here for these simulations should then be regarded as preliminary. We postpone to a future work a much more thorough study on the impact of SIDM on the X-ray morphology in cluster mergers.
Finally, one of the most significant prediction of DM collisionality is the flattening of the DM core density. It is therefore important to assess in SIDM mergers the consistency of the predicted mass distribution with observed mass profiles. The scattering rate of DM particles is higher in high-density regions, and due to the collisions between DM particles the net effect is a transfer of energy toward the inner regions. This effect is evident from the left panel of Figure 18, in which for different values of are shown at Gyr the density profiles of an isolated SIDM halo. As predicted, the flattening of density at inner radii is higher as increases.
The development of flatter DM density profiles is however expected to be significantly increased in SIDM cluster mergers. This is because the scattering probability (19) depends on the relative velocity between DM particles. At the pericenter the relative velocity between the two clusters can be as high as , and this in turn implies much higher scattering rates than in the case of an isolated halo.
To explicitely verify this expectation, Figure 13 shows for our model XDB_sb the DM radial density profiles of each cluster. For the sake of comparison these are depicted at the beginning of the simulation and after the core passage, at the observer epoch Gyr. Additionally, at the same epochs we also show the density profiles of the BCG stellar component for the corresponding cluster. The profiles of the NW and SE cluster are plotted separately in the left and right panel, respectively.
As expected, after the core passage the inner density profile of the two DM halos exhibits a significant flattening toward the cluster center. Accordingly, for both of the DM density profiles we now find a core radius of approximately . It is interesting to make a comparison against observational estimates of the concentration parameters, as obtained by fitting the density profiles of each DM halo using an NFW model. We refer to Duffy et al. (2008) for a description of the adopted fitting procedure. From the best fit of each halo we obtain for the concentration parameters and their formal statistical errors and for the NW and SE cluster, respectively.
From their WL study on El Gordo cluster, in their Table 2 Kim et al. (2021) report for the two clusters and . For the NW cluster the observational estimate of the concentration parameter is marginally consistent at level with the best fit value , as extracted from the SIDM merger simulation XDBf_sb. On the contrary, for the SE cluster the estimate of Kim et al. (2021) is significantly higher than the best fit parameter predicted by our SIDM merger simulation.
The reason for such a large difference is in the adopted initial conditions of our merger simulations. For the SE cluster the initial value of the concentration parameter is predicted by the Duffy et al. (2008) relationship (5), and it was used in the merger simulations performed here to set up the initial conditions of the SE DM halo.
For the SE cluster this then implies that our initial setting of is much lower and marginally consistent, within the quoted uncertainties, with the observational estimate of the DM halo concentration parameter. Therefore, it is not surprising that we find such a discrepancy between the value of and the best fit value extracted from the SIDM merger simulation XDBf_sb.
However, the presence of such a discrepancy should not be considered particularly significant. As pointed out by Kim et al. (2021), estimates of the concentration parameters are poorly constrained due to their low sensitivity to the lensing signal; moreover, the relation (5) has been derived by averages from a simulation ensemble of DM halos, so its application to a post-collision system such as El Gordo should be considered with caution.
Additionally, in each panel of Figure 13 we also show the BCG density profile of the corresponding cluster. The radial profile of each BCG is plotted at the present epoch (solid blue lines) and at (dashed blue line). We can see that for both of the halos the two profiles exhibit very small differences, thus showing that the internal star distribution of the BCGs remains relatively unperturbed during the collision.
It is important to note that the profiles are centered on the mass centroids of the BCGs when they are calculated, so the location of their origin varies with time and a meaningful comparison between the BCG and DM density profiles can only be performed at . Using a sample of seven, massive, relaxed galaxy clusters Newman et al. (2013) showed that in cluster central regions () the star mass component becomes dominant.
There would therefore be a disagreement between these findings and the behavior at of the radial density profiles of the two mass components. For each halo, Figure 13 shows that at the star density is lower than by a factor of . This discrepancy is partly due to a resolution effect, the effective radius of Section 2.2.3 being set to . Moreover, the profiles of Figure 13 are presented in the chosen radial range of , at the spatial resolution limit of the star density is found to be higher than the DM density: .
A more meaningful comparison can be made between the cumulative total mass profiles of the two clusters as obtained from our merger simulation XDBf_sb, against those found by the lensing reconstruction of the El Gordo cluster mass profiles. For the NW and SE cluster Figure 18 of Kim et al. (2021) shows separately the total halo mass with a given radius, these profiles can be contrasted with the corresponding ones extracted from simulation XDBf_sb and plotted in Figure 14. A visual comparison between the two Figures overall shows that for each cluster the corresponding mass profiles exhibit approximately the same radial behavior. However, at large radii the mass profile of the NW cluster recovered from lensing data is not described well by the corresponding profile extracted from the simulation, which tends to be systematically higher by about a factor of .
To be more quantitative in each panel we quote the values of and , as determined according to Equation (3) from the cumulative mass profile of the cluster at the redshift . These values can be compared with the corresponding mass estimates of Kim et al. (2021): and for the NW and SE cluster, respectively.
From the right panel of Figure 14 it can be seen that the mass of the NW cluster is a factor of higher than the corresponding lensing mass estimate . This is not surprising, as the initial mass of the primary of model XDB_sb was set to because its collision parameters are the same of model Bf_rc20. According to the findings of Section 3.1.2, this is the fiducial models that best matches the observations. The collision parameters of this model (see Table 7) have been therefore specifically chosen to perform the SIDM merger simulations of Figure 12.
For the SE cluster we find , marginally inconsistent at level with the estimate . This mild tension is easily understood to originate from the assumed initial masses for the two colliding clusters. From Figure 14 the present cluster masses at are found to be higher by a factor of compared to their initial values. This is due to the flattening of the DM inner density profiles during the merger, and at the present epoch this in turn leads to an average higher DM density at large cluster radii. For the SE cluster initially and ; however due the presence of cored DM profiles after the core passage, Equation (3) is now solved for and .
These discrepancies between the mass profiles tend to become less severe at inner radii. We chose as the minimum cluster radius at which the cluster mass profiles of Figure 18 (Kim et al. 2021) start to appreciably diverge. The masses of the NW and SE cluster at this radius are then estimated to be about and , respectively.
These masses are indicated in the corresponding panels of Figure 14 with magenta triangles. For the NW cluster the difference between the cluster mass , as extrapolated from the mass profile of the simulation, and is still significant. However, for the SE cluster the accord between and is now much better.
We then conclude that present data do not allow us to firmly rule out the presence of cored DM profiles in the El Gordo cluster. Moreover, we argue that these differences between the predicted and reconstructed mass profiles can be interpreted in terms of the adopted initial conditions for model XDB_sb. For instance, we suggest that setting the initial mass of the secondary for the merger model XDB_sb to approximately less than the initial adopted value of will provide, for the SE cluster, a mass profile in better agreement with observational estimates.
However, it must be stressed that WL-based cluster mass measurements (see Umetsu 2020, and references cited therein ) are subject to a number of uncertainties. To break the mass-sheet degeneracy (Umetsu 2020) cluster masses must be estimated by assuming a specific mass profile, such as an NFW. In a recent paper, Lee et al. (2023) showed that in major cluster mergers () departure from the assumed mass profile can be significant and the subsequent WL mass bias can be as high as . They conclude that in massive mergers previous WL mass estimates can be significantly overestimated.
Nonetheless, we suggest that in the case of El Gordo cluster such a large range of mass uncertainties should be taken with some caution. This is motivated by recent, independently based, SL mass estimates. Kim et al. (2021) found a WL total mass estimate of for the El Gordo cluster, this is roughly in the same range as the corresponding mass estimates derived for El Gordo cluster from recent SL analyses (Caminha et al. 2023; Diego et al. 2023).
3.4 Testing the dependence of the X-ray to DM peak offset on the initial halo concentration and gas density profile of the SE cluster
As we have seen in Section 3.2, a returning scenario fails in reproducing the observed displacement of the X-ray peak from the SE mass centroid. On the contrary, the results of the previous Section demonstrate that a collisional DM scenario can naturally account for the observed offset. The size at the observer epoch of the observed offset depends however on a number of additional factors that can complicate the interpretation of in terms of an SIDM scenario.
The first physical effect during the merger that can have a significant impact on the motion of the cool core of the secondary is the depth of the potential well of the hosting DM halo. An initially shallower inner DM density profile will in turn lead to a less deep potential in the cluster inner regions, thereby easing the motion of the SE cool-core during the cluster merger.
In order to assess the impact of a shallower DM potential on the final displacement of the SE cluster cool core, in this section we present results from merger simulations with initial condition setups identical to those of previous runs, but with different values of the initial halo concentration parameter of the SE cluster. To this end, we use as reference the merger models DBf_rc20 of Figure 10 and XDBf_sb of Figure 12 . For both of these models, for the mass of the secondary one has from Tables 6 and 7 . According to Equation (5), for these simulations the initial halo concentration parameter is then set to .
For each of these two merger models, we ran two alternative simulations. The initial condition setup of these simulations is identical to that of the parent simulation; the only difference is in the initial value of the halo concentration parameter for the SE cluster. For the two simulations we set this parameter to and to , respectively. This interval of values for the concentration parameter approximately corresponds to what is predicted by the standard deviation () of the relation (Bhattacharya et al. 2014), and it was specifically chosen in order to bracket, for different shapes of the DM potential, the motion of the SE cool core during the merger.
Figure 15 shows the X-ray maps, as extracted at the observer epoch from our alternative merger simulations. We first discuss results from the two alternative simulations (top panels) of the parent merger model DBf_rc20. A striking feature that emerges from the simulation results is that the final size of the offset is heavily influenced by the shape of the density profile of the hosting DM halo. The top-left panel shows that for the DBf_rc20 run with the X-ray peak is trailing the DM centroid, with the relative offset now negative ().
This offset between the X-ray peak and the SE mass centroid was already present in the merger models DBf_rc20 of Figure 10, as expected because of the different behavior during the merger between the dissipative ICM and the collisionless DM component. However, the size of is now much larger, thus showing that for the SE cluster the motion of the cool core during the merger is very sensitive to the choice of relatively low values of . On the contrary, the top right panel of Figure 15 shows that when the size of is unaffected by the choice of and is very similar to that of the standard run.
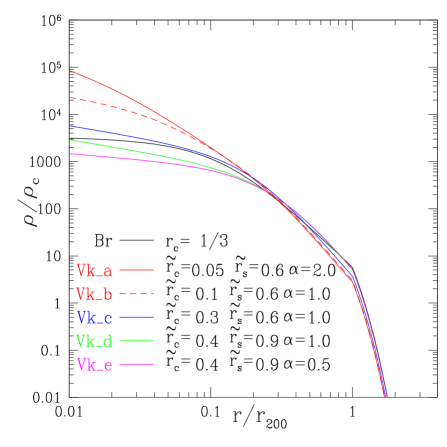
Model XDBf_sb is an SIDM merger model with , the bottom-left and bottom-right panels of Figure 15 show the X-ray maps of the corresponding and simulations, respectively. An important feature that is clearly seen from the bottom-left panel of Figure 15 is that for the simulation of model XDBf_sb the offset is now much smaller than in the corresponding DBf_rc20 run.
This behavior is the consequence of two competing effects: the easier motion of the cool core during the merger because of the shallower DM density profile (as in the BDf_rc20), and the deceleration of the DM halos (as in XDBf_sb) due to the drag force induced during the cluster collision by the scatterings of the DM particles, with the subsequent loss of momentum.
From the bottom-right panel of Figure 15, it can be seen that for the simulation of model XDBf_sb the offset is insensitive to the choice of , as in the corresponding DBf_rc20 run. We argue that for values of , the size of the final offset between the X-ray and DM peak is weakly sensitive to the form of the inner DM potential of the SE cluster.
We also conclude that these findings are not affected by observational constraints on the range of allowed values for . As previously discussed, from their WL study on El Gordo cluster Kim et al. (2021) obtained for the posteriors of the concentration parameter of the SE cluster. Their Figure 7 (bottom panel) shows that their estimate coincides approximately with . This shows that the lower limit on and the previously derived threshold have approximately the same value, thus indicating that the size of the offset is not affected by observational uncertainties for .
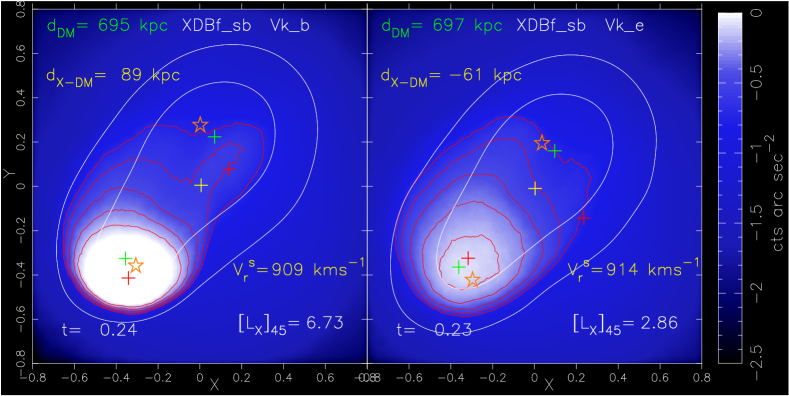
The size of the X-ray cool core is another important factor that contributes to its final displacement from the SE mass peak. As outlined in the Introduction, the simplest physical interpretation of the El Gordo merger (Menanteau et al. 2012; Jee et al. 2014) is a scenario in which the original gas core of the primary has been destroyed by the collision with the compact core of the secondary, during its motion from NW to SE. Clearly, a very dense, compact, cool core will be less prone to the ram pressure experienced during its motion through the ICM of the primary.
Following ZYL15, for the initial gas density profile of the secondary we adopted the Burkert (1995) density profile (9), and set the gas core radius to . This is a reasonable choice that has been found to reproduced fairly well the observed X-ray luminosity (see Table 4), but there are other choices as well.
We want then to study the impact on the final position of the SE cluster X-ray peak of initially different gas density profiles. To this end we used the merger model XDBf_sb as reference and we performed simulations with the same initial condition setup but with different initial gas density profiles for the SE cluster. In particular, we chose to model the gas density profile of the secondary according to the modified beta profile of Vikhlinin et al. (2006):
| (28) |
The shape of this profiles is controlled by six parameters : , thus allowing a large amount of freedom in regulating its radial behavior. Following Chadayammuri et al. (2022), we set here , and . The size of the cool core is then controlled by and , while the scale radius regulates the transition to .
To ease the comparison with previous findings (Chadayammuri et al. 2022), it is convenient to express the radii and in units of , the scale radius of the generalized “super-NFW” (sNFW) profile (Lilley et al. 2018):
| (29) |
The scale radius, can be recovered from the NFW concentration parameter according to the linear relation , where is the sNFW concentration parameter. For the SE cluster of model XDBf_sb one has , and .
Figure 16 presents for different values of the profile parameters a set of initial gas density profiles, as described by Equation (28). For the sake of comparison we also show the Burkert profile (9), previously adopted for the SE cluster in all of the merger models. In the panel, the radii and are expressed in units of and all of the profiles are consistently normalized to at .
As can be seen, the size of inner cool core region and the cuspiness of the central gas density peak can be regulated by an appropriate choice of the profile parameters and range from that of a compact cool core (model Vk_a: ) to that of an almost non-cool core (model Vk_e: ). This dependence of the radial profile behavior on the set of parameters can be compared with similar plots shown in Figure 12 (left panel) of Chadayammuri et al. (2022).
To explore the dependence of the observed offset on the initial gas density profile of the SE cluster, as for the merger models of Figure 15 we ran two alternative simulations of model XDBf_sb. The initial condition setup of these simulations is identical to that of the parent simulation, the only difference being now in the choice of initial gas density profile for the SE cluster.
In order to bracket a plausible range for the compactness of the cool core, for the two alternative simulations we chose to model the gas density profile of the secondary according to models Vk_b and Vk_e of Figure 16, respectively. The X-ray maps extracted from these two alternative merger simulations are shown in Figure 17.
For model Vk_b the left panel of Figure 17 shows a offset nearly identical () to that of the parent simulation XDBf_sb of Figure 12. This demonstrates that, above a certain threshold, the size of the final offset of the X-ray peak with respect to the DM centroid can be considered insensitive to the cuspiness of the SE cluster inner gas density. On the other hand, it worth noting that for this model the X-ray luminosity () is now higher by a factor of with respect the corresponding observational range as reported in Table 4.
For model Vk_e (right panel of Figure 17), the offset is now negative (), with the X-ray peak now trailing the DM centroid. We interpret this behavior as a consequence of the much less compact gas density peak with respect that of model Vk_b, this implying a larger ram pressure force, and in turn a larger deceleration, experienced by the secondary’s cool core during the cluster collision (Ricker & Sarazin 2001; Poole et al. 2006, 2008; Mitchell et al. 2009).
To summarize, our results demonstrate that both the halo concentration parameter and the initial shape of the gas density profile of the SE cluster have an impact on the offset of the X-ray peak relative to that of the DM. We found that both of these dependences could act to reduce the offset size, but are however unable to increase it above the observational estimate.
Our conclusion is therefore that the interpretation of the observed offset between the X-ray peak and the DM centroid in an SIDM scenario remains valid. The alternative configurations of the initial condition setup analyzed here for the SE cluster are found to be ineffective in increasing the size of the offset.
Finally, it can be seen from Figure 17 that very compact cool core gas density profiles can produce offsets in good accord with the measured value, but they fail to account for the observed X-ray luminosity. This strongly suggests that the previous used Burkert profile (9), with the gas core radius set to , can be considered a good approximation to the gas density profile of the SE cluster.
4 Summary and conclusions
We have constructed a large set of N-body/hydrodynamical binary cluster merger simulations aimed at studying the merging cluster El Gordo. Specifically, the main goal of this paper is to assess whether it is possible for merger simulations to reproduce the observed twin-tailed X-ray morphology while satisfying other observational constraints.
To this end, we considered a wide range of initial conditions, performing both off-axis and head-on merging runs. The initial conditions of the binary merging clusters were constrained to be consistent with recent lensing-based mass measurements (Diego et al. 2020; Kim et al. 2021). We imposed the following range of values for the mass of the primary: . A summary of our main results is as follows:
(i) The observed twin-tailed X-ray morphology, as well as other observational constraints, are well matched by the off-center fiducial merger models Bf_rc20, Bg_rc20, and Bl_rc24 (Section 3.1), which have collision velocities and impact parameters in the range and , respectively.
These findings demonstrate that in simulations with cluster masses lower than previously considered (Donnert 2014; Molnar & Broadhurst 2015; Zhang et al. 2015, 2018), it is possible to consistently reproduce the observed twin-tailed X-ray morphology seen in the cluster El Gordo. Finally, the observational constraints discussed in Section 3.1 tend to favor merger models with a primary mass of about .
(ii) One of the most interesting aspects of the galaxy cluster El Gordo is the odd location in the SE cluster of the X-ray peak, which in the outgoing scenario seems to be ahead of the DM lensing peak. To resolve this issue, a returning scenario was invoked (Ng et al. 2015) in which the merging cluster is observed in a post-apocenter phase and the X-ray peak is trailing the DM peak.
This scenario was extensively investigated (Section 3.2). We constructed a large set of head-on merging collisions aimed at reproducing the observed twin-tailed X-ray morphology of the El Gordo cluster. For the adopted initial collision parameter space, the results shown in Figure 9 demonstrate that a returning scenario should be considered untenable, as the morphology of all of the X-ray maps extracted from the simulations appears inconsistent with the observed X-ray morphology. We argue in Section 3.2 that this behavior is strictly related to the lifetime of the post-pericenter X-ray structures, which turned out to be much less than the elapsed time needed for the DM component of the SE cluster to reach the apocenter and return.
We conclude that the likelihood of head-on collisions matching the observational constraints for the merging cluster El Gordo is very low, given the wide range of initial merging parameter space that has been considered.
(iii) We re-simulated two of the fiducial models (Bf_rc20 and Bl_rc24) by adding a star particle distribution to the initial mass components of each of the two halos, with the purpose of representing the BCG’s mass contribution to the initial halo profiles. The resulting images for these two runs (models DBf_rc20 and DBl_rc24) are shown in Figure 10. The positions of the centroids of the different mass components clearly indicate that, in both of the mergers, the collision between the two clusters has not produced any appreciable offset between the positions of the BCG centroids relative to that of the DM halos.
In a collisionless CDM scenario, this leaves us with the problem of explaining the presence and magnitude of the BCG to DM offset seen in the El Gordo cluster. It must be emphasized that galaxy-DM and BCG-DM offsets are relatively rare but have been measured in other merging clusters (see, for example, Table 2 of Kim et al. 2017).
According to Martel et al. (2014), such offsets are produced as a result of violent cluster collisions that strongly perturb the clusters and leave them in a non-equilibrium state, with the BCGs being displaced from the cluster centers. While in principle this scenario cannot be ruled out as an explanation of the observed BCG to DM offset seen for the El Gordo SE cluster, we nonetheless argue that it appears difficult for the gas structure of the SE cluster to maintain its integrity after a cluster collision that must be at the same time violent enough to move the BCG from its original position.
Finally, it should be emphasized that the observed BCG to DM offset constitutes another serious shortcoming for the returning scenario: as shown by the simulations presented in Figure 10, this offset would remain unexplained in such a scenario.
(iv) Motivated by these findings, we studied the results extracted from SIDM simulations of the El Gordo cluster, in which DM interactions are described by a simple model with a velocity-independent elastic DM cross-section (Section 3.3).
The most important striking feature that emerges from the SIDM merging models of the El Gordo cluster is that the observed offsets between the different mass components are well reproduced by the simulations XDBf_sa and XDBf_sb (Table 7). These simulations have a DM cross-section in the range and initial collision parameters of model Bf_rc20 (Table 2).
Another significant aspect of these merger models is the value of the mean relative line-of-sight radial velocity between the two BCGs, which in contrast with previous runs (see Figure 7) is now on the order of several hundred and in much better agreement with data. As discussed in Section 3.3, this is a direct consequence of the gravitational pull experienced by the two BCGs because of the dissipative interactions now present between the two DM halos.
Although these models are not able to reproduce the observed X-ray morphology as well as in the standard CDM runs (Section 3.1), we nonetheless argue that these findings provide significant support for the possibility that the DM behavior in the El Gordo cluster exhibits collisional properties. Additionally, it must be stressed that a significant advantage of the SIDM merging models is that they offer a natural explanation for all of the observed offsets, while in the standard CDM scenario the observed separations between the different centroids remain either unexplained (X-ray peak to DM) or fraught with difficulties (BCG to DM).
From these conclusions follow two main consequences that need to be discussed. The first is that the two SIDM models of Table 7 do not admit free parameters; the observed offsets are well reproduced only for a DM scattering cross-section in the range and initial collision parameters given by model Bf_rc20. This is a direct result of the post-pericenter evolution in an SIDM scenario, for which the observed separations between the different centroids are locked to the measured distance, , between the DM mass centroids, which must be about at the present epoch.
As a result, these observational constraints cannot be satisfied by simply rescaling the value of , if one assumes masses for the merging cluster lower than those in model Bf_rc20: . This value of the primary’s mass is higher than that obtained from recent lensing-based estimates (see Table 2 of Kim et al. 2021), but still within the confidence limits. If more accurate measurements were to yield tighter limits, the SIDM merger models presented here would clearly be in jeopardy.
The other striking feature of the SIDM merger models XDBf_sa and XDBf_sb is that the best match to the data is obtained only for values of in the very narrow range between and . Such values are strongly excluded by the present upper limits on the SIDM cross-section, which on galaxy cluster scales have been derived independently by various authors (Robertson et al. 2017, 2019; Kim et al. 2017; Wittman et al. 2018; Harvey et al. 2019; Shen et al. 2022; Cross et al. 2023). These upper limits are at best of order unity (), although Wittman et al. (2018) claim that the constraint can be relaxed up to by properly averaging galaxy-DM offsets in a sample of merging clusters.
For example, in the case of the Bullet Cluster, the absence, within the observational errors on the centroid positions, of an observed galaxy-DM separation (, Randall et al. 2008) has been used in SIDM merging simulations (Markevitch et al. 2004; Randall et al. 2008; Robertson et al. 2017) to constrain the allowed values of the DM cross-section to lie below . This evidently implies that an SIDM merging simulation of the Bullet Cluster, with the values derived here for the DM cross-section (), would lead to simulation results clearly incompatible with the observational constraints.
However, the difficulty of quantitatively assessing the statistical significance of the above findings must be emphasized. This is because of the absence of observational errors for the various offsets derived from Figure 6 of Kim et al. (2021).
Kim et al. (2017) present a set of SIDM merging simulations of equal-mass massive clusters, with masses on the order of . They compared the expected galaxy-DM offsets from the SIDM simulations against measured galaxy-DM offsets in observed mergers. The authors were able to derive an upper limit on the galaxy-DM offset of for , in accordance with the range of the spatial separations shown in the left panels of Figure 11 for the simulations. As noticed by the authors, these bounds are an order of magnitude smaller than the measured offsets for these merging systems (), and thus in tension with their simulations. Their conclusions were, however, affected by the large observational uncertainties for the measured offsets in massive mergers of .
Nonetheless, according to Kim et al. (2021), the presence of offsets between the different mass components of the El Gordo cluster is statistically significant, which in turn implies that the null hypothesis of zero size offsets is statistically disfavored. On the other hand, is difficult to assess the statistical significance of the offset sizes we found for the merger model XDBf_sb (Figure 12) with . This indeterminacy is caused by the absence of positional errors for the various peak locations used to calculate the offsets.
In order to minimize the impact of statistical uncertainties, we now attempt to make a rough estimate of the positional errors for the offsets with the largest sizes. From the relative location of the various peaks, as extracted from Figure 6 of Kim et al. (2021), it is easily seen that the galaxy number density peak of the NW cluster is spatially offset from its parent mass centroid by about . However, for a galaxy group, the determination of the galaxy number density peak location is heavily affected by shot noise. For a group with member galaxies, Kim et al. (2017) extrapolate the expected uncertainty to .
The large offset () between the SZ emission peak and the NW mass centroid is similarly influenced by the large error in the SZ centroid estimate (; ZYL15). Moreover, for the SE cluster, the BCG-DM offset () is approximately within the range of the mass centroid uncertainty: . We crudely estimated from Kim et al. (2021); according to the authors, a uncertainty in the position of the mass centroids corresponds to ( at ).
The size of positional errors for the X-ray emission peak of the SE cluster is expected to be less significant than for the other centroids, due to the squared dependence of the X-ray emission with the gas density. These errors are quantified according to the observational procedure adopted to process the raw X-ray images and to extract the positions of substructures in the X-ray emission, together with the relative errors. In the case of El Gordo, the effective positional error of the X-ray peak is relatively small and set by the angular resolution () of the Chandra X-ray image222J. Kim: private communication.
The uncertainty in the size of the observed offset between the X-ray and the SE mass peak is then dominated by the uncertainty in the position of the mass peak; this allows us to place the offset in the range . An important result that follows from this finding is that SIDM merger simulations of the El Gordo cluster with are marginally inconsistent with the observed offset, . As can be seen from the maps of Figure 11, for these models the offset of the X-ray peak is always limited to . In the following we thus adopt the view that the estimated offset sizes for the El Gordo cluster are in the closest agreement with SIDM merger simulations for values of the DM cross-section in the range .
To resolve the inconsistency between this range of values for and its current upper limits on cluster scales (), we suggest that the SIDM model proposed so far should only be considered a first-order approximation to the modeling of the physical processes describing DM interaction. Specifically, we argue that the capacity of DM to exhibit collisional properties during a cluster merger is correlated with some other feature of the collision itself.
A simple logical choice to explain this behavior of DM during the mergers is that the DM collisional properties are not always present, but are switched on in accordance with the energy of the cluster collisions. This clearly implies that an SIDM model based on scattering between DM particles should be regarded as a sort of low-order approximation to a much more complex physical process, in which DM interactions between the two colliding DM halos come into play according to some energy threshold, . For a merging cluster with a collisional energy below this threshold, the DM of the two halos should stay in a sort of ground state and will exhibit the usual collisionless properties during the cluster collision.
It must be stressed that such an energy behavior is completely different from the mechanism previously proposed (Kaplinghat et al. 2016), in which a power-law dependence of on the collision velocity has been postulated to satisfy its present upper limits over a wide range of scales. Such a consideration also applies to other SIDM models (Tulin & Yu 2018) in which DM particles scatter inelastically (Vogelsberger et al. 2019) or anisotropically (Robertson et al. 2017b).
To provide a viable theoretical framework for the underlying physical processes leading to such a step-like behavior for DM is beyond the scope of this work. Nonetheless, we can try to assess the validity of this hypothesis by looking at whether there is some dependence of the observed offsets on the energy of the merging system.
To validate the proposed picture, we took as reference the El Gordo cluster, for which the measured galaxy-DM and BCG-DM offsets lie in the range . The best match to the data is obtained for models XDBf_sa and XDBf_sb, which have the initial collision parameters of model Bf_rc20: , where . With these parameters we can estimate using Equation (17) the energy of the collision: .
We then compared this finding to a merging system for which no appreciable offsets have been detected between the DM and the stellar component: the Bullet Cluster. This is a well-known cluster merger that has been the subject of many numerical studies (Springel & Farrar 2007; Mastropietro & Burkert 2008; Lage & Farrar 2014, 2015; Robertson et al. 2017). We extracted the collision parameters from Table 1 (LF entry) of Lage & Farrar (2015): . According to these collision parameters, the total energy content (17) of the Bullet Cluster is .
According to our hypothesis, these simple estimates bracket the allowed values of to be approximately in the range . To further corroborate these findings, it would be interesting to verify if there are other major merger clusters that exhibit large galaxy-DM peak offsets (). If the merging clusters are as massive as El Gordo, this would clearly lend support to the idea that there is a critical energy threshold, , around the value of .
From Table 2 of Kim et al. (2017), it appears that the Sausage Cluster CIZA J2242.8+5301 at is the only merging cluster that fits these constraints, apart from El Gordo. This cluster is characterized by an elongated X-ray emission along the north–south merger axis, hence the name. The morphology is suggestive of an almost head-on collision, with spectroscopic data (Dawson et al. 2015) favoring a collision plane close to that of the sky. The total estimated mass (Jee et al. 2015) is about , with a mass ratio close to unity, and the DM centroids are separated by about .
For this cluster, Table 2 of Kim et al. (2017) reports galaxy-DM offsets between and , albeit with large uncertainties. In the context of SIDM, it should however be considered particularly indicative that, for the northern group, the galaxy centroid appears to be leading the corresponding mass peak. According to Jee et al. (2015), the detection of this offset is highly significant, while for the southern cluster the errors are relatively large.
We estimate the collision parameters of the Sausage Cluster from Jee et al. (2015): , where and is estimated from Equation (14) of Jee et al. (2015) by setting and Gyr. We can now find the energy of the merging, which turns out to be about .
This energy value is very close to that of and strongly supports the hypothesis of the existence of an energy threshold that regulates DM behavior. This implies that, during the cluster collision, DM can exhibit collisional properties according to the amount of collisional energy.
Numerical simulations of the Sausage Cluster have previously been performed (van Weeren et al. 2011; Donnert et al. 2017; Molnar & Broadhurst 2017), but without including the effect of SIDM. From the SIDM merging simulations of Kim et al. (2017), the expected galaxy-DM offset for merging clusters of is on the order of for , which is smaller than the estimated offset for the Sausage Cluster by about a factor of 10.
We argue that these inconsistencies would be solved in the SIDM scenario proposed here, and that the study of the different offsets in major cluster mergers is going to provide significant clues as to the nature of DM. In this context, SIDM merging simulations of the Sausage Cluster, in connection with the results extracted here from the SIDM runs of the El Gordo cluster, will most likely lead to meaningful insights into the modeling of DM self-interactions based on particle collisions.
Acknowledgements.
The author is grateful to Congyao Zhang for his many clarifying comments about his paper that have helped to produce this work. The author would also like to thank Jinhyub Kim for helping with Figure 12, John Miller is also acknowledged for carefully reading and improving the manuscript. The computations of this paper were carried out using the Ulisse cluster at SISSA and the Marconi cluster at CINECA (Italy), under a SISSA-CINECA agreement.Appendix A Parallel implementation of the DM scattering algorithm and code validation
We now describe the parallelization of the Monte Carlo scheme described in Section 2.3. We considered the whole set, , of the DM particles, which are distributed across the whole computational volume, . In a serial code scattering events will be sampled by applying Equation (19) to the whole set of DM particles. However, the scattering process is cumulative, so any scattering event requires knowledge from previous events. If one implements the algorithm in a serial code this condition is implicit, but with a parallel code this is not obvious.
The Monte Carlo method is then implemented as follows. We assumed that the parallel code subdivides the computation into tasks, and the simulation volume is correspondingly split into non-overlapping sub-volumes, with being the task index. The load balancing domain decomposition is done by cutting segments of a globally ordered Hilbert space-filling curve, as in the code GADGET-2 (Springel 2005).
We next evaluated the scattering probability (19) for the subset of DM particles that are members of task . If a scattering event occurs, then the tagged neighbor particle, could be a member of either or another task, ; in the latter case, the particle was imported by during the root-finding neighbor search (18). Moreover, even if is a member of the local task , it could still be a neighbor member of a particle in another task . The same applies to particle . Therefore, a blind implementation of the Monte Carlo algorithm in a parallel code could lead to the same particle being scattered two or more times with the same initial velocity.
To avoid this problem, we then proceeded as follows. We first assumed that at any given time all the scattering pairs of the tasks have been identified. For the generic pair in task , there is then the possibility that the neighbor particle is a member of another task ; otherwise, either or (or both) could be neighbors of another scattering pair in task . We now denote as all of the scattering pairs of that do not satisfy any of the above conditions (i.e., the scattering takes place entirely within task ). We then split the set of scattering pairs in task between the subset and all the other pairs, which we denote as .
To avoid multiple scatterings, it is now necessary that each task knows if a member of a scattering pair has undergone a scattering event in another task, this in order to accordingly update its velocity. To accomplish this for each pair we associate a 64 bit integer key defined as , where denotes an integer key of the local DM particle . The integer key is unique for each DM particle and it is assigned initially; it is a DM particle property that moves with the particle when this migrates between processors. The integer () must be significantly larger than ; therefore, the integers are unique for each scattering pair in the tasks.
To consistently incorporate multiple scatterings in the parallel code, we now perform a global sorting of the sets of integers , with . After the sorting each task knows the global list of sorted keys, and therefore all of the other scatterings and subsequently in which task they are taking place.
Finally, the post-scattering velocities (20) of each scattering pair in task are evaluated as follows. After the global sorting each task will process its local set of scattering pairs by looping iteratively over its local list of sorted keys, this in increasing key order because of the sorting. Pairs that exhibit a scattering dependence with are put in a waiting list until the updated velocities of particle have been received from task . We note that this implementation allows for a single particle to undergo multiple scatterings.
To improve code performances, we make use of asynchronous communications to optimize data transfer between processors. We exploit the advantage of using this communication mode by splitting the list of local pairs and by scattering a subset of these pairs whenever the task is waiting updated particle velocities from other tasks.
To test the SIDM part of the code we evolve an isolated DM NFW halo, initially at equilibrium, for different values of the SIDM cross-section. We considered the following values: and . For the DM halo, we set at , so Mpc and for the concentration parameter from Equation (5). The initial condition setup of the DM halo is described in Section 2.2.1.
For the different runs we show here at a given time the spherically averaged DM radial density profile and the scattering rate per particle . The theoretical expression of at the time is evaluated as (Robertson et al. 2015)
| (30) |
where is the local DM density and the mean pairwise velocity. Assuming a Maxwell-Boltzmann distribution this quantity can be written as (Robertson et al. 2015) , where is the 1D velocity dispersion of the NFW halo (Lokas & Mamon 2001).
To contrast the predicted rate, with the corresponding rate extracted from the simulations, we measured as follows. We first accumulated the number of scattering events as a function of radius in radial bins together with the number of particles in the same bin. At epoch , the binned scattering rate, was then obtained by dividing for each bin the number of scattering events by the number of particles. It must be stressed that during the simulations the rates are obtained by evaluating the local scattering probability (19), but without updating the particle velocities (20) of the pair. This is to avoid any modification to the DM density profile, which otherwise will make Equation (30) not applicable.
The results we obtain after Gyr are shown in Figure 18, in which for the different cases are plotted the DM density profiles (left panel) and the corresponding scattering rates (right panel). For completeness, in the left panel we also show the density profile (solid black line) of a halo without SIDM (). As expected, there is the development of cored density profiles for which at inner radii the flattening of density is higher as increases. For the considered SIDM cases, the scattering rates are in full agreement with the theoretical predictions.
The results of similar tests have been shown by various authors (Vogelsberger et al. 2012; Robertson et al. 2015, 2017; ZuHone et al. 2019; Fisher et al. 2021), we compare our density profile results with those of a similar test carried out by ZuHone et al. (2019). The authors adopt the same SIDM implementation (Vogelsberger et al. 2012) employed here and, moreover, assume the same approximations for the DM cross-section . In their Section 3.1 the authors investigate the time evolution of an isolated halo comprising gas and DM. They assume a cluster gas fraction of , we then consider dynamically negligible the impact of the gas when comparing at inner radii the different DM density profiles.
For the halo DM density profile ZuHone et al. (2019) chose an Hernquist profile with and for the cluster mass and profile scale radius, respectively. Our halo mass approximately coincides with , so our rescaled profiles can be directly compared with the corresponding ones of ZuHone et al. (2019).
Following Springel (2005) we relate the scale radius and concentration parameter of the NFW profile to the scale length of an Hernquist density profile with the same mass within :
| (31) |
For the halo parameters we used and , which is only higher than . Thus, at inner radii our profiles can be compared with the DM halo profiles displayed in top-left panel of Figure 1 of ZuHone et al. (2019). From the left panel of Figure 18 at the initial epoch () we estimate at the radius a central DM density of . For the chosen redshift () this value corresponds to , in accordance with the corresponding value estimated from Figure 1 of ZuHone et al. (2019).
We now estimate at Gyr the central value of the halo DM density for the SIDM run with . For this test from Figure 18 we obtain at the radius a central DM density of , which is equivalent to . For the same SIDM run this value is in close agreement with the corresponding DM density, estimated at the same radius and at the same epoch from Figure 1 of ZuHone et al. (2019). The results of our tests then validate our implementation of DM self-interactions, and demonstrate that the resulting code can be safely used to perform the SIDM simulations presented here.
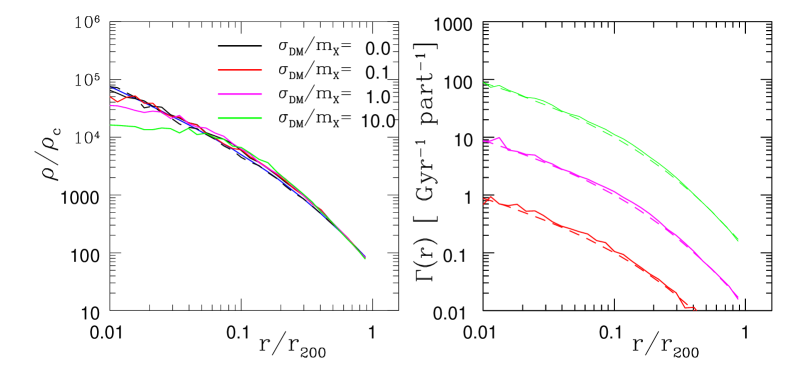
References
- Allen et al. (2008) Allen, M. G., Groves, B. A., Dopita, M. A. et al., 2008, ApJS, 178, 20
- Agertz et al. (2007) Agertz, O., Moore, B., Stadel, J. et al., 2007, MNRAS, 380, 963
- Anders & Grevesse (1989) Anders, E. & Grevesse, N., 1989 , Geochim. Cosmochim. Acta, 53, 197
- Ascasibar & Markevitch (2006) Ascasibar, Y. & Markevitch, M., 2006, ApJ, 650, 102
- Asencio et al. (2021) Asencio, E., Banik, I. & Kroupa, P., 2021, MNRAS, 500, 5249
- Asencio et al. (2023) Asencio, E., Banik, I. & Kroupa, P., 2023, ApJ, 954, 162
- Bhattacharya et al. (2014) Bhattacharya, S., Habib, S., Heitmann, K. & Vikhlinin, A., 2014, ApJ, 766, 32
- Binney & Tremaine (1987) Binney, J. & Tremaine, S., 1987, ”Galactic dynamics”, Princeton Univeristy Press
- Buote (2002) Buote, D. A., 2002, Astrophysics and Space Science Library, 272 , 79, Feretti, L., Gioia, I. M. and Giovannini, G. (eds), Kluwer Academic Publishers
- Burkert (1995) Burkert, A., 1995, ApJ, 447, L25
- Caminha et al. (2023) Caminha, G.B., Grillo, C., Rosati, P., Liu, A., Acebron, A., Bergamini, P., Caputi, K.I., Mercurio, A., Tozzi, P., Vanzella, E., Demarco, R., Frye, B., Rosani, G. & Sharon, K., 2023, A&A, 678, A3
- Canning et al. (2012) Canning, R. E. A., Russell, H. R., Hatch, N. A. et al., 2012, MNRAS, 420, 2956
- Cavaliere & Fusco-Femiano (1978) Cavaliere, A. & Fusco-Femiano, R., 1978, A&A, 70, 677
- Chadayammuri et al. (2022) Chadayammuri, U., ZuHone, J., Nulsen, P. et al., 2022, MNRAS, 509, 1201
- Clowe et al. (2006) Clowe, D., Bradač, M., Gonzalez, A. H. et al., 2006, ApJ, 648, L109
- Cross et al. (2023) Cross, D., Thoron, G., Jeltema, T. E., et al., 2023, arXiv:2304.10128
- Dawson et al. (2015) Dawson, W. A., Jee, M. J., Stroe, A. et al., 2015, ApJ, 805 143
- Dehnen & Aly (2012) Dehnen, W. & Aly, H., 2012, MNRAS, 425, 1068
- Depropis et al. (2021) De Propris, R., West, M. J., Andrade-Santos, F., et al., 2021, MNRAS, 500, 310
- Diego et al. (2020) Diego, J. M., Molnar, S. M., Cerny, C. et al., 2020, ApJ, 904, 106
- Diego et al. (2023) Diego, J.M., Meena, A.K., Adams, N.J., et al., 2023, A&A, 672, A3
- Donnert (2014) Donnert, J. M. F., 2014, MNRAS, 438, 1971
- Donnert et al. (2017) Donnert, J. M. F., Beck, A. M., Dolag, K. & Röttgering, H. J. A., 2017, MNRAS, 471, 4587
- Duffy et al. (2008) Duffy, A. R., Schaye, J., Kay, S. T. & Dalla Vecchia, C., 2008, MNRAS, 390, L64-L68
- Fisher et al. (2021) Fischer, M. S., Brüggen, M., Schmidt-Hoberg, K. et al., 2021, MNRAS, 505, 851
- Fisher et al. (2022) Fischer, M. S., Brüggen, M., Schmidt-Hoberg, K. et al., 2022, MNRAS, 510, 4080
- Fryxell et al. (2000) Fryxell, B., Olson, K., Ricker, P., Timmes, F. X., Zingale, M., Lamb, D. Q., MacNeice, P., Rosner, R., Truran, J. W. & Tufo, H., 2000 ApJS, 131, 273
- García-Senz et al. (2012) García-Senz, D., Cabezón, R. M. & Escartín, J. A., 2012, A&A, 538, A9
- Golovich et al. (2017) Golovich, N., van Weeren, R. J., Dawson, W. A., Jee, M. J. & Wittman, D., 2017, ApJ, 838, 110
- Halbesma et al. (2019) Halbesma, T. L. R., Donnert, J. M. F., de Vries, M. N. & Wise, M. W., 2019, MNRAS, 483, 3851
- Hallman et al. (2004) Hallman, E. J. & Markevitch, M. , 2004, ApJ, 610, L81
- Harvey et al. (2014) Harvey, D., Titley, E., Massey, R., et al., 2014, MNRAS, 441, 404
- Harvey et al. (2019) Harvey, D., Robertson, A., Massey, R. & McCarthy, I. G., 2019, MNRAS, 488, 1572
- Hasselfield et al. (2013) Hasselfield, M., Hilton, M. & Marriage, T., A., 2013, J. Cosmology Astropart. Phys., 7, 8
- Heinz et al. (2003) Heinz, S., Churazov, E., Forman, W., Jones, C. & Briel, U. G., 2003, MNRAS, 346, 13
- Hernquist & Katz (1989) Hernquist, L. & Katz, N., 1989 ApJS, 70, 419
- Hockney & Eastwood (1988) Hockney, R. W. & Eastwood, J. W., 1988, ”Computer simulation using particles”, Bristol: Hilger
- Itoh et al. (1998) Itoh, N., Kohyama, Y. & Nozawa, S., 1998, ApJ, 502, 7
- Jee et al. (2014) Jee, M. J., Hughes, J. P., Menanteau, F., et al., 2014, ApJ, 785, 20
- Jee et al. (2015) Jee, M. J. Stroe, A., Dawson, W., et al., 2015, ApJ, 802, 46
- Kahlhoefer et al. (2014) Kahlhoefer, F., Schmidt-Hoberg, K., Frandsen, M. T. & Sarkar, S., 2014, MNRAS, 437, 2865
- Kaplinghat et al. (2016) Kaplinghat, M., Tulin, S. & Yu, H.-B., 2016, Phys. Rev. Lett., 116, 041302
- Kazantzidis et al. (2004) Kazantzidis, S., Magorrian, J. & Moore, B., 2004, ApJ, 601, 37
- Kim et al. (2017) Kim, S. Y., Peter, A. H. G. & Wittman, D. et al., 2017, MNRAS, 469, 1414
- Kim et al. (2021) Kim, J., Jee, M. J., Hughes, J. P. et al. , 2021, ApJ, 923, 101
- Kravtsov et al. (2018) Kravtsov, A. V., Vikhlinin, A. A. &Meshcheryakov, A. V., 2018, Astronomy Letters, 44, 8
- Lage & Farrar (2014) Lage, C. & Farrar, G. R., 2014, ApJ, 787, 144
- Lage & Farrar (2015) Lage, C. & Farrar, G. R., 2015, J. Cosmology Astropart. Phys., 2015, 38
- Lee & Komatsu (2010) Lee, J. & Komatsu, E., 2010, ApJ, 718, 60
- Lee et al. (2023) Lee, W., Cha, S., Jee, M.J., Nagai, D., King, L., ZuHone, J., Chadayammuri, U., Felix, S. & Finner, K., 2023, ApJ, 945, 71
- Lilley et al. (2018) Lilley, E.J., Evans, N. W. & Sanders, J.L., 2018, MNRAS, 476, 2086
- Lindnet et al. (2014) Lindner, R. R., Baker, A. J., Hughes, J. P. et al., 2014, ApJ, 786, 49
- Lokas & Mamon (2001) Łokas, E. L. & Mamon, G. A., 2001, MNRAS, 321, 155
- Machado & Lima Neto (2013) Machado, R. E. G. & Lima Neto, G. B., 2013, MNRAS, 430, 3249
- Machado et al. (2015) Machado, R. E. G., Monteiro-Oliveira, R., Lima Neto, G. B. & Cypriano, E. S., 2015, MNRAS, 451, 3309
- Markevitch et al. (2002) Markevitch, M., Gonzalez, A. H., David, L., et al., 2002, ApJ, 567, L27
- Markevitch et al. (2004) author = Markevitch, M., Gonzalez, A. H., Clowe, D. et al., 2004, ApJ, 606, 819
- Markevitch & Vikhlinin (2007) Markevitch , M. & Vikhlinin, A., 2007 , Phys. Rep., 443, 1
- Martel et al. (2014) Martel, H., Robichaud, F. & Barai, P., 2014, ApJ, 786, 79
- Mastropietro & Burkert (2008) Mastropietro, C. & Burkert, A., 2008, MNRAS, 389, 967
- Mazzotta et al. (2004) Mazzotta, P., Rasia, E., Moscardini, L. & Tormen, G., 2004, MNRAS, 354, 10
- McCarthy et al. (2007) McCarthy, I. G., Bower, R. G., Balogh, M. L., et al., 2007, MNRAS, 376, 497
- Menanteau et al. (2010) Menanteau, F., González, J., Juin, J.-B. et al., 2010, ApJ, 723, 1523
- Menanteau et al. (2012) Menanteau, F., Hughes, J. P., Sifón, C. et al., 2012, ApJ, 748, 7
- Merritt et al. (2006) Merritt, D., Graham, A. W., Moore, B., Diemand, J. & Terzić, B., 2006, AJ, 132, 2685
- Mitchell et al. (2009) Mitchell, N. L., McCarthy, I. G., Bower, R. G., Theuns, T. & Crain, R. A., 2009 , MNRAS, 395, 180
- Molnar et al. (2012) Molnar, S. M., Hearn, N. C. & Stadel, J. G., 2012, ApJ, 748, 45
- Molnar et al. (2013) Molnar, S. M., Chiu, I.-N. T., Broadhurst, T. & Stadel, J. G., 2013, ApJ, 779, 63
- Molnar & Broadhurst (2015) Molnar, S. M. &Broadhurst, T., 2015, ApJ, 800, 37
- Molnar (2016) Molnar, S., 2016 , Front. Astr. Space Sci., 2, 7
- Molnar & Broadhurst (2017) Molnar, S. M. &Broadhurst, T., 2017, ApJ, 841, 46
- Molnar & Broadhurst (2018) Molnar, S. M. &Broadhurst, T., 2018, ApJ, 862, 112
- Moura et al. (2021) Moura, M. T., Machado, R. E. G. & Monteiro-Oliveira, R., 2021, MNRAS, 500, 1858
- Nagai et al. (2007) Nagai, D., Kravtsov, A. V. & Vikhlinin, A., 2007, ApJ, 668, 1
- Newman et al. (2013) Newman, A.B., Treu, T.. Ellis, R.S. & Sand, D.J., 2013, ApJ, 765, 25
- Ng et al. (2015) Ng, K. Y., Dawson, W. A., Wittman, D. et al., 2015, MNRAS, 453, 1531
- Poole et al. (2006) Poole, G. B., Fardal, M. A., Babul, A., et al., 2006, MNRAS, 373, 881
- Poole et al. (2008) Poole, G. B., Babul, A., McCarthy, I. G., Sanderson, A. J. R. & Fardal, M. A., 2008, MNRAS, 391, 1163
- Power et al. (2003) Power, C., Navarro, J. F., Jenkins, A. et al, 2003, MNRAS, 338, 14
- Price (2012) Price, D. J., 2012, J. Comp. Phys., 231, 759
- Ragozzine et al. (2012) Ragozzine, B., Clowe, D., Markevitch, M., Gonzalez, A. H. & Bradač, M., 2012, ApJ, 744, 94
- Randall et al. (2008) Randall, S. W., Markevitch, M, Clowe, D., Gonzalez, A. H. & Bradač, M., 2008, ApJ, 679, 1173
- Ricker (1998) Ricker, P. M., 1998, ApJ, 496, 670
- Ricker & Sarazin (2001) Ricker, P. M. & Sarazin, C. L., 2001, ApJ, 561, 621
- Ritchie & Thomas (2002) Ritchie, B. W. & Thomas, P. A., 2002, MNRAS, 329, 675
- Robertson et al. (2015) Robertson, A., Massey, R., Eke, V. & Bower, R., 2015, MNRAS, 453, 2267
- Robertson et al. (2017) Robertson, A., Massey, R. & Eke, V., 2017, MNRAS, 465, 569
- Robertson et al. (2017b) Robertson, A., Massey, R. & Eke, V., 2017b, MNRAS, 467, 4719
- Robertson et al. (2019) Robertson, A., Harvey, D., Massey, R. et al., 2019, MNRAS, 488, 3646
- Roediger et al. (2012) Roediger, E., Lovisari, L., Dupke, R. et al., 2012, MNRAS, 420, 3632
- Roediger et al. (2013) Roediger, E., Kraft, R. P., Forman, W. R., Nulsen, P. E. J. & Churazov, E., 2013, ApJ, 764, 60
- Roettiger et al. (1996) Roettiger, K., Burns, J. O. & Loken, C., 1996, ApJ, 473, 651
- Russell et al. (2010) Russell, H. R., Sanders, J. S., Fabian, A. C., et al., 2010, MNRAS, 406, 1721
- Ruszkowski & Oh (2010) Ruszkowski, M. & Oh, S. P., 2010, ApJ, 713, 1332
- Sarazin (2002) Sarazin, C. L., 2002, Astrophysics and Space Science Library, 272 , 1, Feretti, L., Gioia, I. M. and Giovannini, G. (eds), Kluwer Academic Publishers
- Schmidt et al. (2017) Schmidt, W., Byrohl, C., Engels, J. F., Behrens, C. & Niemeyer, J. C., 2017, MNRAS, 470, 142
- Sheardown et al. (2018) Sheardown, A., Roediger, E., Su, Y. et al., 2018, ApJ, 865, 118
- Sheardown et al. (2019) Sheardown, A., Fish, T. M., Roediger, E., et al., 2019, ApJ, 874, 112
- Shen et al. (2003) Shen, S., Mo, H. J., White, S. D. M. et al., 2003, MNRAS, 343, 978
- Shen et al. (2022) Shen, X., Brinckmann, T., Rapetti, D. et al., 2022, MNRAS, 516, 1302
- Springel (2005) Springel, V., 2005, MNRAS, 364, 1105
- Springel (2005) Springel, V., Di Matteo, T. & Hernquist, L. 2005, MNRAS, 361, 776
- Springel & Farrar (2007) Springel, V. & Farrar, G. R., 2007, MNRAS, 380, 911
- Tulin & Yu (2018) Tulin, S. & Yu, H.-B., 2018, Phys. Rep., 730, 1
- Umetsu (2020) Umetsu, K., 2020, Astron Astrophys Rev 28, 7
- Valdarnini (2006) Valdarnini, R., 2006, New Astronomy, 12, 71
- Valdarnini (2016) Valdarnini, R., 2016, ApJ, 831, 103
- Valdarnini (2019) Valdarnini, R., 2019, ApJ, 874, 42
- Valdarnini & Sarazin (2021) Valdarnini, R. & Sarazin, C. L., 2021, MNRAS, 504, 5409
- van den Bosch et al. (2005) van den Bosch, F. C., Weinmann, S. M., Yang, X., 2005, MNRAS, 361, 1203
- Vikhlinin et al. (2006) Vikhlinin, A., Kravtsov, A., Forman, W., Jones, C., Markevitch, M., Murray, S. S. & Van Speybroeck, L., 2006, ApJ, 640, 691
- Vogelsberger et al. (2012) Vogelsberger, M., Zavala, J. & Loeb, A., 2012, MNRAS, 423, 3740
- Vogelsberger et al. (2019) Vogelsberger, M., Zavala, J., Schutz, K. & Slatyer, T. R., 2019, MNRAS, 484, 5437
- Voit (2005) Voit, G.M. 2005, RMP, 77, 207
- van Weeren et al. (2011) van Weeren, R. J., Brüggen, M., Röttgering, H. J. A. & Hoeft, M., 2011, MNRAS, 418, 230
- Wittman et al. (2018) Wittman, D., Golovich, N. & Dawson, W. A., ApJ, 869, 10
- Zhang et al. (2014) Zhang, C., Yu, Q. & Lu, Y., 2014, ApJ, 796, 138
- Zhang et al. (2015) Zhang, C., Yu, Q. & Lu, Y., 2015, ApJ, 813, 129 (ZYL15)
- Zhang et al. (2018) Zhang, C., Yu, Q. & Lu, Y., 2018, ApJ, 855, 36
- Zhao et al. (2004) Zhao, P., Jerius, D. H., Edgar, R. J. et al., 2004, Proc SPIE, 5165, 482
- Zitrin et al. (2012) Zitrin, A., Bartelmann, M., Umetsu, K., Oguri, M. & Broadhurst, T., 2012, MNRAS, 426, 2944
- Zitrin et al. (2013) Zitrin, A., Menanteau, F., Hughes, J. P. et al., 2013, ApJ, 770, L15
- ZuHone et al. (2009) ZuHone, J. A., Ricker, P. M., Lamb, D. Q. & Karen Yang, H. -Y., 2009, ApJ, 699, 1004
- ZuHone et al. (2010) ZuHone, J. A., Markevitch, M. & Johnson, R. E., 2010, ApJ, 717, 908
- ZuHone (2011) ZuHone, J. A., 2011, ApJ, 728, 54
- ZuHone et al. (2013) ZuHone, J. A., Markevitch, M., Ruszkowski, M. & Lee, D., 2013, ApJ, 762, 69
- ZuHone et al. (2015) ZuHone, J. A., Kunz, M. W., Markevitch, M., Stone, J. M. & Biffi, V., 2015, ApJ, 798, 90
- ZuHone & Roediger (2016) ZuHone, J. A. & Roediger, E., 2016, Journal of Plasma Physics, 82, 535820301
- ZuHone et al. (2019) ZuHone, J. A., Zavala, J. & Vogelsberger, M., 2019, ApJ, 882, 119